Embed Size (px)
Citation preview

1
SUPPLEMENTARY MATERIALS
An urban systems framework to assess the trans-boundary food-energy-water nexus: implementation in Delhi, India
Anu Ramaswami,1* Dana Boyer,1 Ajay Singh Nagpure,1 Andrew Fang,1 Shelly Bogra,2 Bhavik
Bakshi,3 Elliot Cohen,4 Ashish Rao-Ghorpade5
* Corresponding author, [email protected] 1Humphrey School of Public Affairs, University of Minnesota, 301 19th Ave S, Minneapolis, MN, 55404 USA 2TERI University, Plot No. 10 Institutional Area Vasant Kunj, New Delhi - 110 070, India 3 Lowrie Dept. of Chemical and Biomolecular Engineering, The Ohio State University, 151 West Woodruff Avenue, Columbus, OH 43210, USA 4Tendril Energy, 2580 55th St #100, Boulder, CO 80301, USA 5ICLEI South Asia, Ground Floor, NSIC-STP Complex, NSIC Bhawan, Okhla Industrial Estate, New Delhi - 110020, India

2
This paper accomplishes two things: 1) Connects community-wide demand for FEW with
transboundary production via supply chain informed footprinting that captures the features of
regional production; 2) Explores in-boundary FEW interactions. The two parts of the SI provide
supplementary detail on these two topics, organized as:
SI-1. Environmental footprinting of community-wide FEW provisioning
SI-2. Evaluating the in-boundary FEW nexus
SI-1 Environmental footprinting of community-wide FEW provisioning
The general calculations for the total Community-wide Consumptive Water Loss, Water
Withdrawal and GHG Footprints of FEW provision (WCLF, WWF, GHGFFEW infrastructure provision,
respectively) are explained by Equations S-1, S-2, and S-3, respectively, where MEFAuse,,i
represents the direct material energy flow demand of electricity, fuels, food or water used in the
city, and IF the supply chain informed resource intensity factor (or pollution emission intensity
factor, e.g. GHG) of producing that sector, i. IB and TB indicate in- and trans-boundary
contributions, respectively.
!"#$%&'()*+(,-+,(.0(12%*%1& = 45$6789% ∗ (<$%,>?,0(1@,-+%1&ABCDB,-1&*,E0+%2.F1** + <$%,>?,,*.
AB,-1&*,E0+%2.F1**% ) (S-1)
!!$%&'()*+(,-+,(.0(12%*%1& = 45$6789% ∗ (<$%,I,0(1@,-+%1&ABCDB,J%+K@()J)F + <$%,%,I,,*.
AB,J%+K@()J)F% ) (S-2)
LML$NOI%&'()*+(,-+,(.0(12%*%1& = 45$6789% ∗ (<$%,0(1@,-+%1&ABCDB,PQP + <$%,%,,*.AB,PQP)% (S-3)
The footprinting is accomplished in five steps, where we quantify the following:
A. Community-wide FEW demand (material flows) for Delhi
B. Uncertainty in community-wide FEW estimation
C. Local versus trans-boundary production
D. Supply chains of transboundary FEW supply to Delhi
3
E. Supply chain informed resource (pollution) intensity factors
The parameters quantified above, enable developing the coupled water, energy, GHG footprint
as shown in Figure 4 of the main text. ‘Trans-boundary’ refers to activity (impact, production
etc) that occurs beyond the geographical city boundary, while the terms ‘in-boundary’ and
‘local’ refer to being within the geographical city
A. Community-wide FEW demand (material flows) for Delhi
Total community-wide food, electricity, water and fuel use for Delhi are computed based on the
methods summarized below.
Community wide food use includes resident, visitor, and industrial food use.
• Residential use by mass was estimated by adding all agri-food types from the National
Sample Survey in Delhi as average per capita food use (by mass) in 12 socio-economic
strata (SES), multiplied by the population in each of the 12 SES categories (Ministry of
Statistics and Programme Implementation 2011). This yielded a residential food mass of
6.1 million tons.
• Visitor food use was estimated from data of annual Delhi visitors from the Ministry of
Tourism, (2010) reporting number of visitors and average trip duration. This was
multiplied by an estimated average three meals per day and meal weight. Meal weight
was estimated as an average of the range 0.4-0.74 kg per meal as determined by bottom
up and town down estimations (determined by author calculation and the FAO (2011)
Food Balance Sheet). This yielded, a total of 61,121 tons, making a much smaller (<1%)
contribution than residential food use.
• Industrial food was estimated from data on industry output reported in the Annual Survey
of Industries (DES, 2010). GDP output to mass of food (tons) was converted using data
on consumer expenditure data that provides expenditure and tons of processed food
consumed. Industry output that exceeded processed food consumed by residents and
visitors was assumed exported, a likely scenario given that Delhi has >100 food related
industries. The agri-inputs to industry are assumed the same as homes. Industrial agri-

4
food use was computed to be 518,420 tons and is also relatively small (<8%) compared
to residential food use.
• The total community-wide direct food demand was 6.7 million tons, to which was
applied a factor of 35% of pre-consumer (as determined by review of India-specific
wastage studies; (Basavaraja et al 2007, Gauraha, AK Thakur 2008, Kumar et al 2005,
Sharma and Singh 2011, Gustavsson et al 2011)) to assess the quantity of agri-food
production needed to serve Delhi’s demand. This resulted in a total of 9 million tons of
agri-food production needed for Delhi’s food inputs.
Community-wide electricity use was obtained from at-scale community-wide electricity use data
from two different sources, the Delhi Statistical Handbook (DES 2013a) and electricity dispatch
data (Delhi Transco Limited 2014) which report 33,390 GWh and 25,893 GWh, respectively.
Electricity dispatch data reports the electricity consumed in Delhi, while the statistical handbook
reports electricity generated; the difference likely lies in transmission and distribution losses as
well as electricity theft, estimates of which range from 20 to 50% (NBR 2014, TERI 2000,
Bloomberg 2014). We used at-scale community-wide electricity use data reported by Delhi’s
Statistical Handbook (DES 2013a), as has been done in prior energy-use studies at the city-scale
(e.g. Toronto, Denver, Delhi (Kennedy et al 2009, Hillman and Ramaswami 2010, Chavez et al
2012)). The residential electricity use of 10,396 GWh obtained from the statistical handbook
(DES 2013a) was consistent (+/- 10%) with the residential electricity computed independently
from the household surveys (MSPI 2011) of 9,380 GWh; providing confidence in the data set.
Community-wide fuel use such as LPG, petrol, and diesel is reported by the Delhi Statistical
Handbook from which the residential component was estimated from the National Sample
Survey, (DES, 2013a; Ministry of Statistics and Programme Implementation, 2011) to provide
the split by household use.
Community-wide direct water use is reported by the Economic Survey of Delhi (2013), as 1,891
million m3 of domestic water supply of which 14% is supplied locally from groundwater as
estimated by the Central Groundwater Board (CGWB 2012), with the remaining 86% sourced
from the Yamuna River, Ganges River and Bhakra Storage (Comptroller and Auditor General of

5
India 2013). The water use was allocated to residential and commercial combined, and industrial
based on reports from the Delhi Government as described in Table S-1.
Table S-1. Total community-wide FEW use in Delhi and its distribution across, residential, commercial, and industrial sectors and the percentage of demand met locally. This table is informed by SI Sections A, B, C. This also informs Figure 4a of the main text.
FEW resource Total Residential Commercial Industrial Other
% produced
locally Data Sources
Food 9 (million t) 86% 7%* 7% N/A 10%
(DES, 2010; Ministry of
Tourism, 2010; MSPI, 2011)
Electricity 33,000 (GWh) 47% 29% 14% 10% 24% (DES, 2013a)
Water 1,704
(million m3)
77% 15% 8% (irrigation) 14% (DES, 2013b)
Fuels – transport
169,085 (TJ) 1% <1% 5% 94% 0%
(DES, 2013a; MSPI, 2011) Fuels –
non transport
36,964 (TJ) 70% 30% 0% 0% 0%
*Commercial food use = resident food outside home (6%) + visitor use (1%)
B. Uncertainty in community-wide FEW estimation
Community-wide electricity and water use are obtained from at-scale data reported by city
utilities. The uncertainty of these data are unknown, however, utility data have been
conventionally used in scientific papers reporting on bottom-up urban metabolism (Kennedy et
al 2009, Baynes et al 2011). In this work, we use per capita and per household benchmarks to
confirm that the utility data are reasonable, as noted for electricity above.
Compared to electricity and water-use data reported by utilities, greater uncertainty can be
expected in estimating community-wide food use since these data are not reported in Delhi’s
statistical abstract. Community-wide food use includes household consumption, visitor

6
consumption and food use by industries of which residential consumption dominated. Household
food consumption was estimate from 937 consumer surveys conducted in Delhi by the National
Sample Survey (MSPI 2011). Residential food use is reported in both mass units and expenditure
units. Mass and expenditure showed good correlation, with R2 values of 0.95, 0.88, 0.83 (see
Figure S-1) for the largest food mass items of milk, wheat and rice, respectively, indicating
confidence in the survey data. Combined, the three food items, of milk, wheat and rice add up to
more than half of the total mass of food. Therefore, we use these items to quantify uncertainty in
scaling up the household consumption data from surveys to the population of Delhi.
Figure S-1. Scatterplots of reported mass (kg) versus expenditure (INR) per household as reported by the NSS for milk, rice and wheat.

7
Total food use is estimated from the National Sample Survey as average per capita food use (by
mass) in 12 socio-economic strata (SES), multiplied by the population in each of the 12 SES as
shown in Table S-2. The Government of Delhi has mapped its population into 12 SES fractiles,
and identifies the percentage of Delhi’s population (% populationSES,i) within each fractile based
on monthly per capita expenditure. The 937 surveys were sought from the 12 different
percentiles. As an example, Delhi’s total residential consumption of purchased rice is derived
from the consumer purchase data in each of the 12 fractiles, and is shown in Table S-2 as a
product of the estimated population mean of the rice consumption within each SES group and the
population of that SES group. The standard error (RS) of the population mean is computed from
the sample standard deviation (R) using Equation S-5 below, where n is the sample size,
representing the number of surveys in each fractile.
RS = TU& (S-4)
Table S-2. Uncertainty analysis for purchased rice consumed by SES.
Fractiles of SES
Delhi population in each fractile
Population average per capita rice consumption (kg)
Sample standard deviation (kg)
Number of samples
Standard error of distribution of the mean (kg)
Relative SE of distribution of the mean
Total Delhi rice consumed (ton)
Error in estimating total rice consumed
by SES (ton) (%)
5 820,989 16.6 17.8 23 3.7 22% 13,632 3,042 22% 10 820,989 17.1 16.2 37 2.7 16% 14,009 2,188 16% 20 1,641,979 22.3 16.8 92 1.7 8% 36,536 2,873 8% 30 1,641,979 22.2 15.7 58 2.1 9% 36,411 3,382 9% 40 1,641,979 20.8 12.5 55 1.7 8% 34,114 2,761 8% 50 1,641,979 21.0 14.6 66 1.8 9% 34,538 2,945 9% 60 1,641,979 22.9 22.4 94 2.3 10% 37,683 3,795 10% 70 1,641,979 23.9 16.5 108 1.6 7% 39,184 2,611 7% 80 1,641,979 24.0 18.2 138 1.6 6% 39,424 2,548 6% 90 1,641,979 24.9 14.1 140 1.2 5% 40,843 1,951 5% 95 820,989 24.1 18.0 63 2.3 9% 19,758 1,862 9% 100 820,989 28.7 20.2 63 2.5 9% 23,547 2,091 9% Total 16,419,787 22.5 5.0 937 -- -- 369,680 32,049 9%
*population mean is estimated as the sample mean
8
Therefore, the total purchased rice consumed by Delhi by approach 2 is found to be 369,680 tons
with the error in estimation of 32,049 tons (+/- 9%). Applying the method of Table S-2 found
Delhi’s total food use of 6.1 tons, and error of +/- 10% across all food categories. Since the mass
of commercial and industrial agri-food inputs are very low in comparison to residential use, the
uncertainty (~10%) of the household food estimate dominates total food demand of Delhi.
C. Local versus trans-boundary production
Local food production within Delhi is provided by the Delhi Statistical Handbook (DES 2013a)
for grain and pulse crops, India Horticulture Database (NHB 2011) for some fruits and
vegetables, and Ministry of Agriculture (Ministry of Agriculture 2014) for dairy and meat items.
Local electricity generation is reported by the Delhi Statistical Handbook (DES, 2013a)
Local water supply that is extracted from groundwater is denoted as in-boundary and was
provided by Delhi Jal Board (Comptroller and Auditor General of India 2013) and from the
CGWB (2012).
Trans-boundary FEW quantities are then determined by the mass balance of total community
demand (as described in section B) minus local production. See Table S-1 for a summary.
D. Supply chains and Characteristics of Regional Production Systems Supply chain data for food, electricity, fuels and water supply to Delhi are derived from the
following sources.
• Supply chains of community-wide food to Delhi are estimated from the freight data that
provides inflows of various agri-products into the Delhi National Capital Region (NCR)
from all states of India – provided by the Total Transportation System Study on Traffic
Flows and Modal Costs, commissioned by the GOI Planning Commission (2011) and
reported in Table S-3 below. The authors commissioned work to the government agency
9
to extract the data relevant to our study. The authors then further analyzed this data to
determine the locations of production that matched Delhi’s demand.
• Supply chains of community-wide direct electricity to Delhi was apportioned to different
states based on Dispatch data and inter-state transfers reported by State Load Dispatch
Centre (Delhi Transco Limited 2014). Dispatch data are available at the individual power
plant level, and are aggregated at the State level and reported in Table S-3 below. The
fuel mix for power generation in each state is from CEA (2011). Knowledge of individual
power plants by fuel use and technology enables water intensity factors to be computed
based upon specific features of the generators serving Delhi.
• Supply chains of community-wide direct transportation fuel and LPG fuel were
determined by researcher Ajay Nagpure through personal communication with experts in
Delhi – who indicate Mathura, Paniput, Great Bombay, Mathinda and Sagar refineries to
be key supply chains for petro-fuels supply to Delhi. This information was verified with
the freight study.
• Supply of community-wide direct water is sourced 14% from ground water within Delhi
as reported by Jal (Water) Board (DES, 2013b) and the CGWB (2012) within the city. As
reported Jal Board, the remaining is sourced from the Yamuna River, Ganges River and
Bhakra Storage (Sutlej River).
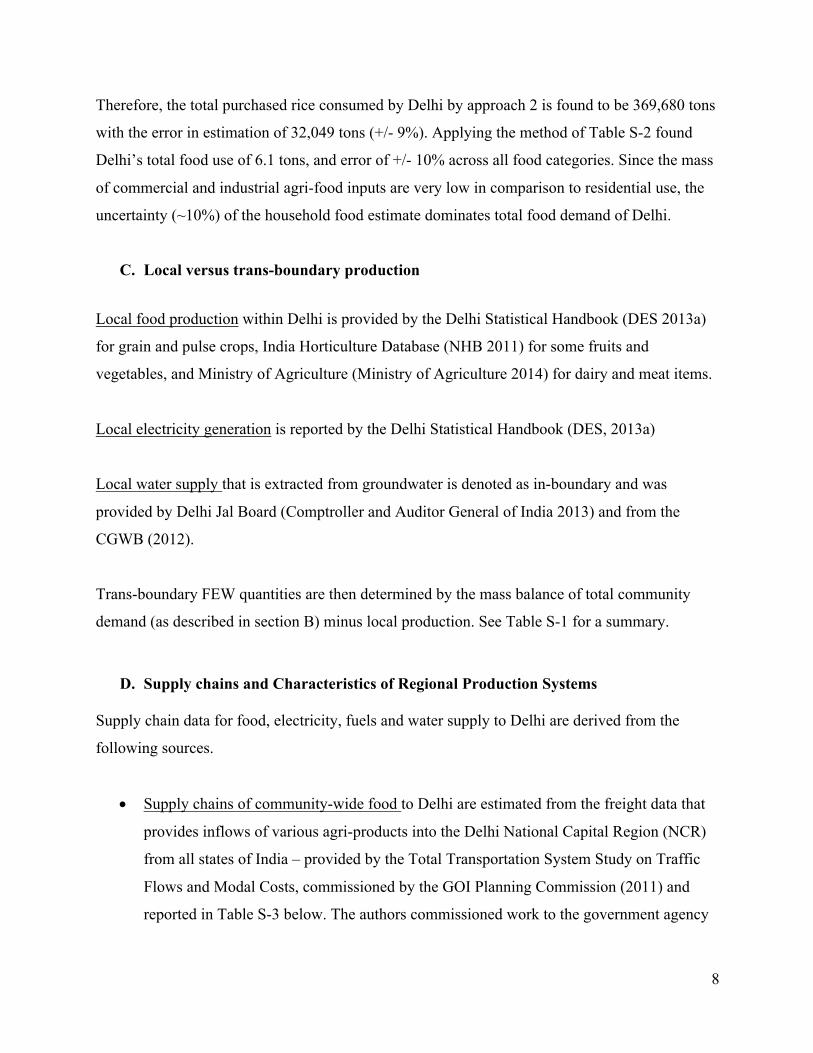
Delhi’s food and electricity demand are connected with the eight top producing states shown Table S-3. Table S-3. Connecting demand for food and electricity in Delhi to various production states, including local production are shown in columns 1-4. Features of the production states are shown in Columns 5-8.
Production state serving Delhi
Food imports to Delhi1
Total state agri-food production (tons)2
Gross annual average electricity intensity of irrigation (kWh/ t crop)3
Total state electricity generation (BU)4
Electricity imported to Delhi from each states in BU (% of Delhi demand)5
TOTAL Tons (% of Delhi’s demand met)
Detail on top food items being supplied per state
Imports to Delhi
Product
Tons (% of Delhi’s demand met)

10
Delhi (local production)
882,019 (10%)
Milk and products
479,630 (19%)
824,317 104* 8.0 8.0 (24%)
Fruits and vegetables
236,700 (12%)
Meat 42,467 (57%)
Rice 30,297 (5%)
Haryana
2,548,983 (28%)
Milk and products
898,228 (35%)
21,495,890 431 22.7 0.8 (2%)
Wheat 858,907 (48%)
Rice 287,235 (50%)
Fruit and vegetables
226,130 (12%)
Uttar Pradesh
2,053,246 (23%)
Milk and products
778,744 (31%)
182,415,201 48 30.2 14.3 (43%)
Fruits and vegetables
683,460 (36%)
Wheat 193,677 (11%)
Sugar 131,116 (21%)
Punjab 783,309 (9%)
Wheat 241,690 (14%)
29,787,150 344 30.0 0.0 (<1%)
Milk and products
180,529 (7%)
Fruits and vegetables
126,547 (32%)
Rice 125,760 (22%)
Rajasthan 719,870 (8%)
Fruits and vegetables
173,721 (9%)
22,950,459 657 36.7 0.9 (3%)
Milk and products
150,562 (6%)
Wheat 121,511 (7%)
Grams and pulses
56,940 (21%)
Madhya Pradesh
405,623 (4%)
Wheat 122,667 (7%)
Unavailable 104* 21.6 0.6 (2%)
Fruits and vegetables
113,211 (6%)
Grams and pulses
82,316 (30%)
Sugar 17,735 (3%)
Maharashtra 294,238 (3%)
Fruits and vegetables
155,030 (8%)
89,846,559 241 80.8 0.0 (<1%) Wheat 41,062
(2%) Grams 28,192

11
and pulses (10%)
Sugar 26,008 (4%)
Gujarat 245,673 (3%)
Fruits and vegetables
86,114 (5%)
23,610,995 591 69.8 0.0 (<1%)
Wheat 50,455 (3%)
Sugar 39,680 (6%)
Rice 11,544 (2%)
*National average used when data unavailable 1: Data from multi-modal freight survey, adjusted to 2011 (Planning Commission 2008) 2: State-wise production data from (DES, 2010a) 3:Calculated gross annual average as total agricultural electricity (Power and Energy Division of the Planning Commission 2014) divided by total state-wise production (DES, 2010a) 4: Total state generation is reported by CEA (2011); BU = Billion kWh 5: Electricity imports to Delhi reported by Delhi Transco Limited (2014)
The second order impacts were calculated from dividing the gross annual state-wise electricity
use for irrigation (as reported by the Government of India Power and Energy Division of the
Planning Commission (2014)) and diesel use for on-farm implements (as reported by (Nielsen
2013)) each by total state agricultural output in mass (Ministry of Agriculture 2010). This
provided a gross annual average electricity for irrigation and diesel requirement for nine states
serving Delhi’s food supply and an all-India average (see Table S-4). Table S-5 also shows
percentage of groundwater development (defined as the ratio of annual groundwater withdrawal
over groundwater recharge) as reported by Suhag (2016) to illustrate how groundwater overdraft
can correspond with increase electricity requirement for irrigation. The values of Table S-4
inform creation of Figure 2 of the main text. Table S-4. Gross annual averages of state specific diesel and electricity factors for agricultural production as well as percentage of groundwater develop (defined as the quantity of groundwater withdrawal divided by groundwater recharge). These values were used in the development of Figure 2 of the main text.
State L diesel fuel / t crop production
kWh elec./ton of food produced
Diesel CO2 e/ton crop
Elec CO2e/ton crop
% of GW development
Delhi local supply 12 21 32 16 137
Haryana 47 431 128 340 133
Uttar Pradesh 8 48 21 38 74
Punjab 33 344 89 272 172
Rajasthan 34 657 91 519 137
Maharashtra 4 241 10 190 53
Gujarat 11 591 30 467 67
12
Uttarakhand 11 37 28 30 57
West Bengal 4 28 11 22 40
All India average 23 104 61 82 62
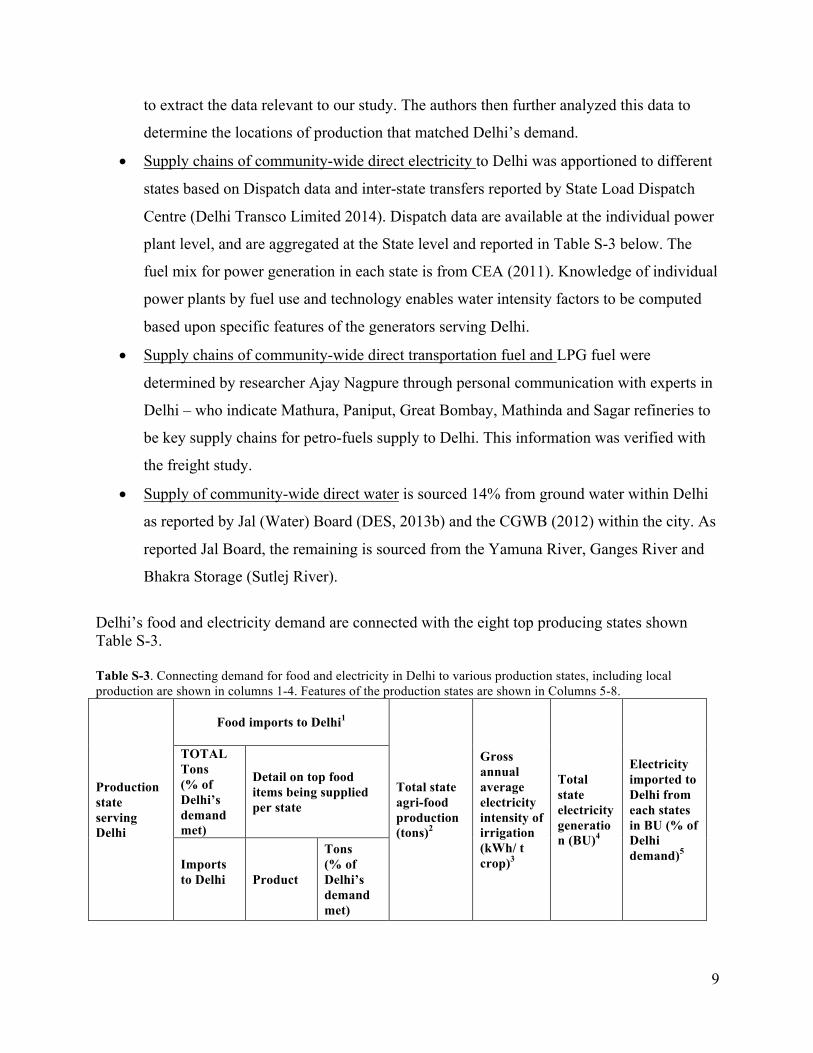
E. Supply chain informed resource (GHG) intensity factors
India average basic GHG, consumptive-water loss and water-withdrawal intensities for agri-food
production were sourced from Pathak et al (2010), Mekonnen and Hoekstra (2011), Bogra et al
(2016), respectively, shown in Table S-5. These values were augmented with production specific
features of each state relating to the second order impacts of diesel use for farm equipment and
electricity use for pumping, as described in Section D.
SI-2: Data sources and methods for evaluating the in-boundary FEW interactions The following Table S-6 describes the data used in the development of the in-boundary FEW
nexus as illustrated in Figure 6 of the main text (shown in terms of withdrawal) as well as SI
Figure S-2 (shown in terms of consumptive water loss).
Table S-5. Sources of India-average basic GHG and water intensity factors (IF) for footprinting.
Direct MEF Flow Item
GHG intensity factor & source
Water withdrawal intensity factor
Water consumptive loss intensity factor
Electricity
0.76 - 0.79 kg CO2e/kWh 250 - 35,000 gal water/MWh 50 - 4,491 gal water/MWh
(CEA, 2012) (Cohen, 2014; NETL, 2010) (Cohen, 2014; NETL, 2010)
Fuel 56,100-74,100 kg CO2e /TJ 5.25 L water/liter petroleum
based fuel (average) 5.25 L water/liter petroleum based fuel (average)
(IPCC, 2006) (Cohen 2014) (Cohen 2014)
Food
28 - 12,352 kg CO2e /t crop
Green: 0 – 24,889 m3/crop Blue: 0 – 4302 m3/crop
Green: 0 – 24,889 m3/crop Blue: 0 – 4302 m3/crop
(Pathak et al 2010), supplemented with author calculation for transport, on-farm diesel use, electricity for irrigation– See Table S-4
(Bogra et al 2016) (Mekonnen and Hoekstra 2011)
13
Total community-wide FEW use of Delhi estimated by the methods described of S-1, Section A.
Figure 6 (& S-2) illustrates the total direct community-wide energy and water use within Delhi
by the two central bar graphs. Calculating the percentage of total energy and water use for FEW
activities of: water for food, energy for food, water for energy, energy for water. Each of these
categories is comprised of Delhi specific sub-category interactions. For example, water for food
includes the activities of urban production, home preparation, commercial preparation, and
industrial processing, (see Table S-6 for all categories). Each of these sub-categories is estimated
based on an intensity factor of each of these activities multiplied by an activity parameter for
scale up, described by Equation S-5. Each category’s calculations inform the respective pie
charts of Figure 6 (& S-2)
Impact of sub-category activity = (Intensity Factor) x (Activity parameter for scale up) (S-5)

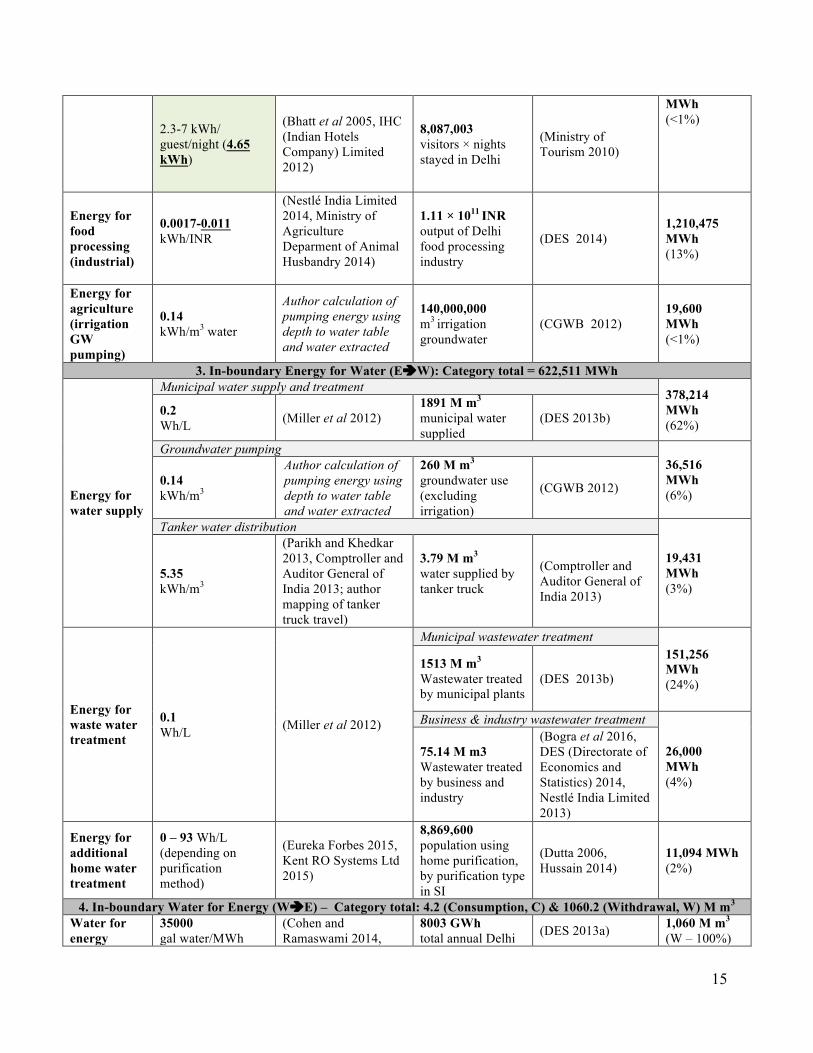
14
Table S-6. Data sources to estimate four categories (labeled 1 – 4) of water-energy flows associated with the FEW nexus within cities. Intensity factors are scaled by appropriate activity level and underlined/bolded value is the activity number used for calculation, (‘C’ = consumption; ‘W’ = withdrawal; energy and water in hotels includes only that used for food preparation and refrigeration). Green shaded boxes indicated inclusion in sensitivity analysis.
Interaction
Intensity factor Activity for scale up Subtotal and (% of
category total)
Intensity factor Data source Activity parameter Data source
1. In-boundary Water for Food (WèF): Category total = 461.5 (Consumptive loss, C) & 787.0 (Withdrawal, W) M m3
Water for growing agri-food
70 – 15,537 green m3/t crop, C (Crop specific C data
from Mekonnen and Hoekstra 2011))
1,303,600 tons in-boundary agri-food production, by specific crops noted in SI
(DES 2013a, NHB 2011, Ministry of Agriculture 2014)
351 M m3 (C - 77%) 0 - 2,779
blue m3/t crop, C 0 - 24,889 green m3/t crop, W (Crop-specific W data
from (Bogra et al 2016))
677 M m3 (W - 86%) 0 – 4,302
blue m3/t crop, W Water for cooking (residential)
2-10 L/person/day
(Gleick 1996, Howard and Bartram 2003)
16,000,000 × 365 Population × days (DES 2013a)
58 M m3 (C - 13%) (W - 7%)
Water for food preparation (Hotel and restaurant, commercial)
Restaurant 44 M m3
(C - 10%) (W - 6%)
16 m3/seat/year (DPCC 2013)
2,732,603 restaurant seats in Delhi
(FHRAI 2012)
Hotel 1 M m3 (C - 0%) (W - 0%)
128 – 160 (144) L/guest/night
(DPCC 2013, EarthCheck 2013)
8,087,003 Delhi visitors × nights stayed
(Ministry of Tourism 2010)
Water for food processing (industrial)
0.034 L/INR
(Nestlé 2014, Nestlé India Limited 2014)
1.11 × 10¹¹ INR Output of Delhi food processing industry
(DES 2014) 4 M m3 (C - 1%) (W - 1%)
2. In-boundary Energy for Food (EèF): Category total = 7,588,788 MWh Energy for food use, (Residential: cooking)
1.25 - 1.97 MWh/household/yr
(de la Rue du Can et al 2009; author calculations)
3,340,538 households in Delhi
(DES 2013a) 7,963,241 MWh (68%)
Energy for in-boundary food transport
Assumed to be relatively small based on field observations of large numbers of non-motorized rickshaws and carts hauling agricultural products within the city from freight centers. To be verified in future work.
Energy for food preparation (commercial: restaurants, hotels)
Restaurant 2,421,120 MWh (18%)
0.57-3.5 kWh/meal (2 kWh/meal)
(Author calculation from hotel food prep energy use)
1,210,560,000 All – Delhi meals taken outside the home (restaurants, business, other)
(MSPI (Ministry of Statistics and Programme Implementation) 2011)
Hotel 37,605
15
2.3-7 kWh/ guest/night (4.65 kWh)
(Bhatt et al 2005, IHC (Indian Hotels Company) Limited 2012)
8,087,003 visitors × nights stayed in Delhi
(Ministry of Tourism 2010)
MWh (<1%)
Energy for food processing (industrial)
0.0017-0.011 kWh/INR
(Nestlé India Limited 2014, Ministry of Agriculture Deparment of Animal Husbandry 2014)
1.11 × 10¹¹ INR output of Delhi food processing industry
(DES 2014) 1,210,475 MWh (13%)
Energy for agriculture (irrigation GW pumping)
0.14 kWh/m3 water
Author calculation of pumping energy using depth to water table and water extracted
140,000,000 m3 irrigation groundwater
(CGWB 2012) 19,600 MWh (<1%)
3. In-boundary Energy for Water (EèW): Category total = 622,511 MWh
Energy for water supply
Municipal water supply and treatment 378,214 MWh (62%)
0.2 Wh/L (Miller et al 2012)
1891 M m3
municipal water supplied
(DES 2013b)
Groundwater pumping 36,516 MWh (6%)
0.14 kWh/m3
Author calculation of pumping energy using depth to water table and water extracted
260 M m3
groundwater use (excluding irrigation)
(CGWB 2012)
Tanker water distribution
19,431 MWh (3%)
5.35 kWh/m3
(Parikh and Khedkar 2013, Comptroller and Auditor General of India 2013; author mapping of tanker truck travel)
3.79 M m3 water supplied by tanker truck
(Comptroller and Auditor General of India 2013)
Energy for waste water treatment
0.1 Wh/L (Miller et al 2012)
Municipal wastewater treatment 151,256 MWh (24%)
1513 M m3
Wastewater treated by municipal plants
(DES 2013b)
Business & industry wastewater treatment
26,000 MWh (4%)
75.14 M m3 Wastewater treated by business and industry
(Bogra et al 2016, DES (Directorate of Economics and Statistics) 2014, Nestlé India Limited 2013)
Energy for additional home water treatment
0 – 93 Wh/L (depending on purification method)
(Eureka Forbes 2015, Kent RO Systems Ltd 2015)
8,869,600 population using home purification, by purification type in SI
(Dutta 2006, Hussain 2014)
11,094 MWh (2%)
4. In-boundary Water for Energy (WèE) – Category total: 4.2 (Consumption, C) & 1060.2 (Withdrawal, W) M m3 Water for energy
35000 gal water/MWh
(Cohen and Ramaswami 2014,
8003 GWh total annual Delhi (DES 2013a) 1,060 M m3
(W – 100%)

16
supply (excluding residential)
(W) Macknick et al 2011, Meldrum et al 2013)
electricity use 140 gal water/MWh (C)
4 M m3 (C - 100%)
Water for household evaporative cooling
4.8 gal water/unit/year
Author calculation based on household cooling use and equipment water use
4,123,199 units (World Bank 2008) 75 M m3
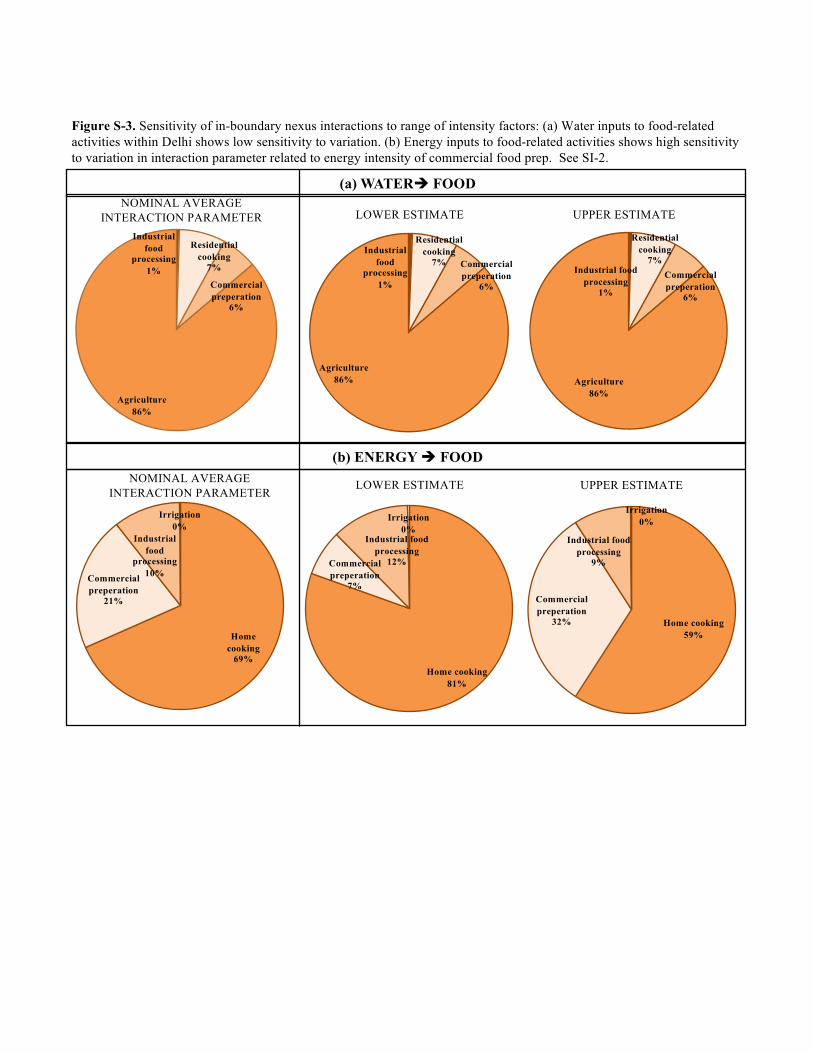
Sensitivity analysis of in-boundary FEW interactions
Because the data of Table S-6 are derived from diverse sources, we conducted an analysis to
understand the sensitivity of the in-boundary nexus to the range of available intensity factors. In
estimating the in-boundary FEW interactions, the authors compiled a range of possible intensity
factors whenever possible and compared with available international benchmarks to assess the
reasonable-ness of the numbers, given the newness of the field. The ranges are listed as
numerical ranges in column 2 of Table S-6, with the underlined value indicating the value used
for calculation. The underlined value was chosen based on it being derived from or applicable to
the Delhi/India context. The following is a rationale for each choice:
Interaction Rationale for value selection
Water for cooking
food/drinking - Upper range chosen due to hot climate of Delhi
Energy for residential cooking - At scale data reported for Delhi
Energy for food processing - India specific value
Water for food processing - India specific value
In some relationships (water and energy for commercial food preparation), where there existed
little past study and guidance on selection of a reasonable intensity factors, the average value was
chosen from the range of possible values. The main text also notes the lack of data availability
and prior study in quantifying the water and energy for commercial food preparation both in
India and globally. These intensity factors are illustrated with green shading in Table S-4. For
these intensity factors, where an average was used as the nominal value in the main manuscript,
but no guidance was available to inform the choice, we conducted a sensitivity analysis. We
assessed if our conclusions changed when we applied the high and low values in comparison to
the average. Such a sensitivity analysis (see Figure S-3) showed the only parameter that

17
significantly altered our conclusion was energy for food, which we indicate in the main text to be
a parameter where the data gap is most critical.

ENERGY
Water1%
Other84%
Food
Food15%
Energy for food Water for foodIN-BOUNDARY USE
Energy for water Water for energy
WATER
Home cooking 73%
Industrial food processing 11%
Irrigation <1%
Commercial preparation 16%
Figure S-2. (Modified Figure 6 from main text). Analysis of in-boundary FEW interactions in Delhi, India. Bar charts show the total direct community-wide water and energy demand of Delhi. Pie charts show the total water and energy demand of Delhi attributable to FEW related activities. The following four interactions are shown: (energy for water; water for food; energy for water; energy for food). The conversion of food and wastewater to energy is minimal in Delhi and hence not shown. Italics indicate interactions with data gaps, estimated via national benchmarks. Water demand is shown in terms of consumptive use. (Ind. = Industrial; Com = Commercial; WW = Wastewater; Muni. = Municipal); (See SI-2 Table S-6).
Tanker truck supply 3%
Ind./com. WW treatment 1%
Muni. treatment and supply 63%
GW pumping
6%
Home remediation
2%
Food26%
Other73%
Energy<1%
Muni. WW treatment
25%
Residential evaporative
cooling95%
Electricity supply
5%
Agriculture 76%
Commercial preparation
10%
Residential cooking 13%
Industrial food
processing 1%
Home cooking81%
Commercial preperation
7%
Industrial food processing
12%
Irrigation0%
Industrial food
processing1%
Residential cooking
7% Commercial preperation
6%
Agriculture86%
Industrial food
processing1%
Residential cooking
7%
Commercial preperation
6%
Agriculture86%
Industrial food processing
1%
Residential cooking
7%Commercial preperation
6%
Agriculture86%
(a) WATERè FOOD
(b) ENERGY è FOOD
Home cooking
69%
Commercial preperation
21%
Industrial food
processing10%
Irrigation0%
Home cooking59%
Commercial preperation
32%
Industrial food processing
9%
Irrigation0%
Figure S-3. Sensitivity of in-boundary nexus interactions to range of intensity factors: (a) Water inputs to food-related activities within Delhi shows low sensitivity to variation. (b) Energy inputs to food-related activities shows high sensitivity to variation in interaction parameter related to energy intensity of commercial food prep. See SI-2.
NOMINAL AVERAGE INTERACTION PARAMETER LOWER ESTIMATE UPPER ESTIMATE
LOWER ESTIMATE UPPER ESTIMATENOMINAL AVERAGE INTERACTION PARAMETER

18
References Basavaraja H, Mahajanashetti S B and Udagatti N C 2007 Economic Analysis of Post-harvest
Losses in Food Grains in India : A Case Study of Karnataka 20 117–26 Baynes T, Lenzen M and Steinberger J K 2011 Comparison of Consumption and Production
Approaches to Assessing Urban Energy Use and Implications for Policy Energy Policy 39 Bhatt M S, Rajkumar N, Jothibasu S, Sudirkumar R, Pandian G and Nair K R C 2005
Commercial and residential building energy labeling J. Sci. Ind. Res. (India). 64 30–4 Bogra S, Bakshi B R and Mathur R 2016 A Water-Extended Input-Output Model of the Indian
Economy Environ. Sci. Technol. 50 (3) 1313–1321 CEA (Central Electricity Authority) 2012 CO2 Baseline Database for the Indian Power Sector
(Delhi) Online: http://cea.nic.in/reports/others/thermal/tpece/cdm_co2/user_guide_ver9.pdf CEA (Central Electricity Authority) 2011 Power Supply Monthly Reports – Power Allocation
from the Central Sector (Delhi) Online: http://www.cea.nic.in/monthlypowersupply.html CGWB (Central Ground Water Board) 2012 Ground Water Year Book 2011-12 (Faridabad)
Online: http://www.cgwb.gov.in/ Chavez A, Ramaswami A, Nath D, Guru R and Kumar E 2012 Implementing Trans-Boundary
Infrastructure-Based Greenhouse Gas Accounting for Delhi, India J. Ind. Ecol. 16 814–28 Cohen E 2014 The water footprint of urban energy systems: Concepts, methods and applications
for assessing electricity supply risk factors (University of Colorado, Denver) Cohen E and Ramaswami A 2014 The Water Withdrawal Footprint of Energy Supply to Cities:
Conceptual Development and Application to Denver, Colorado, USA J. Ind. Ecol. 18 26–39 Comptroller and Auditor General of India 2013 Thematic Audit of Water Management in Delhi
(Delhi) Online: http://www.cag.gov.in/ Delhi Transco Limited 2014 Annual Report 2013-14 (Delhi) Online: http://dtl.gov.in/ DES (Directorate of Economics and Statistics) 2013a Delhi Statistical Hand Book (Delhi)
Online: http://www.delhi.gov.in/wps/wcm/connect/DOIT_DES/des/home/ DES (Directorate of Economics and Statistics) 2013b Economic Survey of Delhi 2012-13 (Delhi)
Online: http://www.delhi.gov.in/wps/wcm/connect/DOIT_DES/des/home/ DES (Directorate of Economics and Statistics) 2010a Production of Commercial Crops (Delhi)
Online: http://www.delhi.gov.in/wps/wcm/connect/DOIT_DES/des/home/ DES (Directorate of Economics and Statistics) 2010b Report on Annual Survey of Industries
(Delhi) Online: http://www.delhi.gov.in/wps/wcm/connect/DOIT_DES/des/home/ DES (Directorate of Economics and Statistics) 2014 Report on annual survey of industries 2011-
12 (Delhi) Online: http://www.delhi.gov.in/wps/wcm/connect/DOIT_DES/des/home/ DPCC (Delhi Pollution Control Committee) 2013 Commercial and Industrial water use (Delhi)
Online: https://dpcc.delhigovt.nic.in/ Dutta V 2006 Preference heterogeneity , public choice and willingness to pay : study of water
supply reform in a mega city (TERI University) EarthCheck Research Institute 2013 White Paper on Tourism and Water (Queensland, Australia)
Online: http://www.sustainabletourismonline.com/awms/Upload/PORTAL MICROSITES/YEAR OF WATER/EarthCheck_Water_2013.pdf
Eureka Forbes 2015 Aquaguard Enhance UV + UF Technical Specifications Online: http://www.eurekaforbes.com/Product/Water-Purifiers/Aquaguard/UV/Aquaguard-

19
Enhance-Uv-Uf?pid=8 FAO (United Nations Food and Agriculture Association) 2011 India Food Balance Sheet Online:
http://faostat3.fao.org/download/FB/FBS/E FHRAI (Federation of Hotel & Restaurant Association of India) 2012 Indian Hotel Industry
Survey 2011-2012 (New Delhi) Online: http://www.fhrai.com/ Gauraha, AK Thakur B 2008 Comparative economic analysis of post-harvest losses in
vegetables and foodgrains crops in Chhattisgarh Indian J. Agric. Econ. 63 376 Gleick P H 1996 Basic Water Requirements for Human Activities: Meeting Basic Needs Water
Int. 21 83–92 Gustavsson J, Cederberg C, Sonesson U, van Otterdijk R and Meybeck A 2011 Global food
losses and food waste: extent, causes and prevention Online: http://www.fao.org/fileadmin/user_upload/ags/publications/GFL_web.pdf
Hillman T and Ramaswami A 2010 Greenhouse Gas Emission Footprints and Energy Use Benchmarks for Eight US Cities Environ. Sci. Technol. 44 1902–10
Howard G and Bartram J 2003 Domestic Water Quantity , Service Level and Health (Geneva, Switzerland) Online: http://www.who.int/water_sanitation_health/diseases/wsh0302/en/
Hussain S 2014 Can Kent RO Win the Water War? Forbes India Online: http://www.forbesindia.com/article/big-bet/can-kent-ro-win-the-water-war/37916/1
IHC (Indian Hotels Company) Limited 2012 Communication on Sustainability Progress 2011-2012 Online: https://www.tajhotels.com/en-in/about-taj-group/who-we-are/our-company/sustainability/
IPCC (Intergovernmental Panel on Climate Change) 2006 IPCC Guidelines for National Greenhouse Gas Inventories 2006 Online: http://www.ipcc-nggip.iges.or.jp/public/2006gl/
Kennedy C, Steinberger J, Gasson B, Hansen Y, Hillman T, Havránek M, Pataki D, Phdungsilp A, Ramaswami A and Villalba Mendez G 2009 Greenhouse gas emissions from global cities. Environ. Sci. Technol. 43 7297–302
Kent RO Systems Ltd 2015 Kent Grand Technical Specifications Online: https://www.kent.co.in/pdf/Kent_Grand.pdf
Kumar V, Sharma H R and Singh K 2005 Behaviour of Market Arrivals and Prices of Selected Vegetable Crops : A Study of Four Metropolitan Markets 18 271–90
de la Rue du Can S, Letschert V, Mcneil M, Zhou N and Sathaye J 2009 Residential and Transport Energy Use in India: Past Trend and Future Outlook Online: https://ies.lbl.gov/sites/all/files/lbnl-1753e_1.pdf
Macknick J, Newmark R, Heath G and Hallett K 2011 A review of operational water consumption and withdrawal factors for electricity generating technologies Online: http://iopscience.iop.org.lib-ezproxy.tamu.edu:2048/1748-9326/7/4/045802/article/
Mekonnen M M and Hoekstra A Y 2011 National water footprint accounts: the green, blue and grey water footprint of production and consumption (Delft, The Netherlands) Online: http://waterfootprint.org/en/
Meldrum J, Nettles-Anderson S, Heath G and Macknick J 2013 Life cycle water use for photovoltaic electricity generation: a review and harmonization of literature estimates Environ. Res. Lett. 8
Miller L A, Ramaswami A, M.ASCE and Ranjan R 2012 Contribution of Water and Wastewater Infrastructures to Urban Energy Metabolism and Greenhouse Gas Emissions in Cities in India J. Environ. Eng. 139 738–45
Ministry of Agriculture 2010 Crop Production Statistics for the Year 2010-11 (Delhi) Online:
20
http://www.dacnet.nic.in/ Ministry of Agriculture Deparment of Animal Husbandry Dairying and Fishery 2014 Basic
Animal Husbandry & Fisheries Statistics (New Delhi) Online: dahd.nic.in/ Ministry of Tourism 2010 Tourism survey in the State of Delhi Annual Final Report (Delhi)
Online: http://tourism.gov.in/sites/default/files/Other/Delhi_0.pdf MSPI (Ministry of Statistics and Programme Implementation) 2011 National Sample Survey
(Delhi) Online: http://www.mospi.gov.in/ Nestlé 2014 Nestlé in society: creating shared value annual report 2014 (Vevey, Switzerland)
Online: http://www.nestle.com/aboutus/mediavideos/nestle-in-society-creating-shared-value-meeting-our-commitments
Nestlé India Limited 2013 Annual Report (New Delhi) Online: https://www.nestle.in/investors/stockandfinancials/annualreports
Nestlé India Limited 2014 Annual Report (New Delhi) Online: https://www.nestle.in/investors/stockandfinancials/annualreports
NETL (National Energy Technology Laboratory) 2010 Estimating Freshwater Needs to Meet Future Thermoelectric Generation Requirements: 2010 Update Online: http://www.netl.doe.gov/energy-analyses/pubs/2010_Water_Needs_Analysis.pdf
NHB (National Horticulture Board) 2011 Indian Horticulture Database (Delhi, India) Nielsen 2013 All India Study on Sectoral Demand of Diesel & Petrol 104 Online:
http://ppac.org.in/WriteReadData/Reports/201411110329450069740AllIndiaStudyonSectoralDemandofDiesel.pdf
Parikh J and Khedkar G 2013 The Impacts of Diesel Price Increases on India’s Trucking Industry (Geneva, Switzerland) Online: http://www.irade.org/ffs_india_transport_policy_brief.pdf
Pathak H, Jain N, Bhatia a., Patel J and Aggarwal P K 2010a Carbon footprints of Indian food items Agric. Ecosyst. Environ. 139 66–73
Pathak H, Jain N, Bhatia A, Patel J and Aggarwal P K 2010b Carbon footprints of Indian food items Agric. Ecosyst. Environ. 139 66–73 Online: http://dx.doi.org/10.1016/j.agee.2010.07.002
Planning Commission G of I 2008 Total transport system study on traffic flows and modal costs (Delhi) Online: http://12thplan.gov.in/
Power and Energy Division of the Planning Commission 2014 Annual Report on the working of State Power Utilities & Electricity Departmets Online: http://xlink.rsc.org/?DOI=c1dt90165f
Sharma G and Singh S P 2011 Economic Analysis of Post-harvest Losses in Marketing of Vegetables in Uttarakhand Agric. Econ. Rev. Res. 24 309–15
World Bank 2008 Residential consumption of electricity in India: documentation of data and methodology Online: http://www.moef.nic.in/downloads/public-information/Residentialpowerconsumption.pdf


![9326 Digital 2U Node B[1]](https://img.pdfslide.us/doc/110x75/577cd0571a28ab9e7891fdd5/9326-digital-2u-node-b1.jpg)