Embed Size (px)
Citation preview

1
Supplementary Information
Tuning Hardness in Calcite by Incorporation of Amino Acids
Yi-Yeoun Kim1*, Joseph D. Carloni
2, Beatrice Demarchi
3, David Sparks
4, David G. Reid
5,
Miki E. Kunitake2, Chiu C. Tang
6, Melinda J. Duer
5, Colin L. Freeman
4, Boaz Pokroy
7,
Kirsty Penkman3, John H. Harding
4, Lara A. Estroff
2,8, Shefford P. Baker
2*
and Fiona C.
Meldrum1*
Content:
Supplementary methods
Supplementary notes 1-5
Supplementary figures 1-9
Supplementary tables 1-2
Supplementary equations 1-5
Supplementary references (1-37)

2
Supplementary Methods
Materials. CaCl2∙2H2O, (NH4)2CO3, sodium L-aspartate and glycine were purchased from
Sigma-Aldrich, while glycine (1-13C and 2-13C) and L-aspartic acid (3-13C and 1,4-13C
99%) were purchased from Cambridge Isotope Laboratories Inc. All chemicals were used
without further purification.
CaCO3 precipitation. The two amino acids, Asp and Gly, were mixed with 2 – 100 mM
aqueous solutions of CaCl2.2H2O to give amino acid concentrations of 0.001 – 100 mM Asp
and 0.1 - 400 mM Gly. 40 mL of the prepared solutions were transferred to plastic Petri
dishes (90 mm) containing glass slides, which had previously been cleaned with Piranha
solution (H2SO4 70 vol% H2O2 30 vol%), and CaCO3 was precipitated using the ammonium
carbonate diffusion method.1 This was achieved by covering the Petri dishes with Parafilm
pierced with multiple holes and placing them in a dessicator previously charged with 5 g of
freshly crushed (NH4)2CO3 powder. Crystallisation was then allowed to proceed for 2 days
(unless otherwise stated), after which time the glass slides were removed from solution,
washed thoroughly with Millipore water and ethanol, and oven-dried (40 oC) prior to further
characterization.
CaCO3 precipitation in the presence of 400 mM Gly took longer than 2 days; this was
the maximum concentration of Gly employed. In the case of Asp, a mixture of single crystal
and polycrystalline particles formed at Asp concentrations above 50 mM, and principally
polycrystalline particles formed above 100 mM Asp (Supplementary Fig. 1). The maximum
Asp concentration employed was therefore 50 mM. Investigation of the influence of the
initial Ca concentration in solution showed that while higher initial Ca concentrations favour
occlusion of the amino acids (Figs. 2c and 2d), they also drive the generation of

3
polycrystalline calcite at lower Asp concentrations (Supplementary Fig. 2). For example, at
an initial [Ca] = 25 mM, polycrystalline calcite was observed at 25 mM Asp (Supplementary
Fig. 3). An initial [Ca] = 10 mM was therefore chosen as the standard condition as this
offered efficient occlusion of the amino acids, while still retaining single crystallinity of
calcite upto wide range of amino acid concentration..
Calcite crystals were also precipitated in the presence of 13C-labelled Asp and Gly
such that they could be analyzed in Proton driven spin diffusion (PDSD) experiments to
determine the proximities of the occluded amino acids. Calcite/Asp crystals were
precipitated from solutions of concentrations [Ca2+
] = 10 mM and [1,4-13
C2 Asp] = [3-13
C
Asp] = 25 mM, while calcite/Gly crystals were precipitated from solutions of [Ca2+
] = 10 mM
and [1-13
C Gly] = [2-13
C Gly] = 100 mM.
Quantification of the incorporation of amino acids within calcite crystals. All calcite
samples were bleached in 12% w/v sodium hypochlorite for 48 hrs before analysis using 50
μL of hypochlorite per mg of calcite. This effectively removes surface-bound amino acids, as
demonstrated during the characterisation of biomolecules occluded within a range of
biominerals2-4
The amino acids were then extracted from the CaCO3 crystals by dissolving
them in cold 2 M HCl (using a minimum of 10 µL HCl per mg of calcite). The acid was then
evaporated and the samples rehydrated with an adequate volume of a rehydration fluid
containing 0.01 mM HCl, 0.77 mM sodium azide at pH 2, and an internal standard (0.01 mM
L-homo-arginine). The rehydrated samples were analyzed for chiral amino acids on an
automated reverse-phase high-performance liquid chromatography (RP-HPLC) system
equipped with a fluorescence detector, using a modification of the method of Kaufman and
Manley5. In brief, 2 μL of rehydrated sample was mixed online with 2.2 μL of derivatizing
reagent (260 mM N-isobutyryl-l-cysteine, 170 mM o-phthaldialdehyde, in 1 M potassium
4
borate buffer, adjusted to pH 10.4 with KOH) immediately before injection. This set-up is
optimized for the routine separation of enantiomeric pairs, which is achieved on a C18
HyperSil BDS column using a gradient elution of sodium acetate buffer (pH 6.00 ± 0.01),
methanol, and acetonitrile. Quantification of the amounts of Asp and Gly occluded within
the calcite crystals was achieved using calibration curves, as reported in6 using the
(normalized) RP-HPLC peak areas, taking into account the mass of the calcite sample
analyzed and the volume of rehydration fluid used.
Characterization of amino acid/calcite composite particles. The crystals were analyzed
using Scanning Electron Microscopy (SEM), optical microscopy, and selected samples were
also analyzed using synchrotron X-ray powder diffraction. For SEM, particles on glass
substrate were mounted on aluminum stubs using carbon sticky pads, and were coated with 5
nm Pt/Pd using FEI Nova NanoSEM.
Solid state nuclear magnetic resonance (ssNMR) spectroscopy analysis. All ssNMR
spectra were recorded on a Bruker Avance I NMR spectrometer with a 9.4 T superconducting
magnet, operating at 400 MHz for ¹H and 100 MHz for ¹³C. Samples were packed into 4 mm
zirconia rotors, with Teflon tape being used to fill out empty space within the rotor. Magic
angle spinning (MAS) rate was 10 kHz. The standard cross polarization (CP) sequence in the
Bruker pulse program library was used; 1H 90° pulse length 2.5 μs, contact time 2.5 ms, with
a ramped pulse on 1H and spin lock field 70 kHz. During acquisition, spinal64 decoupling at
100 kHz RF field strength was applied on 1H. Repetition time was 2 s between successive
acquisitions to allow relaxation.
Proton driven spin diffusion (PDSD) experiments were conducted using the same
initial cross polarization parameters as employed in the 13
C CP experiments. At 10 kHz

5
MAS, the magnetization was allowed to evolve at single-quantum coherence during the
incremental delay (t1), and returned to zero quantum coherence by a 13
C 90° pulse of 3.8 μs.
1H decoupling was switched off during this mixing period of 100 ms to allow transfer of
13C
magnetization via dipolar coupling and spin diffusion7 with a
13C 90° readout pulse at the end
of the mixing period. During both the incremental delay and acquisition periods, spinal64
decoupling was applied at 100 kHz. The pulse sequence used was an adapted version of the
Avance I CP spin diffusion experiment in the Bruker library.
Synchrotron powder X-ray diffraction (PXRD) analysis. The high-resolution PXRD
measurements were carried out on the synchrotron beamline (I11) at Diamond Light Source
Ltd, Didcot, UK. Instrument calibration and wavelength refinement (=0.8257156(10) Å)
were performed using high quality NIST silicon powder (SRM640c) and instrumental
contribution to the peak widths does not exceed 0.004o8
. Diffractograms were recorded from
the specimens at room temperature. Sample powders for analysis were loaded into 0.7 mm
borosilicate glass capillaries, and to avoid intensity spikes from individual crystallites, the
samples were rotated during measurements at a rate of 60 rps. PXRD data was then obtained
using high-resolution MAC (multi-analyzer crystal) diffraction scans, with scan times of
1800 s.
The structural parameters were refined by Rietveld analysis using GSAS and
PANalytical X’Pert HighScore Plus software. Lattice distortion, strain and size analysis was
performed using both Rietveld analysis for whole spectrum and line profile analysis for the
(012), (104), (001), (110) and (113) reflections using PANalytical X’Pert HighScore Plus
software. Goodness of fitness values for all the analyzed samples are summarized in
Supplementary Tables 1 and 2.

6
To analyze peak shape, peak broadening was expressed as FWHM and Integral
Breadth. (Fig. 3 and Supplementary Figs 4 and 5) Total FWHM is the full width at half
maximum for each of the peaks, while Integral Breadth is the width of a rectangle that can be
placed within the peak that has the same area as the net peak area, (Net area/net height).
Microstrain (%) is derived by line profile analysis and shows the microstrain contribution to
the total line broadening. Coherence length (nm) is derived by line profile analysis and
shows the coherence length contribution to the total line broadening (Supplementary Fig. 4).
Mechanical testing. Cyanoacrylate resin was poured over glass slides supporting
precipitated calcite/amino acid crystals and was then allowed to set overnight. The resin and
crystals were polished using graded Al2O3 lapping films and a final 50 nm Al2O3 powder
(Buehler micropolish Al2O3) suspended in a water and 2-methyl-2,4-pentanediol mix
(Green Lube, Allied High Tech) until the crystals were exposed for measurement
(Supplementary Fig. 8). The surface roughness of samples produced following this protocol
was less than 10 nm RMS as determined using the indenter tip as a scanning force probe.
Nanoindentation measurements were performed on exposed calcite/amino acid
crystals with in-plane sizes of 20–60 µm using a Berkovich (120 nm tip radius) diamond
indenter in a commercial nanoindenter system (Hysitron TriboIndenter 900). Before data
collection, the shape of the tip was calibrated using the method of Oliver and Pharr9. Each
indent consisted of five-second load, hold, and unload segments with a maximum load of
2500 µN, resulting in 200 nm deep indents. The unloading segment was used to calculate
the indentation modulus and hardness9. The maximum load was chosen to create an
indentation large enough to sample a homogeneous volume and minimize the effects of
surface roughness, while allowing multiple indents per sample. Surface topography scans

7
were performed with the indenter tip before and after indenting to ensure indentations were
located at least 5 µm away from any edges.
The hardness and modulus of calcite depends on the orientation of the crystal with
respect to the nanoindenter tip. For example, for indentations on the {001} facet of calcite,
the hardness ranges from 2.3 to 2.5 GPa and the indentation modulus ranges from 68 to 77
GPa with azimuthal angle10
. For randomly oriented crystals, averaging over multiple crystals
with multiple indentations provides an average hardness and modulus over a range of
crystallographic orientations. In this work, 5 to 8 different randomly-oriented crystals were
selected for each growth condition, and 4-10 indentations were made per crystal, resulting in
at least 28 measurements for each amino acid concentration.

8
Supplementary Note 1. Simulation protocols
The program Packmol11
was used to place the amino acids inside the crystal in a
random orientation for a range of 0-2.3 mol% (Asp1-
, Gly0) or 0-3.2 mol% (Asp
2-, Gly
1-) of
amino acid within the simulation box, corresponding to a maximum inclusion of 3.5, 3.9, 4.8
or 5.5 wt% for Asp1-
, Gly0, Asp
2- and Gly
1- respectively. To avoid a net charge change in the
system the solution chemistry shown in supplementary equations 1-4 was used. In all systems
the calculations of the energetics of the excess Ca2+
and CO32-
ions were made with respect to
bulk calcite such that our results did not depend on the reference state of the system.
Ca2+
(aq) + Asp2-
(aq) + Ca2+
(crystal) + [CO3]2-
(crystal) => 2Ca2+
(aq) + 2[CO3]2-
(aq) + Asp2-
(crystal) + VCa2-
(crystal) + 2VCO32+
(crystal) (Supplementary Eq. 1)
Ca2+
(aq) + 2Gly-(aq) + Ca
2+(crystal) + [CO3
2-](crystal) => 2Ca
2+(aq) + 2[CO3]
2-
(aq) + 2Gly- (crystal) +
VCa
2- (crystal) +
2VCO3
2+ (crystal) (Supplementary Eq. 2)
Ca2+
(aq) + 2Asp-(aq) + Ca
2+(crystal) + [CO3
2-](crystal) => 3Ca
2+(aq) + 3[CO3]
2-
(aq) + 2Asp-(crystal)+ 2VCa
2- (crystal) + 3VCO3
2+ (crystal) (Supplementary Eq. 3)
Gly(aq) + Ca2+
(crystal) + [CO32-
](crystal) => 2Ca2+
(aq) + 2[CO3]2-
(aq) + Gly
(crystal) + 2VCa2-
(crystal) + 2VCO32+
(crystal) (Supplementary Eq. 4)
where VXy means a vacancy of X with the effective charge given in the superscript y.
The atomic charges for the amino acids were calculated with AMBER Antechamber12
using the AM1-BCC method13
. This uses a semi-empirical method in combination with bond
charge corrections to calculate the electronic structure of the amino acid. For all simulations,
the Molecular Dynamics package DL POLY Classic14
was used and the mineral phase was
described using the CaCO3 potentials developed by Raiteri et al.15
The interactions of the
9
organic molecules were described using the AMBER forcefield16
. The interactions between
the mineral and organic phase were modelled by using a generic method to produce cross
term potentials17
, where this generated a reliable potential for our system without the need for
further fitting.
All simulations were run at a temperature of 300 K and at atmospheric pressure (105
Pa). The simulations were equilibrated for 100 ps using a timestep of 0.1 fs for an NVT
ensemble with a Nosé-Hoover thermostat18
. Subsequent simulations were carried out for data
analysis. These simulations were run in an NPT ensemble with a timestep of 1.0 fs using a
Nosé-Hoover thermostat and a Hoover barostat19
for 2.0 ns. The insertion energy of the
amino acids was calculated using the solution chemistry as described in Supplementary
equation (1-4) above. In order to calculate the configuration energy of the system under
anisotropic expansion, simulations with a configuration of 5 mM Asp- were performed to
mimic the experimental setup. The simulation box was expanded manually and
independently along either the c-axis or the a-axis (the b axis is equivalent to a-axis) in
increments of 0.05 % of the initial lattice parameter per step. After each expansion, the
configurational energy was calculated during a 0.5 ps simulation with a 1.0 fs timestep in an
NVT ensemble.
Supplementary Note 2. Derivation of equation (1) to describe the hardness of calcite
crystals with occluded amino acids
Of the slip systems in calcite,{1̅02} ⟨221⟩+ −⁄ , {104} ⟨221⟩+ −⁄ and
{1̅08} ⟨401⟩+ −⁄ have the lowest critical resolved shear stresses 20
. The {1̅02} and {104}
systems have large Burgers vectors and require high temperatures and/or pressures to operate,
while the {1̅08} twinning system can be activated in uniaxial loading at room temperature
and pressure20
. Since at least 5 independent slip systems are needed for generalized

10
plasticity, as required to form the indentations (Fig. 6a), it is evident that the pressure under
the indenter is sufficient to activate the more difficult of these slip systems.
To determine the form of the relationship between H and Fc, we first estimate the
dislocation line tension from = Gb2 where G is the shear modulus and b is the
magnitude of the Burgers vector. Taking = 1, G = 35 GPa, and b = 0.5 nm (G and b
calculated as averages for the material), we find ≈ 9 nN, which is significantly greater than
the force required to break a covalent bond (estimated as 1.5 to 4 nN 21-23
), which in turn
indicates that the angle at which the dislocation will cut the molecule will be low (≤ 13˚).
Under these conditions, the critical resolved shear stress (c) required for the dislocations cut
the particles can be estimated from 𝜏𝑐 = (𝐹𝑐 𝑏𝐿⁄ ) √𝐹𝑐 2𝑇⁄ , where L is the average
separation of the molecules in the lattice24
. To convert c to H, we use known critical
resolved shear stresses for the slip systems in calcite20
and our measured indentation modulus
to estimate a yield stress (Y) to modulus (E) ratio of 0.01. Finite element simulations
indicate that H approaches 2.8Y for materials with Y/E < 0.0225
. Using this relationship, and
the von Mises criterion to relate Y to c, the hardness is related to the critical resolved shear
stress by H ≈ 4.8c. If we assume that strength of the crystal is just the sum of the intrinsic
resistance to dislocation motion (as determined from the hardness, H0, of pure Iceland spar)
and the additional strengthening due to AA molecules, we can write the result as Equation 1.
𝐻 = 𝐻0 + 4.8(𝐹𝑐 𝑏𝐿⁄ ) √𝐹𝑐 2𝑇⁄ (Equation 1)
11
Supplementary Note 3. Estimation of lattice misfit of AA molecules in calcite
One distinction between solutes and second phase particles is their effect on lattice
strains. A solute species has a certain size and replaces a fundamental unit of the host crystal
that also has a certain size (or is inserted interstitially). Unless the solute and the space in the
lattice into which it is inserted happen to be the same size and shape, accommodation strains
are required e.g. when Mg2+
is substituted for Ca2+
in calcite26-30
. In contrast, both a second
phase particle and the space created for it in the crystal may consist of many formula units
(atoms or molecules) which can be closely adjusted so that little or no lattice strains are
required, e.g. ~ 200 nm polystyrene inclusions in calcite31
.
With respect to lattice distortions, amino acid inclusions behave like solutes. The
closest fit for Gly0 is achieved when it replaces one CaCO3 formula unit, and the closest fit
for Asp2-
when it replaces one CaCO3 unit and one CO32-
ion. Using molecular volumes for
Gly0, CaCO3, Asp
2-, and CO3
2-, of 0.077 nm
3 32, 0.061 nm
3 33, 0.13 nm
3 34, and 0.055 nm
3
(found by subtracting the volume of a Ca2+
ion, i.e. 0.0056 nm3 35
, from that of CaCO3),
respectively, the misfit, expressed as (r-r0)/r0, where r and r0 are the radii of spheres having
the same volumes as the AA molecule and the space created for it in the lattice respectively,
is 8.1% for Gly0 and 3.9 % for Asp
2-. Similar calculations for 2Asp
1- and 2Gly
1- (as
described in the simulations section) give misfits of 13.7 % and 9.9 %, respectively. It is
noteworthy that not only do the strains from PXRD (Fig. 3) and simulations (Fig. 4) agree
when Gly0 and Asp
2- are considered as the occluding species, but the ratio of these strains is
consistent with the ratio of the misfits, while any of the ratios including Gly1-
and Asp1-
are
not. This suggests that the AA molecules are occluded as Gly0 and Asp
2-, and not the paired
molecules of Gly1-
and Asp1-
that were also considered in the simulations, in agreement with
the NMR results.

12
These misfits result in large tensile strains in the calcite lattice in the neighborhood of
each AA molecule, which drop off rapidly with distance from the molecule36
(Fig. 3e). These
distortions increase both the average lattice parameter (lattice distortions, Figs. 3a and 3b)
and the inhomogeneity of the strains (microstrains, Figs. 3c and 3d and Supplementary Fig.
4). As [AA]inc increases, the strain fields around the molecules begin to overlap (note the
small separation between molecules in Supplementary Fig. 9), and the strain inhomogeneity
decreases as the lattice distortions continue to increase (Figs. 3e and 3f). Because the
molecules are small and roughly equiaxed, the anisotropy in the lattice distortions (Figs. 3a
and 3b) arises primarily from the elastic anisotropy of calcite (the stiffness along the c axis is
58% of that along the a-axis37
).
Supplementary Note 4. Calculation of spacing, L, between amino acid molecules
As described in the main text, to determine the hardening mechanism of the amino
acids, the spacing, L, between amino acid molecules within the calcite crystals must be
determined. To calculate this value, we assume that the AA molecules are randomly
distributed throughout the volume, consistent with the ssNMR data, and thus in any subset of
that volume, such as a thin slice containing the slip plane. We convert the measured mole
concentrations, [AA]inc, to volume concentrations Cv,AA (number of AA molecules/volume)
using the known molecular volumes of calcite33
and the amino acids in crystalline form32,34
(there is very little difference between the polymorphs for our purposes). The number of AA
molecules per unit area on the thin slice is then given by Cv,AA*t, where t is the thickness of
the slice. Approximating the configuration of the molecules in the calcite as a square array,
we have L = (Cv,AA*t)-0.5
. For geometric consistency, we set t equal to the diameter DAA of

13
the AA molecule under consideration (𝐷𝐴𝐴 = √6𝜈𝐴𝐴
𝜋
3 , where 𝜈𝐴𝐴 is the volume of the
amino acid), so
𝐿 = [𝐶𝜈,𝐴𝐴]−1
2 [6𝜈𝐴𝐴
𝜋]
−1
6 (Supplementary Equation 5)
A plot of L vs. [AA]inc is shown in Supplementary Fig. 9.
14
Supplementary Note 5. The possible role of twinning.
Twinning is a common deformation mechanism in bulk calcite. However, it requires
specific loading and boundary conditions, which are not provided in our tests. Furthermore,
if twinning does occur, the resulting hardening is still expected to follow a rule like Eq (1).
These ideas can be understood as follows. Although the twin system in calcite has a
lower critical resolved shear stress than the and {104} slip systems, formation of a
twin requires enormous shear strains (69.4%)38
and thus occurs only where
accommodations can be made for incompatibilities between the twin and the surrounding
material. Accordingly, reports of twin deformation occurring underneath indentations in
calcite fall into two categories:
(1) Cases where the incompatibility is accommodated by cracking or the presence of a free
surface or other interface. For example, Li and Ortiz found a great deal of twinning under
indentations in P. placenta, due to the presence of many compliant interfaces that could
accommodate the large twin shear displacements39
. In their indentation tests of pure calcite,
few twins formed and these spanned relatively short distances between free surfaces,
including the sample surface and subsurface cracks.
(2) Cases where the shear required to accommodate the indenter is matched to the shear
required by the twin. For example, 2-D wedge indentations have been used to study “elastic
twinning”38
. For indentations made with a Berkovich indenter, slip on the system has
been seen, but only on the {001} face at azimuthal angles where the interaction between the
geometry of the indenter and the orientation of the crystal, along with the free surface and the
formation of cracks, allowed it10
.
We know of no study in which twins have been reported underneath indentations in
single crystal calcite where no cracking (or other accommodating interface) was present.
108{ }
102{ }
108{ }
108{ }

15
Furthermore, our experiments revealed no evidence of twinning in either the load-
displacement data (e.g. “pop-in” events39
) or in the surface profiles (Fig. 6a inset).
This discussion does not prove that twinning did not occur in our experiments. Even if
there is twinning, however, twins grow by motion of “twin dislocations.” These line defects
can be more complicated than simple glide dislocations40
but include a glide component that
must interact with the occluded AA molecules. While new laws may be needed to account
for temperature and rate dependence41
the Friedel term in Eq 1 is geometric, and should apply
equally well to full and twin dislocations in a comparative model such as ours (Eq. 1
compares the hardness of samples with and without occluded AA molecules subjected to
identical tests). Thus, even if twinning occurs, we expect variations in hardness with AA
content to follow Eq. 1 reasonably well.

16
Supplementary Figures
Supplementary Figure 1.
Optical microscope images of calcite crystals (a) showing morphological changes as a
function of [Asp]Sol = 0.05 mM, 10 mM, 12mM, 20 mM, 50 mM and 100 mM. (b) shows
morphological change as a function of [Gly]Sol = 5 mM, 20 mM, 50 mM, 100 mM, 200 mM
and 400 mM. All the crystals were grown at an initial [Ca2+
] = 10 mM. Note that the scale
bars are individual to each figure and reflect the decrease in crystal size as the concentration
of amino acid increases.
a
b

17
Supplementary Figure 2.
Optical microscope images of calcite crystals showing morphological changes as a function
of the initial [Ca2+
] = 100 mM, 50 mM, 25 mM, 10 mM, 2 mM and 1 mM. All of the crystals
were grown in the presence of an initial [Asp]sol = 10 mM.
Supplementary Figure 3.
SEM images of calcite crystals grown at an initial [Ca2+
] = 25 mM showing a modified single
crystal morphology at [Asp]sol = 20 mM, and a polycrystalline particle at [Asp]sol = 50 mM.

18
Supplementary Figure 4.
Changes in XRD peak Full Width at Half Maximum (FWHM), integral breadth, microstrain
and coherence length induced by (a) Asp and (b) Gly incorporation.
a
b

19
Supplementary Figure 5.
Changes in the positions and shapes of (104) reflections of the samples shown in Fig 3. The
lattice shift and FWHM values of the peaks were shown in Fig 3. (A) The peaks shift to
lower angles (higher d-spacings) with increasing occlusion of Asp, while at the same time
increasing in width until [Asp] = 10 mM (1.67 mol %). The peak then becomes slightly more
narrow at [Asp] = 50 mM. (B) The peaks shift to higher d-spacings with increased occlusion
of Gly, while increasing in width until [Gly] = 50 mM, before narrowing again at higher
values of [Gly].
a b

20
Supplementary Figure 6.
ssNMR showed no evidence for Gly-Gly intermolecular interactions or clustering. The black
traces in each panel are (identical) contour plots of 2D proton driven spin diffusion (PDSD)
data. The red traces depict rows extracted from the 2D plots at chemical shifts corresponding
to the Gly-1C (left) and Gly-2C (right). If there were a detectable interaction between Gly
neighbours we would see signals at the frequencies marked by dotted red lines in each trace,
i.e. at the Gly-2C in the left panel, and Gly-1C in the right panel

21
Supplementary Figure 7.
Chemical structures of the differently charged states of the aspartic acid and glycine used in
simulations (a) Asp2-
(b) Gly1-
(c) Asp1-
(d) Gly0.
Supplementary Figure 8.
(a, b) Scanning electron micrographs of calcite crystals grown in the presence of [Asp] = 1
mM, embedded within cyanoacrylate resin, and polished to expose crystal surfaces for
nanoindentation.
d
a b
c
22
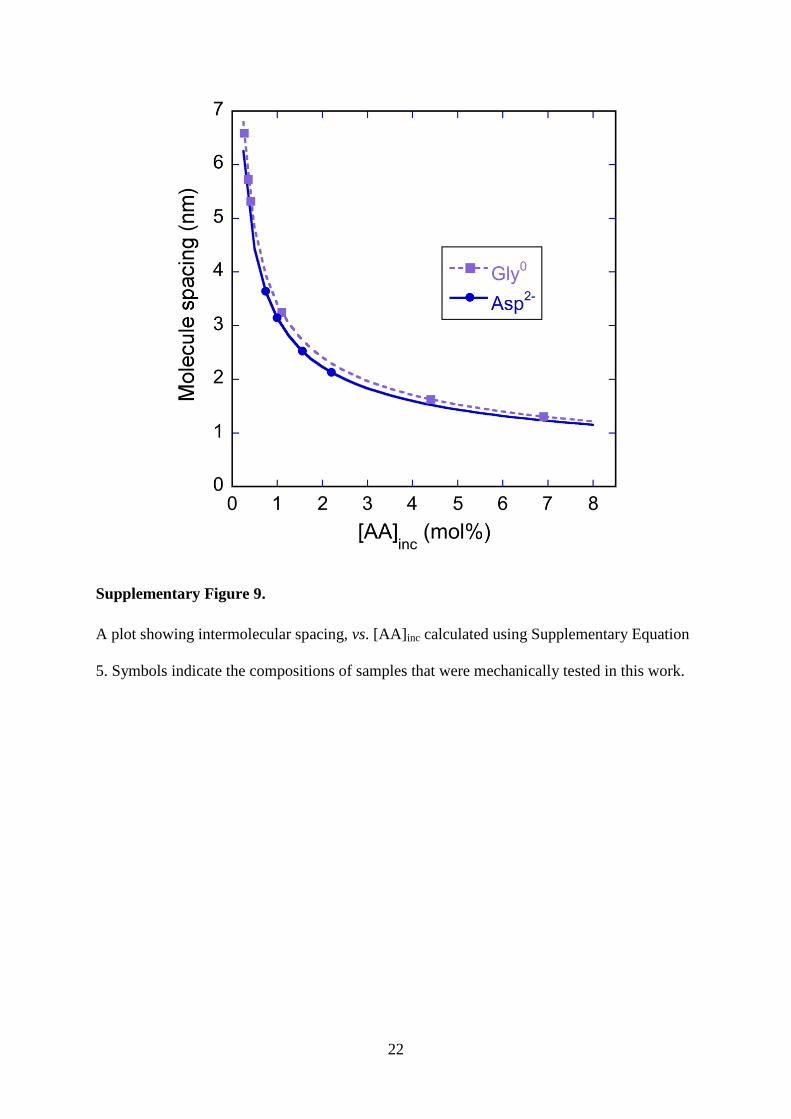
Supplementary Figure 9.
A plot showing intermolecular spacing, vs. [AA]inc calculated using Supplementary Equation
5. Symbols indicate the compositions of samples that were mechanically tested in this work.

23
Supplementary Table 1
XRD structure parameters and their goodness of fitness (GOF) of Asp/calcite and Gly/calcite
shown in Fig. 3 as obtained from Rietveld analysis.
AA conc
[mM] mol% a(Å) c(Å)
2 a/a c/c
Pure 0 0 4.9903 17.063 3.17 0 0
Asp 0.1 0.036 4.9907 17.068 6.355 8.02E-05 2.93E-04
Asp 1 0.5 4.9915 17.076 3.454 2.40E-04 7.62E-04
Asp 5 1.006 4.9921 17.096 18 3.61E-04 1.93E-03
Asp 10 1.673 4.9923 17.105 10.3 4.01E-04 2.46E-03
Asp 50 3.992 4.9927 17.114 11.30 4.81E-04 2.99E-03
Asp 100 2.728 4.9916 17.110 5.71 2.61E-04 2.75E-03
Gly 5 0.28 4.9907 17.069 11.38 8.02E-05 3.52E-04
Gly 10 0.387 4.9908 17.073 26.89 1.00E-04 5.86E-04
Gly 50 1.138 4.9918 17.102 29.85 3.01E-04 2.29E-03
Gly 100 1.707 4.9931 17.120 22.79 5.61E-04 3.34E-03
Gly 200 4.4 4.9931 17.136 15.27 5.53E-04 4.31E-03
Gly 400 6.9 4.9936 17.152 14.36 6.59E-04 5.24E-03

24
Supplementary Table 2
Goodness of Fitness values obtained from line profile analysis of Asp/calcite and Gly/calcite
samples shown in Fig. 3. (a) Asp/calcite samples (b) Gly/calcite samples.
Reflection Gly 5
mM
Gly 10
mM
Gly 50
mM
Gly 100
mM
Gly 200
mM
Gly 400
mM
(012) 1.19 2.26 1.26 1.05 2.87 2.35
(104) 7.33 7.43 3.88 4.72 11.78 12.18
(006) 0.82 2.11 0.95 0.97 1.56 1.42
(110) 1.42 2.45 2.33 1.96 3.73 2.50
(113) 1.74 1.32 2.48 3.61 5.10 3.32
(202) 0.88 1.39 1.34 5.30 3.57 7.73
Reflection Asp 1
mM
Asp 10
mM
Asp 5
mM
Asp 50
mM
Asp 100
mM
(012) 1.01 1.87 1.64 0.98 3.00
(104) 4.00 4.56 5.23 3.98 3.82
(006) 0.84 1.05 1.26 0.78 0.78
(110) 1.23 1.48 3.13 0.94 1.13
(113) 1.53 2.40 2.68 1.40 1.43
(202) 1.60 1.47 3.14 1.30 1.21
b
a

25
Supplementary References
1 Ihli, J., Bots, P., Kulak, A., Benning, L. G. & Meldrum, F. C. Elucidating mechanisms
of diffusion-based calcium carbonate synthesis leads to controlled mesocrystal
formation. Adv. Funct. Mater. 23, 1965-1973 (2013).
2 Penkman, K. E. H., Kaufman, D. S., Maddy, D. & Collins, M. J. Closed-system
behaviour of the intra-crystalline fraction of amino acids in mollusc shells. Quat.
Geochronol 3, 2-25 (2008).
3 Demarchi, B. et al. Intra-crystalline protein diagenesis (IcPD) in Patella vulgata. part
I: isolation and testing of the closed system. Quat Geochronol 16, 144-157 (2013).
4 Tomiak, P. J. et al. Testing the limitations of artificial protein degradation kinetics
using known-age massive Porites coral skeletons. Quat Geochronol 16, 87-109
(2013).
5 Kaufman, D. S. & Manley, W. F. A new procedure for determining DL amino acid
ratios in fossils using reverse phase liquid chromatography. Quat. Sci. Rev. 17, 987-
1000 (1998).
6 Demarchi, B. et al. New Experimental Evidence for In-Chain Amino Acid
Racemization of Serine in a Model Peptide. Anal. Chem. 85, 5835-5842 (2013).
7 Szeverenyi, N. M., Sullivan, M. J. & Maciel, G. E. Observation of spin Exchange by
two-dimensional fourier-transform C-13 cross polarization-magic-angle spinning. J.
Magn. Reson. 47, 462-475 (1982).
8 Thompson, S. P. et al. Beamline I11 at Diamond: a new instrument for high resolution
powder diffraction. Rev. Sci. Instrum. 80, 075107 (2009).
9 Oliver, W. C. & Pharr, G. M. Measurement of hardness and elastic modulus by
instrumented indentation: advances in understanding and refinements to methodology.
J. Mater. Res. 19, 3-20 (2004).
10 Kunitake, M. E., Mangano, L. M., Peloquin, J. M., Baker, S. P. & Estroff, L. A.
Evaluation of strengthening mechanisms in calcite single crystals from mollusk shells.
Acta Biomater. 9, 5353-5359 (2013).
11 Martinez, L., Andrade, R., Birgin, E. G. & Martinez, J. M. PACKMOL: A package
for building initial configurations for molecular dynamics simulations. J. Comput.
Chem. 30, 2157-2164 (2009).
12 Wang, J. M., Wang, W., Kollman, P. A. & Case, D. A. Automatic atom type and bond
type perception in molecular mechanical calculations. J. Mol. Graphics Modell. 25,
247-260 (2006).
13 Jakalian, A., Jack, D. B. & Bayly, C. I. Fast, efficient generation of high-quality
atomic charges. AM1-BCC model: II. parameterization and validation. J. Comput.
Chem. 23, 1623-1641 (2002).
14 Todorov, I. T., Smith, W., Trachenko, K. & Dove, M. T. DL_POLY_3: new
dimensions in molecular dynamics simulations via massive parallelism. J. Mater.
Chem. 16, 1911-1918 (2006).
15 Raiteri, P., Gale, J. D., Quigley, D. & Rodger, P. M. Derivation of an accurate force-
field for simulating the growth of calcium carbonate from aqueous solution: a new
model for the calcite-water interface. J. Phys. Chem. C 114, 5997-6010 (2010).
16 Wang, J. M., Wolf, R. M., Caldwell, J. W., Kollman, P. A. & Case, D. A.
Development and testing of a general amber force field. J. Comput. Chem. 25, 1157-
1174 (2004).
17 Freeman, C. L. et al. New forcefields for modeling biomineralization processes. J.
Phys. Chem. C 111, 11943-11951 (2007).

26
18 Hoover, W. G. Canonical dynamics - equilibrium phase-space distributions. Phys.
Rev. A 31, 1695-1697 (1985).
19 Melchionna, S., Ciccotti, G. & Holian, B. L. Hoover npt dynamics for systems
varying in shape and size. Mol. Phys. 78, 533-544 (1993).
20 DeBresser, J. H. P. & Spiers, C. J. Strength characteristics of the r, f, and c slip
systems in calcite. TCTOAM 272, 1-23 (1997).
21 Akbulatov, S., Tian, Y. C. & Boulatov, R. Force-reactivity property of a single
monomer is sufficient to predict the micromechanical behavior of its polymer. J. Am.
Chem. Soc. 134, 7620-7623 (2012).
22 Diesendruck, C. E. et al. Mechanically triggered heterolytic unzipping of a low-
ceiling-temperature polymer. Nat. Chem. 6, 624-629 (2014).
23 Grandbois, M., Beyer, M., Rief, M., Clausen-Schaumann, H. & Gaub, H. E. How
strong is a covalent bond? Science 283, 1727-1730 (1999).
24 Friedel, J. Les Dislocations. 72 (Gauthier-Villars, Paris, 1956).
25 Cheng, Y. T. & Cheng, C. M. Scaling approach to conical indentation in elastic-
plastic solids with work hardening. J. Appl. Phys. 84, 1284-1291 (1998).
26 Kunitake, M. E., Baker, S. P. & Estroff, L. A. The effect of magnesium substitution
on the hardness of synthetic and biogenic calcite. MRS Commun. 2, 113-116 (2012).
27 Moureaux, C. et al. Structure, composition and mechanical relations to function in sea
urchin spine. J. Struct. Biol. 170, 41-49 (2010).
28 Perez-Huerta, A., Cusack, M., Zhu, W. Z., England, J. & Hughes, J. Material
properties of brachiopod shell ultrastructure by nanoindentation. J. R. Soc., Interface
4, 33-39 (2007).
29 Griesshaber, E. et al. Crystallographic texture and microstructure of terebratulide
brachiopod shell calcite: an optimized materials design with hierarchical architecture.
Am. Mineral. 92, 722-734 (2007).
30 Wang, R. Z., Addadi, L. & Weiner, S. Design strategies of sea urchin teeth: structure,
composition and micromechanical relations to function. Philos. Trans. R. Soc., B 352,
469-480 (1997).
31 Kim, Y. Y. et al. Bio-inspired synthesis and mechanical properties of calcite-polymer
particle composites. Adv. Mater. 22, 2082-2086 (2010).
32 Perlovich, G. L., Hansen, L. K. & Bauer-Brandl, A. The polymorphism of glycine -
Thermochemical and structural aspects. J. Therm. Anal. Calorim. 66, 699-715 (2001).
33 Anthony, J. W., Bideaux, R. A., Bladh, K. W. & Nichols, M. C. in Handbook of
Mineralogy Ch. V (Borates, Carbonates, Sulfates), (Mineralogical Society of
America, ed. 2003).
34 Bendeif, E. E. & Jelsch, C. The experimental library multipolar atom model
refinement of L-aspartic acid. Acta Crystallogr., Sect. C: Cryst. Struct. Commun. 63,
O361-O364 (2007).
35 Shannon, R. Revised effective ionic radii and systematic studies of interatomic
distances in halides and chalcogenides. Acta Crystallogr., Sect. A: Found. Adv. 32,
751-767 (1976).
36 Eshelby, J. D. The determination of the elastic field of an ellipsoidal inclusion, and
related problems. Proc. R. Soc. London, Ser. A 241, 376-396 (1957).
37 Bass, J. D. in Mineral Physics & Crystallography: A Handbook of Physical Constants
45-63 (American Geophysical Union, 2013).
38 Clayton, J. D. & Knap, J. Phase field modeling of twinning in indentation of
transparent crystals. Modell. Simul. Mater. Sci. Eng. 19, 085005 (2011).
39 Li, L. & Ortiz, C. Pervasive nanoscale deformation twinning as a catalyst for efficient
energy dissipation in a bioceramic armour. Nat. Mater. 13, 501-507 (2014).

27
40 Mullner, P. Between microscopic and mesoscopic descriptions of twin-twin
interaction. Z Metallkd 97, 205-216 (2006).
41 Ghazisaeidi, M., Hector, L. G. & Curtin, W. A. Solute strengthening of twinning
dislocations in Mg alloys. Acta Mater. 80, 278-287 (2014).