Embed Size (px)
Citation preview

Supplementary Information
Space-time variability of ambient PM2.5 diurnal pattern over India from 18-years (2000-2017) of MERRA-2 reanalysis data
1Kunal Bali*, 1,2Sagnik Dey, 1Dilip Ganguly and 3, 4Kirk R. Smith
1Centre for Atmospheric Sciences, Indian Institute of Technology Delhi, Hauz Khas, New Delhi, India
2Centre of Excellence for Research on Clean Air, Indian Institute of Technology
Delhi, Hauz Khas, New Delhi, India
3School of Public Health, University of California, Berkeley, USA
4Collaborative Clean Air Policy Center, New Delhi, India
*Corresponding author: [email protected]
The supplementary information contains twenty figures and one table.
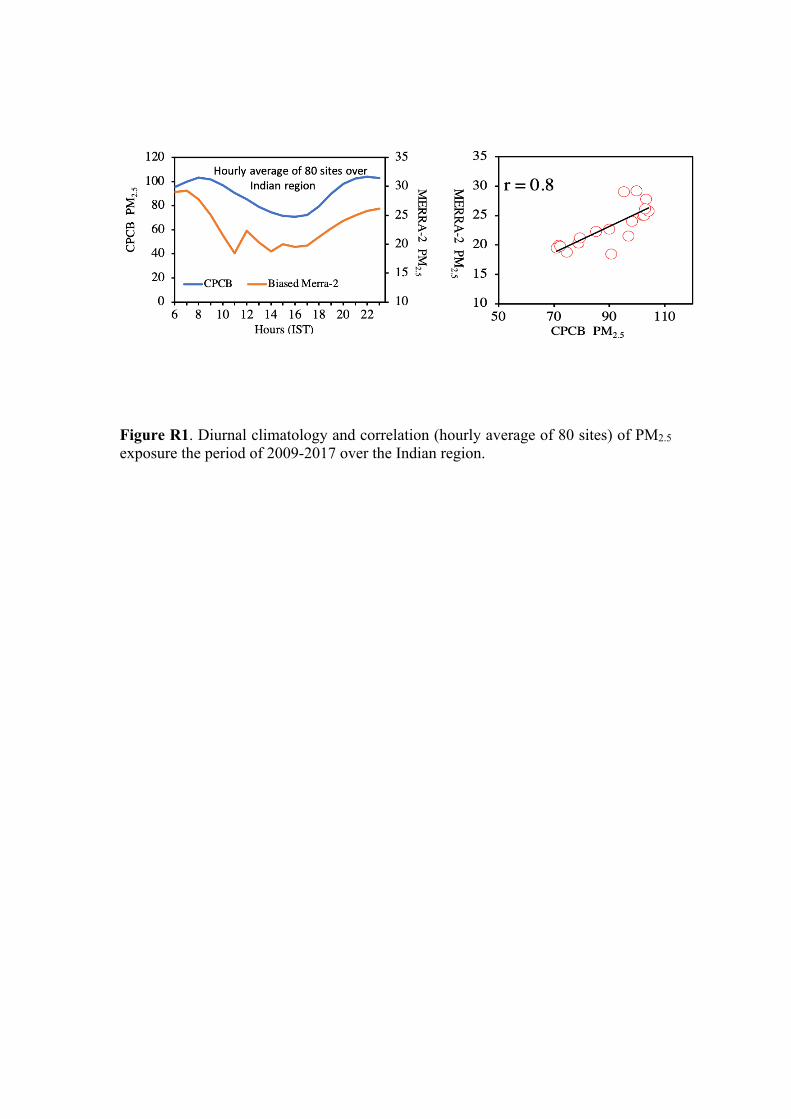
Figure R1. Diurnal climatology and correlation (hourly average of 80 sites) of PM2.5 exposure the period of 2009-2017 over the Indian region.
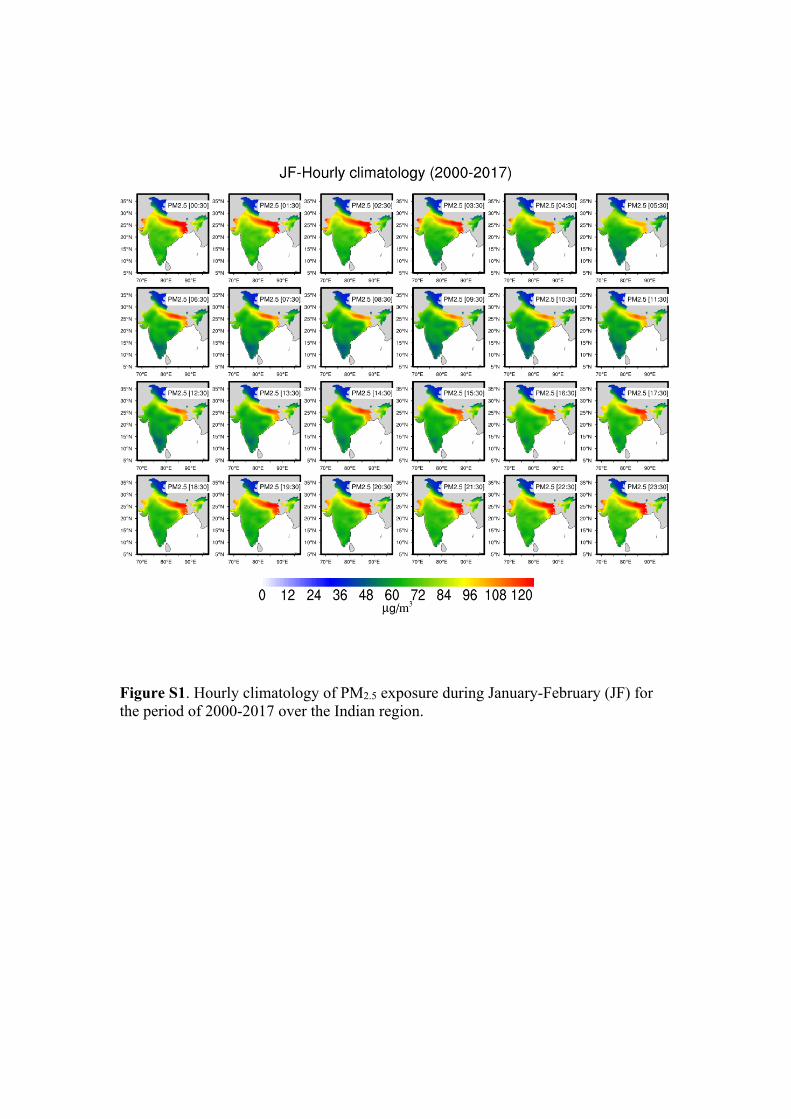
Figure S1. Hourly climatology of PM2.5 exposure during January-February (JF) for the period of 2000-2017 over the Indian region.
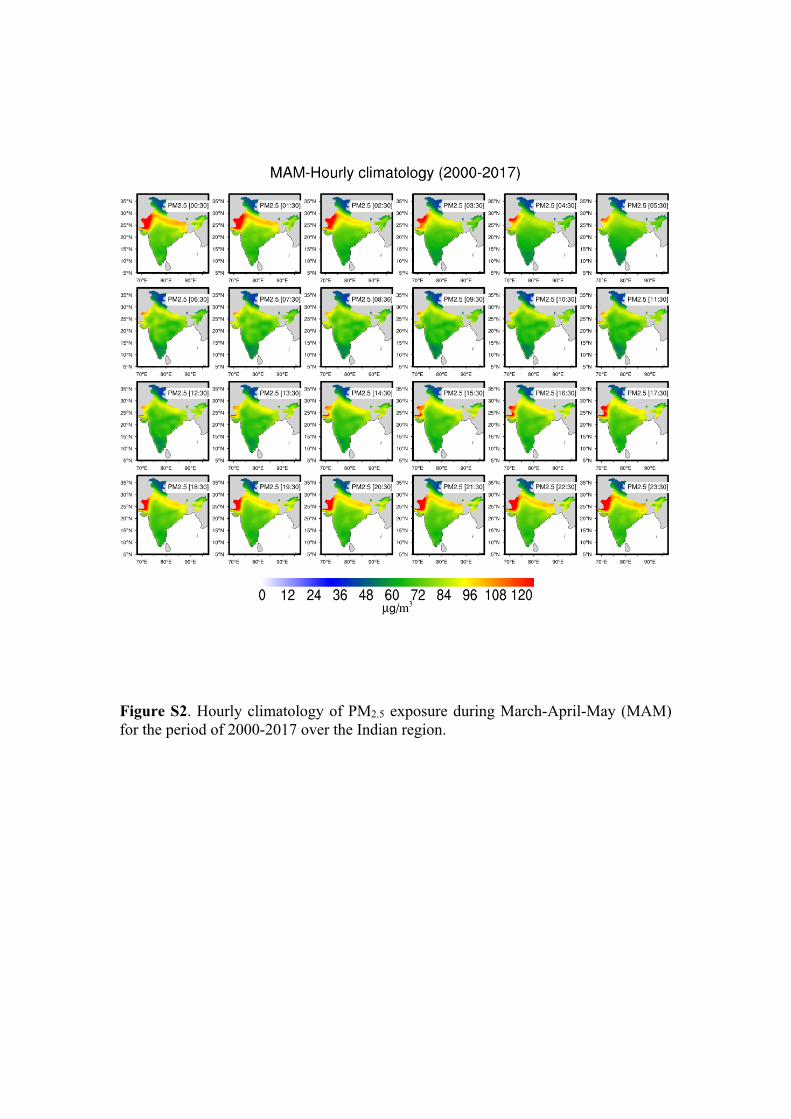
Figure S2. Hourly climatology of PM2.5 exposure during March-April-May (MAM) for the period of 2000-2017 over the Indian region.
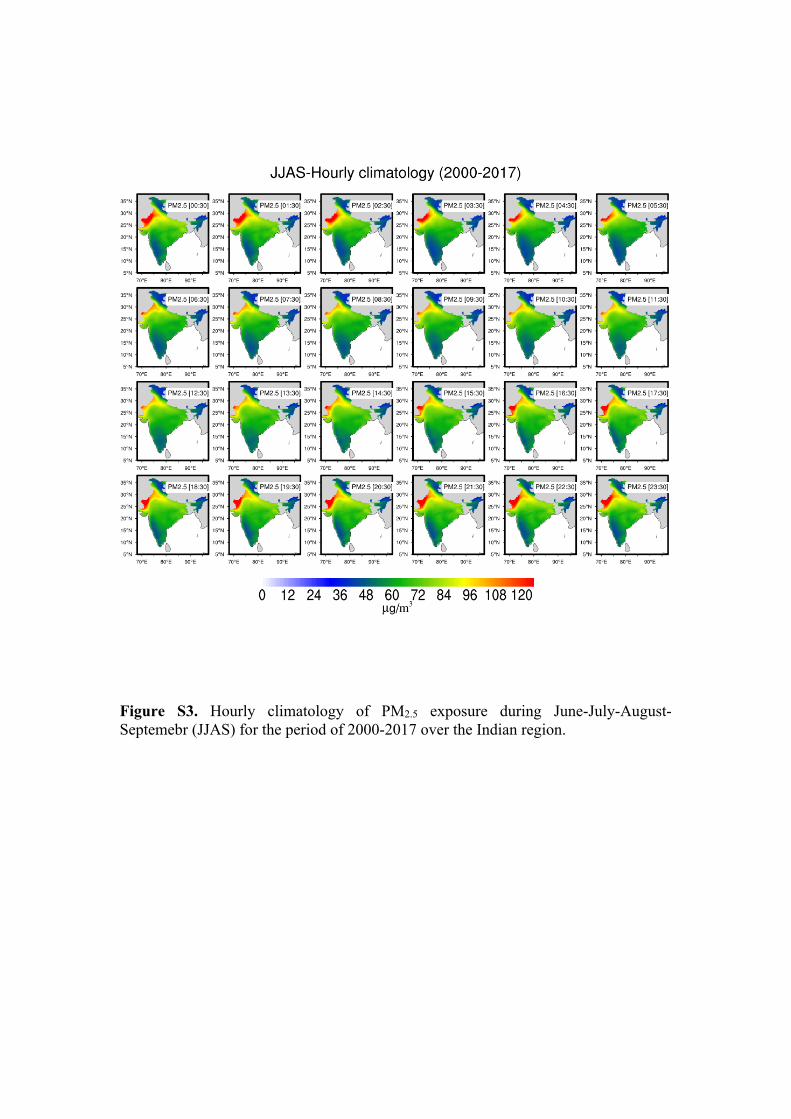
Figure S3. Hourly climatology of PM2.5 exposure during June-July-August-Septemebr (JJAS) for the period of 2000-2017 over the Indian region.
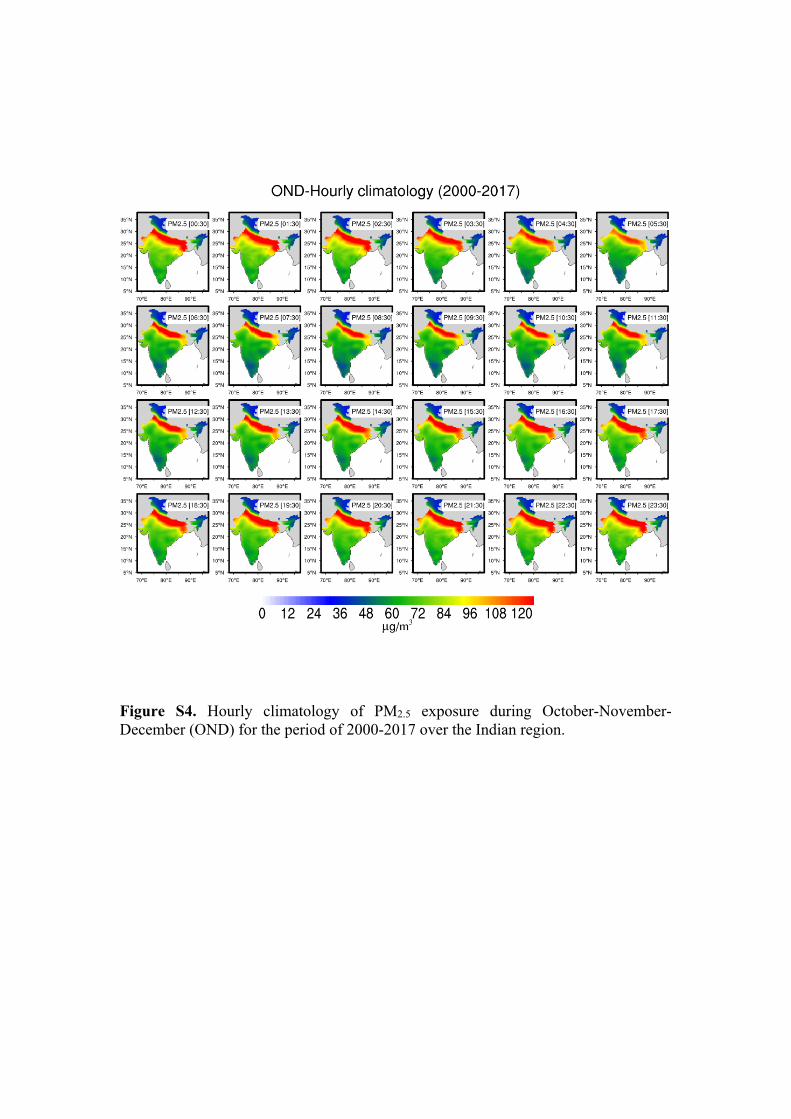
Figure S4. Hourly climatology of PM2.5 exposure during October-November-December (OND) for the period of 2000-2017 over the Indian region.
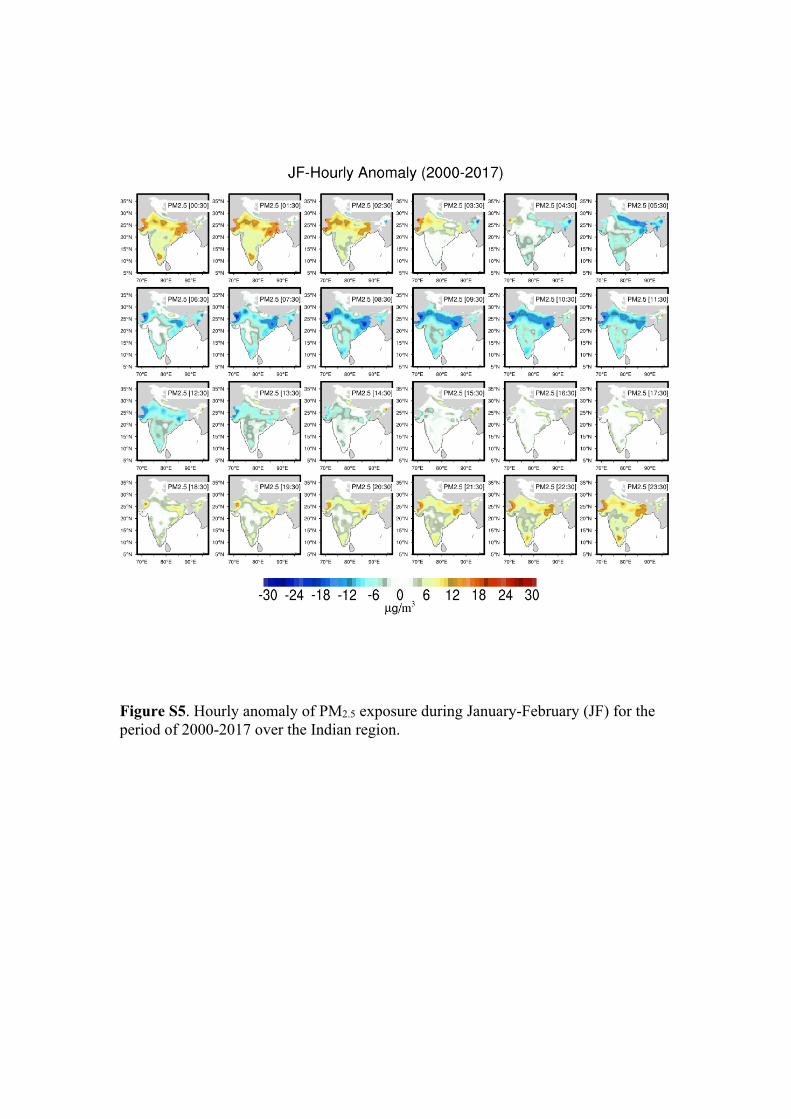
Figure S5. Hourly anomaly of PM2.5 exposure during January-February (JF) for the period of 2000-2017 over the Indian region.
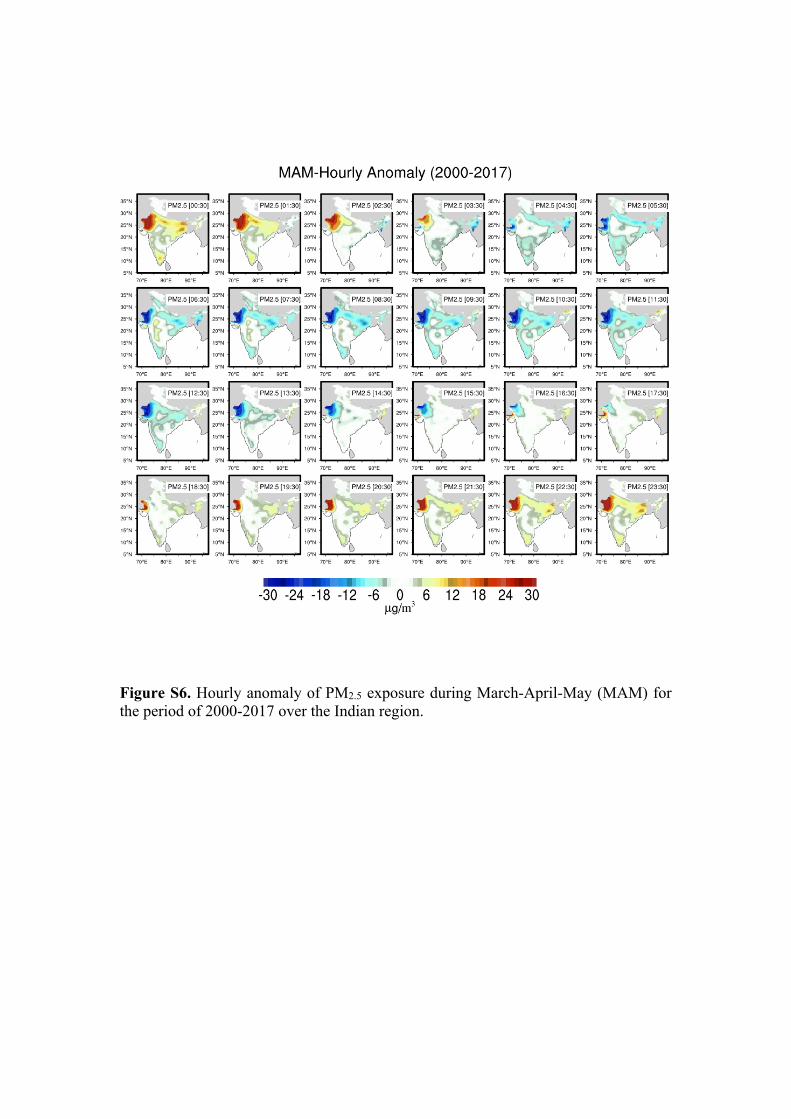
Figure S6. Hourly anomaly of PM2.5 exposure during March-April-May (MAM) for the period of 2000-2017 over the Indian region.
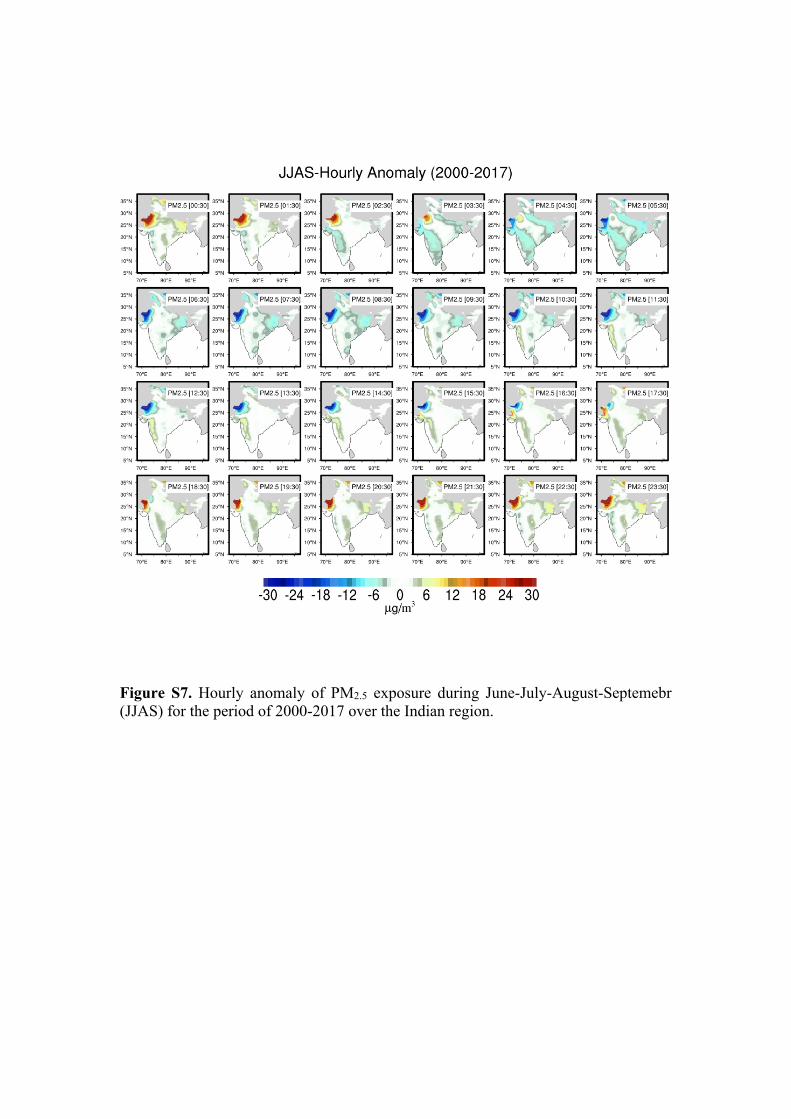
Figure S7. Hourly anomaly of PM2.5 exposure during June-July-August-Septemebr (JJAS) for the period of 2000-2017 over the Indian region.
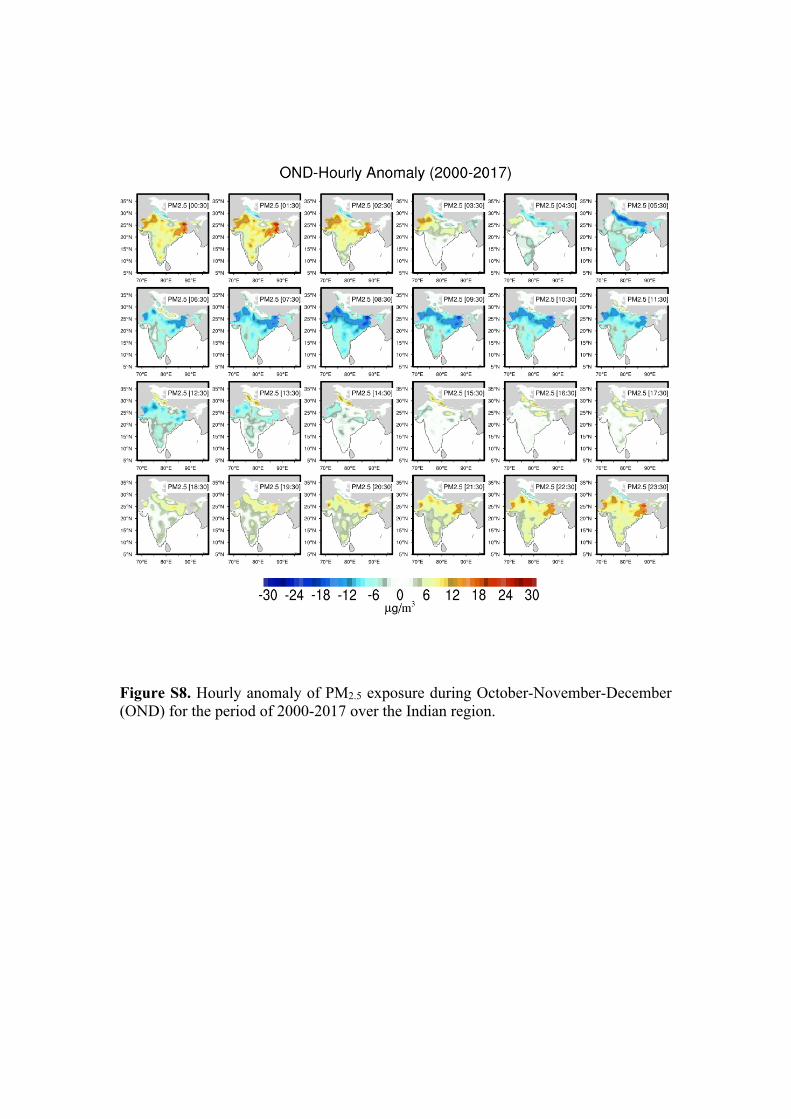
Figure S8. Hourly anomaly of PM2.5 exposure during October-November-December (OND) for the period of 2000-2017 over the Indian region.
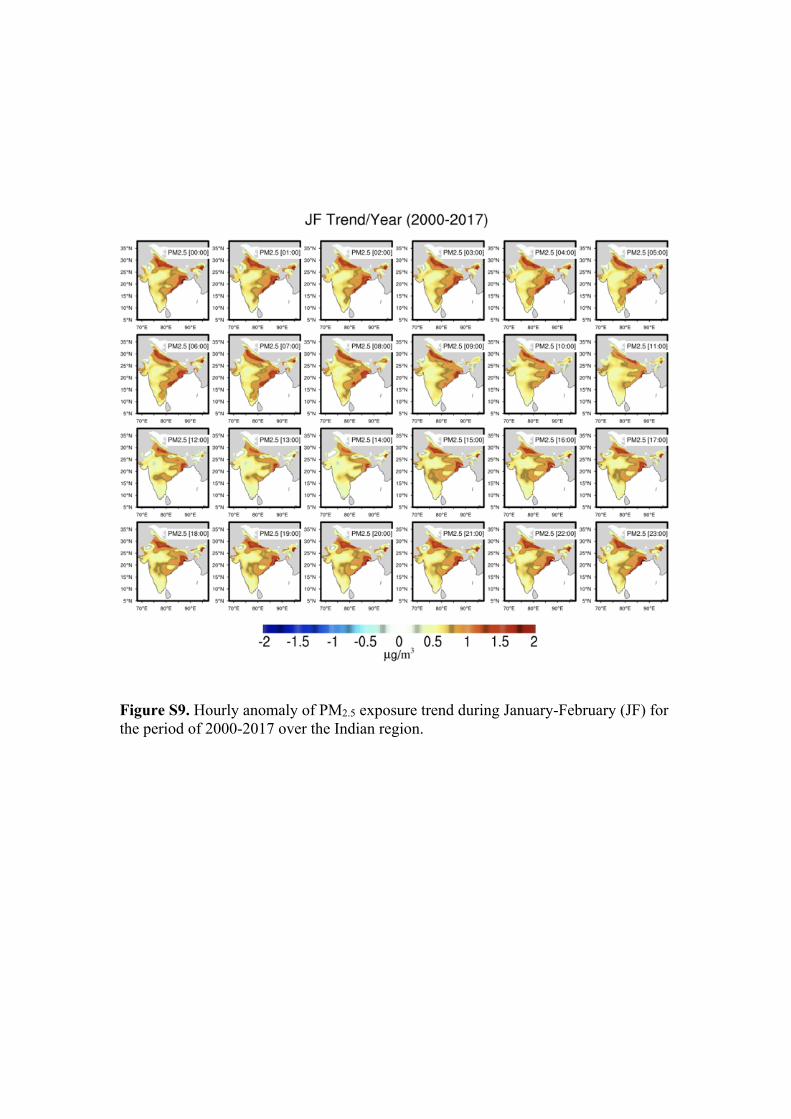
Figure S9. Hourly anomaly of PM2.5 exposure trend during January-February (JF) for the period of 2000-2017 over the Indian region.
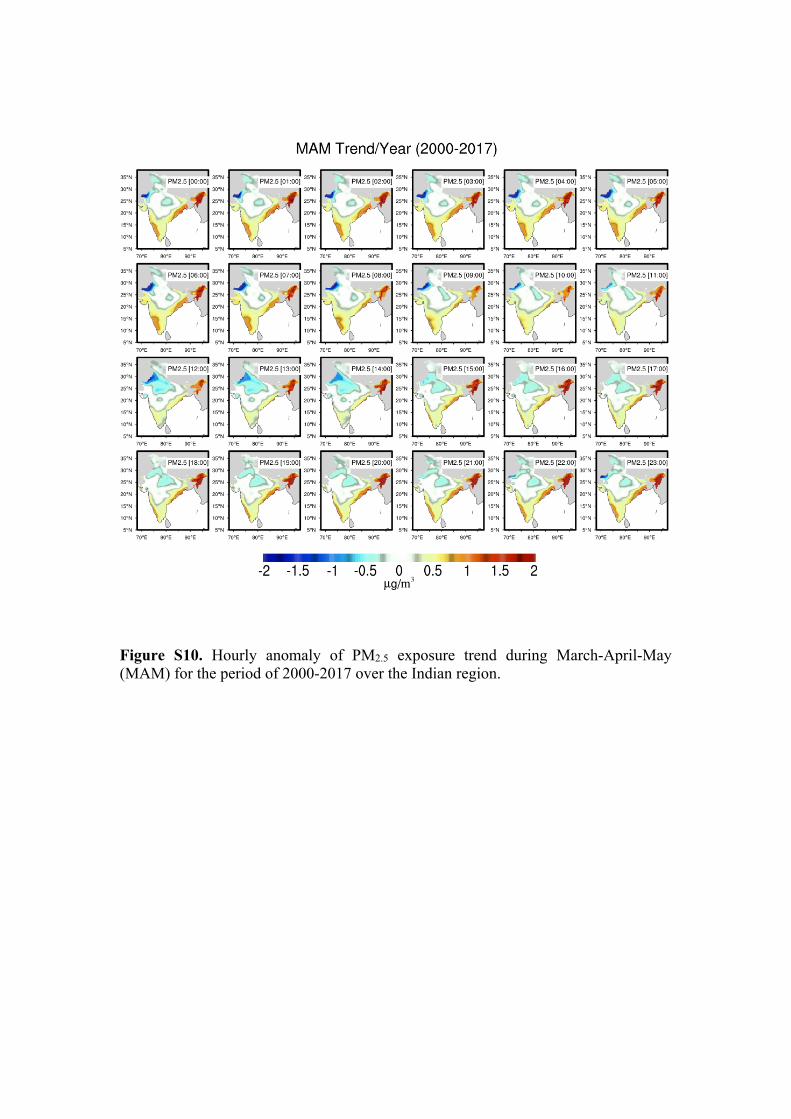
Figure S10. Hourly anomaly of PM2.5 exposure trend during March-April-May (MAM) for the period of 2000-2017 over the Indian region.
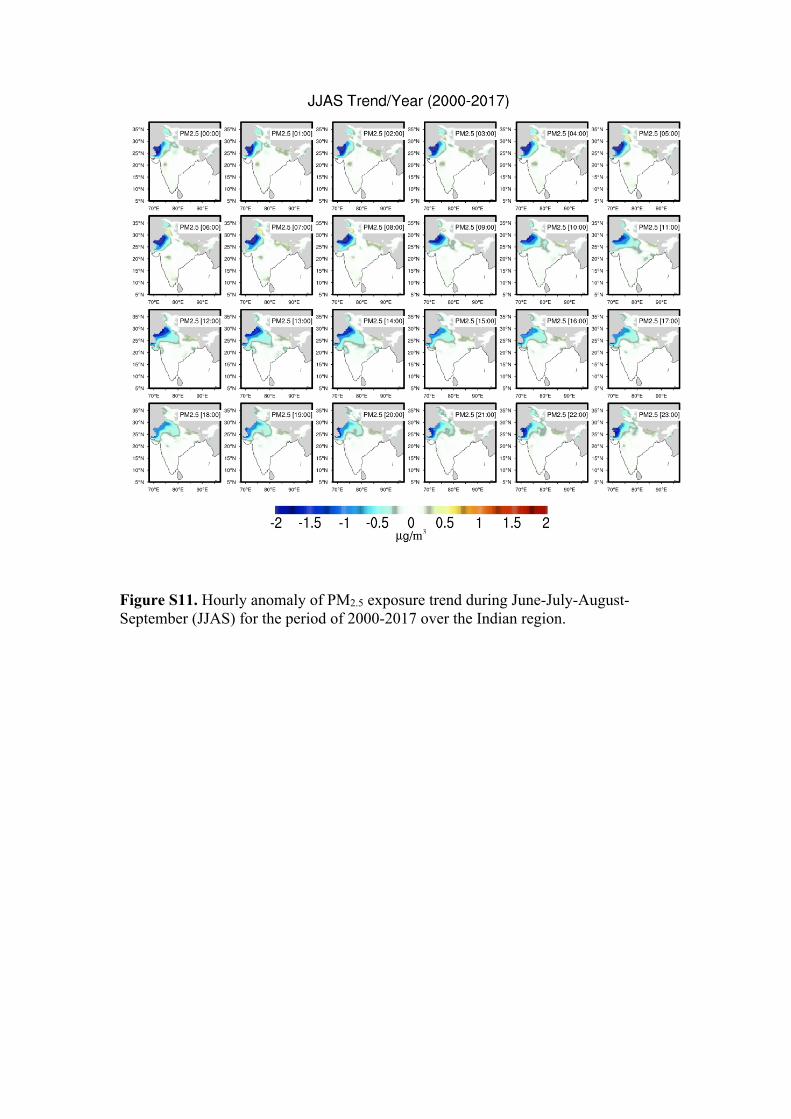
Figure S11. Hourly anomaly of PM2.5 exposure trend during June-July-August-September (JJAS) for the period of 2000-2017 over the Indian region.
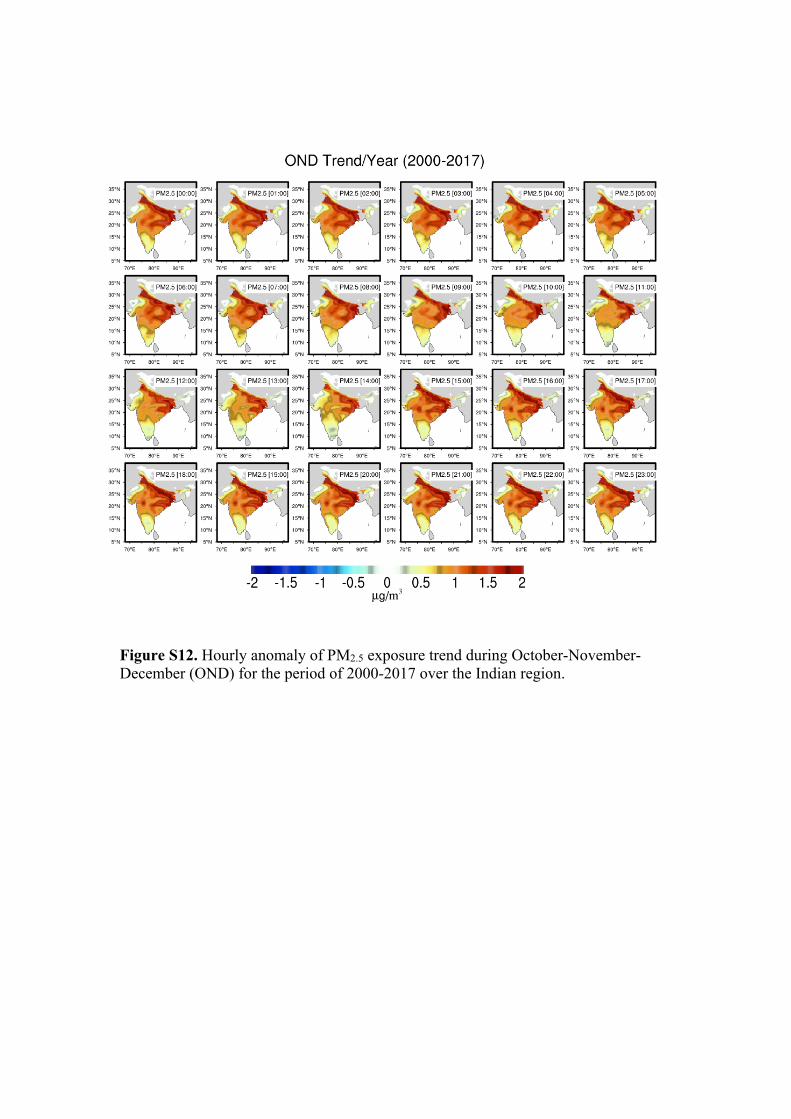
Figure S12. Hourly anomaly of PM2.5 exposure trend during October-November-December (OND) for the period of 2000-2017 over the Indian region.
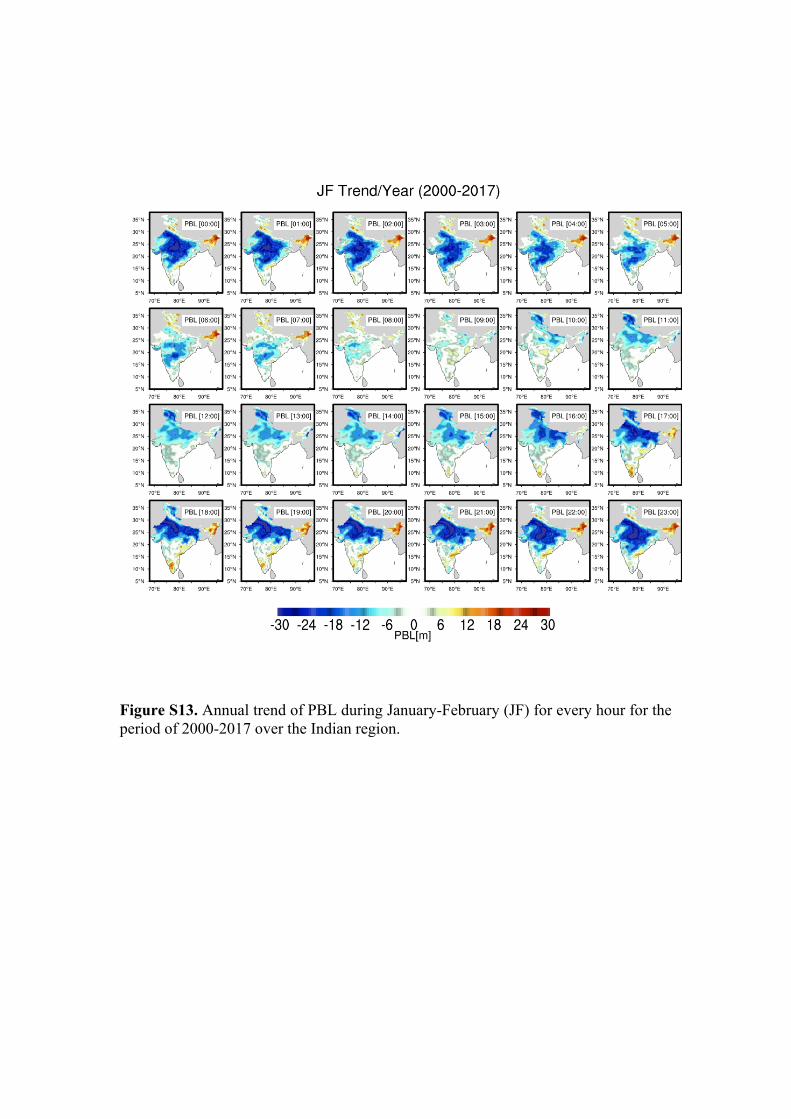
Figure S13. Annual trend of PBL during January-February (JF) for every hour for the period of 2000-2017 over the Indian region.

Figure S14. Annual trend of PBL during March-April-May (MAM) for every hour for the period of 2000-2017 over the Indian region.
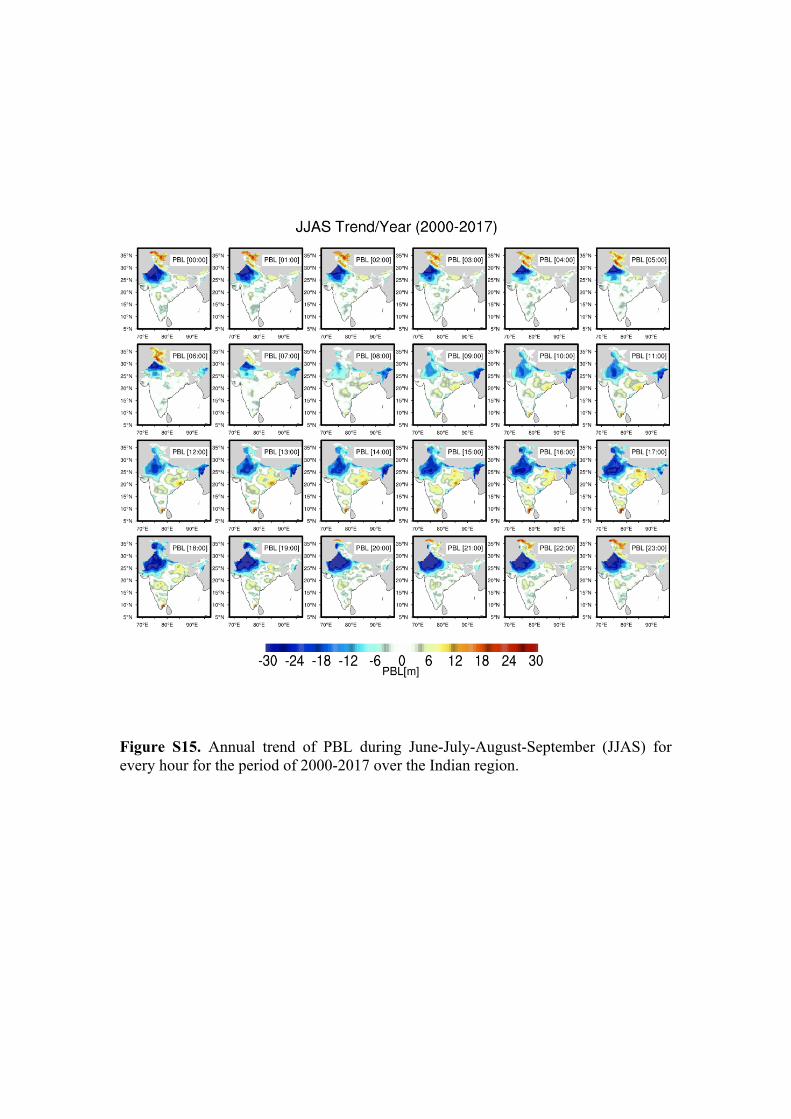
Figure S15. Annual trend of PBL during June-July-August-September (JJAS) for every hour for the period of 2000-2017 over the Indian region.
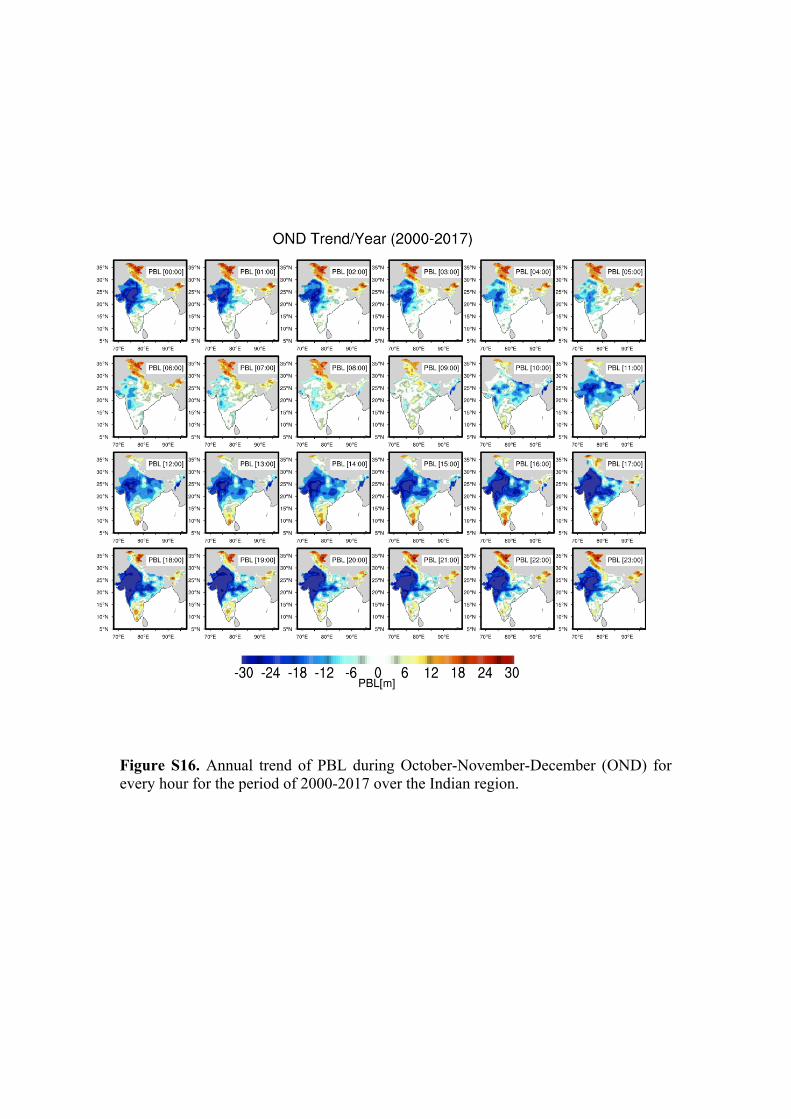
Figure S16. Annual trend of PBL during October-November-December (OND) for every hour for the period of 2000-2017 over the Indian region.

Figure S17. Annual trend of BC for every hour for the period of 2000-2017 over the Indian region.
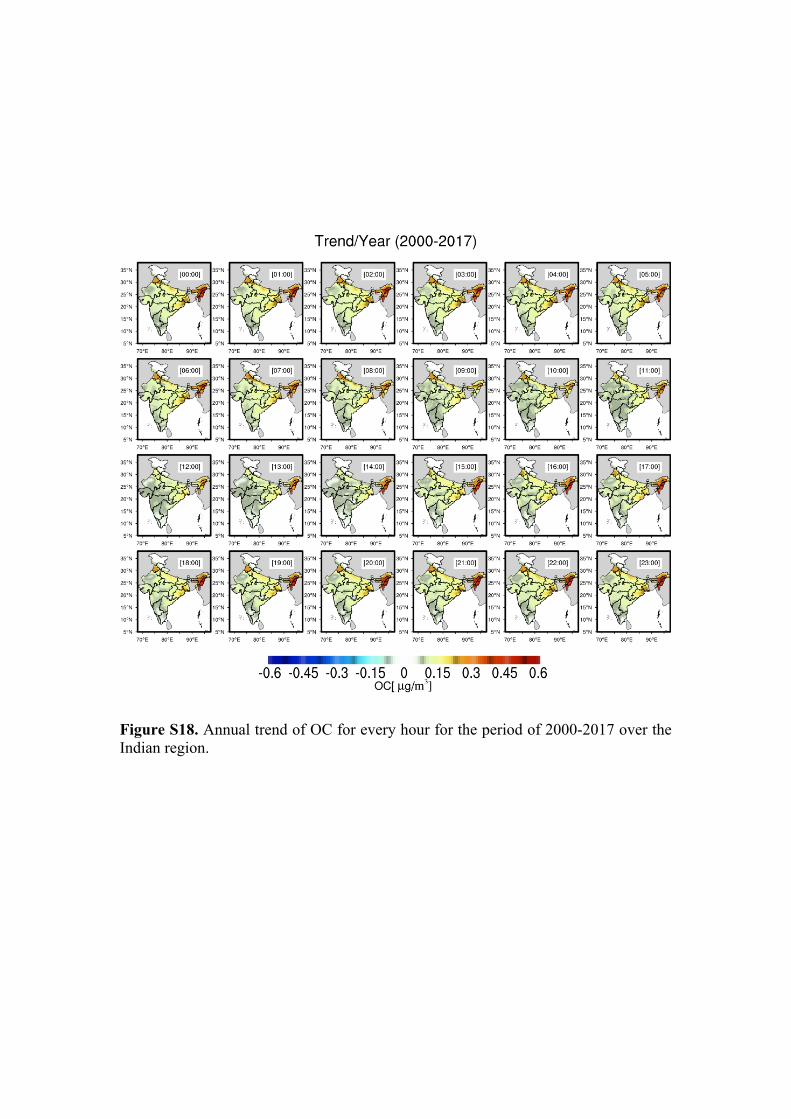
Figure S18. Annual trend of OC for every hour for the period of 2000-2017 over the Indian region.
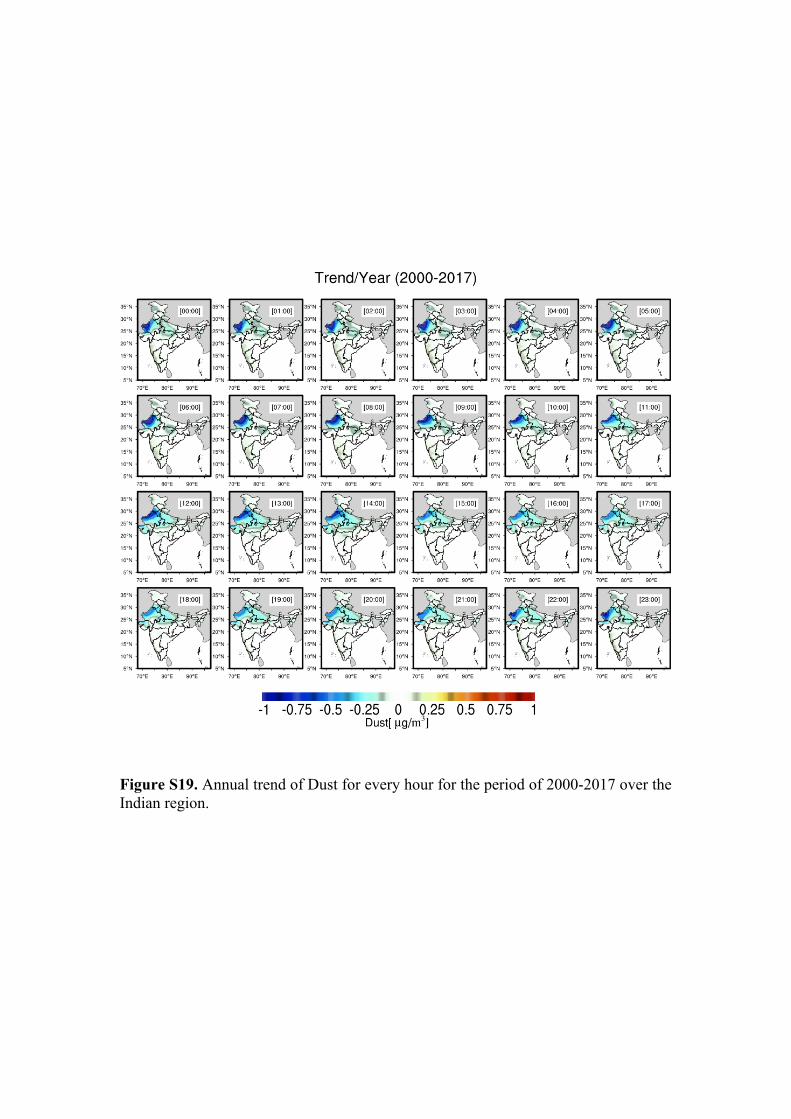
Figure S19. Annual trend of Dust for every hour for the period of 2000-2017 over the Indian region.
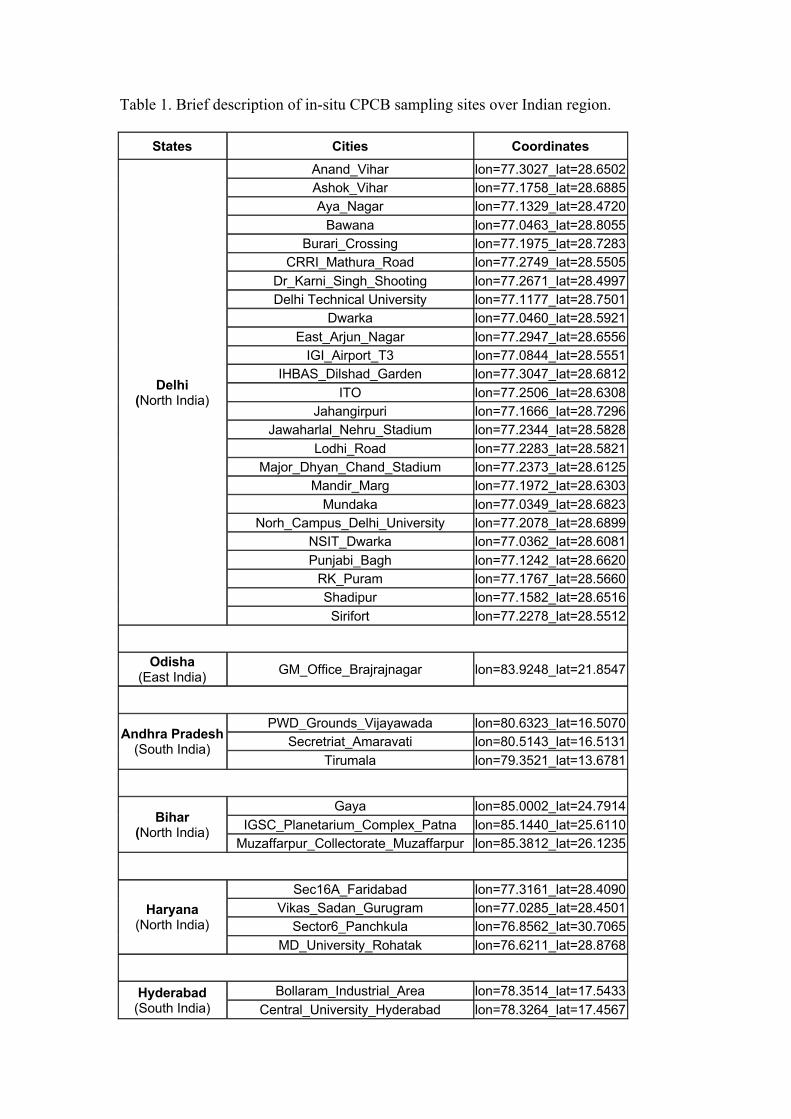
Table 1. Brief description of in-situ CPCB sampling sites over Indian region.
States Cities Coordinates
Delhi (North India)
Anand_Vihar lon=77.3027_lat=28.6502 Ashok_Vihar lon=77.1758_lat=28.6885 Aya_Nagar lon=77.1329_lat=28.4720
Bawana lon=77.0463_lat=28.8055 Burari_Crossing lon=77.1975_lat=28.7283
CRRI_Mathura_Road lon=77.2749_lat=28.5505 Dr_Karni_Singh_Shooting lon=77.2671_lat=28.4997 Delhi Technical University lon=77.1177_lat=28.7501
Dwarka lon=77.0460_lat=28.5921 East_Arjun_Nagar lon=77.2947_lat=28.6556
IGI_Airport_T3 lon=77.0844_lat=28.5551 IHBAS_Dilshad_Garden lon=77.3047_lat=28.6812
ITO lon=77.2506_lat=28.6308 Jahangirpuri lon=77.1666_lat=28.7296
Jawaharlal_Nehru_Stadium lon=77.2344_lat=28.5828 Lodhi_Road lon=77.2283_lat=28.5821
Major_Dhyan_Chand_Stadium lon=77.2373_lat=28.6125 Mandir_Marg lon=77.1972_lat=28.6303
Mundaka lon=77.0349_lat=28.6823 Norh_Campus_Delhi_University lon=77.2078_lat=28.6899
NSIT_Dwarka lon=77.0362_lat=28.6081 Punjabi_Bagh lon=77.1242_lat=28.6620
RK_Puram lon=77.1767_lat=28.5660 Shadipur lon=77.1582_lat=28.6516 Sirifort lon=77.2278_lat=28.5512
Odisha (East India) GM_Office_Brajrajnagar lon=83.9248_lat=21.8547
Andhra Pradesh (South India)
PWD_Grounds_Vijayawada lon=80.6323_lat=16.5070 Secretriat_Amaravati lon=80.5143_lat=16.5131
Tirumala lon=79.3521_lat=13.6781
Bihar (North India)
Gaya lon=85.0002_lat=24.7914 IGSC_Planetarium_Complex_Patna lon=85.1440_lat=25.6110
Muzaffarpur_Collectorate_Muzaffarpur lon=85.3812_lat=26.1235
Haryana (North India)
Sec16A_Faridabad lon=77.3161_lat=28.4090 Vikas_Sadan_Gurugram lon=77.0285_lat=28.4501
Sector6_Panchkula lon=76.8562_lat=30.7065 MD_University_Rohatak lon=76.6211_lat=28.8768
Hyderabad (South India)
Bollaram_Industrial_Area lon=78.3514_lat=17.5433 Central_University_Hyderabad lon=78.3264_lat=17.4567

ICRISAT_Patancheru_Hyderabad lon=78.2752_lat=17.5111 IDA_Pashamylaram_Hyderabad lon=78.1849_lat=17.5325
Sanathnagar lon=78.4434_lat=17.4527 Zoopark lon=78.4518_lat=17.3507
Karnataka (South India)
BTM_Layout_Bengaluru lon=77.6101_lat=12.9166 Peenya_Bengaluru lon=77.5197_lat=13.0285
Kerala (South India) Plammoodu_Thiruvananthpuram lon=76.9477_lat=8.5141
Maharashtra (Middle India)
More_Chowk_Waluj_Aurangabad lon=75.2466_lat=19.8406 Chandrapur lon=79.3015_lat=19.9705
MIDC_Khutala_Chandrapur lon=79.2359_lat=19.9775 Bandra_Mumbai lon=72.8362_lat=19.0607
Opp_GPO_Civil_Lines_Nagpur lon=79.0693_lat=21.1525 Gangapur_Road_Nashik lon=73.7590_lat=20.0204
Airoli_Navi_Mumbai lon=72.9935_lat=19.1579 Solapur lon=75.9064_lat=17.6599
Madhya Pradesh (Middle India)
Bhopal_Chauraha_Dewas lon=76.0605_lat=22.9642 Sec2_Industrial_Area_Pithampur lon=75.6674_lat=22.6355
Vindhyachal_STPS_Singrauli lon=82.6716_lat=24.0960 Mahakaleshwar_Temple_Ujjain lon=75.7682_lat=23.1827
Punjab (North India)
Golden_Temple_Amritsar lon=74.8765_lat=31.6200 Punjab_Agricultural_University_Ludhiana lon=75.8078_lat=30.9019
Rajasthan (West India)
Civil_Lines_Ajmer lon=74.6415_lat=26.4727 Moti_Doongri_Alwar lon=76.6081_lat=27.5516
RIICO_Ind_AreaIII_Bhiwadi lon=76.8576_lat=28.2070 Adarsh_Nagar_Jaipur lon=75.8272_lat=26.9018
Police_Commissionerate_Jaipur lon=75.8017_lat=26.9164 Shastri_Nagar_Jaipur lon=75.8009_lat=26.9503 Collectorate_Jodhpur lon=73.0367_lat=26.2918 Shrinath_Puram_Kota lon=75.8214_lat=25.1372
Indira_Colony_Vistar_Pali lon=73.3502_lat=25.7731 Ashok_Nagar_Udaipur lon=73.7022_lat=24.5886
Tamil Nadu (South India)
Alandur_Bus_Depot_Chennai lon=80.1917_lat=12.9970 Manali_Chennai lon=80.2586_lat=13.1636
Velachery_Res_Area_Chennai lon=80.2390_lat=13.0050
Uttar Pradesh (North India)
Sanjay_Palace_Agra lon=78.0060_lat=27.1987 Adarsh_Nagar_Jaipur lon=77.3698_lat=28.6636 Nehru_Nagar_Kanpur lon=80.3238_lat=26.4716
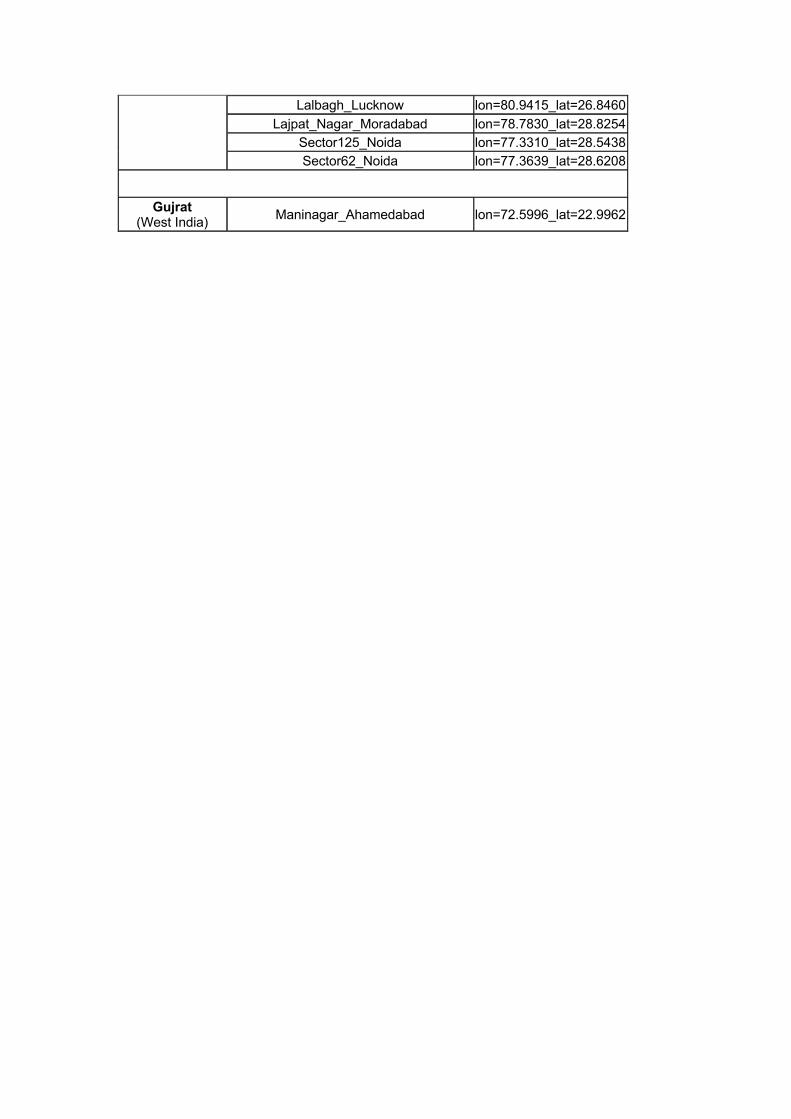
Lalbagh_Lucknow lon=80.9415_lat=26.8460 Lajpat_Nagar_Moradabad lon=78.7830_lat=28.8254
Sector125_Noida lon=77.3310_lat=28.5438 Sector62_Noida lon=77.3639_lat=28.6208
Gujrat (West India) Maninagar_Ahamedabad lon=72.5996_lat=22.9962