Embed Size (px)
Citation preview
SUPPLEMENTARY INFORMATION: AN INTEGRATED PARADIGM FOR CELLULOSIC
BIOREFINERIES: UTILIZATION OF LIGNOCELLULOSIC BIOMASS AS SELF SUFFICIENT
FEEDSTOCKS FOR FUEL, FOOD PRECURSORS AND SACCHAROLYTIC ENZYME PRODUCTION.
Ming W Lau1, Bryan D Bals1, Shishir P S Chundawat1, Mingjie Jin1, Christa Gunawan1, Venkatesh
Balan1, A Daniel Jones2 and Bruce E Dale1
AUTHOR AFFILIATIONS 1Department of Chemical Engineering and Materials Science, DOE Great Lakes Bioenergy
Research Center, Michigan State University, 3900 Collins Rd, Lansing, MI 48910, USA 2Department of Biochemistry and Molecular Biology, Michigan State University, 212
Biochemistry, East Lansing, MI 48824, USA
CORRESPONDING AUTHOR
Bruce E Dale ([email protected])
Ming W Lau ([email protected])
Electronic Supplementary Material (ESI) for Energy & Environmental ScienceThis journal is © The Royal Society of Chemistry 2012
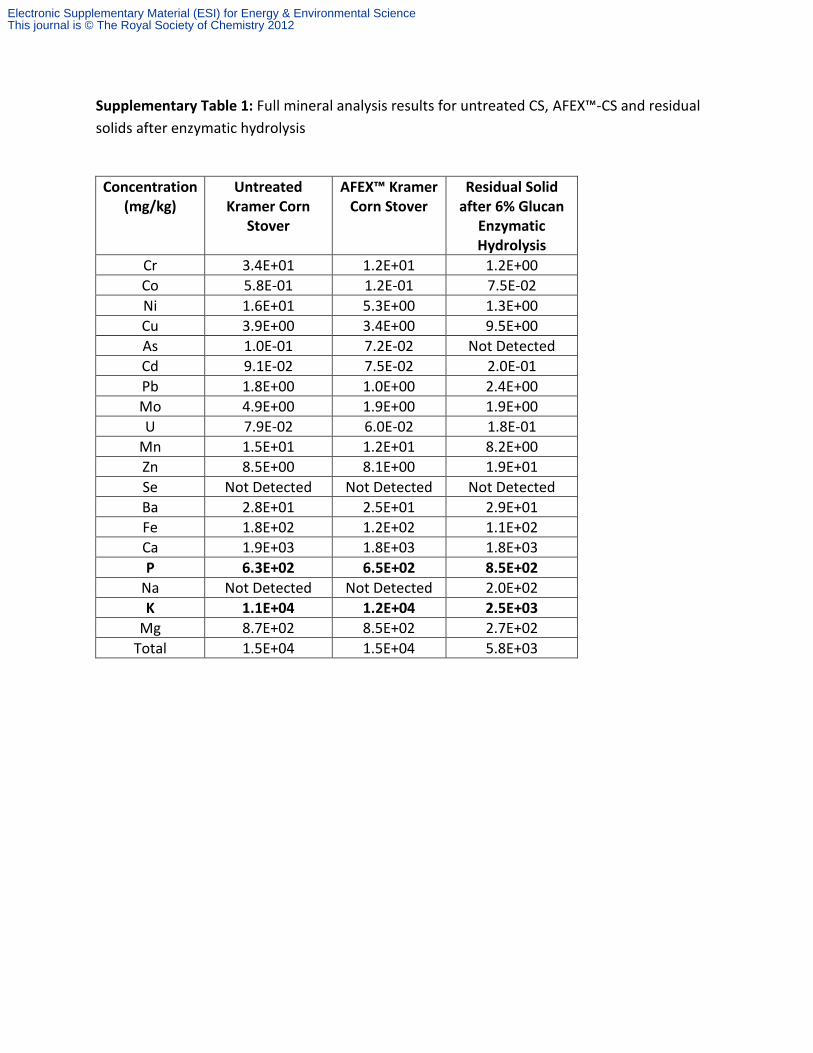
Supplementary Table 1: Full mineral analysis results for untreated CS, AFEX™-CS and residual
solids after enzymatic hydrolysis
Concentration (mg/kg)
Untreated Kramer Corn
Stover
AFEX™ Kramer Corn Stover
Residual Solid after 6% Glucan
Enzymatic Hydrolysis
Cr 3.4E+01 1.2E+01 1.2E+00
Co 5.8E-01 1.2E-01 7.5E-02
Ni 1.6E+01 5.3E+00 1.3E+00
Cu 3.9E+00 3.4E+00 9.5E+00
As 1.0E-01 7.2E-02 Not Detected
Cd 9.1E-02 7.5E-02 2.0E-01
Pb 1.8E+00 1.0E+00 2.4E+00
Mo 4.9E+00 1.9E+00 1.9E+00
U 7.9E-02 6.0E-02 1.8E-01
Mn 1.5E+01 1.2E+01 8.2E+00
Zn 8.5E+00 8.1E+00 1.9E+01
Se Not Detected Not Detected Not Detected
Ba 2.8E+01 2.5E+01 2.9E+01
Fe 1.8E+02 1.2E+02 1.1E+02
Ca 1.9E+03 1.8E+03 1.8E+03
P 6.3E+02 6.5E+02 8.5E+02
Na Not Detected Not Detected 2.0E+02
K 1.1E+04 1.2E+04 2.5E+03
Mg 8.7E+02 8.5E+02 2.7E+02
Total 1.5E+04 1.5E+04 5.8E+03
Electronic Supplementary Material (ESI) for Energy & Environmental ScienceThis journal is © The Royal Society of Chemistry 2012
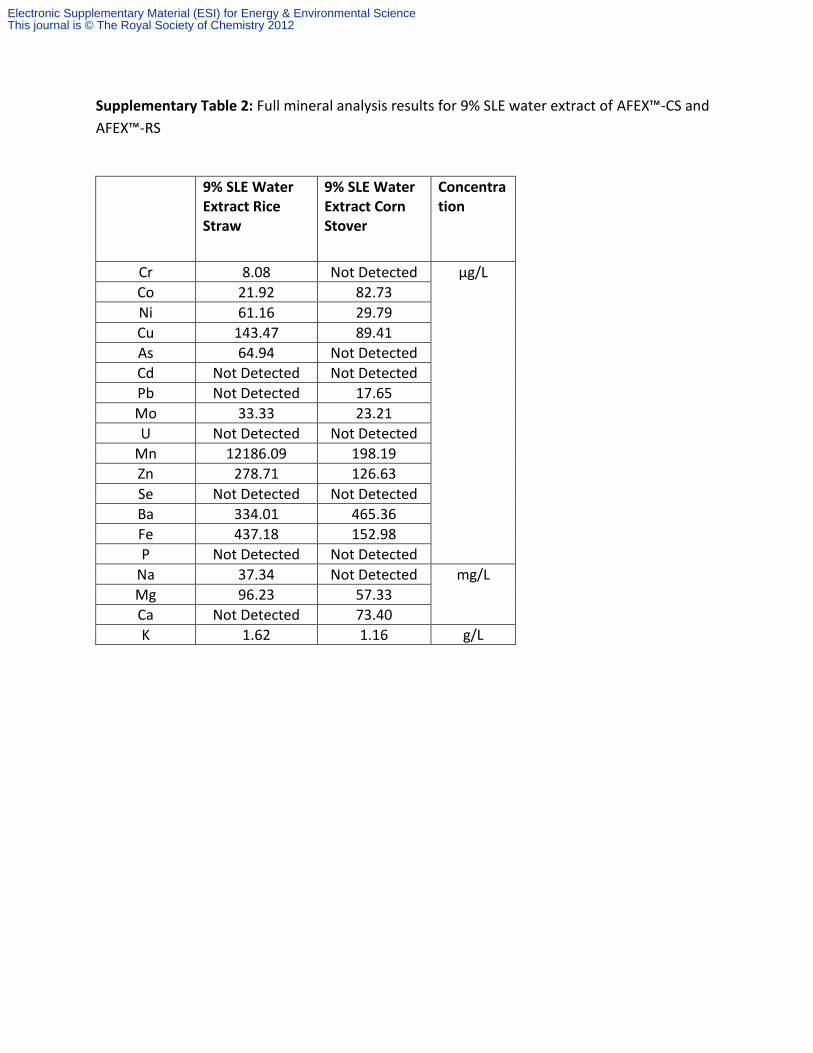
Supplementary Table 2: Full mineral analysis results for 9% SLE water extract of AFEX™-CS and
AFEX™-RS
9% SLE Water Extract Rice Straw
9% SLE Water Extract Corn Stover
Concentration
Cr 8.08 Not Detected µg/L
Co 21.92 82.73
Ni 61.16 29.79
Cu 143.47 89.41
As 64.94 Not Detected
Cd Not Detected Not Detected
Pb Not Detected 17.65
Mo 33.33 23.21
U Not Detected Not Detected
Mn 12186.09 198.19
Zn 278.71 126.63
Se Not Detected Not Detected
Ba 334.01 465.36
Fe 437.18 152.98
P Not Detected Not Detected
Na 37.34 Not Detected mg/L
Mg 96.23 57.33
Ca Not Detected 73.40
K 1.62 1.16 g/L
Electronic Supplementary Material (ESI) for Energy & Environmental ScienceThis journal is © The Royal Society of Chemistry 2012
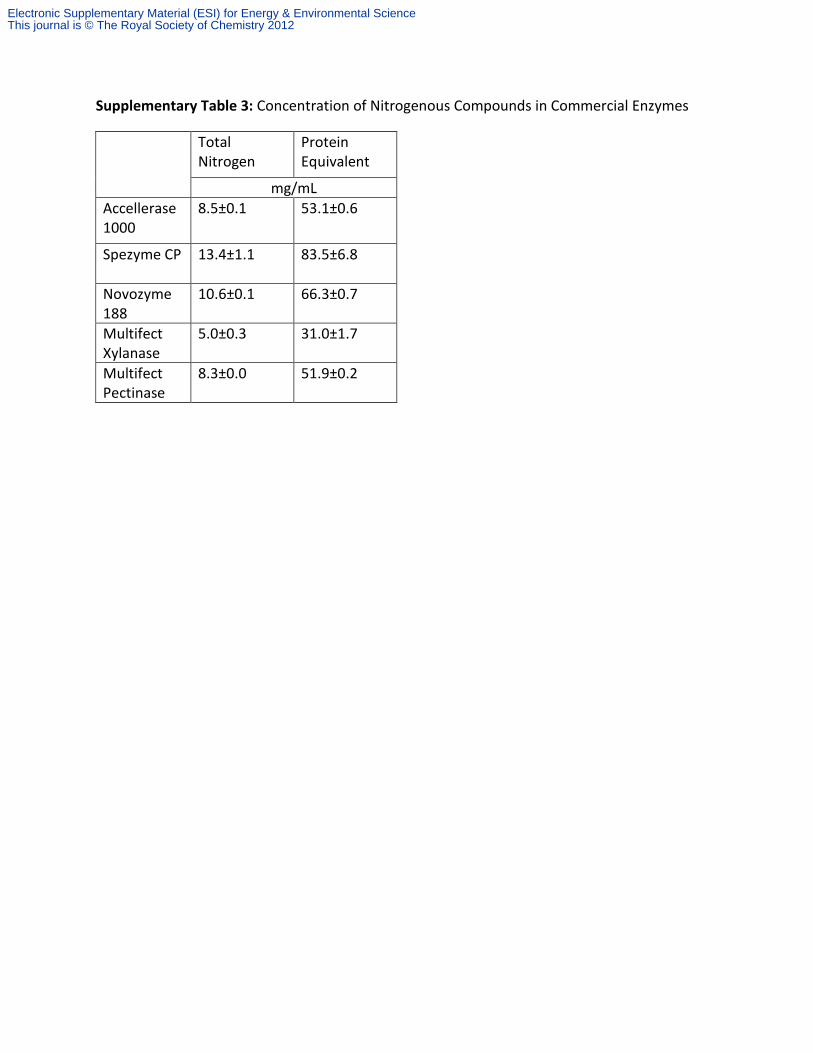
Supplementary Table 3: Concentration of Nitrogenous Compounds in Commercial Enzymes
Total Nitrogen
Protein Equivalent
mg/mL
Accellerase 1000
8.5±0.1 53.1±0.6
Spezyme CP 13.4±1.1 83.5±6.8
Novozyme 188
10.6±0.1 66.3±0.7
Multifect Xylanase
5.0±0.3 31.0±1.7
Multifect Pectinase
8.3±0.0 51.9±0.2
Electronic Supplementary Material (ESI) for Energy & Environmental ScienceThis journal is © The Royal Society of Chemistry 2012
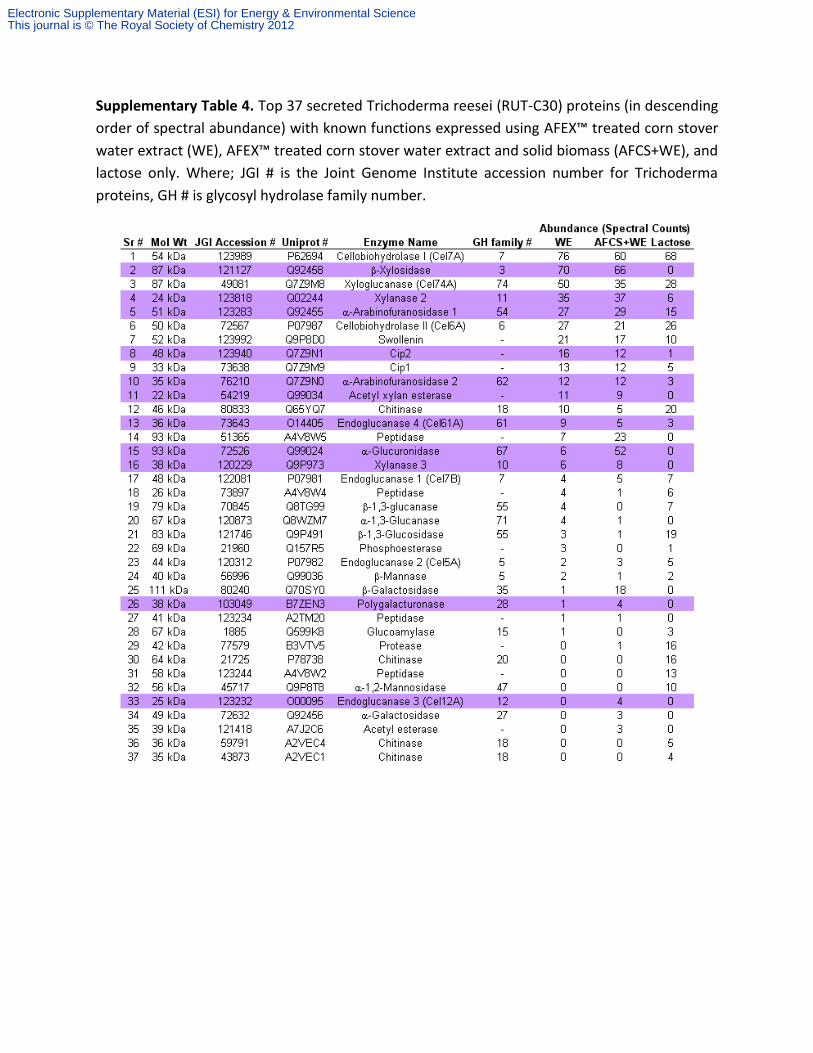
Supplementary Table 4. Top 37 secreted Trichoderma reesei (RUT-C30) proteins (in descending
order of spectral abundance) with known functions expressed using AFEX™ treated corn stover
water extract (WE), AFEX™ treated corn stover water extract and solid biomass (AFCS+WE), and
lactose only. Where; JGI # is the Joint Genome Institute accession number for Trichoderma
proteins, GH # is glycosyl hydrolase family number.
Electronic Supplementary Material (ESI) for Energy & Environmental ScienceThis journal is © The Royal Society of Chemistry 2012
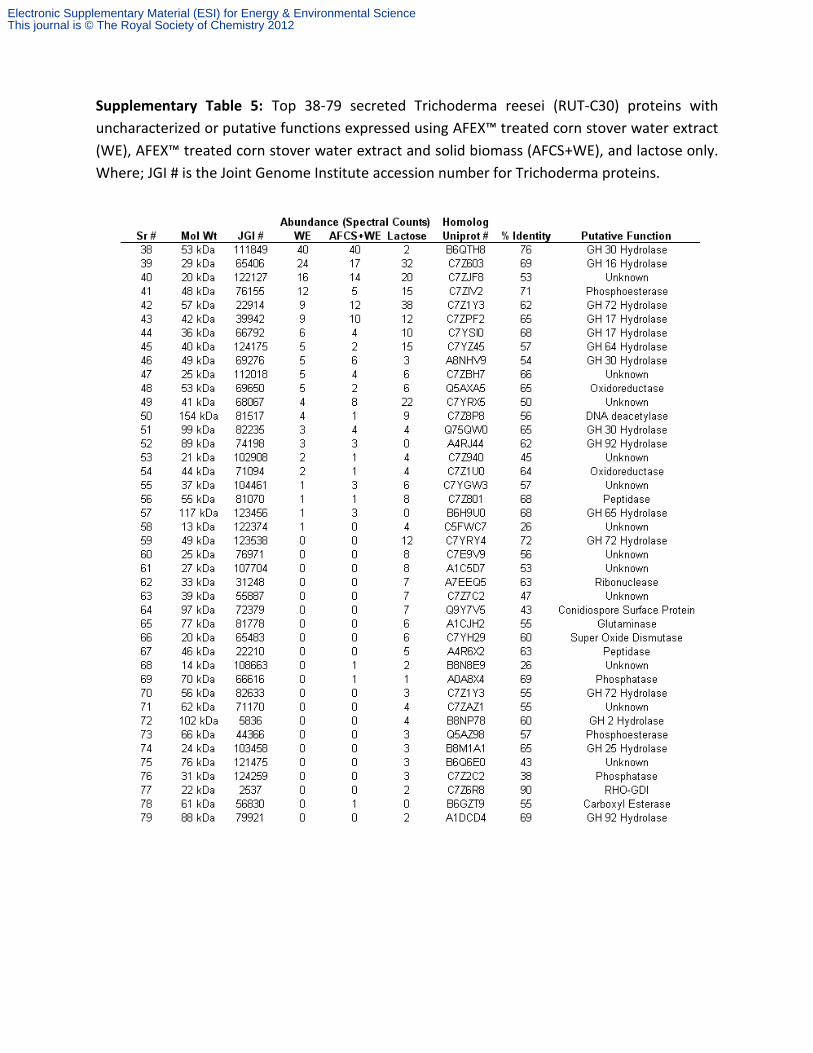
Supplementary Table 5: Top 38-79 secreted Trichoderma reesei (RUT-C30) proteins with
uncharacterized or putative functions expressed using AFEX™ treated corn stover water extract
(WE), AFEX™ treated corn stover water extract and solid biomass (AFCS+WE), and lactose only.
Where; JGI # is the Joint Genome Institute accession number for Trichoderma proteins.
Electronic Supplementary Material (ESI) for Energy & Environmental ScienceThis journal is © The Royal Society of Chemistry 2012
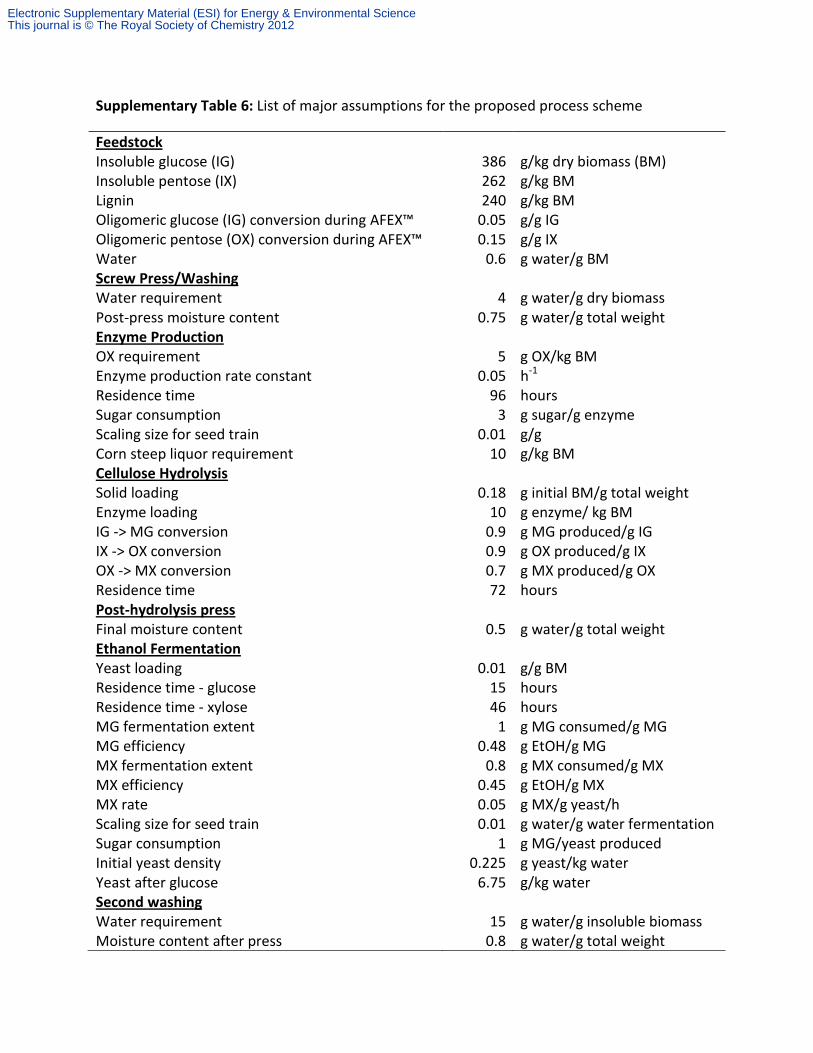
Supplementary Table 6: List of major assumptions for the proposed process scheme
Feedstock Insoluble glucose (IG) 386 g/kg dry biomass (BM) Insoluble pentose (IX) 262 g/kg BM Lignin 240 g/kg BM Oligomeric glucose (IG) conversion during AFEX™ 0.05 g/g IG Oligomeric pentose (OX) conversion during AFEX™ 0.15 g/g IX Water 0.6 g water/g BM Screw Press/Washing Water requirement 4 g water/g dry biomass Post-press moisture content 0.75 g water/g total weight Enzyme Production OX requirement 5 g OX/kg BM Enzyme production rate constant 0.05 h-1
Residence time 96 hours Sugar consumption 3 g sugar/g enzyme Scaling size for seed train 0.01 g/g Corn steep liquor requirement 10 g/kg BM Cellulose Hydrolysis Solid loading 0.18 g initial BM/g total weight Enzyme loading 10 g enzyme/ kg BM IG -> MG conversion 0.9 g MG produced/g IG IX -> OX conversion 0.9 g OX produced/g IX OX -> MX conversion 0.7 g MX produced/g OX Residence time 72 hours Post-hydrolysis press Final moisture content 0.5 g water/g total weight Ethanol Fermentation Yeast loading 0.01 g/g BM Residence time - glucose 15 hours Residence time - xylose 46 hours MG fermentation extent 1 g MG consumed/g MG MG efficiency 0.48 g EtOH/g MG MX fermentation extent 0.8 g MX consumed/g MX MX efficiency 0.45 g EtOH/g MX MX rate 0.05 g MX/g yeast/h Scaling size for seed train 0.01 g water/g water fermentation Sugar consumption 1 g MG/yeast produced Initial yeast density 0.225 g yeast/kg water Yeast after glucose 6.75 g/kg water Second washing Water requirement 15 g water/g insoluble biomass Moisture content after press 0.8 g water/g total weight
Electronic Supplementary Material (ESI) for Energy & Environmental ScienceThis journal is © The Royal Society of Chemistry 2012
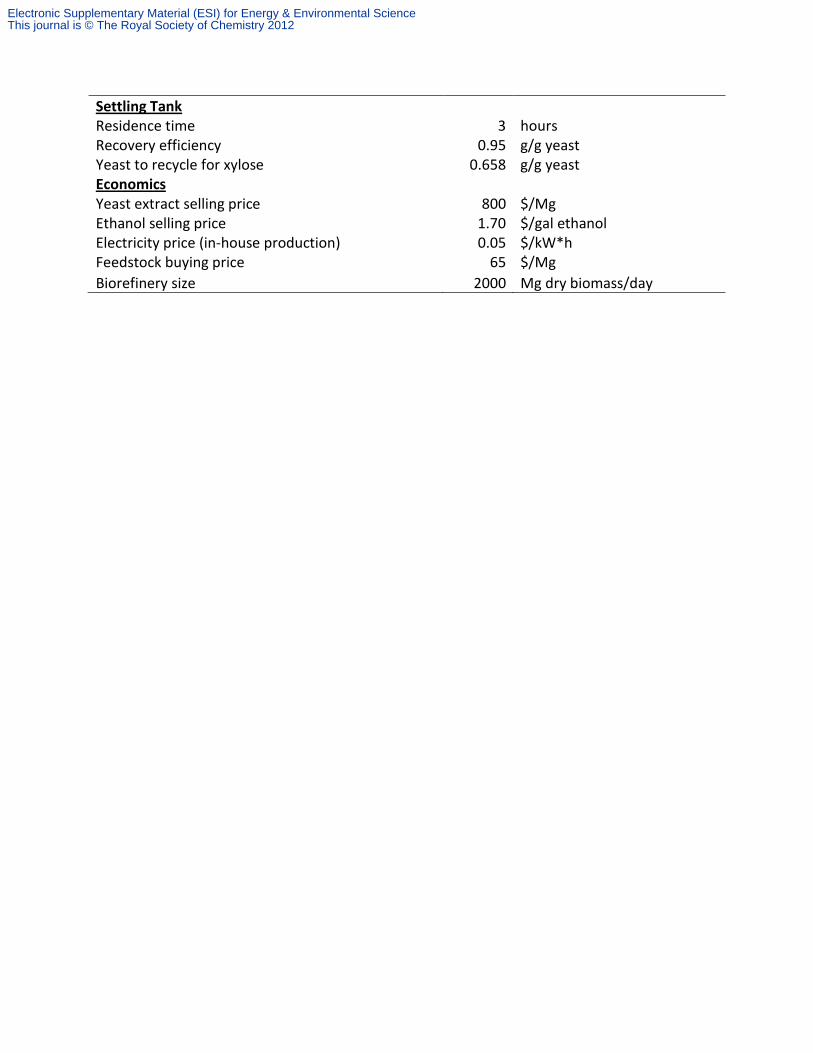
Settling Tank Residence time 3 hours Recovery efficiency 0.95 g/g yeast Yeast to recycle for xylose 0.658 g/g yeast Economics Yeast extract selling price 800 $/Mg Ethanol selling price 1.70 $/gal ethanol Electricity price (in-house production) 0.05 $/kW*h Feedstock buying price 65 $/Mg
Biorefinery size 2000 Mg dry biomass/day
Electronic Supplementary Material (ESI) for Energy & Environmental ScienceThis journal is © The Royal Society of Chemistry 2012
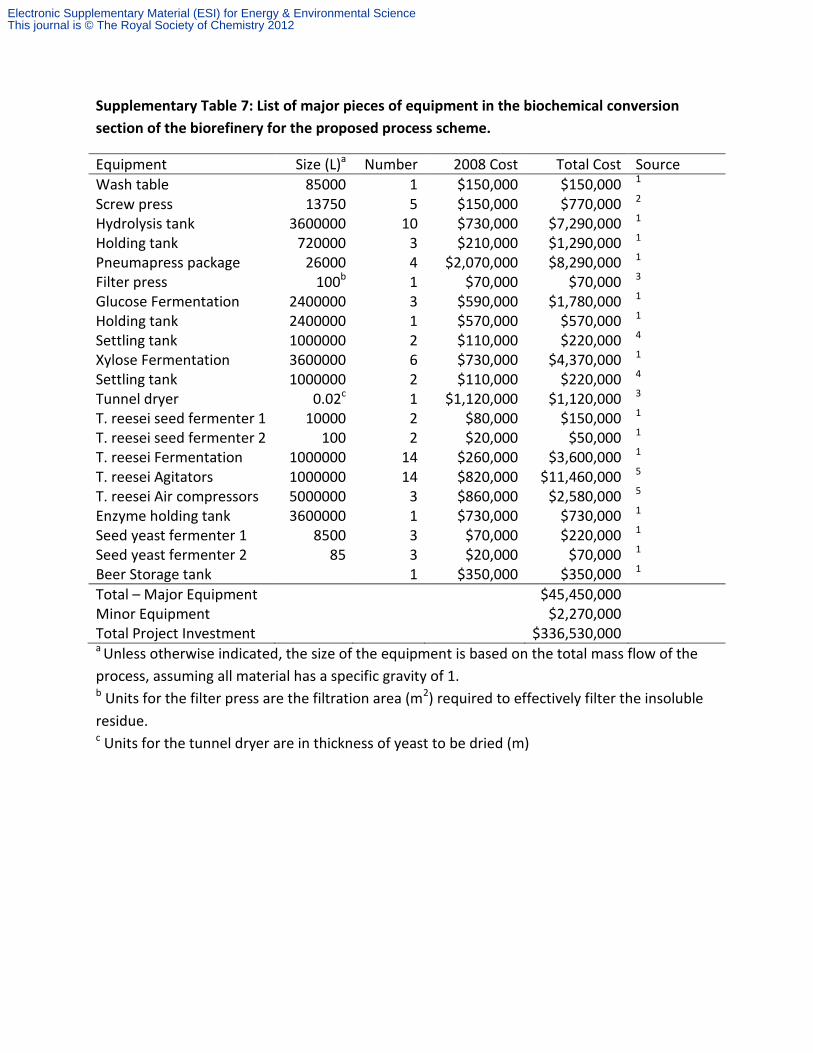
Supplementary Table 7: List of major pieces of equipment in the biochemical conversion
section of the biorefinery for the proposed process scheme.
Equipment Size (L)a Number 2008 Cost Total Cost Source
Wash table 85000 1 $150,000 $150,000 1 Screw press 13750 5 $150,000 $770,000 2 Hydrolysis tank 3600000 10 $730,000 $7,290,000 1 Holding tank 720000 3 $210,000 $1,290,000 1 Pneumapress package 26000 4 $2,070,000 $8,290,000 1 Filter press 100b 1 $70,000 $70,000 3 Glucose Fermentation 2400000 3 $590,000 $1,780,000 1 Holding tank 2400000 1 $570,000 $570,000 1 Settling tank 1000000 2 $110,000 $220,000 4 Xylose Fermentation 3600000 6 $730,000 $4,370,000 1 Settling tank 1000000 2 $110,000 $220,000 4 Tunnel dryer 0.02c 1 $1,120,000 $1,120,000 3 T. reesei seed fermenter 1 10000 2 $80,000 $150,000 1 T. reesei seed fermenter 2 100 2 $20,000 $50,000 1 T. reesei Fermentation 1000000 14 $260,000 $3,600,000 1 T. reesei Agitators 1000000 14 $820,000 $11,460,000 5 T. reesei Air compressors 5000000 3 $860,000 $2,580,000 5 Enzyme holding tank 3600000 1 $730,000 $730,000 1 Seed yeast fermenter 1 8500 3 $70,000 $220,000 1 Seed yeast fermenter 2 85 3 $20,000 $70,000 1 Beer Storage tank 1 $350,000 $350,000 1
Total – Major Equipment $45,450,000 Minor Equipment $2,270,000 Total Project Investment $336,530,000 a Unless otherwise indicated, the size of the equipment is based on the total mass flow of the
process, assuming all material has a specific gravity of 1. b Units for the filter press are the filtration area (m2) required to effectively filter the insoluble
residue. c Units for the tunnel dryer are in thickness of yeast to be dried (m)
Electronic Supplementary Material (ESI) for Energy & Environmental ScienceThis journal is © The Royal Society of Chemistry 2012
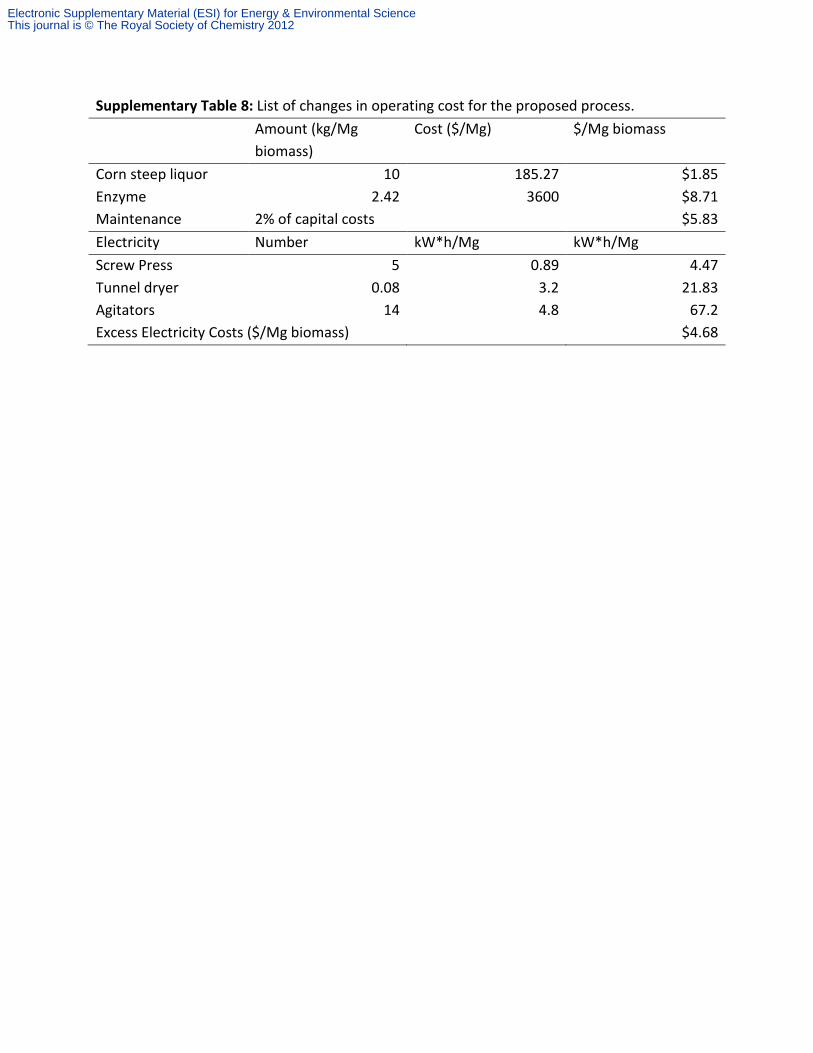
Supplementary Table 8: List of changes in operating cost for the proposed process.
Amount (kg/Mg
biomass)
Cost ($/Mg) $/Mg biomass
Corn steep liquor 10 185.27 $1.85
Enzyme 2.42 3600 $8.71
Maintenance 2% of capital costs $5.83
Electricity Number kW*h/Mg kW*h/Mg
Screw Press 5 0.89 4.47
Tunnel dryer 0.08 3.2 21.83
Agitators 14 4.8 67.2
Excess Electricity Costs ($/Mg biomass) $4.68
Electronic Supplementary Material (ESI) for Energy & Environmental ScienceThis journal is © The Royal Society of Chemistry 2012
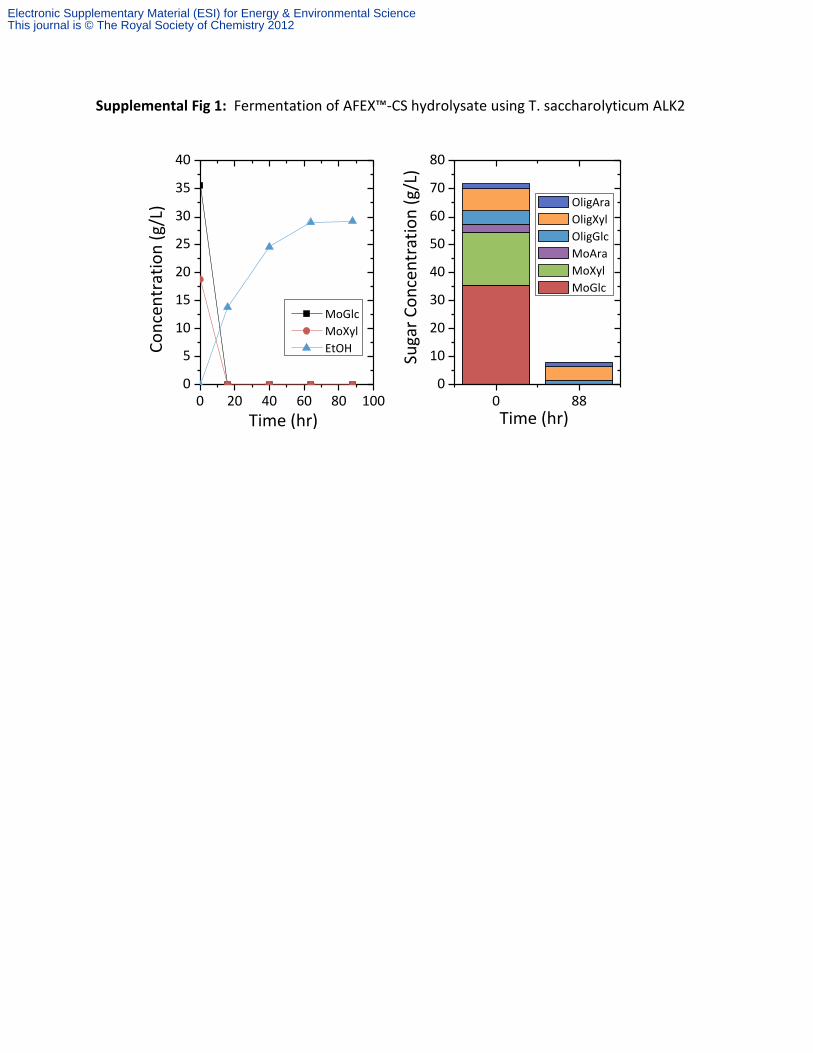
Supplemental Fig 1: Fermentation of AFEX™-CS hydrolysate using T. saccharolyticum ALK2
0 20 40 60 80 1000
5
10
15
20
25
30
35
40
Co
nce
ntr
atio
n (
g/L)
Time (hr)
MoGlc
MoXyl
EtOH
0 880
10
20
30
40
50
60
70
80
Suga
r C
on
cen
trat
ion
(g/
L)Time (hr)
OligAra
OligXyl
OligGlc
MoAra
MoXyl
MoGlc
Electronic Supplementary Material (ESI) for Energy & Environmental ScienceThis journal is © The Royal Society of Chemistry 2012
Supplementary Methods
18% SLE water extract preparation
AFEX™-pretreated corn stover was washed with distilled water at a ratio of 1 g dry AFEX™-CS to
4.6 g of water to produce an aqueous extract (18% solids loading equivalent). In each batch of
washing, distilled water was preheated to 60-70°C and added to 100 g (dry weight equivalent)
of AFEX™-CS. The water content of the wetted AFEX™-CS was reduced by pressing. The washing
was conducted in three cycles, i.e. water-extract from a previous cycle of washing was used for
the next cycle of washing. In the final cycle of washing, the moisture content of the washed
AFEX™-CS was reduced to 77±3%. The AFEX™-CS water extract was used for the fermentation.
The preparation steps were as before 6. The total sugar solubilized was calculated by
multiplying total soluble sugar in the water extract with total volume of the water extract from
a given mass of dry AFEX™-CS.
Nutrient Content Analysis
Ammonia
Free ammonia in AFEX™-CS hydrolysate was analyzed through an enzymatic assay from R-
biopharm AG (Cat no: 11112732035, Darmstadt, Germany). The solution was diluted to an
appropriate level for assay detection. The level of reduction of NADH, which indicates the
concentration of ammonia in the solution, was measured as the absorbance 340 nm
wavelength using a spectrophotometer. A standard ammonia solution (control experiment) was
tested to ensure the accuracy of the results. Other experimental details and enzymatic
chemistry explanation can be found in the manufacturer’s instruction manuals.
Protein
The analyses for amino acid concentrations on AFEX™-CS hydrolysate were conducted in MSU
Macromolecular Structure Facility through a High Performance Liquid Chromatography (HPLC)
system equipped with a Nova Pak C18 (3.9mm×150mm; Waters). Operational details of the
system were as described 7. The amino acids involved in the analysis are Asp, Glu, Ser, Gly, His,
Thr, Arg, Ala, Pro, Tyr, Val, Met, Ile, Lys and Phe.
Free Amino Acids
500 µL of each of the respective solutions were filtered (Millipore Centricon), 20uL of the
filtered elute was derivatized with AccQ Tag (Waters), 10% of the total derivatized sample
was injected into the HPLC system.
Protein Amino Acids
Electronic Supplementary Material (ESI) for Energy & Environmental ScienceThis journal is © The Royal Society of Chemistry 2012
The three solutions were dried under vacuum (SpeedVac, Savant) and hydrolyzed with 6N
HCl at vapor phase at 100°C for 24 hrs. The hydrolyzed dry samples were solubilized in 100
µL of 20mM HCl and 10µL of the mixture was derivatized with AccQTag (Waters). 10% of
the derivatized mixture was injected into a Nova Pak C18 (3.9mm×150mm; Waters).
Total Nitrogen Content
Nitrogen content of the dry untreated CS, AFEX™-treated CS, solid residue, enzyme solution and
AFEX™-CS hydrolysate were determined using a Skalar Primacs SN Total Nitrogen Analyzer
(Breda, The Netherlands). Liquid samples (1 mL) were dried at 110°C overnight prior to the
analysis. The nitrogen analysis is based on the Dumas method using EDTA as the standards.
Nitrogen content of the samples was calculated by dividing nitrogen content (g) of the analyzed
materials by weight or volume of the samples.
Minerals
Trace elements were measured by inductively-coupled-plasma mass spectrometry (ICP-MS) in
the MSU Department of Geological Sciences.
Liquid Samples:
Approximately 1 mL of liquid sample was digested on a hot plate, sub-boiling, in acid cleaned
Teflon savillex beakers using 1.9 mL Optima nitric acid and 0.1 mL trace metal clean
hydrofluoric acid for 24 hours. After digestion 0.250 mL of trace metal clean 30% hydrogen
peroxide was added and the sample evaporated to near dryness on a hotplate. Samples were
then brought up to final volume with 5 mL of 2% Optima nitric acid, visual inspection showed a
complete digestion of all samples. This solution was run in the ICP-MS for full mass scan
analyses.
Solid Samples
Approximately 100 mg of solid samples was added to 5 mL of Optima nitric acid in an acid
cleaned Teflon Savillex vial and sonicated for 60 minutes to homogenize the sample. Then the
samples were digested, sub-boiling, overnight on a hot-plate. After approximately 24 h, 0.1 mL
of trace metal clean hydrofluoric acid and 1 mL of trace metal clean 30% hydrogen peroxide
was added and digested for another 24 hours. Finally the samples were allowed to evaporate
to near dryness and taken up to a final volume of 5 mL with 2% Optima nitric acid. This solution
was run in the ICP-MS for full mass scan analyses.
Electronic Supplementary Material (ESI) for Energy & Environmental ScienceThis journal is © The Royal Society of Chemistry 2012
For major element analysis: potassium (K), magnesium (Mg), calcium (Ca), phosphorus (P), and
sodium (Na) samples were diluted 1:300 prior to analysis. For trace element analysis:
chromium (Cr), cobalt (Co), nickel (Ni), copper (Cu), arsenic (As), cadmium (Cd), lead (Pb),
molybdenum (Mo), uranium (U), manganese (Mn), zinc (Zn), selenium (Se), barium (Ba) and
iron (Fe) samples were run without dilution.
Vitamins
Five vitamins important for industrial fermentations were analyzed using a LC/MS/MS (Quattro
Micro, Waters) using a Water Symmetry C-18 column. The mobile phase was run at 0.3 mL/min
with a gradient of 1 mM perfluoroheptanoic acid and acetonitrile. Mass spectra were acquired
for 6 min using electrospray ionization in positive ion mode. The capillary voltage, extractor
voltage and RF lens voltage was set at 3.17 kV, 4.00 V and 0.3 V, respectively. The source
temperature and desolvation temperature were at 110°C and 350°C. The desolvation gas flow
was set at 400L/hr. Collision energies and source cone potentials were optimized for each
transition using Waters QuanOptimize software. Data was acquired with MassLynx 4.0 and
processed with QuanLynx software.
FermGold™ Corn Steep Liquor (Lot: 154-07) from Cargill, Inc (Minneapolis, MN) was used as the
protein supplement for fermentations. To prepare 20%w/w CSL, 200 g of FermGold™ CSL was
diluted to total volume of 1.0 liter with distilled water after pH was adjusted to 5.0 with reagent
grade KOH. The insoluble solids were separated from the liquid by centrifugation at 5,000 × g
for 30 min. The 20% w/w CSL was sterile-filtered (0.22µm) and used for media preparation.
Determination of Protein Concentration in Complex Enzymes
The protein concentrations of commercial enzymes Accelerase 1000, Spezyme CP, Novozyme
188, Multifect Xylanase, and Multifect Pectinase were determined through nitrogen content
analyses of the protein precipitate. Each complex enzyme was centrifuged (13,000 x g) for 5
min, and 0.20 mL of clear supernatant of the enzyme was combined with 0.25 mL 100% w/v
trichloroacetic acid (TCA) and 0.80 mL distilled water to precipitate the protein in the enzyme
solution. After 5 minute of incubation at 4°C, the mixture was centrifuged at 13,000 x g for 5
min and the supernatant was decanted. The precipitate was washed with 1.0 mL cold (4°C)
acetone twice, each washing was followed by centrifugation and decanting the residual acetone.
The washed protein precipitate was placed in a crucible (a sample holder for nitrogen analyzer)
and dried under vacuum.
Electronic Supplementary Material (ESI) for Energy & Environmental ScienceThis journal is © The Royal Society of Chemistry 2012
Nitrogen content within the precipitate was determined using a Skalar Primacs SN Total
Nitrogen Analyzer (Breda, The Netherlands). The principle behind the nitrogen analysis is based
on the Dumas method using EDTA as the standard. Nitrogen content was converted to protein
content by multiplying a factor of 6.25. Errors represented are standard deviation of duplicate
experiments. The protein concentrations of the respective commercial enzymes analyzed
according to this protocol are presented in S.T. 3
Fed-batch Fermentation of Enzymatic Hydrolysate using enzyme secreting ethanologen
Thermoanaerobacterium saccharolyticum
Fed-batch fermentation was conducted in a custom-made fermenter (NDS Technologies, NJ)
equipped with a pH probe. The fermenter temperature was controlled by an external water
bath recirculation system. Feeding and pH were controlled by Sartorius A plus system
(Goettingen, Germany). Initial volume of the reactor was 120 mL which consisted of 20 mL
enzymatic hydrolysate at 18% solids loading, nutrient supplement and distilled water (for
dilution). For nutrient supplementation, 1.0 g yeast extract, 0.5 g peptone, appropriate levels
of minerals and vitamins was added. The fermentation media was pH-adjusted to 6.2 with KOH
and sparged with nitrogen for about 10 min to create anaerobic condition. The seed culture
(10mL) was inoculated to initiate fermentation. Undiluted 18% solids loading enzymatic
hydrolysate at pH 6.2 (supplemented with 10 g/L yeast extract and 5 g/L peptone), was used as
the feed. Feeding started 4 hr after inoculation at the rate of 4.0 mL/hr until 180 mL of feed
volume was added into the fermenter. Samples were taken at the designated periods. Glucose,
xylose, arabinose (in monomeric form) and ethanol were analyzed using HPLC. Oligomeric
sugars were analyzed through acid hydrolysis based on NREL Protocol LAP-014.
In rich nutrient-supplemented fermentation, nearly to 90% of the total sugars (monomers and
oligomers) in the hydrolysate were consumed, and a metabolic yield of 0.45 g EtOH/ g
consumed sugars was achieved S.F. 1. Fermentation was completed within 64 hr after
inoculation; 15 hr after feeding was concluded. Over 60% of the total oligomeric sugars were
consumed in this time period. We demonstrated that ALK2 is able to grow and produce ethanol
to 30 g/L at 0.45 g/L/hr (0-64hr) from the hydrolysate containing degradation compounds
equivalent to 11.7% solids loading of AFEX™-Corn Stover S.F. 1.
Electronic Supplementary Material (ESI) for Energy & Environmental ScienceThis journal is © The Royal Society of Chemistry 2012
Techno-economic analysis
The techno-economic analysis used in this study is a factor level estimate based on the major
pieces of equipment present in the biological conversion area of a refinery. The initial model
was developed by the National Renewable Energy Laboratory (henceforth referred to as the
NREL model), and includes both traditional saccharification and fermentation 1 as well as
enzyme production 8. The initial model uses dilute acid as a pretreatment method, but was
adapted to AFEX™ pretreatment in a later study developed for the Consortium for Applied
Fundamentals and Innovation project (henceforth referred to as the CAFI model) 9. The
economic assumptions of these three models were used whenever possible. In particular, the
CAFI model was used as the basis of the biorefinery studied.
The baseline conventional approach was based heavily on the CAFI model, but with minor
adjustments in assumptions. In the initial model, total hydrolysis and fermentation time was
168 hours, although current data suggests 72 hours for hydrolysis and 72 hours for
fermentation are sufficient. While simultaneous saccharification and fermentation can occur, it
was not explicitly modeled as such. Instead, hydrolysis and ethanol yields were estimated
based on experimental data 10. We project that improved utilization of oligomers would occur
during fermentation, similar to that shown in S.F. 1. Thus, we project ethanol yields will
increase by 20% compared to current experimental data with S. cerevisae . In comparison, the
CAFI model used 26% higher ethanol yields than that presented in Lau and Dale 9, 10. Feedstock
costs were also increased to $65/Mg, which was estimated to be a viable price for delivered
corn stover 5, 11. Likewise, enzyme costs were changed to $3600/Mg pure enzyme, which at 10
g/kg feedstock is equivalent to approximately $0.50/gal ethanol, a number recently cited by
Genencor and Novozyme as the current state of technology. Finally, all costs were updated to
2008 dollars.
The model used in this study uses $/Mg feedstock as the unit of comparison for all costs and
revenues. For costs, only equipment, fixed costs, and raw materials are considered. The cost
of individual pieces of equipment was estimated based on their size, scaling factor, and the unit
price of a base unit. Only major pieces of equipment were considered. Based on the
equipment list in the NREL model, these pieces consisted of approximately 95% of cost of the
total equipment in the biological conversion area 1. Thus, the total cost was multiplied by 1.05
to compensate for this difference. The final figure was multiplied by 1.243 to obtain the
installed cost, and added to the installed cost of the rest of the refinery ($147 million)12. A Lang
factor of 1.628 was applied to obtain the total project investment 1, and straight-line
depreciation over 20 years was applied to determine the capital cost per Mg feedstock. Fixed
costs include salaries, overhead, maintenance, and insurance, and are all determined in the
same manner as the NREL model. Raw materials included feedstock, cellulase, corn steep
Electronic Supplementary Material (ESI) for Energy & Environmental ScienceThis journal is © The Royal Society of Chemistry 2012
liquor, and all other necessary chemicals for biorefinery operations (ammonia, wastewater
treatment chemicals, etc) which were assumed to be the same as the NREL model.
All heat and power requirements are supplied by burning lignin. No steam is required in the
biological conversion step, and all temperature changes are mild changes. Thus, no changes in
heat requirements were made relative to the NREL model, as it was assumed that heat
integration is possible to supply all changes in energy. For electricity, the added requirements
of presses and agitation for the T. reesei fermentation were included. Because excess
electricity is produced at the biorefinery, changes in electricity use are treated as a change in
revenue, decreasing the revenue generated by selling excess electricity. Native yeast co-
production is dried and sold as-is. While yeast extract has a very high market value $7000-
8000/ metric ton 13, a modest value of $800/Mg of yeast cells is assumed here to account for
further processing. Ethanol selling price is assumed to be $1.70/gal, and electricity selling price
to the grid is $0.05/kWh.
A process flow diagram of the proposed biological conversion approach is shown in Figure 4 A,
B.. A wash table is used to wet the biomass after AFEX™ pretreatment, using diluted recycled
hydrolysate as the water media. The biomass is then dewatered using a screw press. The cost
and performance of the screw press was estimated using a Vincent Corporation twin screw
press, which has been successfully used on lignocellulosic biomass 14. The water effluent is rich
in oligomeric sugars produced during AFEX™ (and recycled from hydrolysis), and is thus used to
induce the T. reesei enzyme production. As an initial approximation, the fungus is assumed to
consume 3 g sugar for every g enzyme produced. Esterbauer et al. 15 report an average
efficiency of 4 g sugar consumed per g enzyme, but also observe efficiencies as high as 2 g sugar
per g enzyme. Due to the improvements in sugar release from oligomers relative to lactose as
reported in this study, the improved efficiency of 3 g sugar per g enzyme seems reasonable.
Enzyme production is modeled as a first order reaction of oligomeric sugar with a rate constant
of 0.05 h-1. This is sufficient to produce 76% of the enzymes required for lignocellulosic
hydrolysis, consistent with the results presented in this study. Total T. reesei fermentation time
was assumed to be 96 hours; this was varied in a later sensitivity analysis.
A total of 10 g corn steep liquor (CSL) was consumed per kg biomass to provide the nutrients
necessary for T. reesei growth and enzyme production. While this is an order of magnitude
lower than the experimental data, the experimental value (~100 g/kg biomass) is not
reasonable in a commercial scale. For the experiments, the corn steep liquor was filtered to
remove insoluble solids, which removes ~35% of the total nitrogen in CSL. Thus, less CSL would
be required in a commercial operation. Furthermore, saccharolytic enzyme loading of 15 mg/g
was used in our experiments to prove the concept of in-house enzyme production. However, in
commercial production, enzyme loading at 3-6 mg/g is shown to be sufficient16. Likewise, the
Electronic Supplementary Material (ESI) for Energy & Environmental ScienceThis journal is © The Royal Society of Chemistry 2012
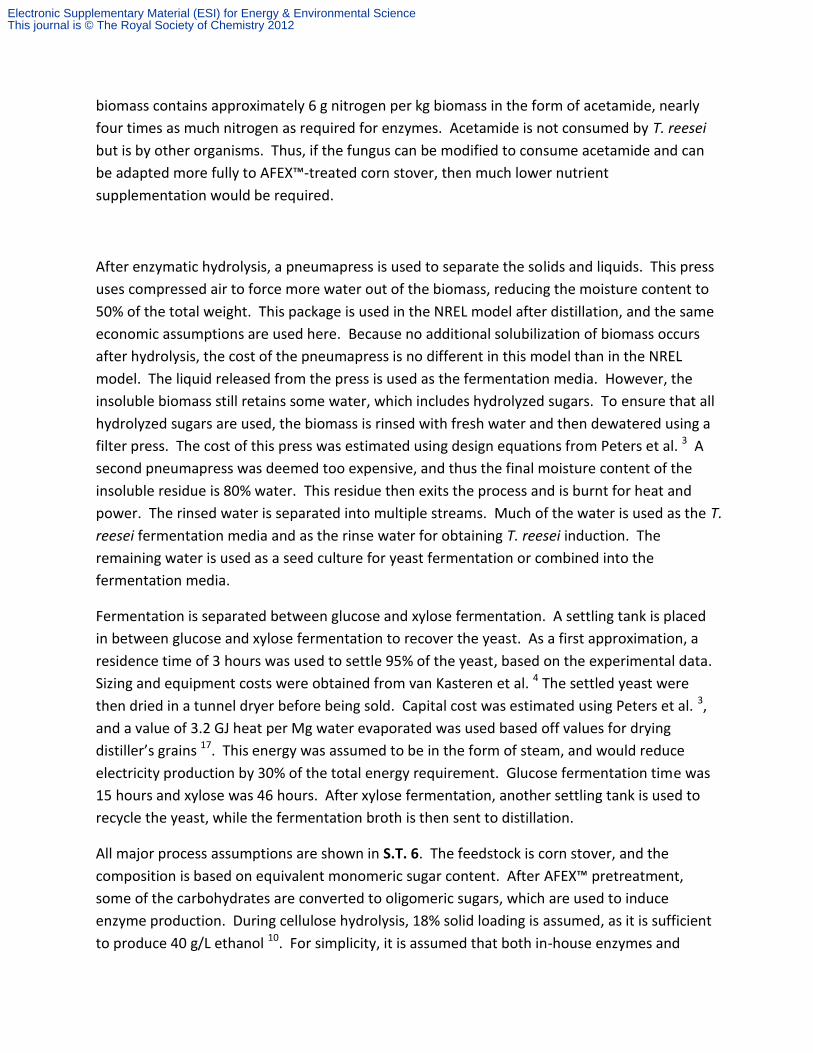
biomass contains approximately 6 g nitrogen per kg biomass in the form of acetamide, nearly
four times as much nitrogen as required for enzymes. Acetamide is not consumed by T. reesei
but is by other organisms. Thus, if the fungus can be modified to consume acetamide and can
be adapted more fully to AFEX™-treated corn stover, then much lower nutrient
supplementation would be required.
After enzymatic hydrolysis, a pneumapress is used to separate the solids and liquids. This press
uses compressed air to force more water out of the biomass, reducing the moisture content to
50% of the total weight. This package is used in the NREL model after distillation, and the same
economic assumptions are used here. Because no additional solubilization of biomass occurs
after hydrolysis, the cost of the pneumapress is no different in this model than in the NREL
model. The liquid released from the press is used as the fermentation media. However, the
insoluble biomass still retains some water, which includes hydrolyzed sugars. To ensure that all
hydrolyzed sugars are used, the biomass is rinsed with fresh water and then dewatered using a
filter press. The cost of this press was estimated using design equations from Peters et al. 3 A
second pneumapress was deemed too expensive, and thus the final moisture content of the
insoluble residue is 80% water. This residue then exits the process and is burnt for heat and
power. The rinsed water is separated into multiple streams. Much of the water is used as the T.
reesei fermentation media and as the rinse water for obtaining T. reesei induction. The
remaining water is used as a seed culture for yeast fermentation or combined into the
fermentation media.
Fermentation is separated between glucose and xylose fermentation. A settling tank is placed
in between glucose and xylose fermentation to recover the yeast. As a first approximation, a
residence time of 3 hours was used to settle 95% of the yeast, based on the experimental data.
Sizing and equipment costs were obtained from van Kasteren et al. 4 The settled yeast were
then dried in a tunnel dryer before being sold. Capital cost was estimated using Peters et al. 3,
and a value of 3.2 GJ heat per Mg water evaporated was used based off values for drying
distiller’s grains 17. This energy was assumed to be in the form of steam, and would reduce
electricity production by 30% of the total energy requirement. Glucose fermentation time was
15 hours and xylose was 46 hours. After xylose fermentation, another settling tank is used to
recycle the yeast, while the fermentation broth is then sent to distillation.
All major process assumptions are shown in S.T. 6. The feedstock is corn stover, and the
composition is based on equivalent monomeric sugar content. After AFEX™ pretreatment,
some of the carbohydrates are converted to oligomeric sugars, which are used to induce
enzyme production. During cellulose hydrolysis, 18% solid loading is assumed, as it is sufficient
to produce 40 g/L ethanol 10. For simplicity, it is assumed that both in-house enzymes and
Electronic Supplementary Material (ESI) for Energy & Environmental ScienceThis journal is © The Royal Society of Chemistry 2012
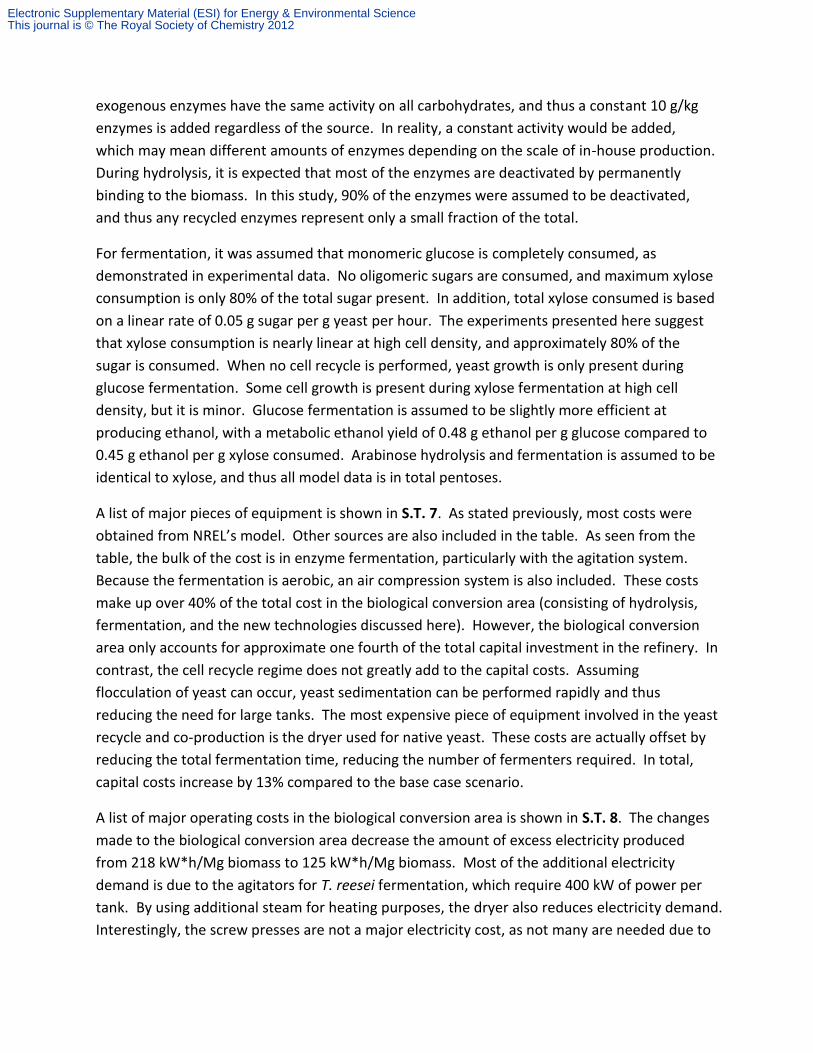
exogenous enzymes have the same activity on all carbohydrates, and thus a constant 10 g/kg
enzymes is added regardless of the source. In reality, a constant activity would be added,
which may mean different amounts of enzymes depending on the scale of in-house production.
During hydrolysis, it is expected that most of the enzymes are deactivated by permanently
binding to the biomass. In this study, 90% of the enzymes were assumed to be deactivated,
and thus any recycled enzymes represent only a small fraction of the total.
For fermentation, it was assumed that monomeric glucose is completely consumed, as
demonstrated in experimental data. No oligomeric sugars are consumed, and maximum xylose
consumption is only 80% of the total sugar present. In addition, total xylose consumed is based
on a linear rate of 0.05 g sugar per g yeast per hour. The experiments presented here suggest
that xylose consumption is nearly linear at high cell density, and approximately 80% of the
sugar is consumed. When no cell recycle is performed, yeast growth is only present during
glucose fermentation. Some cell growth is present during xylose fermentation at high cell
density, but it is minor. Glucose fermentation is assumed to be slightly more efficient at
producing ethanol, with a metabolic ethanol yield of 0.48 g ethanol per g glucose compared to
0.45 g ethanol per g xylose consumed. Arabinose hydrolysis and fermentation is assumed to be
identical to xylose, and thus all model data is in total pentoses.
A list of major pieces of equipment is shown in S.T. 7. As stated previously, most costs were
obtained from NREL’s model. Other sources are also included in the table. As seen from the
table, the bulk of the cost is in enzyme fermentation, particularly with the agitation system.
Because the fermentation is aerobic, an air compression system is also included. These costs
make up over 40% of the total cost in the biological conversion area (consisting of hydrolysis,
fermentation, and the new technologies discussed here). However, the biological conversion
area only accounts for approximate one fourth of the total capital investment in the refinery. In
contrast, the cell recycle regime does not greatly add to the capital costs. Assuming
flocculation of yeast can occur, yeast sedimentation can be performed rapidly and thus
reducing the need for large tanks. The most expensive piece of equipment involved in the yeast
recycle and co-production is the dryer used for native yeast. These costs are actually offset by
reducing the total fermentation time, reducing the number of fermenters required. In total,
capital costs increase by 13% compared to the base case scenario.
A list of major operating costs in the biological conversion area is shown in S.T. 8. The changes
made to the biological conversion area decrease the amount of excess electricity produced
from 218 kW*h/Mg biomass to 125 kW*h/Mg biomass. Most of the additional electricity
demand is due to the agitators for T. reesei fermentation, which require 400 kW of power per
tank. By using additional steam for heating purposes, the dryer also reduces electricity demand.
Interestingly, the screw presses are not a major electricity cost, as not many are needed due to
Electronic Supplementary Material (ESI) for Energy & Environmental ScienceThis journal is © The Royal Society of Chemistry 2012

their high throughput. In terms of raw materials, the dominant cost in the biological conversion
area remains the cellulase despite the reduction in use. However, costs are reduced to only
13% of the cost of biomass compared to 55% in the base case scenario. In contrast, the amount
of corn steep liquor required by this process under the assumptions present is minor; and thus
only accounts for less than $2 per Mg feedstock. Thus, the operating costs of fermentation are
also mitigated with this approach.
Electronic Supplementary Material (ESI) for Energy & Environmental ScienceThis journal is © The Royal Society of Chemistry 2012
References
1. Aden, A. et al., Vol. NREL/TP-510-32438. (ed. D.o. Energy)2002). 2. Fedler, C.B., Hanson, J.L., Beruvides, M., Simonton, J. & Lyford, C. (ed. T.S.E.C.O.C.N.
CM707)2008). 3. Peters, M.S., Timmerhaus, K.D. & West, R.E. Plant Design and Economics for Chemical Engineers,
5th ed. (McGraw-Hill, Boston; 2003). 4. van Kasteren, J.M.N. & Nisworo, A.P. A process model to estimate the cost of industrial scale
biodiesel production from waste cooking oil by supercritical transesterification. Resources, Conservation and Recycling 50, 442-458 (2007).
5. Humbird, D. & Aden, A., Vol. NREL/TP-510-48214. (ed. D.o. Energy)2008). 6. Lau, M.W., Gunawan, C. & Dale, B.E. The impacts of pretreatment on the fermentability of
pretreated lignocellulosic biomass: a comparative evaluation between ammonia fiber expansion and dilute acid pretreatment. Biotechnol Biofuels 2, 30 (2009).
7. Bergman, T., Carlquist, M. & Jornvall, H. in Advanced Methods in Protein Microsequence Analysis. (ed. B. Wittmann-Liebold) 45-55 (Springer Verlag, Berlin; 1986).
8. Wooley, R. et al., Vol. NREL/TP-580-26157. (ed. D.o. Energy)1999). 9. Eggeman, T. & Elander, R. Process and economic analysis of pretreatment technologies.
Bioresource Technology 96, 2019-2025 (2005). 10. Lau, M.W. & Dale, B.E. Cellulosic ethanol production from AFEX™-treated corn stover using
Saccharomyces cerevisiae 424A(LNH-ST). Proceedings of the National Academy of Sciences 106, 1368-1373 (2009).
11. Perlack, R.D. & Turhollow, A.F. Feedstock cost analysis of corn stover residues for further processing. Energy 28, 1395-1403 (2003).
12. Eggeman, T. & Elander, R.T. Process and economic analysis of pretreatment technologies. Bioresource Technology 96, 2019-2025 (2005).
13. Lawford, H.G. & Rousseau, J.D. Corn steep liquor as a cost-effective nutrition adjunct in high-performance Zymomonas ethanol fermentations. Applied Biochemistry and Biotechnology 63-5, 287-304 (1997).
14. Enochian, R.V., Kohler, G.O., Edwards, R.H., Kuzmicky, D.D. & Vosloh, C.J. (ed. U.S.D.o. Agriculture)1980).
15. Esterbauer, H., Steiner, W., Labudova, I., Hermann, A. & Hayn, M. Production of Trichoderma cellulase in laboratory and pilot scale. Bioresource Technology 36, 51-65 (1991).
16. Gao, D., Chundawat, S.P.S., Krishnan, C., Balan, V. & Dale, B.E. Mixture optimization of six core glycosyl hydrolases for maximizing saccharification of ammonia fiber expansion (AFEX™) pretreated corn stover. Bioresource Technology 101, 2770-2781 (2010).
17. Kwiatkowski, J.R., McAloon, A.J., Taylor, F. & Johnston, D.B. Modeling the process and costs of fuel ethanol production by the corn dry-grind process. Industrial Crops and Products 23, 288-296 (2006).
Electronic Supplementary Material (ESI) for Energy & Environmental ScienceThis journal is © The Royal Society of Chemistry 2012