Embed Size (px)
Citation preview

Supplementary Files
Material and Methods:
DSS colitis analysis
Body weight, the presence of occult or gross blood per rectum, and stool consistency were
determined every day. Experiments were terminated on day 7, colons were removed and
flushed with ice-cold phosphate-buffered saline (PBS). Samples were harvested, either fixed
in 4% formalin for <24 hours and embedded in paraffin to provide sections for histological
scoring, or pieces of colonic tissue were used for ex vivo analysis such as RNA isolation or
FACS analysis.
Bone marrow chimeras
Six to eight−week−old Nr2f6+/+ and Nr2f6–/– mice were irradiated with 10 Gray using a linear
accelerator with an iridium-192 radioactive source. After 2−3 h, mice were reconstituted
intravenously with 1 × 10⁶ bone marrow cells derived from either Nr2f6+/+ or Nr2f6–/– mice.
Post irradiation, mice received 10 mg/L neomycin sulfate prophylactically via the drinking
water, ad libitum, for 2 weeks.
Transfer colitis model
Colitis was induced via the transfer of either Nr2f6+/+ or Nr2f6–/– naïve CD4+ T cells into
Rag1/- mice. CD4+ T cells were isolated from spleens and lymph nodes of wild-type or Nr2f6-/-
mice using the mouse CD4+ T Cell Isolation Kit II (Miltenyi Biotec O. No. 130-090-860) and a
subsequent sorting purification step on a FacsAria (BD-Biosciences) leading to a purity of
>99% of CD4+CD45RBhigh -naïve T cells. 5 x 10⁵ naïve CD4+ T cells were injected
intraperitoneally (i.p.) into Rag1-/- recipient mice, which were monitored regularly for signs
of disease, weight loss, hunched posture and diarrhoea. Colitis scores were assessed by
researchers blinded to sample identity according to a score described in the Supplementary
Materials & Methods.
Histological procedures and scoring
Colons, including cecum and rectum, were removed, flushed with ice-cold PBS and
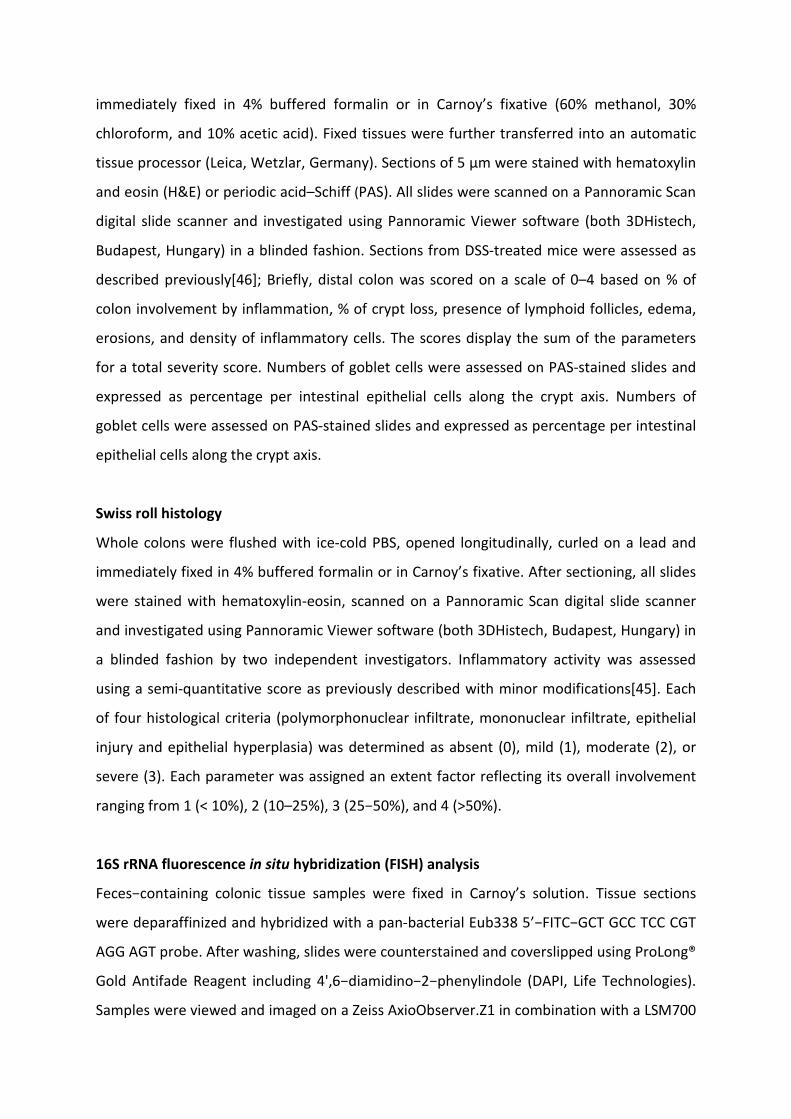
immediately fixed in 4% buffered formalin or in Carnoy’s fixative (60% methanol, 30%
chloroform, and 10% acetic acid). Fixed tissues were further transferred into an automatic
tissue processor (Leica, Wetzlar, Germany). Sections of 5 μm were stained with hematoxylin
and eosin (H&E) or periodic acid–Schiff (PAS). All slides were scanned on a Pannoramic Scan
digital slide scanner and investigated using Pannoramic Viewer software (both 3DHistech,
Budapest, Hungary) in a blinded fashion. Sections from DSS-treated mice were assessed as
described previously[46]; Briefly, distal colon was scored on a scale of 0–4 based on % of
colon involvement by inflammation, % of crypt loss, presence of lymphoid follicles, edema,
erosions, and density of inflammatory cells. The scores display the sum of the parameters
for a total severity score. Numbers of goblet cells were assessed on PAS-stained slides and
expressed as percentage per intestinal epithelial cells along the crypt axis. Numbers of
goblet cells were assessed on PAS-stained slides and expressed as percentage per intestinal
epithelial cells along the crypt axis.
Swiss roll histology
Whole colons were flushed with ice-cold PBS, opened longitudinally, curled on a lead and
immediately fixed in 4% buffered formalin or in Carnoy’s fixative. After sectioning, all slides
were stained with hematoxylin-eosin, scanned on a Pannoramic Scan digital slide scanner
and investigated using Pannoramic Viewer software (both 3DHistech, Budapest, Hungary) in
a blinded fashion by two independent investigators. Inflammatory activity was assessed
using a semi-quantitative score as previously described with minor modifications[45]. Each
of four histological criteria (polymorphonuclear infiltrate, mononuclear infiltrate, epithelial
injury and epithelial hyperplasia) was determined as absent (0), mild (1), moderate (2), or
severe (3). Each parameter was assigned an extent factor reflecting its overall involvement
ranging from 1 (< 10%), 2 (10–25%), 3 (25−50%), and 4 (>50%).
16S rRNA fluorescence in situ hybridization (FISH) analysis
Feces−containing colonic tissue samples were fixed in Carnoy’s solution. Tissue sections
were deparaffinized and hybridized with a pan-bacterial Eub338 5’−FITC−GCT GCC TCC CGT
AGG AGT probe. After washing, slides were counterstained and coverslipped using ProLong®
Gold Antifade Reagent including 4',6−diamidino−2−phenylindole (DAPI, Life Technologies).
Samples were viewed and imaged on a Zeiss AxioObserver.Z1 in combination with a LSM700

confocal laser scanning system and scored as described previously[33]. Only slides with clear
and crisp hybridization signals were included into enumeration. Mean values and standard
deviations were calculated for bacterial concentrations and measurements of mucus layer
thickness.
Immunohistochemistry
4 µm sections were deparaffinized, rehydrated and antigens were retrieved by pressure
cooking in antigen unmasking solution (Vector Laboratories, Burlingame, CA). Non−specific
protein binding sites were blocked using 1% BSA. Slides were incubated with their
respective primary and secondary (anti-rabbit, anti-rat IgG Alexa Fluor 488® or Alexa
Fluor594) antibodies at RT for 1 hour (for immunofluorescence) or 4°C overnight (for
immunohistochemistry). Slides were mounted with Dako fluorescent mounting medium
(S3023), which includes DAPI staining. IHC analysis of colons was performed in triplicates of
4 biopsy specimens of Nr2f6+/+ and Nr2f6-/- mice. Digital IHC images were acquired with an
Axiovert 40 CFL (ZEISS) microscope.
The following antibodies were used for immunofluorescence and immunohistochemistry:
Mucin 2 (H-300) rabbit pAb (Santa Cruz Biotechnology, Dallas, Texas), polyclonal rabbit anti-
human CD3 (Dako, A 0452), monoclonal NK1.1 (Novus Biologicals, PK136, NB100-77528),
monoclonal anti-ZO-1 (Merck Millipore, R40.73, MABT11), E-Cadherin (24E10) rabbit mAB
(Cell Signaling, #3195).
In vivo BrdU labeling assay
For proliferation assays, animals were injected with 2.5 mg bromodeoxyuridine (BrdU,
Becton Dickinson, Franklin Lakes, NJ) in 500 μl PBS. Colons were harvested after 2 or 24
hours. BrdU−positive nuclei were identified using a BrdU detection kit (Becton Dickinson).
Data are expressed as BrdU-positive nuclei per crypt axes normalized to total nuclei per
crypt.
Apoptosis analysis by TdT−dTptosis dUTP nick end labeling (TUNEL)
TUNEL staining was performed using the ApopTag kit (Roche, Basel, Switzerland) according
to the manufacturer’s instructions. TUNEL-positive cells were counted in 5 randomly
selected crypts per animal and expressed as the ratio to total intestinal epithelial cells (IEC).
Six mice from each group were studied.
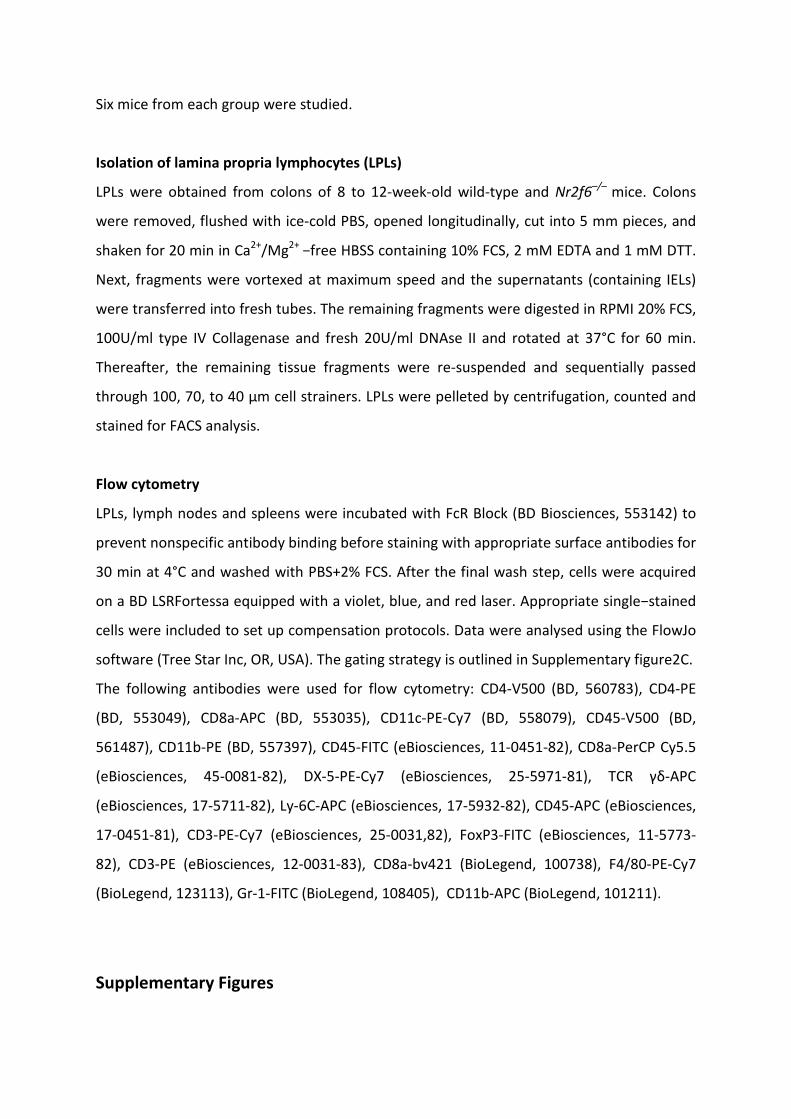
Isolation of lamina propria lymphocytes (LPLs)
LPLs were obtained from colons of 8 to 12-week-old wild-type and Nr2f6–/– mice. Colons
were removed, flushed with ice-cold PBS, opened longitudinally, cut into 5 mm pieces, and
shaken for 20 min in Ca2+/Mg2+ −free HBSS containing 10% FCS, 2 mM EDTA and 1 mM DTT.
Next, fragments were vortexed at maximum speed and the supernatants (containing IELs)
were transferred into fresh tubes. The remaining fragments were digested in RPMI 20% FCS,
100U/ml type IV Collagenase and fresh 20U/ml DNAse II and rotated at 37°C for 60 min.
Thereafter, the remaining tissue fragments were re-suspended and sequentially passed
through 100, 70, to 40 µm cell strainers. LPLs were pelleted by centrifugation, counted and
stained for FACS analysis.
Flow cytometry
LPLs, lymph nodes and spleens were incubated with FcR Block (BD Biosciences, 553142) to
prevent nonspecific antibody binding before staining with appropriate surface antibodies for
30 min at 4°C and washed with PBS+2% FCS. After the final wash step, cells were acquired
on a BD LSRFortessa equipped with a violet, blue, and red laser. Appropriate single−stained
cells were included to set up compensation protocols. Data were analysed using the FlowJo
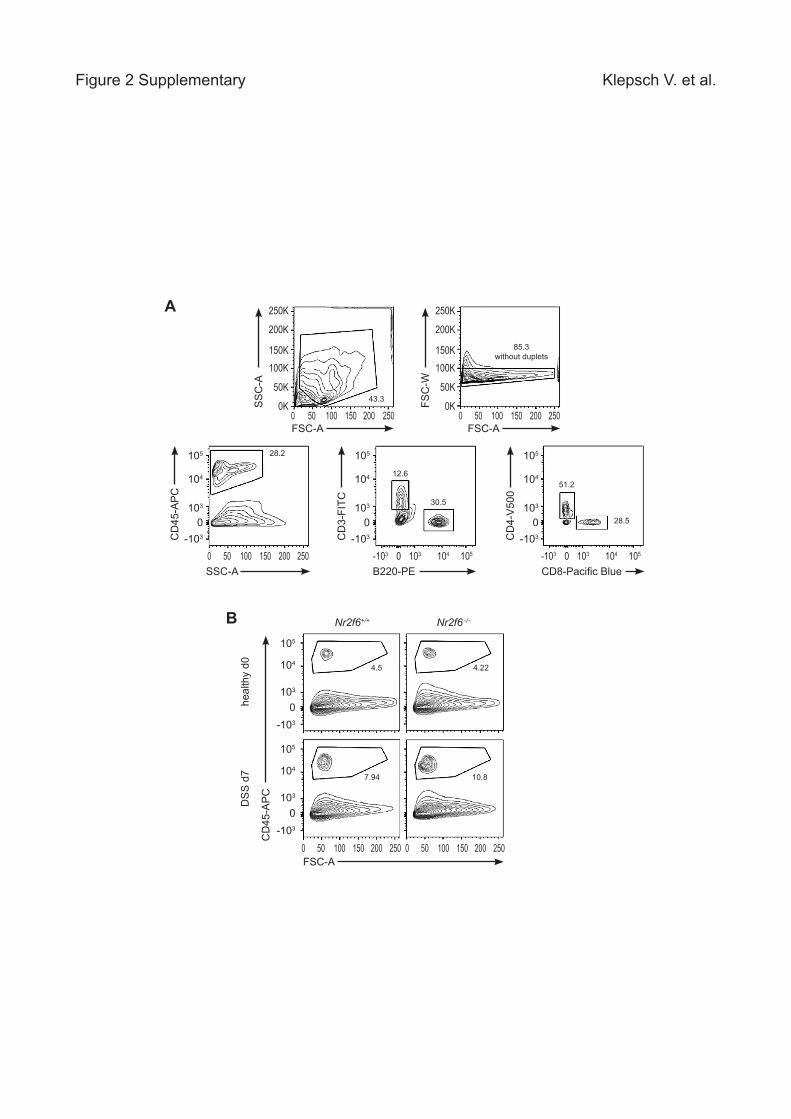
software (Tree Star Inc, OR, USA). The gating strategy is outlined in Supplementary figure2C.
The following antibodies were used for flow cytometry: CD4-V500 (BD, 560783), CD4-PE
(BD, 553049), CD8a-APC (BD, 553035), CD11c-PE-Cy7 (BD, 558079), CD45-V500 (BD,
561487), CD11b-PE (BD, 557397), CD45-FITC (eBiosciences, 11-0451-82), CD8a-PerCP Cy5.5
(eBiosciences, 45-0081-82), DX-5-PE-Cy7 (eBiosciences, 25-5971-81), TCR γδ-APC
(eBiosciences, 17-5711-82), Ly-6C-APC (eBiosciences, 17-5932-82), CD45-APC (eBiosciences,
17-0451-81), CD3-PE-Cy7 (eBiosciences, 25-0031,82), FoxP3-FITC (eBiosciences, 11-5773-
82), CD3-PE (eBiosciences, 12-0031-83), CD8a-bv421 (BioLegend, 100738), F4/80-PE-Cy7
(BioLegend, 123113), Gr-1-FITC (BioLegend, 108405), CD11b-APC (BioLegend, 101211).
Supplementary Figures

Klepsch V. et al.Figure 1 Supplementary
Nr2f6–/–Nr2f6+/+
swiss role (DSS d7) swiss role (DSS d7)
1000µm 1000µm
Nr2f6+/+ s.s. Nr2f6–/– s.s.
rela
tive
expr
essi
on[n
orm
aliz
ed
to G
apdh
]
rela
tive
Ki6
7 ex
pres
sion
[nor
mal
ized
to G
apdh
]
Nr2f6+/+ s.s
.
Nr2f6–/– s.s
.
n.s.2.0
1.5
1.0
0.5
0
Nr2f6+/+ s.s
.
Nr2f6–/– s.s
.
Lgr5
Nr2f6+/+ s.s
.
Nr2f6–/– s.s
.
n.s.1.5
1.0
0.5
0
Ascl2
n.s.
n.s.
n.s.
n.s.
Nr2f6+/+ s.s
.
Nr2f6–/– s.s
.
2.0
1.5
1.0
0.5
0
Chga
Nr2f6+/+ s.s
.
Nr2f6–/– s.s
.
n.s.n.s. 1.5
1.0
0.5
0
Tff3
1.5
1.0
0.5
0
Brd
U+ p
er to
tal I
EC
s/cr
ypt
0.5
0.4
0.1
0.2
0.3
0
TUN
EL+ n
ucle
i/cry
pt[%
]
4
1
2
3
0
Nr2f6+/+ s.s
.
Nr2f6–/– s.s
.
n.s.1.5
1.0
0.5
0
Clca1
Nr2f6+/+ s.s
.
Nr2f6–/– s.s
.
n.s.2.0
1.5
1.0
0.5
0
Alpi
Nr2f6+/+ s.s
.
Nr2f6–/– s.s
.
n.s.1.5
1.0
0.5
0
Dclk1
DSS
Nr2f6+/+
Nr2f6–/–
s.s.
Nr2f6–/–
Nr2f6+/+
200µm
200µm
A
B
D
G
C
E F
Nr2f6+/+ s.s.
Nr2f6+/+ s.s.
Nr2f6–/– s.s.
Nr2f6–/– s.s.
20x
40x
20x
40x

S-Figure 1 (A) Nr2f6-/- mice are more susceptible to DSS-induced colitis. Representative H&E
stained sections of colonic Swiss rolls of Nr2f6+/+ and Nr2f6-/- mice at day 7 of the
experimental period of acute DSS-induced colitis. (B) Apoptosis in representative pictures of
TUNEL-stained histology samples from steady state Nr2f6+/+ and Nr2f6-/- colons (n=6). (C)
Descriptive statistical analysis revealed no significant difference in TUNEL-positive nuclei per
crypt. (D) Colon cell proliferation of steady state or inflamed (DSS d3) Nr2f6+/+ and Nr2f6-/-
mice determined by BrdU staining (staining cell nuclei in brown). (E) Quantification of BrdU-
positive cells per crypt in steady state and DSS diseased wild-type and Nr2f6-deficient colons
revealed no differences between genotypes. (F) Relative gene expression of the
proliferation marker Ki67 was unaltered between genotypes in steady state. (G) Steady
state differentiation potential of intestinal epithelial cells in Nr2f6+/+ and Nr2f6-/- colons was
analyzed via qRT-PCR evaluating Lgr5 and Ascl2 for stem cells, Chga for enteroendocrine
cells, Tff3 and Clca1 for goblet cells, Alpi (p=0.70) for enterocytes, and Cdlk1 for tuft cells.
Data are presented as mean ± SEM error bars and are representative of at least two
independent experiments. Unpaired Student´s t test * p<0.05.
Klepsch V. et al.Figure 2 Supplementary
A
B
4.5 4.22
7.94 10.8
FSC-A
CD
45-A
PC
0 050 50100 100150 150200 200250 250
250K 250K
200K 200K
150K 150K
100K 100K
0K 0K43.3
85.3without duplets
FSC-A FSC-A
SS
C-A
FSC
-W0 0
0
50 50
50
100 100
100
150 150
150
200 200
200
250 250
250
105
105 105
105
105
105 105
104
104 104
104
104
104 104
103
103 103
103
103
103 103
0
0 0
0
0
0 0-103
-103 -103
-103
-103
-103 -103
28.2
12.6
30.5
51.2
28.5
SSC-A B220-PE CD8-Pacific Blue
CD
45-A
PC
CD
3-FI
TC
CD
4-V
500
DS
S d
7he
alth
y d0
Nr2f6–/–Nr2f6+/+
50K 50K

S-Figure 2 (A) Gating strategy for flow cytometry of colonic immune subsets after exclusion
of doublets. (B) Basic characterization of CD45+ leukocytes by flow cytometry in steady state
Nr2f6+/+ and Nr2f6-/- mice as well as on day 7 after DSS treatment. Numbers in quadrants
indicate percent of parent population.

Klepsch V. et al.
Nr2
f6–/
–
Figure 3 Supplementary
ZO-1E-CadherinDAPI
Nr2f6+/+
Nr2f6–/–
rela
tive
occl
udin
exp
ress
ion
[nor
mal
ized
to G
apdh
]
1.5
1.0
0.5
0
Nr2f6+/+
Nr2f6–/–
rela
tive
E-c
adhe
rin e
xpre
ssio
n[n
orm
aliz
ed to
Gap
dh]
1.5
1.0
0.5
0
Nr2f6+/+
Nr2f6–/–
rela
tive
ZO-1
exp
ress
ion
[nor
mal
ized
to G
apdh
]
1.5
1.0
0.5
0
Nr2f6–/–Nr2f6+/+
rela
tive
expr
essi
on[n
orm
aliz
edto
Gap
dh]
10
8
6
4
2
0
Muc11.5
1.0
0.5
0
Muc33
2
1
0
Muc41.5
1.0
0.5
0
Muc5ac
DSS
Nr2f6+/+
Nr2f6–/–
s.s.
Nr2f6–/–
Nr2f6+/+
DSS
Nr2f6+/+
Nr2f6–/–
s.s.
Nr2f6–/–
Nr2f6+/+
DSS
Nr2f6+/+
Nr2f6–/–
s.s.
Nr2f6–/–
Nr2f6+/+
DSS
Nr2f6+/+
Nr2f6–/–
s.s.
Nr2f6–/–
Nr2f6+/+
*
***
A
B
E
C D
DSS d3 DSS d7s.s. d0
Nr2
f6+/
+

S-Figure 3 Analysis of tight junction, adherens junction and expression of Muc genes in
Nr2f6-deficient colons. (A) Colon sections stained with DAPI (blue) and ZO-1 (red) as well as
in the steady state with E-Cadherin (green). Analysis of mRNA expression of different
junction markers E-cadherin (B), occludin (C) and ZO-1 (D) in colonic mucosal scrapings of
Nr2f6+/+ and Nr2f6-/- mice (n = 8). (E) Muc gene expression in Nr2f6+/+ and Nr2f6-/- intestinal
epithelial cell scrapings was analyzed via qRT-PCR in steady state and during DSS colitis (d7).
Gene expression was investigated in steady state and during DSS colitis (d7). Muc1
expression was different in steady state (p=0.019), but no altered expression of Muc3 ,
Muc4 and Muc5ac was detected in Nr2f6-deficient scrapings when compared with wild-type
controls. Data are presented as mean ± SEM error bars and are representative of at least
two independent experiments. Unpaired Student´s t test * p<0.05.