Embed Size (px)
Citation preview

1
1
Supplementary Figure 1 IMQ-Induced Mouse Model of Psoriasis. IMQ cream was 2
painted on the shaved back skin of C57BL/6J and BALB/c mice for 7 consecutive days. 3
(a, b) Phenotypic presentation of mouse back skin treated with IMQ (severe erythema, 4
scales and crusts). (c) H&E staining of lesional skin from treated mice. a, acanthosis; b, 5

2
increased proliferative basal layer epidermal keratinocytes; c, dilated capillaries (small 1
blood vessels in dermis); d, dermal cell infiltrates; k, hyperkeratosis; m, microabscesses; r, 2
elongated rete ridge. Dotted line indicates the border between the epidermis and dermis; 3
scale bar, 100μm. 4

3
1
Supplementary Figure 2 Decreased IL-6 levels in IL-17A-/-
mice and IL-6-mediated 2
activation of NF-κB Signaling in Keratinocytes. (a) qPCR analysis of IL-6 expression 3
from skin of WT (n=4) and IL-17A-/-
mice (n=3) treated with IMQ. Results are presented 4
as the ratio of mRNA to -actin, relative to that in IL-17A-/-
mice. (b) miR-31 expression 5
in HaCaT cells stimulated with IL-6 in absence or presence of various concentrations of 6
STAT3 inhibitor (iSTAT3) (S3I-201, Selleck #S1155). Results are presented as the ratio 7
of miRNA to the small nuclear RNA U6, relative to that in untreated cells. (c) 8
Phosphorylated-p65 (P-p65) and CD45 flow cytometry analysis of single cell suspensions 9
from normal epidermis of mouse treated with vehicle (Ctr) or lesional epidermis of 10
mouse treated with IMQ. **p0.01, two-tailed Student’s t-test. Error bars depict SEM. 11

4
1
Supplementary Figure 3 Generation of miR-31TG
Mice. (a) Schematic illustration of 2
the miR-31 transgenic construct used in this study to overexpress miR-31. CMV, 3
cytomegalovirus (promoter); EGFP, enhanced green fluorescent protein. (b) PCR 4
genotyping of miR-31 transgenic founder mice (533bp). #indicated genotyping positive 5
founder lines; m, DNA size marker; WT, wild-type control. (c) Quantitative RT-PCR 6
analysis of miR-31 in PBMCs derived from WT or miR-31TG
mice (n=7 for each group). 7
Results are presented as the ratio of miRNA to the small nuclear RNA U6, relative to that 8
in WT mice. *p0.05, two-tailed Student’s t-test. Error bars depict SEM. 9
5
1
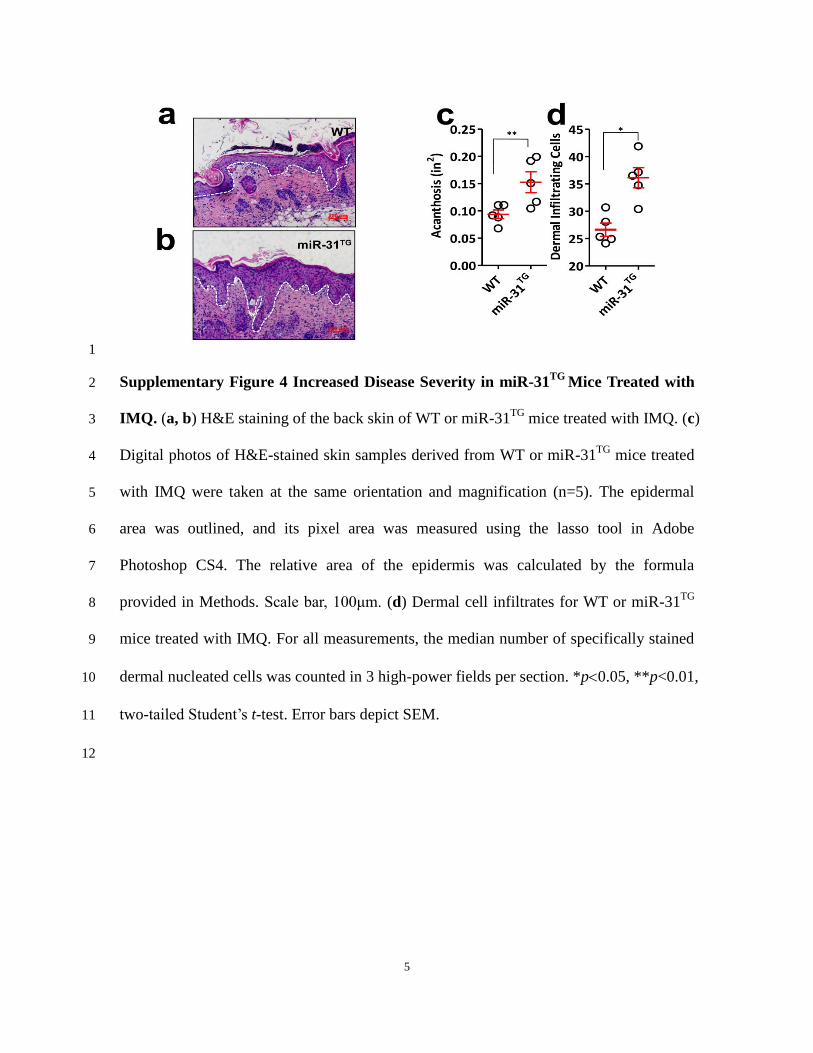
Supplementary Figure 4 Increased Disease Severity in miR-31TG
Mice Treated with 2
IMQ. (a, b) H&E staining of the back skin of WT or miR-31TG
mice treated with IMQ. (c) 3
Digital photos of H&E-stained skin samples derived from WT or miR-31TG
mice treated 4
with IMQ were taken at the same orientation and magnification (n=5). The epidermal 5
area was outlined, and its pixel area was measured using the lasso tool in Adobe 6
Photoshop CS4. The relative area of the epidermis was calculated by the formula 7
provided in Methods. Scale bar, 100μm. (d) Dermal cell infiltrates for WT or miR-31TG
8
mice treated with IMQ. For all measurements, the median number of specifically stained 9
dermal nucleated cells was counted in 3 high-power fields per section. *p0.05, **p<0.01, 10
two-tailed Student’s t-test. Error bars depict SEM. 11
12
6
1
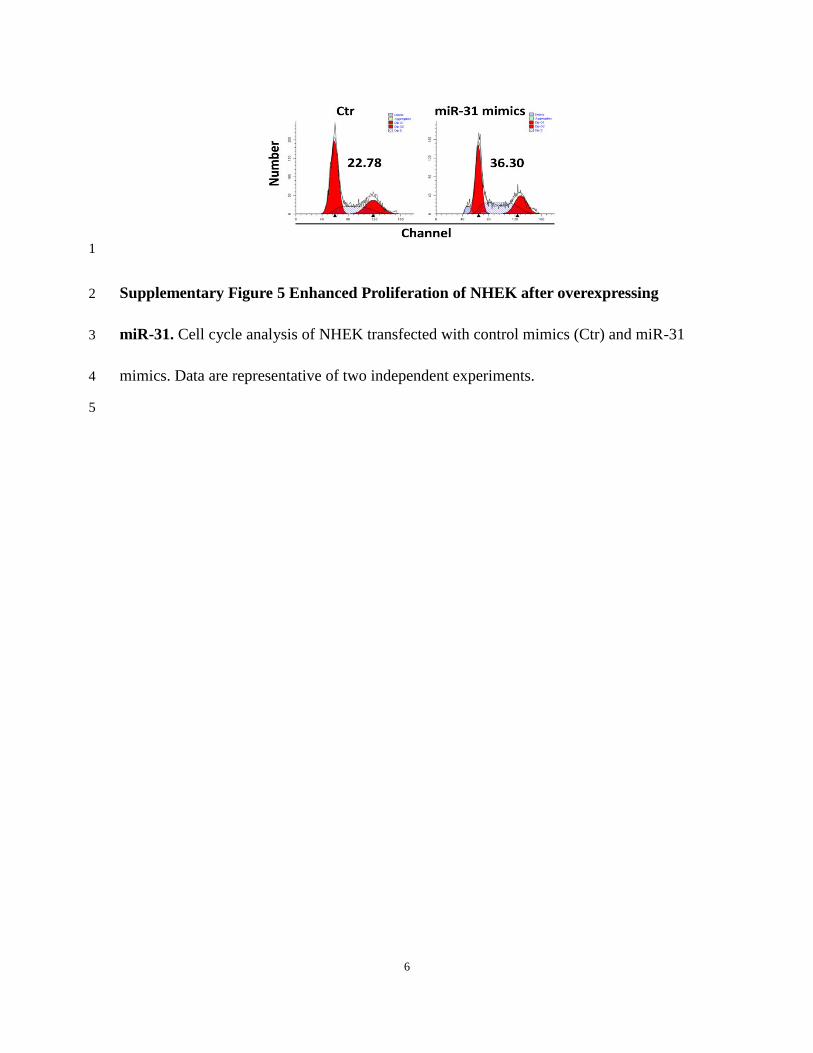
Supplementary Figure 5 Enhanced Proliferation of NHEK after overexpressing 2
miR-31. Cell cycle analysis of NHEK transfected with control mimics (Ctr) and miR-31 3
mimics. Data are representative of two independent experiments. 4
5

7
1
Supplementary Figure 6 Decreased Disease Severity in cKO mice after IL-23 2
Treatment. Mouse recombinant IL-23 was injected intradermally into the ear skin of 3
miR-31fl/fl
(n=5) and cKO mice (n=4) every other day for 14 days. (a) Phenotype of ear 4
skin from miR-31fl/fl
and cKO mice treated with rIL-23. (b) H&E staining of lesional skin 5
from miR-31fl/fl
and cKO mice treated with rIL-23. Scale bar, 100μm. (c, d) Skin 6
thickness and acanthosis were quantitated from the H&E staining. *p0.05, two-tailed 7
Student’s t-test. Error bars depict SEM. 8

8
1 Supplementary Figure 7 Expression Levels of Inflammatory Genes in Lesional Skin 2
of IMQ-Induced and IL-23-Mediated Mouse Models of Psoriasis. (a-f) Expression 3
levels of IL-1, IL-6, IL-17A, IL-22, IFN- and TNF- in lesional skin samples derived 4
from either miR-31fl/fl
or cKO mice treated with IMQ. (g-l) Expression levels of IL-1, 5
9
IL-6, IL-17, IL-22, IFN- and TNF- in lesional ear skin samples derived from either 1
miR-31fl/fl
or cKO mice treated with rIL-23. Data are representative of two independent 2
experiments. ns, not significant, *p0.05, two-tailed Student’s t-test. Error bars depict 3
SEM. 4
5
10
1
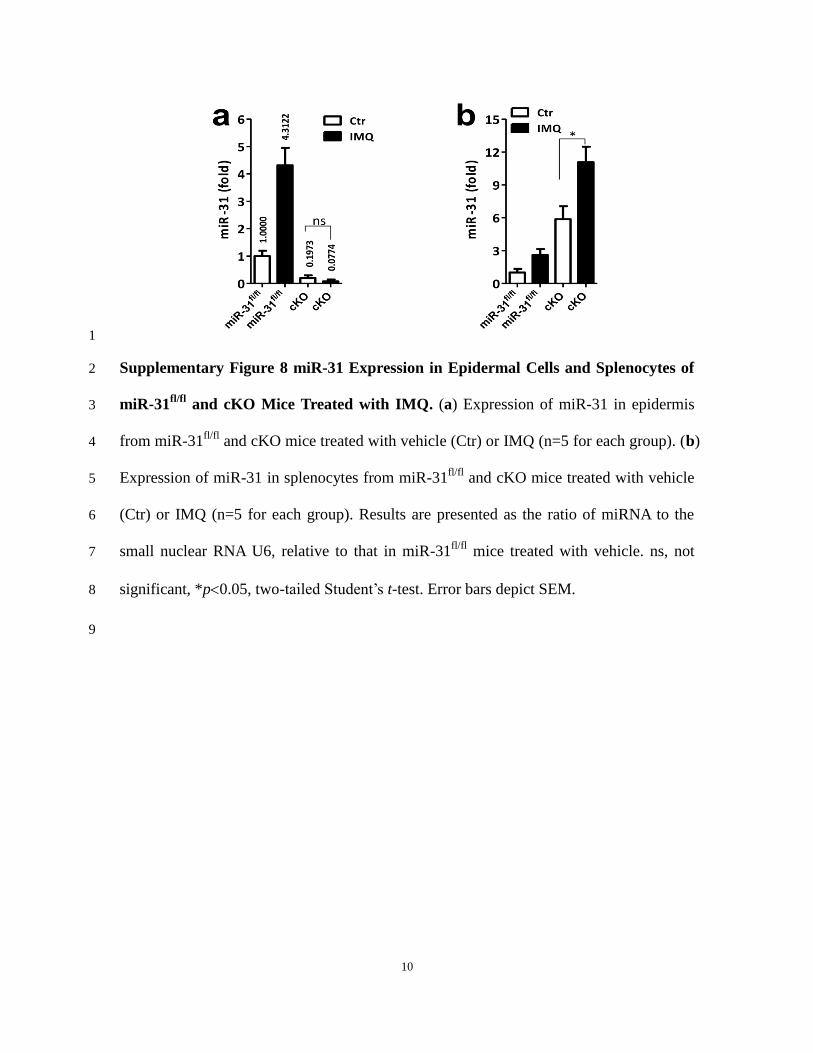
Supplementary Figure 8 miR-31 Expression in Epidermal Cells and Splenocytes of 2
miR-31fl/fl
and cKO Mice Treated with IMQ. (a) Expression of miR-31 in epidermis 3
from miR-31fl/fl
and cKO mice treated with vehicle (Ctr) or IMQ (n=5 for each group). (b) 4
Expression of miR-31 in splenocytes from miR-31fl/fl
and cKO mice treated with vehicle 5
(Ctr) or IMQ (n=5 for each group). Results are presented as the ratio of miRNA to the 6
small nuclear RNA U6, relative to that in miR-31fl/fl
mice treated with vehicle. ns, not 7
significant, *p0.05, two-tailed Student’s t-test. Error bars depict SEM. 8
9

11
1 Supplementary Figure 9 Identification of miR-31 Target Gene(s). (a, b) Predicted 20 2
candidate targets of miR-31. RNA was extracted from skin samples of non-treated WT 3
mice (Control), WT mice treated with IMQ (WT) and miR-31TG
mice treated with IMQ 4
(miR-31TG
). (c) mRNA levels of 16 candidate genes were measured by qPCR, and the 5
12
rest 4 genes were undetectable. Results are presented as the ratio of mRNA to -actin, 1
relative to that in untreated WT controls. *p0.05, **p0.01, ***p<0.001, two-tailed 2
Student’s t-test. Error bars depict SEM. 3
4

13
1
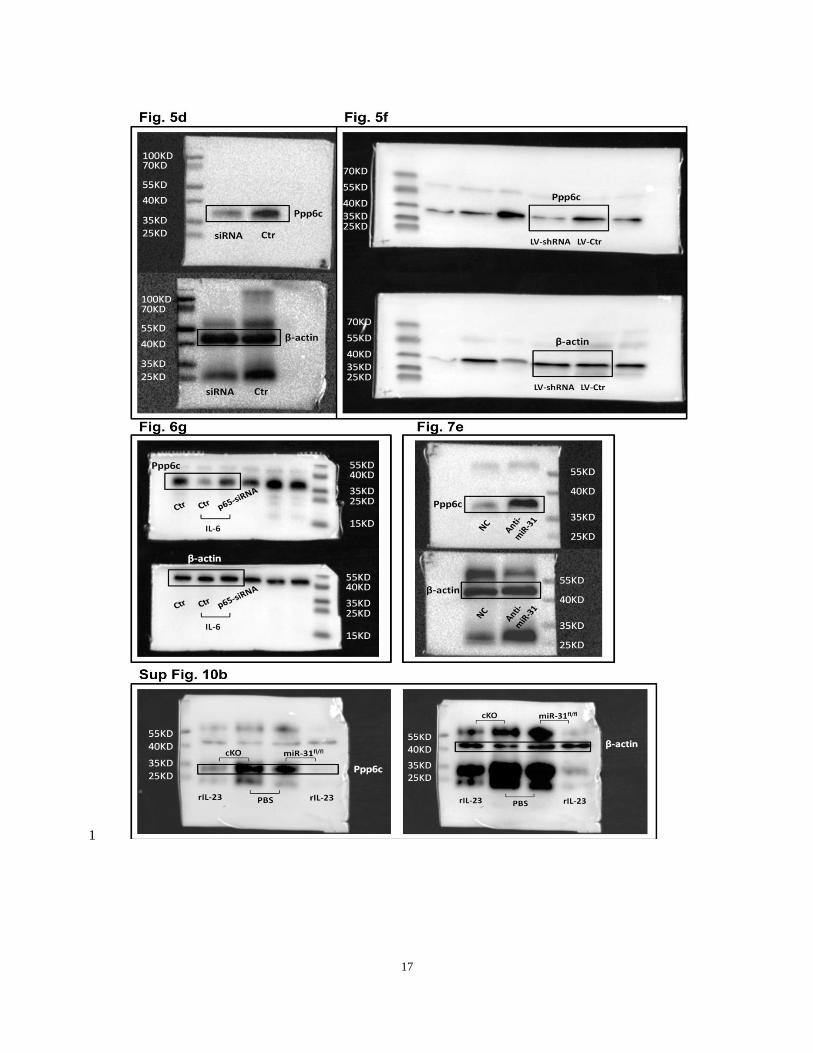
Supplementary Figure 10 Upregulated Ppp6c Levels in cKO Mice in IL-23-mediated 2
Mouse Model of Psoriasis. (a) qPCR analysis of ppp6c expression in ear skin of 3
miR-31fl/fl
and cKO mice, treated with rIL-23 or PBS (n=4-5). Results are presented as 4
the ratio of mRNA to -actin, relative to that in miR-31fl/fl
mice treated with PBS. (b) 5
Western blotting of ppp6c expression in ear skin of miR-31fl/fl
and cKO mice, treated with 6
rIL-23 or PBS. Data are representative of two independent experiments. **p0.01, 7
two-tailed Student’s t-test. Error bars depict SEM. 8

14
1
Supplementary Figure 11 Ppp6c is not Targeted by miR-125a and Silencing Ppp6c 2
does not alter miR-31 expression. (a, b) Ago2 was immunoprecipitated from epidermis 3
lysates derived from miR-31fl/fl
or cKO mice treated with IMQ. Immunoprecipitates were 4
assayed for ppp6c and miR-125a. (c) Expressin of miR-31 in NHEK transfected with 5
non-targeted siRNA (siRNA-Ctr) and ppp6c targeted siRNA (siRNA-ppp6c). Results are 6
presented as the ratio of mRNA to -actin, relative to that in NHEK transfected with 7
non-targeted siRNA. Data are representative of two independent experiments. ns, not 8
significant, two-tailed Student’s t-test. Error bars depict SEM. 9
10
15
1
2
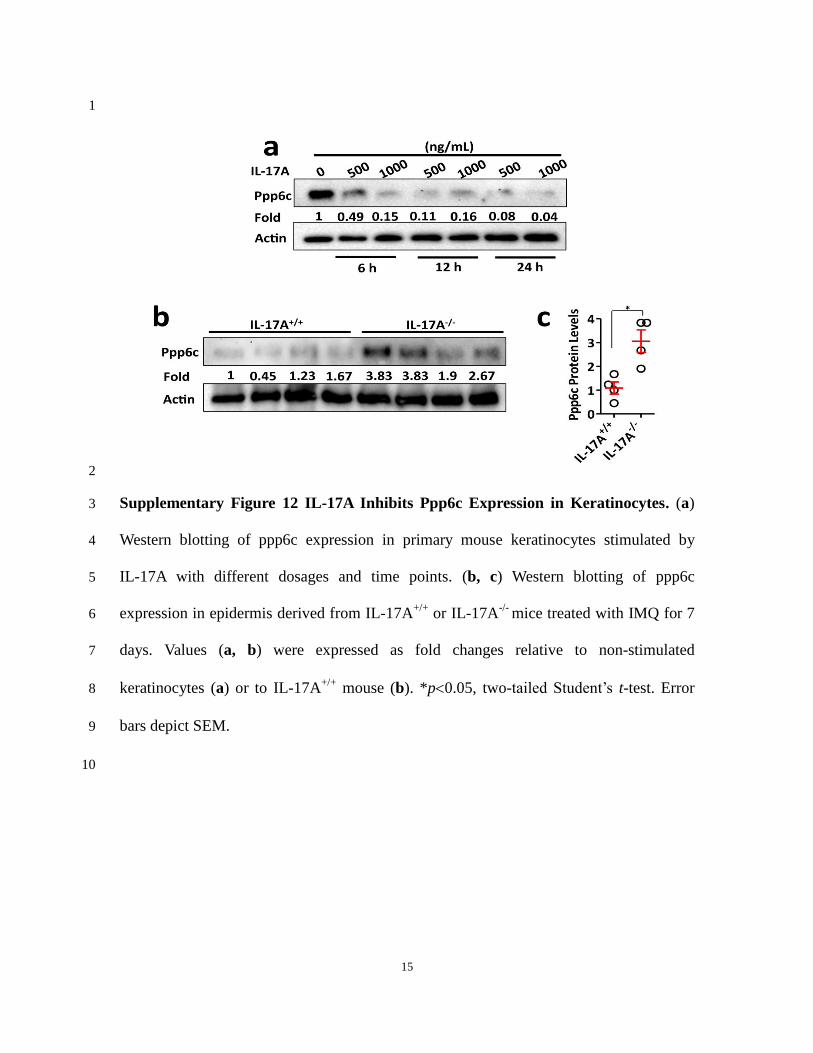
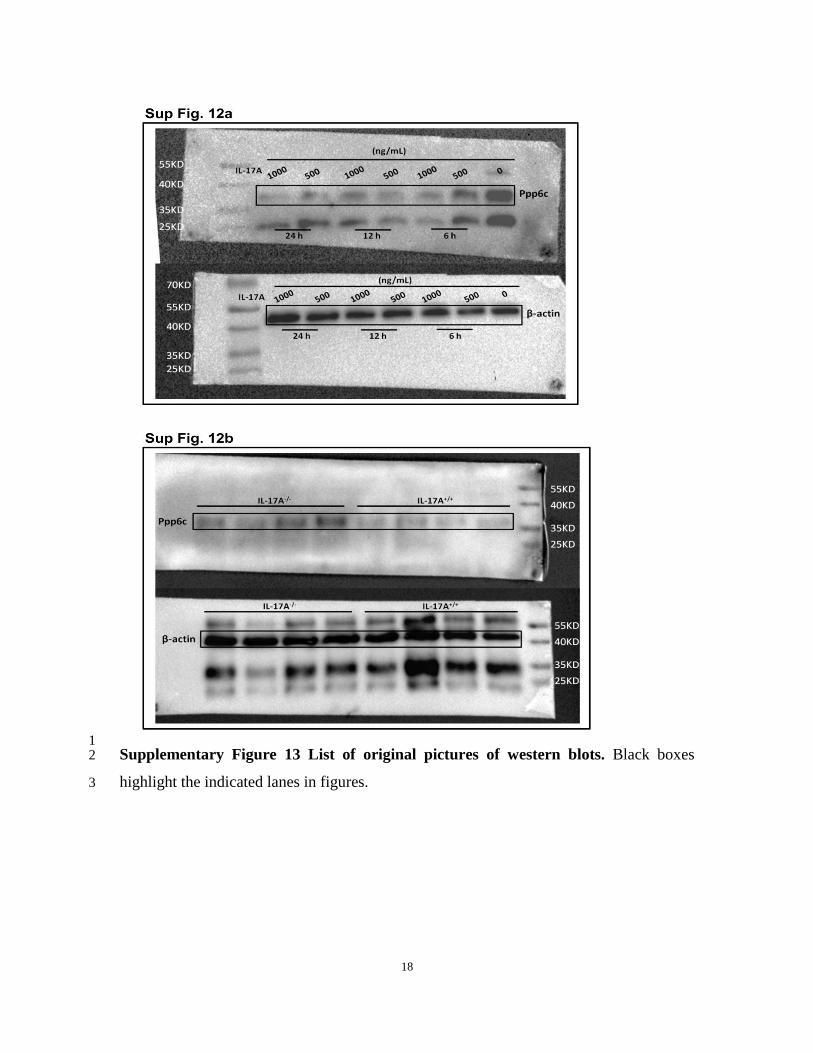
Supplementary Figure 12 IL-17A Inhibits Ppp6c Expression in Keratinocytes. (a) 3
Western blotting of ppp6c expression in primary mouse keratinocytes stimulated by 4
IL-17A with different dosages and time points. (b, c) Western blotting of ppp6c 5
expression in epidermis derived from IL-17A+/+
or IL-17A-/-
mice treated with IMQ for 7 6
days. Values (a, b) were expressed as fold changes relative to non-stimulated 7
keratinocytes (a) or to IL-17A+/+
mouse (b). *p0.05, two-tailed Student’s t-test. Error 8
bars depict SEM. 9
10

16
1
2
17
1
18
1 Supplementary Figure 13 List of original pictures of western blots. Black boxes 2
highlight the indicated lanes in figures. 3
19
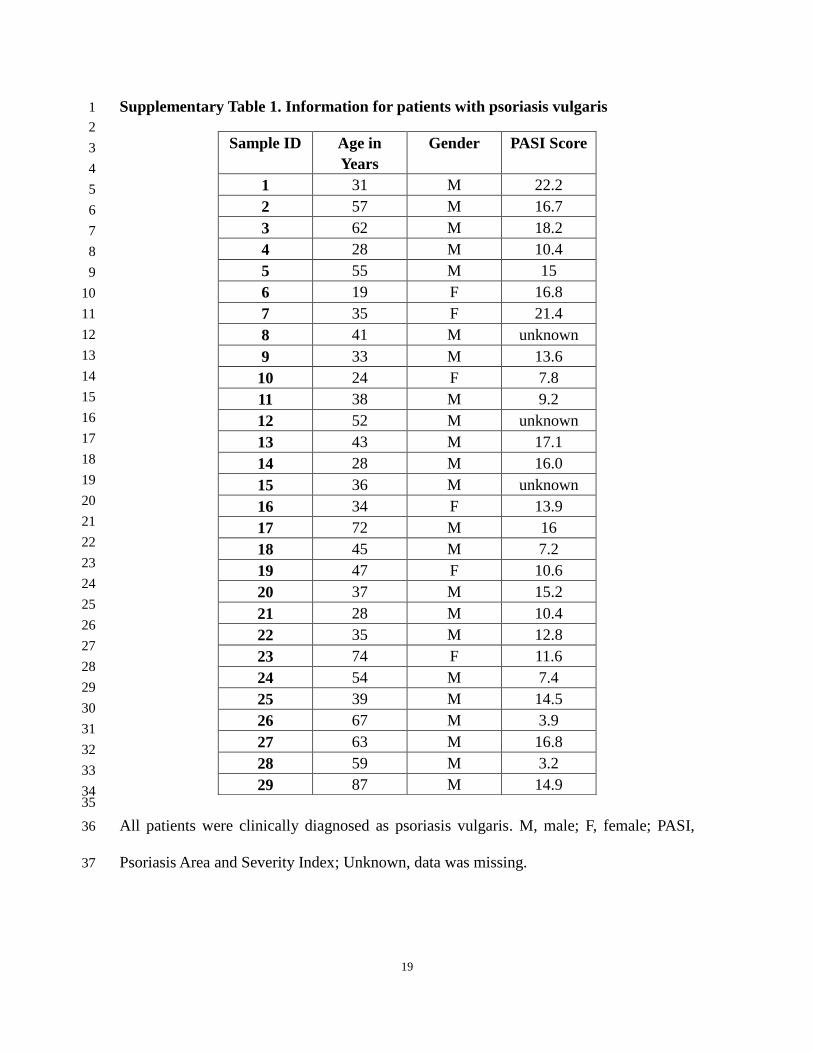
Supplementary Table 1. Information for patients with psoriasis vulgaris 1
2
3
4
5
6
7
8
9
10
11
12
13
14
15
16
17
18
19
20
21
22
23
24
25
26
27
28
29
30
31
32
33
34 35
All patients were clinically diagnosed as psoriasis vulgaris. M, male; F, female; PASI, 36
Psoriasis Area and Severity Index; Unknown, data was missing. 37
Sample ID Age in
Years
Gender PASI Score
1 31 M 22.2
2 57 M 16.7
3 62 M 18.2
4 28 M 10.4
5 55 M 15
6 19 F 16.8
7 35 F 21.4
8 41 M unknown
9 33 M 13.6
10 24 F 7.8
11 38 M 9.2
12 52 M unknown
13 43 M 17.1
14 28 M 16.0
15 36 M unknown
16 34 F 13.9
17 72 M 16
18 45 M 7.2
19 47 F 10.6
20 37 M 15.2
21 28 M 10.4
22 35 M 12.8
23 74 F 11.6
24 54 M 7.4
25 39 M 14.5
26 67 M 3.9
27 63 M 16.8
28 59 M 3.2
29 87 M 14.9