Embed Size (px)
Citation preview

1
SUPPLEMENTAL MATERIAL
Kujala UM, Mäkinen V-P, Heinonen I, et al. Long-term leisure-time physical activity and
serum metabolome.
List of online-only elements
Supplemental Methods
Supplemental Methods 1. Serum NMR metabolomics
Supplemental Methods 2. Statistical significance of metabolic profiles
Supplemental Methods 3. Network visualization
Supplemental Tables
Supplemental Table 1. List of analyzed variables (NMR metabolomics platform)
Supplemental Table 2. Definition of composite metabolic measures for Figure 3A in the main
manuscript
Supplemental Table 3. Spearman correlations between serum metabolome measures and the
mean leisure time MET-index during the follow-up from 1980 to 2005 among the twins
Supplemental Figures
Supplemental Figure 1. Illustration of the hypothesis testing framework for global
metabolome significance in the twin study design (hypothetical data)
Supplemental Figure 2. Spearman correlation structure of the twin dataset, adjusted for age
and gender
Supplemental Figure 3. Illustration of network pruning by successive maximal spanning trees
(hypothetical data)
Supplemental References
2
Supplemental Methods
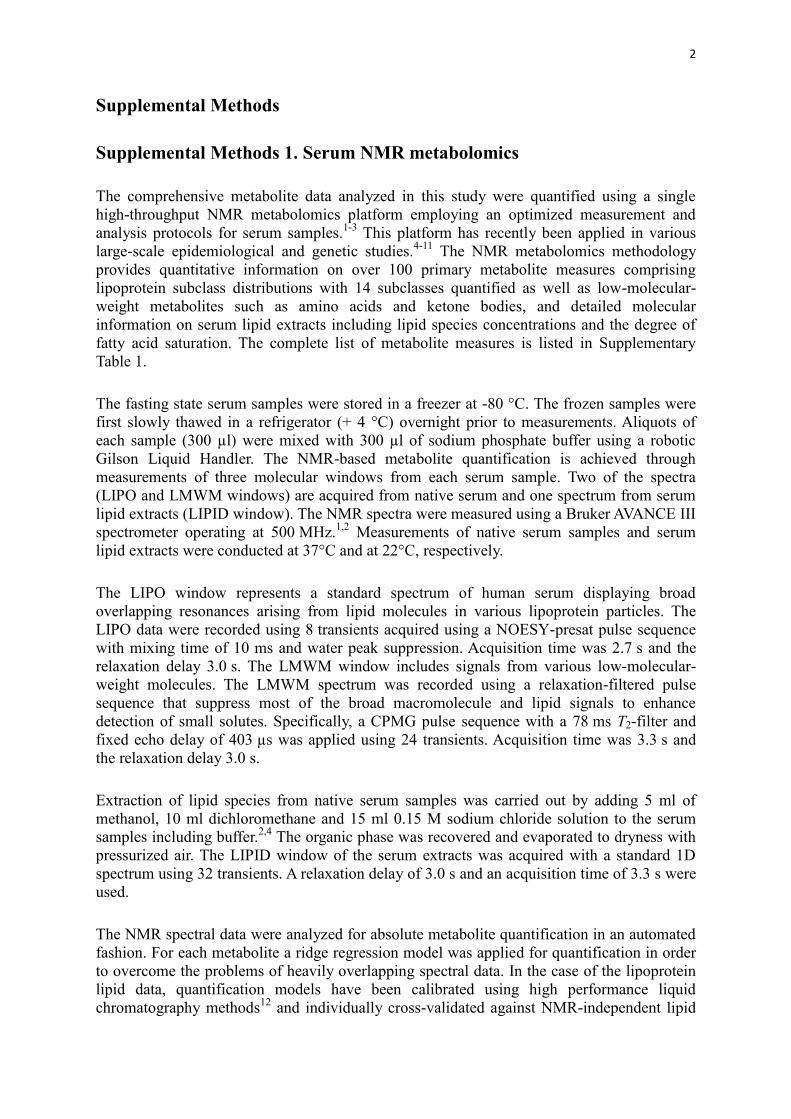
Supplemental Methods 1. Serum NMR metabolomics
The comprehensive metabolite data analyzed in this study were quantified using a single
high-throughput NMR metabolomics platform employing an optimized measurement and
analysis protocols for serum samples.1-3
This platform has recently been applied in various
large-scale epidemiological and genetic studies.4-11
The NMR metabolomics methodology
provides quantitative information on over 100 primary metabolite measures comprising
lipoprotein subclass distributions with 14 subclasses quantified as well as low-molecular-
weight metabolites such as amino acids and ketone bodies, and detailed molecular
information on serum lipid extracts including lipid species concentrations and the degree of
fatty acid saturation. The complete list of metabolite measures is listed in Supplementary
Table 1.
The fasting state serum samples were stored in a freezer at -80 °C. The frozen samples were
first slowly thawed in a refrigerator (+ 4 °C) overnight prior to measurements. Aliquots of
each sample (300 µl) were mixed with 300 µl of sodium phosphate buffer using a robotic
Gilson Liquid Handler. The NMR-based metabolite quantification is achieved through
measurements of three molecular windows from each serum sample. Two of the spectra
(LIPO and LMWM windows) are acquired from native serum and one spectrum from serum
lipid extracts (LIPID window). The NMR spectra were measured using a Bruker AVANCE III
spectrometer operating at 500 MHz.1,2
Measurements of native serum samples and serum
lipid extracts were conducted at 37°C and at 22°C, respectively.
The LIPO window represents a standard spectrum of human serum displaying broad
overlapping resonances arising from lipid molecules in various lipoprotein particles. The
LIPO data were recorded using 8 transients acquired using a NOESY-presat pulse sequence
with mixing time of 10 ms and water peak suppression. Acquisition time was 2.7 s and the
relaxation delay 3.0 s. The LMWM window includes signals from various low-molecular-
weight molecules. The LMWM spectrum was recorded using a relaxation-filtered pulse
sequence that suppress most of the broad macromolecule and lipid signals to enhance
detection of small solutes. Specifically, a CPMG pulse sequence with a 78 ms T2-filter and
fixed echo delay of 403 µs was applied using 24 transients. Acquisition time was 3.3 s and
the relaxation delay 3.0 s.
Extraction of lipid species from native serum samples was carried out by adding 5 ml of
methanol, 10 ml dichloromethane and 15 ml 0.15 M sodium chloride solution to the serum
samples including buffer.2,4
The organic phase was recovered and evaporated to dryness with
pressurized air. The LIPID window of the serum extracts was acquired with a standard 1D
spectrum using 32 transients. A relaxation delay of 3.0 s and an acquisition time of 3.3 s were
used.
The NMR spectral data were analyzed for absolute metabolite quantification in an automated
fashion. For each metabolite a ridge regression model was applied for quantification in order
to overcome the problems of heavily overlapping spectral data. In the case of the lipoprotein
lipid data, quantification models have been calibrated using high performance liquid
chromatography methods12
and individually cross-validated against NMR-independent lipid

3
data. The 14 lipoprotein subclasses were as follows: chylomicrons and extremely large VLDL
particles (particle diameters from 75 nm upwards), very large VLDL (average particle
diameter 64.0 nm), large VLDL (53.6 nm), medium-size VLDL (44.5 nm), small VLDL (36.8
nm), and very small VLDL (31.3 nm); intermediate-density lipoprotein (IDL) (28.6 nm);
large LDL (25.5 nm), medium-size LDL (23.0 nm), and small LDL (18.7 nm); very large
HDL (14.3 nm), large HDL (12.1 nm), medium-size HDL (10.9 nm), and small HDL (8.7
nm). In addition, mean particle diameters of VLDL, LDL and HDL fractions were calculated
on the basis of the corresponding subclass distributions. Low-molecular-weight metabolites
as well as lipid extract measures were quantified in mmol/L based on regression modeling
calibrated against a set of manually fitted metabolite measures. The calibration data was
quantified based on iterative lineshape fitting analyses using PERCH NMR software
(PERCH Solutions Ltd., Kuopio, Finland). Absolute quantification cannot be directly
established for the lipid extract measures due to experimental variation in the lipid extraction
protocol. Therefore, serum extract metabolites are scaled via the total cholesterol as
quantified also from the native serum LIPO spectrum.
Supplemental Methods 2: Statistical significance of metabolic profiles
The large number of metabolites and small number of twin pairs presents a challenge for
statistical analyses. In particular, there is low power to detect clinically meaningful univariate
differences beyond a multiple testing threshold. We therefore reduced the global metabolic
variance into one summary measure, and performed a single test with this measure. Principal
component analysis and other linear decomposition methods are popular means to reduce
data dimensionality, but the paired study design and low number of samples make it difficult
to create a robust multivariate model. Instead, we developed a simpler mathematical approach
to reduce the data to one dimension.
Supplemental Figure 1 is an illustration of the “global metabolism test” we devised for the
twin dataset. Our goal was to determine whether the overall metabolic profile differed
significantly between active and inactive twins. We also wanted to integrate data from the
population cohorts to see if the metabolic differences were consistent across datasets.
Definition and testing of the null hypothesis
Our null hypothesis was that an active twin's metabolic profile and the inactive co-twin's
profile were not different. The twins were selected based on their physical activity records
(not randomly picked from a population), which could lead to sampling bias. We therefore
required that the differences, if any exist, must also be consistent with independent data, or
the null hypothesis stands.
Independent data was obtained from two sources. In the twin set, we calculated the
correlation coefficient between leisure time physical activity and each metabolite, in the
active and inactive groups separately. The internal reference profile was defined as the mean
correlation over the two groups. Although the individuals are the same, the profile is
mathematically independent of the pair-wise differences. The external reference was
calculated by subtracting the mean concentrations in the inactive group from the mean of the
active group in the pooled population cohorts.
Both the magnitude and direction of metabolite differences are of importance. We looked for
a simple statistic that is positive when both the activity-related metabolic differences and
reference profile are in the same direction, and negative otherwise. We also wanted to
emphasize those metabolites that show large differences between active and inactive

4
individuals to prevent random jitter around zero from obscuring the directionality. Vector
multiplication fulfills both criteria: if x denotes the row vector of multivariate differences
between active and their inactive co-twins, and y is the reference, then s = xyT yields a
suitable test statistic.
Statistical significance was tested empirically by permutation analysis.14-16
First, activity
status was permuted within families to create all the possible 216
= 65532 combinations of
activity swaps (see Supplemental Figure 1 for a hypothetical example). The test statistic was
then re-calculated for each permuted set to obtain the null distribution. The final P-value was
estimated by a Gaussian approximation.
Statistical comparisons by bootstrapping
Due to the selected case-control study design, we chose bootstrapping as the main method of
statistical comparisons between active and inactive individuals.16
For the twin study, the
bootstrapping algorithm was applied to the pairs: random sampling with replacement was
applied to the 16 pairs of twins, and the mean difference between an active and inactive twin
was stored. For the population cohorts, the same bootstrapping algorithm was applied for the
age and sex-matched active-inactive pairs. A total of 10000 bootstrap samples were created
for each dataset.
Meta-analysis was performed after the bootstrapping statistics were calculated for each
cohort. First, the initial means and variances of the metabolite differences were calculated
from the bootstrap samples for each cohort separately. The final meta-analyzed mean
difference was the inverse-variance weighted average of the cohort-specific mean differences.
All variables in the bootstrap method were screened for skewed distributions and log-
transformed if absolute skewness exceeded 1. Ratios were not treated differently from the
absolute concentrations since the logarithmic preprocessing successfully converted all
affected variables into well-contained distributions. The preprocessed values were divided by
their respective standard deviation before calculating the pair differences to eliminate scale
effects. The bootstrap sample distributions were also checked if they were incompatible with
the Gaussian approximation, but all were symmetric with well-contained tails.
Multiple testing correction was performed by estimating the minimum number of orthogonal
linear components (PCA) that explained 99% of the observed variance in a dataset. The
highest number (26 components) was observed in the NFBC66 cohort, which was also the
largest cohort by number of individuals, and we used that as a consistent conservative
estimate in all multiple testing corrections using Bonferroni method.
Supplemental Methods 3: Network visualization
A large number of variables is a challenge not only in statistical modeling, but also in the
illustration of results. Data-driven network approaches may provide important insight into the
statistical relationships between gene expression, intermediate metabolites and clinical
phenotypes. We calculated the pruned correlation structure of the dataset to visualize
associations between the observable quantities and hence give insights into the underlying
biological pathways.
Grouping related variables into composite traits
Before the network analysis, we condensed the metabolomics dataset to ensure legibility of
the final figure (the full correlation matrix is shown in Supplemental Figure 2). We grouped

5
the age and gender adjusted variables into blocks according to knowledge of biological or
physical relatedness, and then calculated the first principal component for each block; this
provided us with a single continuous score for each metabolite block. Together with selected
clinical features and gene expression data, we ended up with 24 variables. This limited set of
variables was considered the nodes of a network, and the connections between the nodes
were defined by the statistical associations between the corresponding variables. The
composite measures (blocks) and relative contributions of block members are listed in
Supplemental Table 2.
Pruning of the network topology
Next we calculated the Spearman correlations (i.e. the link weights) between all possible
pairs of the preprocessed variables (i.e. the nodes). Drawing all the resulting 276 correlations
leads to a complicated image that is difficult to interpret visually, so some of them had to be
discarded. The obvious way to do this would be to define a threshold of statistical
significance, but this type of approach will typically lead to a break-up of the network, and is
not able to highlight important structural features such as weak links connecting densely
interconnected modules. Hence we devised a method based on the spanning tree, which is
formally defined as an acyclic fully connected network.17
In other words, we find a set of
links that connects every node to the rest of the network, but without causing a loop within
the set. If branches are seen as links, then a tree is the natural example of such a topology.
A dense graph such as the correlation network may contain a large number of formally
acceptable spanning trees due to the multiple possible ways of selecting the link set.
However, we further select the spanning tree with the largest sum of link weights to extract
the strongest statistical evidence. But one tree alone is usually not so informative, so we
repeat the process for the remainder (Supplemental Figure 3). Consequently, the algorithm
tends to choose the strongest links, while maintaining the integrity of the original network,
and the resulting figure can be directly used for inferring the relevant correlation patterns in
the dataset. The correlations were calculated by standard functions in Octave environment
and the network analysis was performed with the Himmeli18
software package, code version
2011-09-03.
Technical details of the network method:
1. Adjust dataset for age and gender.
2. Condense the full dataset into composite scores as described in the previous section.
3. Calculate Spearman correlation coefficients for all pairs of scores. This produces a set of
link weights S0 that connects each composite score (the node in the network) with every other
one.
4. Determine the smallest set of links T1 within S0 that is enough to connect every node to the
network (spanning tree) with the largest sum of correlation magnitudes by the Kruskal
algorithm.
5. Remove set T1 from S0 to produce a new set S1 .
6. Repeat step 4 for set S1 to produce set T2.
7. Put sets T1 and T2 together for the final pruned set T.

6
Supplemental Tables
Supplemental Table 1. List of analyzed variables (NMR metabolomics platform)
Albumin, lipoprotein subclasses and derived measures (‘LIPO window’)
Albumin
Phospholipids in chylomicrons and extremely large VLDL
Total lipids in chylomicrons and extremely large VLDL
Concentration of chylomicrons and extremely large VLDL particles
Phospholipids in very large VLDL
Triglycerides in very large VLDL
Total lipids in very large VLDL
Concentration of very large VLDL particles
Total cholesterol in large VLDL
Free cholesterol in large VLDL
Phospholipids in large VLDL
Triglycerides in large VLDL
Cholesterol esters in large VLDL
Total lipids in large VLDL
Concentration of large VLDL particles
Total cholesterol in medium VLDL
Free cholesterol in medium VLDL
Phospholipids in medium VLDL
Triglycerides in medium VLDL
Cholesterol esters in medium VLDL
Total lipids in medium VLDL
Concentration of medium VLDL particles
Total cholesterol in small VLDL
Free cholesterol in small VLDL
Phospholipids in small VLDL
Triglycerides in small VLDL
Total lipids in small VLDL
Concentration of small VLDL particles
Phospholipids in very small VLDL
Triglycerides in very small VLDL
Total lipids in very small VLDL
Concentration of very small VLDL particles
Free cholesterol in IDL
Phospholipids in IDL
Total lipids in IDL
Concentration of IDL particles
Total cholesterol in large LDL

7
Free cholesterol in large LDL
Phospholipids in large LDL
Cholesterol esters in large LDL
Total lipids in large LDL
Concentration of large LDL particles
Total cholesterol in medium LDL
Phospholipids in medium LDL
Cholesterol esters in medium LDL
Total lipids in medium LDL
Concentration of medium LDL particles
Total cholesterol in small LDL
Total lipids in small LDL
Concentration of small LDL particles
Total cholesterol in very large HDL
Free cholesterol in very large HDL
Phospholipids in very large HDL
Triglycerides in very large HDL
Cholesterol esters in very large HDL
Total lipids in very large HDL
Concentration of very large HDL particles
Total cholesterol in large HDL
Free cholesterol in large HDL
Phospholipids in large HDL
Cholesterol esters in large HDL
Total lipids in large HDL
Concentration of large HDL particles
Total cholesterol in medium HDL
Free cholesterol in medium HDL
Phospholipids in medium HDL
Cholesterol esters in medium HDL
Total lipids in medium HDL
Concentration of medium HDL particles
Triglycerides in small HDL
Total lipids in small HDL
Concentration of small HDL particles
Triglycerides in chylomicrons and extremely large VLDL
Triglycerides in VLDL
Triglycerides in IDL
Total cholesterol in IDL
Total cholesterol in LDL
Total cholesterol in HDL
Serum total triglycerides
Serum total cholesterol

8
Mean diameter for VLDL particles
Mean diameter for LDL particles
Mean diameter for HDL particles
Total cholesterol in HDL2*
Apolipoprotein A-I*
Apolipoprotein B*
Apolipoprotein B by apolipoprotein A-I*
Total cholesterol in HDL3*
LDL cholesterol (Friedewald)
HDL cholesterol by LDL cholesterol
Serum lipid extracts (‘Lipid window’)
Esterified cholesterol
Free cholesterol
Omega-3 fatty acids
Omega-6 fatty acids
Omega-7, omega-9 and saturated fatty acids
Total fatty acids
Linoleic acid
Other polyunsaturated fatty acids than linoleic acid
Docosahexaenoic acid
Monounsaturated fatty acids
Total phosphoglycerides
Phosphatidylcholine and other cholines
Sphingomyelins
Ratio of omega-3 fatty acids to total fatty acids
Ratio of omega-6 fatty acids to total fatty acids
Ratio of omega-7, omega-9 and saturated fatty acids to total fatty acids
Average number of methylene groups per fatty acid chain
Ratio of triglycerides to phosphoglycerides
Average number of methylene groups per double bond
Average number of double bonds per fatty acid chain
Ratio of bisallylic groups to double bonds
Ratio of bisallylic groups to total fatty acids
Average fatty acid chain length
Amino acids and other low-molecular-weight metabolites (serum) (‘LWMW
window’)
3-hydroxybutyrate
Acetate
Acetoacetate
Alanine
CH2 groups of mobile lipids
CH3 groups of mobile lipids
Citrate

9
Creatinine
Glucose
Glutamine
Glycerol
Alpha1-acid glycoprotein
Histidine
Isoleucine
Lactate
Leucine
Phenylalanine
Pyruvate
Tyrosine
Urea
Valine
*For computational method see Niemi et al.13

10
Supplemental Table 2. Definition and fit of composite metabolic measures for Figure 3A in
the main manuscript. The NMR metabolomics produces a number of biologically overlapping
measures from each lipoprotein subclass and lipid species. The goal of the network analysis
was to simplify the data representation, and we therefore limited our selection to the two
primary lipoprotein lipids (triglycerides and cholesterol) and excluded all derived measures
or fatty acid ratios.
Composite
measure
Block member Variance
captured
by block
score
Composite
measure
Block member Variance
captured
by block
score
VLDL
subclass
lipids
Largest VLDL-TG 70% Omega-6 FA Omega-6 FA 95%
Very large VLDL-
TG
81% Linoleic acid 95%
Large VLDL-TG 93% Monounsat.
and other FA
Omega-7,9 and
saturated FA
98%
Medium VLDL-TG 96% Monounsaturated FA 98%
Small VLDL-TG 92% Glycemia Glucose 53%
Very small VLDL-
TG
82% Hemoglobin A1c 15%
Large VLDL-C 97% Acetoacetate 25%
Medium VLDL-C 96% 3-hydroxybutyrate 50%
Small VLDL-C 77% Substrates Acetate 13%
IDL and
LDL
subclass
lipids
IDL-TG 57% Citrate 49%
IDL-C 95% Lactate 74%
Large LDL-C 97% Pyruvate 49%
Medium LDL-C 97% Branched-
chain amino
acids
Isoleucine 78%
Small LDL-C 95% Leucine 76%
HDL
subclass
lipids
Very large HDL-
TG
21% Valine 61%
Small HDL-TG 64% Other amino
acids
Alanine 29%
Very large HDL-C 66% Glutamine <1%
Large HDL-C 88% Histidine 66%
Medium HDL-C 29% Phenylalanine 73%
Omega-3
and
polyunsat.
FA
Non-18:2 PUFA 81% Tyrosine 79%
Omega-3 FA 93%
Docosahexaenoic
acid
85%

11
Supplemental Table 3. Age- and sex-adjusted Spearman correlations between the key serum
metabolome measures (see Figure 1) and the mean leisure time MET-index during the
follow-up from 1980 to 2005 among the inactive and active members of the twin pairs and
among all the twins.
Correlations with the mean MET-index during the
follow-up
Inactive (N=16) Active (N=16) All (N=32)
r r r
Lipoprotein particle concentration
Extremely large VLDL -0.23 0.06 -036*
Very large VLDL -0.20 0.08 -0.32
Large VLDL -0.16 -0.10 -0.32
Medium VLDL -0.13 0.01 -0.29
Small VLDL -0.08 -0.03 -0.17
Very small VLDL 0.09 -0.10 -0.16
IDL -0.08 -0.20 -0.25
Large LDL -0.17 -0.26 -0.32
Medium LDL -0.21 -0.21 -0.33*
Small LDL -0.27 -0.19 -0.34*
Very large HDL -0.18 0.42 0.35*
Large HDL 0.04 0.45 0.39*
Medium HDL 0.32 0.46 0.20
Small HDL 0.34 0.50* 0.07
Lipoprotein particle size
VLDL diameter -0.19 0.09 -0.26
LDL diameter 0.47 -0.27 0.08
HDL diameter -0.03 0.27 0.35*
Apolipoproteins
ApoA1 -0.25 0.53* 0.16
ApoB -0.17 -0.16 -0.26
ApoB / ApoA1 ratio -0.17 -0.27 -0.30
Triglycerides
Total triglycerides -0.09 -0.10 -0.29
Extremely large VLDL-TG -0.30 -0.08 -0.37*
Total VLDL-TG -0.12 -0.08 -0.31
IDL-TG 0.01 -0.13 -0.23
Cholesterol
Total cholesterol -0.18 -0.12 -0.24
IDL-C -0.13 -0.25 -0.27
LDLC -0.16 -0.25 -0.32
Large HDL-C -0.02 0.51* 0.45**
HDL2-C 0.09 0.62* 0.39*
HDL3-C 0.07 0.06 -0.18
HDL-C/LDL-C ratio 0.24 0.25 0.33*
Fatty acids
Omega-3 FA 0.50* 0.59* 0.48**
Omega-3 FA ratio 0.56* 0.41 0.57***
Docosahexaenoic acid 0.66** 0.28 0.50**
Non-18:2 PUFA 0.37 0.39 0.33*

12
Stars indicate statistical significance: *P<0.05, **p<0.01, ***p<0.001.
Omega-6 FA -0.11 0.12 -0.19
Omega-6 FA ratio -0.06 -0.05 0.21
Linoleic acid -0.18 -0.04 -0.25
Omega-7,9 and sat. FA 0.00 0.07 -0.16
Omega-7,9 and sat. FA ratio -0.20 -0.04 -0.31
Monounsaturated FA -0.05 0.04 -0.22
Metabolic substrates
Glucose -0.25 0.19 -0.27
Acetoacetate 0.39 -0.21 -0.10
3-hydroxybutyrate 0.11 0.17 -0.40*
Acetate 0.16 0.04 0.24
Citrate 0.16 -0.43 0.04
Lactate 0.54* 0.03 0.31
Pyruvate 0.47 0.19 0.14
Amino acids
Isoleucine -0.20 -0.24 -0.31
Leucine -0.31 0.02 -0.27
Valine 0.01 -0.24 -0.33
Alanine 0.22 -0.15 0.07
Glutamine -0.43 -0.12 -0.11
Histidine 0.08 0.15 -0.11
Phenylalanine 0.43 -0.30 -0.06
Tyrosine 0.44 -0.21 -0.12
Miscellaneous
α1-acid glycoprotein -0.09 -0.30 -0.32
Creatinine 0.17 -0.24 0.09
Urea 0.00 -0.16 -0.26
Albumin -0.22 0.36 0.18

13
Supplemental Figures
Supplemental Figure 1. Illustration of the hypothesis testing framework for
global metabolome significance in the twin study design (hypothetical data)

14
Supplemental Figure 2. Spearman correlation structure of the twin dataset,
adjusted for age and sex.
The colored pixels denote coefficients with a single test significance of P<0.05.

15
Supplemental Figure 3. Illustration of network pruning by successive
maximal spanning trees (hypothetical data)

16
Supplemental References
1. Soininen P, Kangas AJ, Würtz P, Tukiainen T, Tynkkynen T, Laatikainen R, Järvelin M-R, Kähönen
M, Lehtimäki T, Viikari J, Raitakari OT, Savolainen MJ, Ala-Korpela M. High-throughput serum
NMR metabonomics for cost-effective holistic studies on systemic metabolism. Analyst.
2009;134:1781–1785.
2. Tukiainen T, Tynkkynen T, Mäkinen V-P, Jylänki P, Kangas A, Hokkanen J, Vehtari A, Gröhn O,
Hallikainen M, Soininen H, Kivipelto M, Groop P-H, Kaski K, Laatikainen R, Soininen P, Pirttilä T,
Ala-Korpela M. A multi-metabolite analysis of serum by 1H NMR spectroscopy: early systemic signs
of Alzheimer's disease. Biochem. Biophys Res Commun. 2008;375:356–361.
3. Ala-Korpela M, Kangas AJ, Soininen P. Quantitative high-throughput metabolomics: a new era in
epidemiology and genetics. Genome Med. 2012;4:36.
4. Inouye M, Kettunen J, Soininen P, Silander K, Ripatti S, Kumpula LS, Hämäläinen E, Jousilahti P,
Kangas AJ, Männistö S, Savolainen MJ, Jula A, Leiviskä J, Palotie A, Salomaa V, Perola M, Ala-
Korpela M, Peltonen L. Metabonomic, transcriptomic, and genomic variation of a population cohort.
Mol Syst Biol. 2010;6:441.
5. Stančáková A, Paananen J, Soininen P, Kangas AJ, Bonnycastle LL, Morken MA, Collins FS,
Jackson AU, Boehnke ML, Kuusisto J, Ala-Korpela M, Laakso M. Effects of 34 risk loci for type 2
diabetes or hyperglycemia on lipoprotein subclasses and their composition in 6,580 nondiabetic
Finnish men. Diabetes. 2011;60:1608–1616.
6. Stančáková A, Civelek M, Saleem NK, Soininen P, Kangas AJ, Cederberg H, Paananen J,
Pihlajamäki J, Bonnycastle LL, Morken MA, Boehnke M, Pajukanta P, Lusis AJ, Collins FS, Kuusisto
J, Ala-Korpela M, Laakso M. Hyperglycemia and a Common Variant of GCKR Are Associated With
the Levels of Eight Amino Acids in 9,369 Finnish Men. Diabetes. 2012;61:1895–1902.
7. Chambers JC, Zhang W, Sehmi J, Li X, Wass MN, Van der Harst P, Holm H, Sanna S, Kavousi M,
Baumeister SE, Coin LJ, Deng G, Gieger C, Heard-Costa NL, Hottenga J-J, Kühnel B, Kumar V,
Lagou V, Liang L, Luan J, Vidal PM, Mateo Leach I, O'Reilly PF, Peden JF, Rahmioglu N, Soininen
P, Speliotes EK, Yuan X, Thorleifsson G, Alizadeh BZ, Atwood LD, Borecki IB, Brown MJ, Charoen
P, Cucca F, Das D, de Geus EJC, Dixon AL, Döring A, Ehret G, Eyjolfsson GI, Farrall M, Forouhi
NG, Friedrich N, Goessling W, Gudbjartsson DF, Harris TB, Hartikainen A-L, Heath S, Hirschfield
GM, Hofman A, Homuth G, Hyppönen E, Janssen HLA, Johnson T, Kangas AJ, Kema IP, Kühn JP,
Lai S, Lathrop M, Lerch MM, Li Y, Liang TJ, Lin J-P, Loos RJF, Martin NG, Moffatt MF,
Montgomery GW, Munroe PB, Musunuru K, Nakamura Y, O'Donnell CJ, Olafsson I, Penninx BW,
Pouta A, Prins BP, Prokopenko I, Puls R, Ruokonen A, Savolainen MJ, Schlessinger D, Schouten
JNL, Seedorf U, Sen-Chowdhry S, Siminovitch KA, Smit JH, Spector TD, Tan W, Teslovich TM,
Tukiainen T, Uitterlinden AG, Van der Klauw MM, Vasan RS, Wallace C, Wallaschofski H,
Wichmann H-E, Willemsen G, Würtz P, et al. Genome-wide association study identifies loci
influencing concentrations of liver enzymes in plasma. Nat Genet. 2011; 43:1131–1138.
8. International Consortium for Blood Pressure Genome-Wide Association Studies, Ehret GB, Munroe
PB, Rice KM, Bochud M, Johnson AD, Chasman DI, Smith AV, Tobin MD, Verwoert GC, Hwang S-J,
Pihur V, Vollenweider P, O'Reilly PF, Amin N, Bragg-Gresham JL, Teumer A, Glazer NL, Launer L,
Zhao JH, Aulchenko Y, Heath S, Sõber S, Parsa A, Luan J, Arora P, Dehghan A, Zhang F, Lucas G,
Hicks AA, Jackson AU, Peden JF, Tanaka T, Wild SH, Rudan I, Igl W, Milaneschi Y, Parker AN, Fava
C, Chambers JC, Fox ER, Kumari M, Go MJ, Van der Harst P, Kao WHL, Sjögren M, Vinay DG,
Alexander M, Tabara Y, Shaw-Hawkins S, Whincup PH, Liu Y, Shi G, Kuusisto J, Tayo B, Seielstad
M, Sim X, Nguyen K-DH, Lehtimäki T, Matullo G, Wu Y, Gaunt TR, Onland-Moret NC, Cooper MN,
Platou CGP, Org E, Hardy R, Dahgam S, Palmen J, Vitart V, Braund PS, Kuznetsova T, Uiterwaal

17
CSPM, Adeyemo A, Palmas W, Campbell H, Ludwig B, Tomaszewski M, Tzoulaki I, Palmer ND,
CARDIoGRAM consortium, CKDGen Consortium, KidneyGen Consortium, EchoGen consortium,
CHARGE-HF consortium, Aspelund T, Garcia M, Chang Y-PC, O'Connell JR, Steinle NI, Grobbee
DE, Arking DE, Kardia SL, Morrison AC, Hernandez D, Najjar S, McArdle WL, Hadley D, et al.
Genetic variants in novel pathways influence blood pressure and cardiovascular disease risk. Nature.
2011;478:103–109.
9. Würtz P, Mäkinen V-P, Soininen P, Kangas AJ, Tukiainen T, Kettunen J, Savolainen MJ, Tammelin
T, Viikari JS, Rönnemaa T, Kähönen M, Lehtimäki T, Ripatti S, Raitakari OT, Järvelin M-R, Ala-
Korpela M. Metabolic signatures of insulin resistance in 7,098 young adults. Diabetes. 2012;61:1372–
1380.
10. Tukiainen T, Kettunen J, Kangas AJ, Lyytikainen LP, Soininen P, Sarin AP, Tikkanen E, O'Reilly
PF, Savolainen MJ, Kaski K, Pouta A, Jula A, Lehtimaki T, Kahonen M, Viikari J, Taskinen MR,
Jauhiainen M, Eriksson JG, Raitakari O, Salomaa V, Jarvelin MR, Perola M, Palotie A, Ala-Korpela
M, Ripatti S. Detailed metabolic and genetic characterization reveals new associations for 30 known
lipid loci. Hum Mol Genet. 2012;21:1444–1455.
11. Kettunen J, Tukiainen T, Sarin A-P, Ortega-Alonso A, Tikkanen E, Lyytikäinen L-P, Kangas AJ,
Soininen P, Würtz P, Silander K, Dick DM, Rose RJ, Savolainen MJ, Viikari J, Kähönen M,
Lehtimäki T, Pietiläinen KH, Inouye M, McCarthy MI, Jula A, Eriksson J, Raitakari OT, Salomaa V,
Kaprio J, Järvelin M-R, Peltonen L, Perola M, Freimer NB, Ala-Korpela M, Palotie A, Ripatti S.
Genome-wide association study identifies multiple loci influencing human serum metabolite levels.
Nat Genet. 2012;44:269–276.
12. Okazaki M, Usui S, Ishigami M, Sakai N, Nakamura T, Matsuzawa Y, Yamashita S. Identification
of unique lipoprotein subclasses for visceral obesity by component analysis of cholesterol profile in
high-performance liquid chromatography. Arterioscler Thromb Vasc Biol. 2005;25:578–584.
13. Niemi J, Mäkinen V-P, Heikkonen J, Tenkanen L, Hiltunen Y, Hannuksela ML, Jauhiainen M,
Forsblom C, Taskinen M-R, Kesäniemi YA, Savolainen MJ, Kaski K, Groop P-H, Kovanen PT, Ala-
Korpela M. Estimation of VLDL, IDL, LDL, HDL2, apoA-I, and apoB from the Friedewald inputs--
apoB and IDL, but not LDL, are associated with mortality in type 1 diabetes. Ann Med. 2009;41:451–
461.
14. Wald A, Wolfowitz J. Statistical tests based on permutations of the observations. Ann Math Statist.
1944;15:358-372.
15. Ludbrook J. Advantages of permutation (randomization) tests in clinical and experimental
pharmacology and physiology. Clin Exp Pharmacol Physiol. 1994;21:673-686.
16. Efron B. Bootstrap methods: another look at the Jackknife. Ann Stat. 1979;7:1-26.
17. Kruskal JB. On the shortest spanning subtree of a graph and the traveling salesman problem. Proc
Am Mathem Soc. 1956;7:48–50.
18. Mäkinen VP, Forsblom C, Thorn LM, Wadén J, Kaski K, Ala-Korpela M, Groop PH. Network of
vascular diseases, death and biochemical characteristics in a set of 4,197 patients with type 1 diabetes.
Cardiovasc Diabetol. 2009;8:54.