Embed Size (px)
Citation preview

Supplemental Information
Long term census data reveal abundant wildlife populations at Chernobyl
T.G. Deryabina, S.V. Kuchmel, L.L. Nagorskaya, T.G. Hinton, J.C. Beasley, A. Lerebours, and J.T. Smith
Supplemental Experimental Procedures
Winter animal track surveys
Censuses of large mammal populations are commonly conducted using a standard method of
observation of tracks in fresh snow along permanent walking routes (e.g. [S1,S2]). Track
surveys are conducted the day after newly-fallen snow, and only fresh tracks are counted
[S3]. The number of tracks of each species are counted on each census route, providing data
on relative animal activity. The calculation of absolute population density is based on a
formula using a relationship between the number of tracks observed and a standard average
distance travelled of each species, though we here use relative rather than absolute densities.
For the PSRER (Polessye State Radioecological Reserve, i.e. the Belarus sector of the
Chernobyl Exclusion Zone, CEZ), track surveys were carried out on a single day in February
by a number (typically 16) of trained staff. Censuses were conducted between 2008 and 2010
on permanent routes with total length of 315 km and mean track length 9 km (Figure S1). For
comparisons between different routes in the PSRER (Hypothesis 1), we compared track
counts per 10 km length as a measure of animal activity in different parts of the CEZ.
Other nature reserves in Belarus use the same standard method of winter route survey and
have similar coverage to the PSRER study [S3]. Estimates of large mammal populations in
PSRER and other nature reserves in Belarus were obtained from the Ministry of Natural
Resources population density report [S4] which uses the winter route survey data. The

population density, D (no. per 1000 ha or 10 km2) is estimated as D = 10.N.K/L where N is
the number of tracks of a given animal per day per km of route, L is route length in km and K
is an empirical coefficient dependent on the depth of snow cover and mean daily travel
distance of each animal [S3]. In the present study (Hypothesis 2), we compare relative animal
densities between nature reserves.
The following species were identified at PSRER during the winter track censuses: wild boar
Sus scrofa, elk Alces alces, roe deer Capreolus capreolus, red deer Cervus elaphus, wolf
Canis lupus, fox Vulpes vulpes, weasel Mustela nivalis, lynx Lynx lynx, pine marten Martes
martes, raccoon dog Nyctereutes procyonoides, mink Mustela lutreola, ermine Mustela
erminea, stone marten Martes foina, polecat Mustela putorius, European hare Lepus
europaeus, white hare Lepus timidus, red squirrel Sciurus vulgaris. A similar wide range of
mammal species has previously been observed in the Ukrainian sector of the CEZ by Sergey
Gaschak and colleagues [S5] and presence of wolf, lynx and brown bear (Ursus arctos) has
also been recorded in Ukraine by Shkvyria and Vishnevskiy [S6].
Aerial surveys of large mammals (Hypothesis 3)
Because of the high level of radioactive contamination during the first years after the
accident, aerial surveys of mammal populations were conducted rather than ground surveys
with personnel in the field. We analysed historical data in reports of the PSRER. The aerial
routes covered all land types in the PSRER, including stands of the dominant evergreen
(pine) and deciduous (silver birch, aspen, alder) tree species of different age classes. Aerial
censuses (by direct counting of observed animals) were conducted between 1987 and 1997
with a Kamov KA-26 helicopter during February-early March when snow cover was present.

Transects were flown across the study area by two investigators at a height of 100 m with
speed of 70-100 km/h. The survey area was approximately 250 m on each side of the
helicopter as determined by markings on the helicopter viewing windows. Flights were flown
over representative transects within the PSRER (Table S1), arranged so as to minimize the
possibility of double-counting of animals. Because of logistical limitations (availability of
helicopter; weather conditions), the same amount of land was not always surveyed, however
the same zones were overflown each year. On each year approximately 22,000 ha (range
15,000-32,000) of transects were flown, but on two years (1987 and 89) a significantly
smaller area (6500 ha) was flown, so statistical analyses were carried out both with and
without including those years. Note that our aerial survey data are interpreted as relative
abundances, not absolute population densites since there is known bias in aerial survey data
[S7]. Aerial survey has been shown (for elk) to give consistent time trends in population
estimates compared to other survey methods in a broadly similar habitat [S8]. A study [S9] of
white-tailed deer (Odocoileus virginianus) in coniferous forests in the U.S. found that,
although there was significant negative bias in aerial survey, this bias was consistent across a
three year period.
Supplemental Statistical Analyses
Hypothesis 1. Possible associations between contamination density, species activity (elk,
boar, roe deer, wolf, fox, non predatory and small predatory mammals) and habitat over the
35 transects were investigated using Spearman’s rank correlation. Correlation coefficients (ρ)
and significance (H ≠ H0, H0: the two variables are independent, α=0.05) were assessed by
the « rcorr » function (Hmisc package) using R 3.0 (R Development Core Team 2013). No
significant correlation was found either between contamination density and species activity or
between contamination density and the major habitat types.

To further evaluate the influence of radiation and habitat on animal densities within the
PSRER, we characterized habitat and radiation parameters along each of the 35 track survey
routes. Radioactivity levels throughout the PSRER have been extensively mapped [S10] and
specific values for each route were extracted from a Geographical Information System
(Figure S1). Radiation levels within the GIS were binned into eight zones of contamination
and thus we utilized median values within each contaminant zone and the minimum value
within the most contaminated zone to determine average radiation values for each route.
Habitat attributes were recorded along each route by observers and we included the
proportion of each route encompassing former agricultural lands, former villages, evergreen
forest, and deciduous forest in our analyses. Pearson correlation tests indicated that
multicolinearity (≥0.50) existed among some (i.e. evergreen and deciduous, agriculture and
evergreen) of the variables selected for inclusion in our analyses. Therefore, only
combinations of uncorrelated variables were included in subsequent models.
For each species (elk, boar, wolf, roe deer), or combination of species in the case of predatory
and non-predatory small mammals, we evaluated the influence of radiation level and habitat
on animal densities using linear mixed models with repeated measures (PROC MIXED, SAS
ver. 9.3, SAS Institute, Cary, N.C., USA). For each species we first developed a global model
including all habitat variables and investigated the covariance structure of this model by
evaluating model fit across four common covariance structures (compound symmetry,
unstructured, autoregressive, and heterogeneous autoregressive) using the corrected Akaike
Information Criterion (AICc) [S11]. Using the best-fit covariance structure we constructed a
suite of 15 candidate models for each species incorporating all combinations of uncorrelated
variables and ranked models using AICc. We calculated model weights for all models within
Δ4 AICc units of the top model. For all species, our statistical models (which included habitat
variation) rejected radioactive contamination as an important predictor of mammal density
within PSRER. To test whether the circular nature of 5 of the routes had influenced results,
we re-ran the statistical analysis with these routes excluded: radiation was again not included
in any of the supported models.
Hypothesis 2. The effect of nature reserve on mammal densities was tested using generalized
linear models (Poisson family, link log) with the anova.glm function in R. The normality of
the residuals was checked using the Shapiro-Wilk normality test. The significance of
differences between each species’ density (elk, red deer, roe deer, wild boar and wolf) in the
nature reserves was assessed by the contrast method [S12] with the Esticon function in R
(DoBy package [S13]). Statistical analyses were performed using R 3.0 (R Development
Core Team 2013). No model was validated for wolf because the much higher wolf density at
PSRER made it an outlier compared to the other reserves: the normality of the residuals was
not respected even after log-transformation of the data. However, it is obvious that wolf
densities were much higher at PSRER than at the other reserves (Fig. S2).
Comparison matrices (contrasts method) showed that the density of elk was significantly (p <
0.01) higher at PSRER than at the other nature reserves. Roe deer density was not
significantly different between PSRER and Braslav, Belovezha and Narochansky reserves.
Red deer density was not significantly different between PSRER and Berezinsky, Braslav and
Narochansky, but Belovezha reserve had significantly higher red deer and wild boar (p <
0.01) than the other reserves and wild boar population density was higher in PSRER than in
Narochansky and Berezinsky (p < 0.01). Wolf density at PSRER is an outlier being 7.3 times
higher than at Berezinsky, the second highest.

Hypothesis 3. Time trends in mammal densities were tested using a one-tailed t-test to test
for positive and significantly greater than zero slope. Where necessary, data were log-
transformed to ensure that residuals in the linear regression were normally distributed. Aerial
survey counts of wild boar (1987-97), elk and roe deer (1988-96) increased significantly (p <
0.01) over time. To account for differences in area studied in different years, we re-analysed
the time trend data excluding the two years where only the smaller core area was flown (due
to logistical constraints). For elk and roe deer the significant positive correlation with time
remained the same. For wild boar, positive correlation was only weakly significant (p = 0.1)
due to high variability (for reasons discussed in text) in counts in the period 1993-97, but
(clearly) there was no evidence of decrease in boar density over time, supporting the negative
outcome of Hypothesis 3.
Dose rate estimation
In statistical analyses for Hypothesis 1 we used radiocaesium contamination density, but
consideration of radiation dose rates helps give the study context. The ERICA Assessment
Tool version 1.0 [S14] was used in all the dose rate calculations. The PSRER Contaminant
Map (from [S10]) is based on a deposition density of 137Cs in kBq m-2 with a reference date
of 2009. Dose calculations were based on a deposition of 1000 kBq m-2, then scaled to give
estimated dose rates for different zones of contamination. The ERICA model [S14] requires
soil contaminant levels to be expressed in activity per unit mass, rather than activity per unit
area. A soil bulk density of 1100 kg m-3 [S15] and soil contaminant depth of 0.1 m was used
to convert the radioactivity per unit area to a mass activity concentration that equaled 9 kBq

kg-1. For 90Sr, soil deposition density of 100 kBq m-2 was assumed, based on a 90Sr
contaminant density map [S10], resulting in a 90Sr soil contamination level of 0.9 kBq kg-1.
Doses were computed for 137Cs and 90Sr using ERICA’s reference large mammal (deer) and
default concentration ratios of respectively 2.87 and 1.74 Bq kg-1 (fresh) tissue / Bq kg-1 (dry)
soil [S16] (Supplemental Information Tables S2 and S3). Radionuclide-specific dose
conversion coefficients (DCCs) for ERICA’s generic deer were used.
It should be noted that there are significant uncertainties in estimation of internal dose using
the ERICA model owing primarily to variation in animal-deposition aggregated concentration
coefficients. However, in this case the range of dose rates predicted by ERICA broadly agrees
with measured data from PSRER. Measurements [S17] between 2011-13 of 137Cs in muscle
of wild boar and raccoon dog led to a range of internal doses from 0.034-68.6 and 0.20-179
µGy h-1 respectively. These ranges are larger than the calculated internal dose range for our
study routes (1.04-51.8 µGy h-1) for the ERICA reference mammal, though this is not
surprising since the model calculates area averaged dose rates whilst the measured data gives
ranges for individual animals.
Brief description of the nature reserves of Belarus
Polessye State Radioecological Reserve (PSRER)
The evacuated region of Belarus surrounding Chernobyl is now called the Polessye State
Radioecological Reserve (PSRER) and covers 2165 km2. The reserve is bisected by the
Pripyat River which allows animal crossings, particularly during winter ice cover. Prior to the
1986 Chernobyl accident, the area contained 92 villages inhabited by more than 22,000

people (10 people km-2) and was exploited for commercial forestry and agriculture.
Currently, a staff of approximately 10-12 people live within the PSRER with a human
population density of approximately 0.005 persons km-2, though more work there on a daily
basis. Note that the Ukrainian sector of the CEZ has a significantly larger population
(numbering in the thousands) working at the nuclear site and in the town of Chernobyl, as
well as unofficial residents of some villages. Hunting is banned in the PSRER, though until
2005 hunting was carried out in some years to control the wolf population. It is believed that
some poaching of game animals occurs, though this is not well quantified. Forests cover
51.1% of the territory: the forests are composed of 44.1% pine, 7.3% broad-leaved (mostly
oak) and 45.3% small-leaved (birch, alder). The areas not covered by forest are mostly
former reclaimed farmland and floodplain lands. Wetlands occupy about 4% of the territory
and about 1.6% is covered by lakes and rivers.
Berezinsky Biosphere Nature Reserve (BBNR)
The Berezinsky Biosphere Reserve is a state nature reserve covering 852 km2 holding the
European Diploma of Protected Areas. The Berezina River flows from the North to South of
the area: the river floodplain, 69 tributaries and seven lakes cover > 20 km2 of land surface. A
particular feature of the BBNR is the presence of wetlands (covering 521 km2 or 61% of the
land surface). Forests cover 89,1% of the area (coniferous 51% and deciduous 49%).
Eighteen of the habitat types are designated as special areas of conservation within the EC
Habitats Directive. There are 15 villages within the Nature Reserve and the human population
density is 1 person km-2 though the core area (~87% of land) has no human habitation. No
hunting is allowed within the reserve boundaries.

Braslav Lakes National Park
The Braslav Lakes National Park covers 645 km2. Forests (coniferous >61% and deciduous
~33%) cover 34,200 ha or 51 % of the reserve. There are 74 lakes (125 km2) covering 19.5%
of the area and 13% is comprised of rivers and wetland sites. The one town, Braslav, has a
population of 11,000 and there are 74 villages; the area is also a popular tourist destination.
The human population density is 20.2 people km-2. No hunting is allowed within the reserve
boundaries.
Belovezhskaya Puscha National Park
The Belovezhskaya Puscha is the oldest of the protected areas, and is a UNESCO World
Heritage site. It is situated both in Poland (105 km2) and Belarus (1501 km2). Forests
(coniferous and deciduous) cover 78% of the area, 7% is wetland and, 5% is meadow. There
are 85 villages in the Belovezhskaya Puscha giving a human population density of 3.7 people
km-2. Regulated hunting is allowed in some “recreational” areas but not within the main
conservation area.
Narochansky National Park
The Narochansky National Park covers 874 km2 comprised of forest (379 km2 ; 43%), 43
lakes and many rivers covering 180 km2 (21%), wetlands (8%) and approximately 28% is
agricultural land. There is one town, Myadel and 110 villages and the national park is an
important tourist destination (9 sanatoriums and 5 recreation centres). The human population
density is 32 people km-2. Regulated hunting is allowed in some “recreational” areas.

1
10
100
100 1000 10000
137Cs, kBq m‐2
Roe deer
1
10
100
100 1000 10000
137Cs, kBq m‐2
Fox
1
10
100
100 1000 10000137Cs, kBq m‐2
Wild Boar
0.1
1
10
100
100 1000 10000137Cs, kBq m‐2
Other Predatory
0.1
1
10
100
100 1000 10000137Cs, kBq m‐2
Other Non‐predatory Figure S1. Above: Map of 137Cs
contamination density [S10] in PSRER for 2009 and winter track survey routes. Below: Track counts /10 km for roe deer, fox, wild boar, other predatory mammals (weasel, lynx, pine marten, raccoon dog, mink, ermine, stone marten, polecat) and small non‐predatory mammals (European hare,
white hare, red squirrel) vs. mean 137Cs
contamination density. Open circles: no recorded tracks.

Figure S2. Comparison of large mammal population estimates (by winter route registration, 2005-2010) between the radioactively-contaminated Polessye State Radioecological Reserve (PSRER) and nature reserves in uncontaminated parts of Belarus. Error bars show two standard error deviation from the mean based on between-year variation. Data are from the Ministry of Natural Resources of Belarus' environmental monitoring report [S4].
0.001
0.01
0.1
1
10
Elk Red deer Roe deer Wild boar Wolf
Relative population density /km
2
Berezinsky
Braslav
Belovezha
Narochansky
PSRER (Chernobyl)
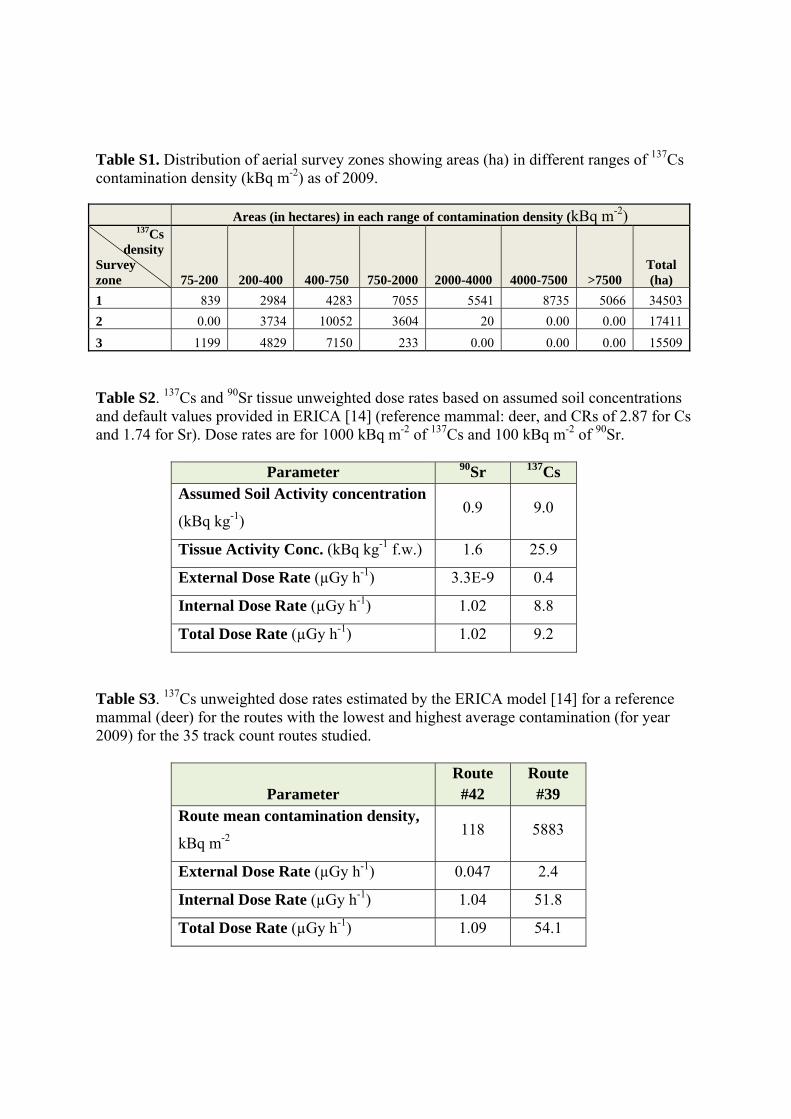
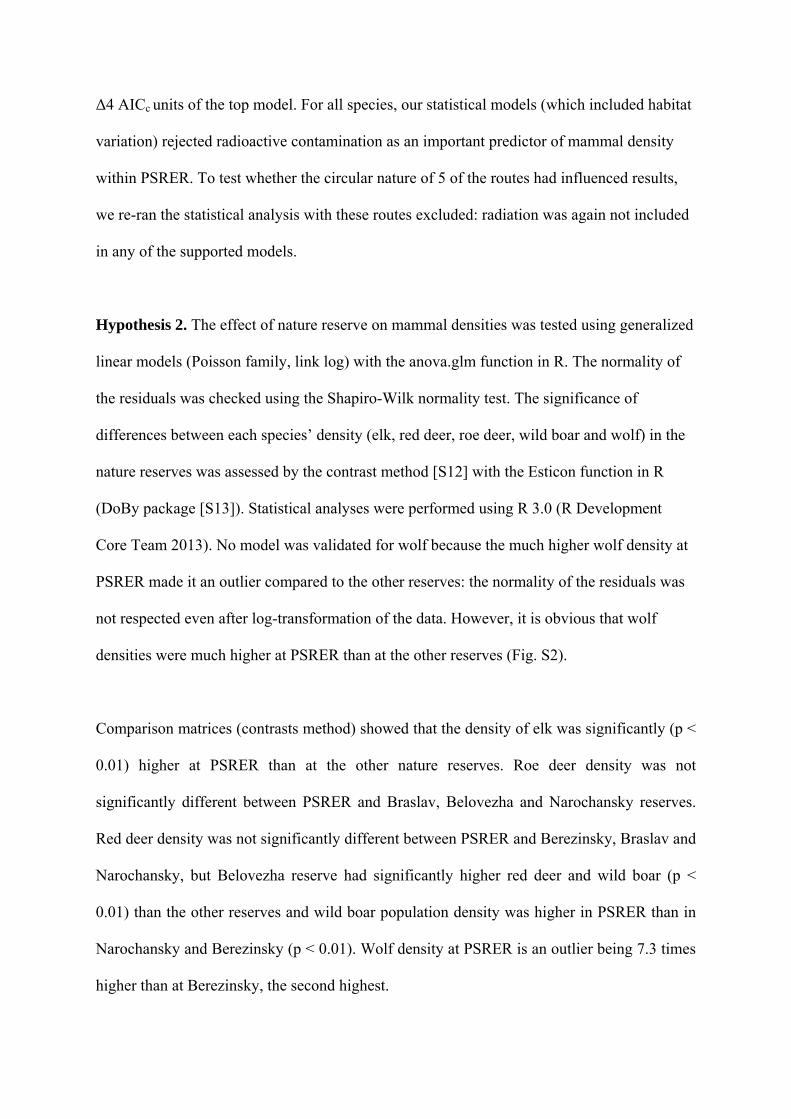
Table S1. Distribution of aerial survey zones showing areas (ha) in different ranges of 137Cs contamination density (kBq m-2) as of 2009.
Areas (in hectares) in each range of contamination density (kBq m-2) 137Cs
density Survey zone 75-200 200-400 400-750 750-2000 2000-4000 4000-7500 >7500
Total (ha)
1 839 2984 4283 7055 5541 8735 5066 34503
2 0.00 3734 10052 3604 20 0.00 0.00 17411
3 1199 4829 7150 233 0.00 0.00 0.00 15509
Table S2. 137Cs and 90Sr tissue unweighted dose rates based on assumed soil concentrations and default values provided in ERICA [14] (reference mammal: deer, and CRs of 2.87 for Cs and 1.74 for Sr). Dose rates are for 1000 kBq m-2 of 137Cs and 100 kBq m-2 of 90Sr.
Parameter 90Sr 137Cs Assumed Soil Activity concentration
(kBq kg-1) 0.9 9.0
Tissue Activity Conc. (kBq kg-1 f.w.) 1.6 25.9
External Dose Rate (µGy h-1) 3.3E-9 0.4
Internal Dose Rate (µGy h-1) 1.02 8.8
Total Dose Rate (µGy h-1) 1.02 9.2
Table S3. 137Cs unweighted dose rates estimated by the ERICA model [14] for a reference mammal (deer) for the routes with the lowest and highest average contamination (for year 2009) for the 35 track count routes studied.
Parameter Route
#42 Route
#39 Route mean contamination density,
kBq m-2 118 5883
External Dose Rate (µGy h-1) 0.047 2.4
Internal Dose Rate (µGy h-1) 1.04 51.8
Total Dose Rate (µGy h-1) 1.09 54.1

Supplemental References S1. Bragina, E.V., Ives, A.R., Pidgeon, A.M., Kuemmerle, T., Baskin, L.M., Gubar, Y.P., Piquer-
RodríGuez, M., Keuler, N.S., Petrosyan, V.G., and Radeloff, V.C. (2015). Rapid declines of large mammal populations after the collapse of the Soviet Union. Conservation Biology, n/a-n/a.
S2. Møller, A.P., and Mousseau, T.A. (2013). Assessing effects of radiation on abundance of mammals and predator–prey interactions in Chernobyl using tracks in the snow. Ecological Indicators 26, 112-116.
S3. Resources, M.o.F. (2012). Technology of winter route census of game animals. (Minsk), p. 27. S4. Resources, M.o.N. (2011). National system of environmental monitoring of the Republic of Belarus:
results of observations: 2010, (Minsk: Belarussian Research Centre "Ecology"). S5. Bondarkov, M.D., Oskolkov, B.Y., Gaschak, S.P., Kireev, S.I., Maksimenko, A.M., Proskura, N.I.,
Jannik, G.T., and Farfán, E.B. (2011). Environmental radiation monitoring in the Chernobyl exclusion zone—history and results 25 years after. Health physics 101, 442-485.
S6. Shkvyria, M., and Vishnevskiy, D. (2012). Large carnivores of the Chernobyl Nuclear Power Plant Exclusion Zone. Vestnik Zoologii 46, 21-28.
S7. Caughley, G. (1974). Bias in aerial survey. The Journal of Wildlife Management, 921-933. S8. Rönnegård, L., Sand, H., Andrén, H., Månsson, J., and Pehrson, Å. (2008). Evaluation of four methods
used to estimate population density of moose Alces alces. Wildlife Biology 14, 358-371. S9. Floyd, T.J., Mech, L.D., and Nelson, M.E. (1979). An improved method of censusing deer in
deciduous-coniferous forests. The Journal of Wildlife Management, 258-261. S10. Izrael, Y.A., and Bogdevich, I.M. (2009). Atlas of current and predicted consequences of the
Chernobyl accident on the affected territories of Russia and Belarus, (Minsk: Belkartographia). S11. Burnham, K.P., and Anderson, D.R. (2002). Model selection and multimodel inference: a practical
information-theoretic approach, (Springer Science & Business Media). S12. Chambers, J.M., and Hastie, T.J. (1991). Statistical models in S, (CRC Press, Inc.). S13. Højsgaard, S. (2004). Statistical inference in context specific interaction models for contingency tables.
Scandinavian journal of statistics 31, 143-158. S14. Brown, J.E., Alfonso, B., Avila, R., Beresford, N.A., Copplestone, D., Pröhl, G., and Ulanovsky, A.
(2008). The ERICA Tool. Journal of Environmental Radioactivity 99, 1371-1383. S15. Beresford, N.A., Barnett, C.L., Brown, J.E., Cheng, J.J., Copplestone, D., Gaschak, S., Hosseini, A.,
Howard, B.J., Kamboj, S., Nedveckaite, T., et al. (2010). Predicting the radiation exposure of terrestrial wildlife in the Chernobyl exclusion zone: an international comparison of approaches. J Radiol Prot 30, 341-373.
S16. Copplestone, D., Beresford, N., Brown, J., and Yankovich, T. (2013). An international database of radionuclide concentration ratios for wildlife: development and uses. Journal of environmental radioactivity 126, 288-298.
S17. Kuchmel, S.V., and Urchenko, I.S. (2014). Maintenance in tissues and an estimation of dose of internal radiation of Cs-137 and Sr-90 in wild boar and raccoon dog in territory of the zone of alienation of the Chernobyl NPP. In Sakharov Readings 2014: Environmental Problems of the XXI Century. (Minsk, Belarus), pp. 161-162.