Embed Size (px)
Citation preview
Cell Host & Microbe, Volume 18
Supplemental Information
BIRC2/cIAP1 Is a Negative Regulator of HIV-1 Transcription and Can Be Targeted by Smac Mimetics to Promote Reversal of Viral Latency Lars Pache, Miriam S. Dutra, Adam M. Spivak, John M. Marlett, Jeffrey P. Murry, Young Hwang, Ana M. Maestre, Lara Manganaro, Mitchell Vamos, Peter Teriete, Laura J. Martins, Renate König, Viviana Simon, Alberto Bosque, Ana Fernandez-Sesma, Nicholas D.P. Cosford, Frederic D. Bushman, John A.T. Young, Vicente Planelles, and Sumit K. Chanda
0.1<0.1 >101 10
Normalized levels
Inte
grat
ed p
rovir
us
Tota
l HIV
DNA
HIV
mRN
ALu
cife
rase
exp
ress
ion
Cell
viab
ility
Targ
et g
ene
mRN
A le
vel
ACTL6ABIRC2
CASP8AP2
CNP
COL24A1COL6A1
CUL3
EIF3L
MCM2
MMP3HLA-B
RNF7
Figure S1
A
B
10-3 10-2 10-1 100 101 102 103 104 1050
10
20
30
40
Concentration [nM]
% G
FP+
cells
TL32711LCL161
SBI-0637142
GDC-0152
Neg C
trl LTRI B
0
2
4
6
8
10
Fold
of c
ontro
l (Ig
G)
DMSOTNF
Neg C
trl LTRI B
0
3
6
9
12
15
18
Fold
of c
ontro
l (Ig
G)
DMSOTNF
*******
RELB RELA
2 6 241290.1
1
10
hours post-treatment
norm
aliz
ed H
IVvR
NA
leve
l **
********
SBI-0637142DMSO
Figure S2
A
C
D
E
SBI-0637142 − + − + BIRC3 BIRC2
NIK
COX4
COX4
p100
2 6 241290.1
1
10
hours post-treatment
norm
aliz
ed H
IVvR
NA
leve
l **
** ******
SBI-0637142DMSO
2 6 241290.1
1
10
hours post-treatment
norm
aliz
ed H
IV-1
vRN
A le
vel **
** ******
SBI-0637142DMSO
2 6 241290.1
1
10
Hours post-treatment
Nor
mal
ized
HIV
-1vR
NA
leve
l **
** ******
SBI-0637142DMSO
B
0 1 2 3 4 50
20
40
60
80
100
0.0
0.5
1.0
log c(Vorinostat) [nM]
% G
FP+
cells
Norm
alized cell viability
-1 0 1 2 30
20
40
60
80
100
0.0
0.5
1.0
log c(Panobinostat) [nM]
% G
FP+
cells
Norm
alized cell viability
Suppl. Figure 3
10-11
10-10
10-9
10-8
10-7
10-6
10-5
0
1
2
3
4
c(SBI-0637142) [M]
Syn
ergy
JLat 10.6
10-11
10-10
10-9
10-8
10-7
10-6
10-5
0
1
2
3
4
c(SBI-0637142) [M]
Syn
ergy
2D10
10-11
10-10
10-9
10-8
10-7
10-6
10-5
0
1
2
3
4
c(LCL161) [M]
Syn
ergy
Panobinostat Vorinostat
2D10
10-11
10-10
10-9
10-8
10-7
10-6
10-5
0
1
2
3
4
c(SBI-0637142) [M]
Syn
ergy
5A8
Suppl. Figure 4
0
50
100
% C
D69
+ ce
lls
*** ***
nsnsns
− + − + − −− − + + − −− − − − + −− − − − − +
SBI-0637142Panobinostat
BryostatinCD3/CD28 Ab
Figure S3
A
B
C
SUPPLEMENTAL FIGURE LEGENDS
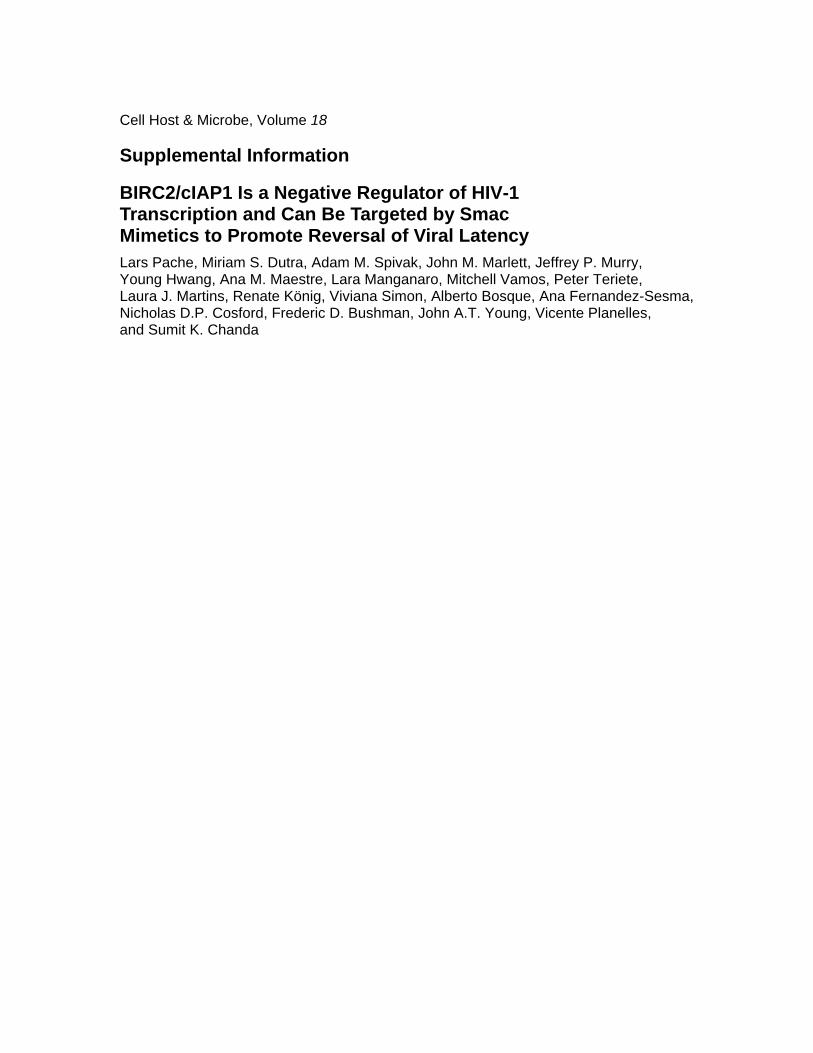
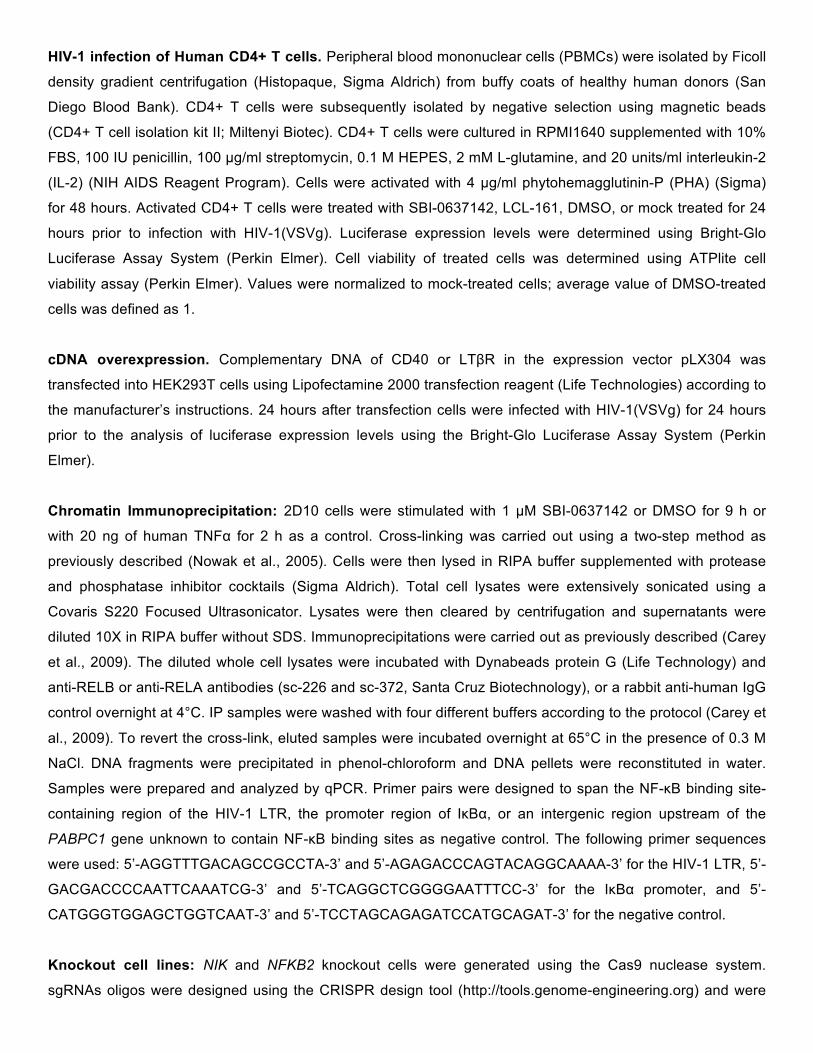
Figure S1, related to Figure 1.
(A) Analysis of cell cycle progression upon gene knockdown. Cell cycle progression of HEK293T cells
treated with individual siRNAs was evaluated by staining of the cells with propidium iodide and subsequent
analysis by FACS. Transfection with non-targeting siRNAs (controls) was compared to untransfected cells.
Non-targeting control siRNA #1 (red) and 2 or 3 targeting siRNAs (green, blue, orange) are shown for each
indicated gene.
(B) Heatmap showing the effects of identified genes on specific steps of HIV-1 replication. HEK293T
cells were treated with individual siRNAs targeting the indicated genes. Following infection with HIV-1(VSVg)
the levels of HIV-1 total DNA, integrated provirus, and HIV-1 mRNA were determined by qPCR. Also shown
are luciferase expression levels, target gene knockdown levels, and cell viability upon target gene knockdown.
All values are normalized to non-targeting control siRNAs.
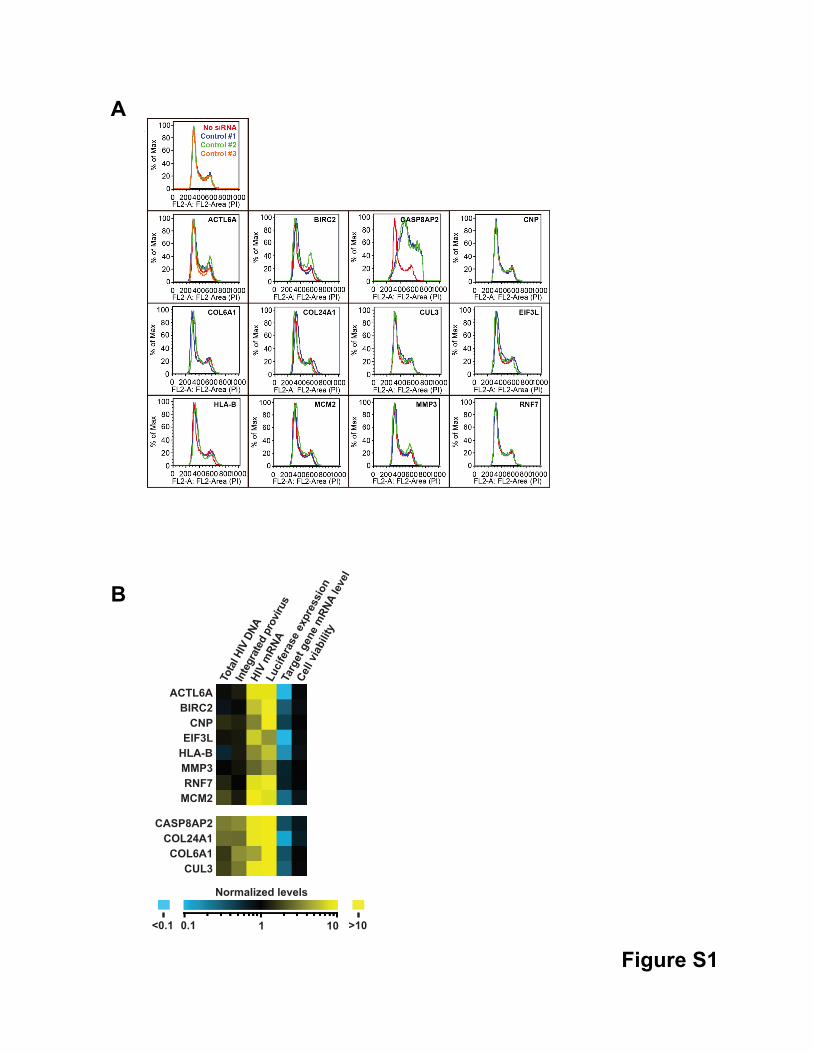
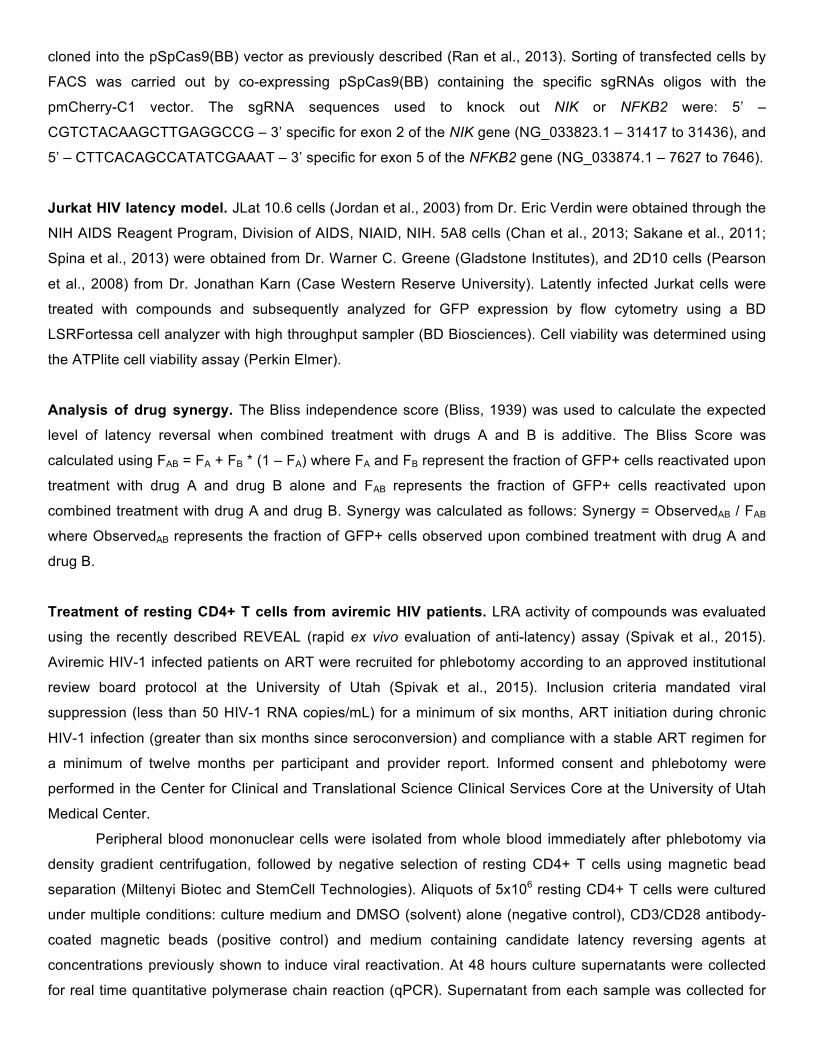
Figure S2, related to Figure 3.
(A) Smac mimetics act as latency reversing agents. 2D10 cells were treated with SBI-0637142, TL32711
(Birinapant), LCL161, or GDC-0152 for 36 hours at the indicated concentrations. Reversal of HIV latency was
evaluated by measuring GFP expression using flow cytometry. Data are represented as mean ± SD of three
biological replicates. Dotted line represents values of untreated cells.
(B) Kinetics of viral RNA expression in latently infected Jurkat cells upon Smac mimetic treatment.
2D10 cells were treated with 1µM SBI-0637142 or DMSO as negative control. Intracellular viral RNA levels
were determined by qPCR at the time points indicated. Data was normalized to GAPDH. Graph shows mean ±
SD of three biological replicates. ** indicates p < 0.01, *** indicates p < 0.001, determined by unpaired t-test.
(C) Knockout of NIK in 2D10 cells. Wild-type 2D10 cells and a clone with a knockout of NIK were treated with
DMSO or 1µM SBI-0637142 and analyzed by Western blot for NIK expression levels.
(D) Impact of TNFα treatment on RELA and RELB interaction with the HIV-1 LTR. 2D10 cells were treated
with 20ng/ml TNFα for 2 hours prior to ChIP analysis using antibodies against RELA, RELB, or IgG as control.
RELA and RELB specific association with the HIV-1 LTR and the IκBα gene promoter region, or an intergenic
region upstream of the PABPC1 gene unknown to contain NF-κB binding sites as negative control, was
detected by qPCR using specific primers and is shown as fold enrichment over IgG control. Data are
represented as mean ± SEM of at least three experiments. *** indicates p≤0.001, **** indicates p≤0.0001,
determined by unpaired t-test.
(E) Knockout of NFKB2 in 2D10 cells. Wild-type 2D10 cells and a clone with a knockout of NFKB2 were
analyzed by Western blot for p100 expression levels.
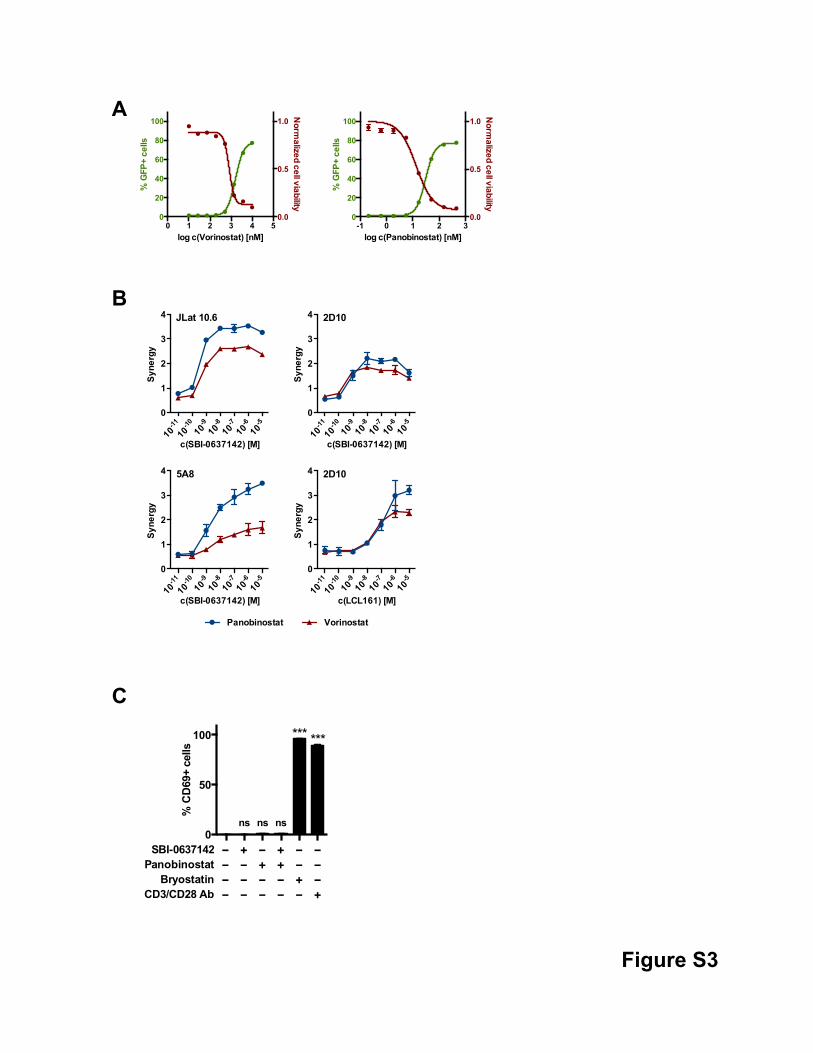
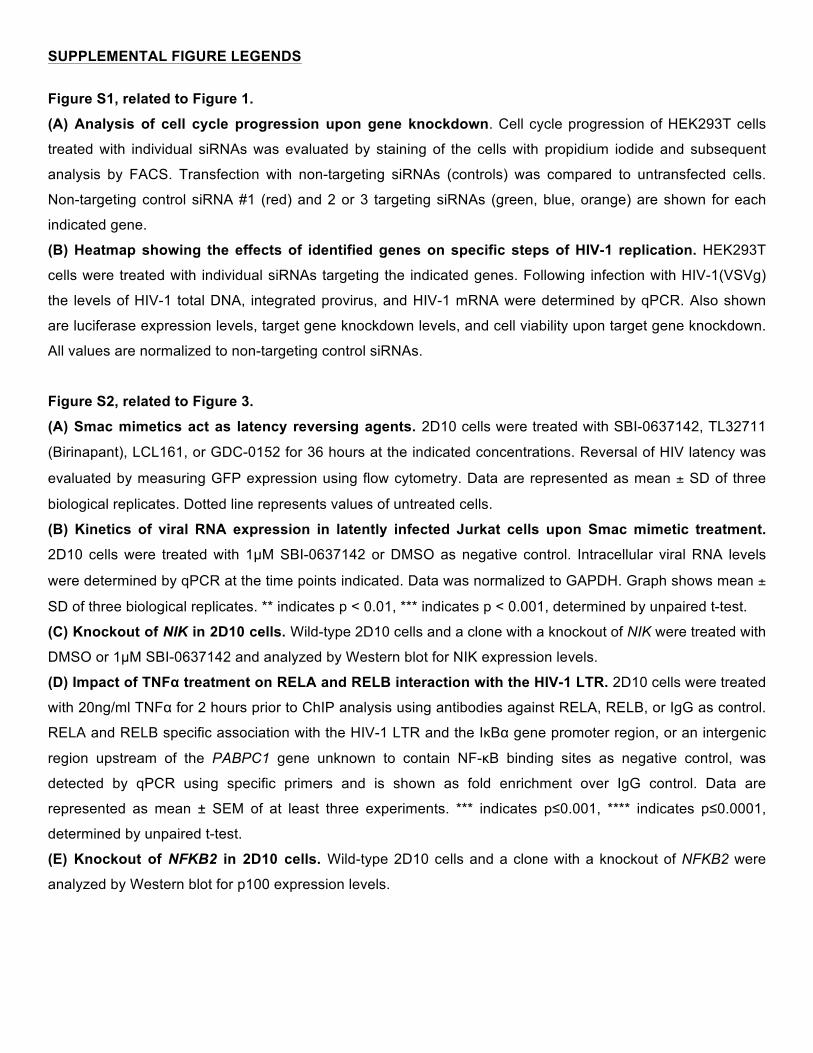
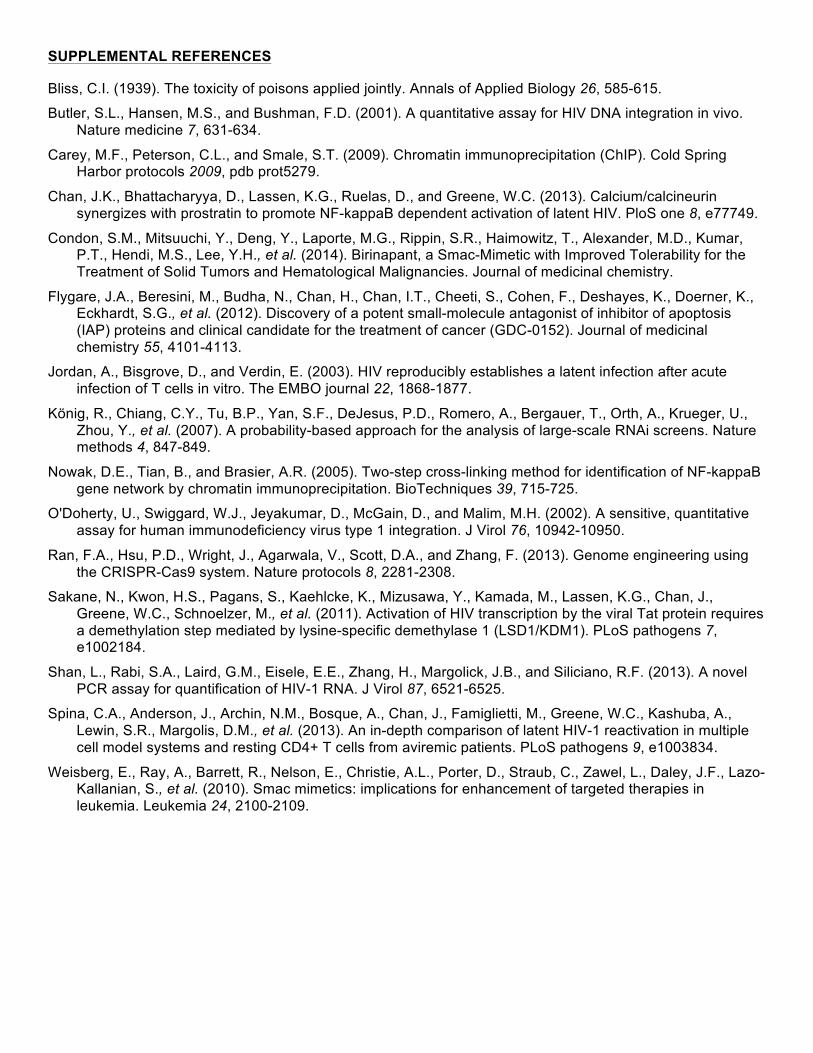
Figure S3, related to Figure 4.
(A) Dose response of JLat 10.6 cells treated with HDACi. Following treatment with panobinostat or
vorinostat for 36 hours JLat 10.6 cells were evaluated for reactivation of latent provirus by measuring GFP
expression using flow cytometry. Cell viability was assessed by determining cellular ATP levels.
(B) Level of drug synergy between Smac mimetic and HDACi. The level of synergy between HDACi and
Smac mimetics, when used in combination (see Fig. 4A), was evaluated using the Bliss independence model.
Data are represented as mean ± SD of biological triplicates.
(C) Activation of resting CD4+ T cells upon LRA treatment. Resting CD4+ T cells from three healthy
donors were treated with 10µM SBI-0637142, 100nM Panobinostat, 30nM Bryostatin, CD3/CD28 antibody
beads, or a combination thereof, for 48 hours prior to analysis of CD69 surface expression by FACS. Data is
represented as mean ± SEM of three donors. *** indicates p < 0.001 determined by unpaired t-test.
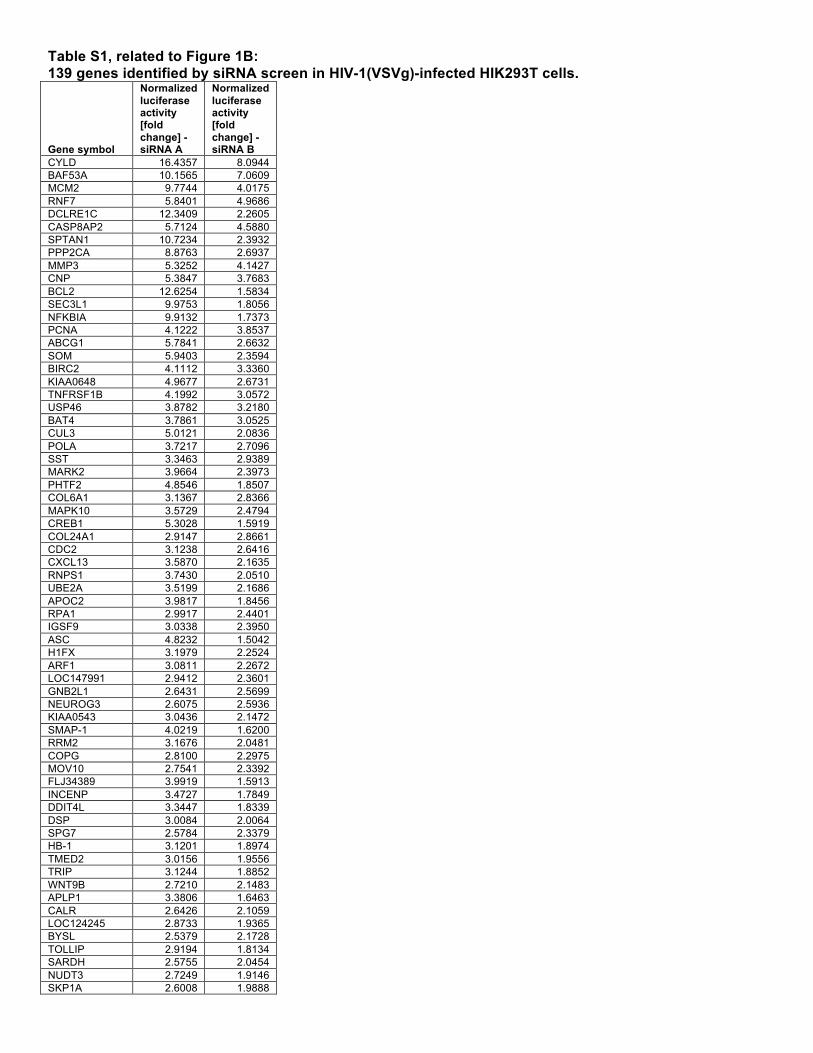
Table S1, related to Figure 1B: 139 genes identified by siRNA screen in HIV-1(VSVg)-infected HIK293T cells.
Gene symbol
Normalized luciferase activity [fold change] - siRNA A
Normalized luciferase activity [fold change] - siRNA B
CYLD 16.4357 8.0944 BAF53A 10.1565 7.0609 MCM2 9.7744 4.0175 RNF7 5.8401 4.9686 DCLRE1C 12.3409 2.2605 CASP8AP2 5.7124 4.5880 SPTAN1 10.7234 2.3932 PPP2CA 8.8763 2.6937 MMP3 5.3252 4.1427 CNP 5.3847 3.7683 BCL2 12.6254 1.5834 SEC3L1 9.9753 1.8056 NFKBIA 9.9132 1.7373 PCNA 4.1222 3.8537 ABCG1 5.7841 2.6632 SOM 5.9403 2.3594 BIRC2 4.1112 3.3360 KIAA0648 4.9677 2.6731 TNFRSF1B 4.1992 3.0572 USP46 3.8782 3.2180 BAT4 3.7861 3.0525 CUL3 5.0121 2.0836 POLA 3.7217 2.7096 SST 3.3463 2.9389 MARK2 3.9664 2.3973 PHTF2 4.8546 1.8507 COL6A1 3.1367 2.8366 MAPK10 3.5729 2.4794 CREB1 5.3028 1.5919 COL24A1 2.9147 2.8661 CDC2 3.1238 2.6416 CXCL13 3.5870 2.1635 RNPS1 3.7430 2.0510 UBE2A 3.5199 2.1686 APOC2 3.9817 1.8456 RPA1 2.9917 2.4401 IGSF9 3.0338 2.3950 ASC 4.8232 1.5042 H1FX 3.1979 2.2524 ARF1 3.0811 2.2672 LOC147991 2.9412 2.3601 GNB2L1 2.6431 2.5699 NEUROG3 2.6075 2.5936 KIAA0543 3.0436 2.1472 SMAP-1 4.0219 1.6200 RRM2 3.1676 2.0481 COPG 2.8100 2.2975 MOV10 2.7541 2.3392 FLJ34389 3.9919 1.5913 INCENP 3.4727 1.7849 DDIT4L 3.3447 1.8339 DSP 3.0084 2.0064 SPG7 2.5784 2.3379 HB-1 3.1201 1.8974 TMED2 3.0156 1.9556 TRIP 3.1244 1.8852 WNT9B 2.7210 2.1483 APLP1 3.3806 1.6463 CALR 2.6426 2.1059 LOC124245 2.8733 1.9365 BYSL 2.5379 2.1728 TOLLIP 2.9194 1.8134 SARDH 2.5755 2.0454 NUDT3 2.7249 1.9146 SKP1A 2.6008 1.9888
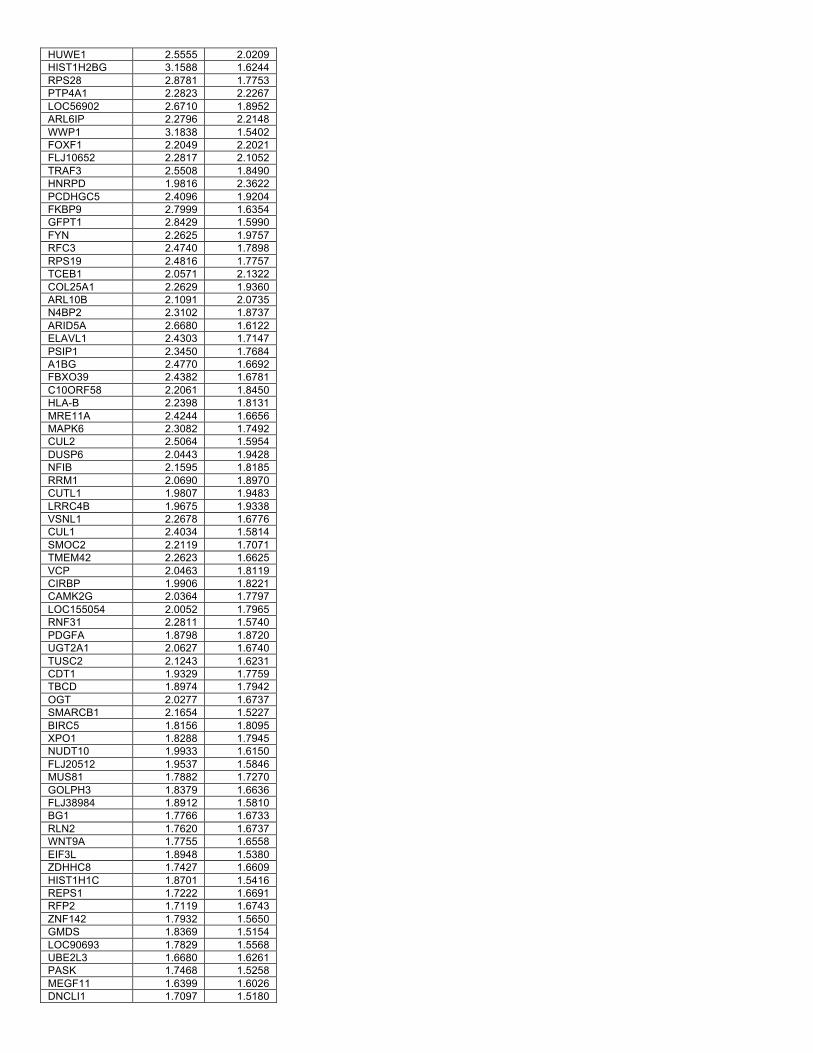
HUWE1 2.5555 2.0209 HIST1H2BG 3.1588 1.6244 RPS28 2.8781 1.7753 PTP4A1 2.2823 2.2267 LOC56902 2.6710 1.8952 ARL6IP 2.2796 2.2148 WWP1 3.1838 1.5402 FOXF1 2.2049 2.2021 FLJ10652 2.2817 2.1052 TRAF3 2.5508 1.8490 HNRPD 1.9816 2.3622 PCDHGC5 2.4096 1.9204 FKBP9 2.7999 1.6354 GFPT1 2.8429 1.5990 FYN 2.2625 1.9757 RFC3 2.4740 1.7898 RPS19 2.4816 1.7757 TCEB1 2.0571 2.1322 COL25A1 2.2629 1.9360 ARL10B 2.1091 2.0735 N4BP2 2.3102 1.8737 ARID5A 2.6680 1.6122 ELAVL1 2.4303 1.7147 PSIP1 2.3450 1.7684 A1BG 2.4770 1.6692 FBXO39 2.4382 1.6781 C10ORF58 2.2061 1.8450 HLA-B 2.2398 1.8131 MRE11A 2.4244 1.6656 MAPK6 2.3082 1.7492 CUL2 2.5064 1.5954 DUSP6 2.0443 1.9428 NFIB 2.1595 1.8185 RRM1 2.0690 1.8970 CUTL1 1.9807 1.9483 LRRC4B 1.9675 1.9338 VSNL1 2.2678 1.6776 CUL1 2.4034 1.5814 SMOC2 2.2119 1.7071 TMEM42 2.2623 1.6625 VCP 2.0463 1.8119 CIRBP 1.9906 1.8221 CAMK2G 2.0364 1.7797 LOC155054 2.0052 1.7965 RNF31 2.2811 1.5740 PDGFA 1.8798 1.8720 UGT2A1 2.0627 1.6740 TUSC2 2.1243 1.6231 CDT1 1.9329 1.7759 TBCD 1.8974 1.7942 OGT 2.0277 1.6737 SMARCB1 2.1654 1.5227 BIRC5 1.8156 1.8095 XPO1 1.8288 1.7945 NUDT10 1.9933 1.6150 FLJ20512 1.9537 1.5846 MUS81 1.7882 1.7270 GOLPH3 1.8379 1.6636 FLJ38984 1.8912 1.5810 BG1 1.7766 1.6733 RLN2 1.7620 1.6737 WNT9A 1.7755 1.6558 EIF3L 1.8948 1.5380 ZDHHC8 1.7427 1.6609 HIST1H1C 1.8701 1.5416 REPS1 1.7222 1.6691 RFP2 1.7119 1.6743 ZNF142 1.7932 1.5650 GMDS 1.8369 1.5154 LOC90693 1.7829 1.5568 UBE2L3 1.6680 1.6261 PASK 1.7468 1.5258 MEGF11 1.6399 1.6026 DNCLI1 1.7097 1.5180
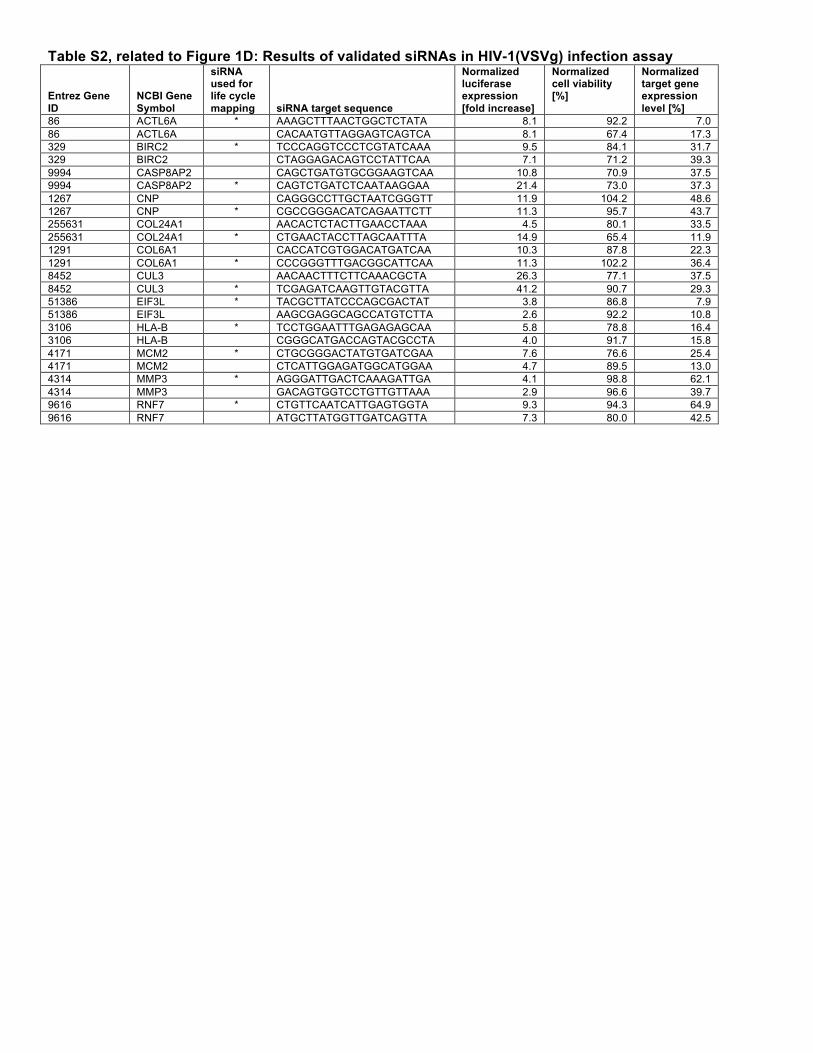
Table S2, related to Figure 1D: Results of validated siRNAs in HIV-1(VSVg) infection assay
Entrez Gene ID
NCBI Gene Symbol
siRNA used for life cycle mapping siRNA target sequence
Normalized luciferase expression [fold increase]
Normalized cell viability [%]
Normalized target gene expression level [%]
86 ACTL6A * AAAGCTTTAACTGGCTCTATA 8.1 92.2 7.0 86 ACTL6A CACAATGTTAGGAGTCAGTCA 8.1 67.4 17.3 329 BIRC2 * TCCCAGGTCCCTCGTATCAAA 9.5 84.1 31.7 329 BIRC2 CTAGGAGACAGTCCTATTCAA 7.1 71.2 39.3 9994 CASP8AP2 CAGCTGATGTGCGGAAGTCAA 10.8 70.9 37.5 9994 CASP8AP2 * CAGTCTGATCTCAATAAGGAA 21.4 73.0 37.3 1267 CNP CAGGGCCTTGCTAATCGGGTT 11.9 104.2 48.6 1267 CNP * CGCCGGGACATCAGAATTCTT 11.3 95.7 43.7 255631 COL24A1 AACACTCTACTTGAACCTAAA 4.5 80.1 33.5 255631 COL24A1 * CTGAACTACCTTAGCAATTTA 14.9 65.4 11.9 1291 COL6A1 CACCATCGTGGACATGATCAA 10.3 87.8 22.3 1291 COL6A1 * CCCGGGTTTGACGGCATTCAA 11.3 102.2 36.4 8452 CUL3 AACAACTTTCTTCAAACGCTA 26.3 77.1 37.5 8452 CUL3 * TCGAGATCAAGTTGTACGTTA 41.2 90.7 29.3 51386 EIF3L * TACGCTTATCCCAGCGACTAT 3.8 86.8 7.9 51386 EIF3L AAGCGAGGCAGCCATGTCTTA 2.6 92.2 10.8 3106 HLA-B * TCCTGGAATTTGAGAGAGCAA 5.8 78.8 16.4 3106 HLA-B CGGGCATGACCAGTACGCCTA 4.0 91.7 15.8 4171 MCM2 * CTGCGGGACTATGTGATCGAA 7.6 76.6 25.4 4171 MCM2 CTCATTGGAGATGGCATGGAA 4.7 89.5 13.0 4314 MMP3 * AGGGATTGACTCAAAGATTGA 4.1 98.8 62.1 4314 MMP3 GACAGTGGTCCTGTTGTTAAA 2.9 96.6 39.7 9616 RNF7 * CTGTTCAATCATTGAGTGGTA 9.3 94.3 64.9 9616 RNF7 ATGCTTATGGTTGATCAGTTA 7.3 80.0 42.5
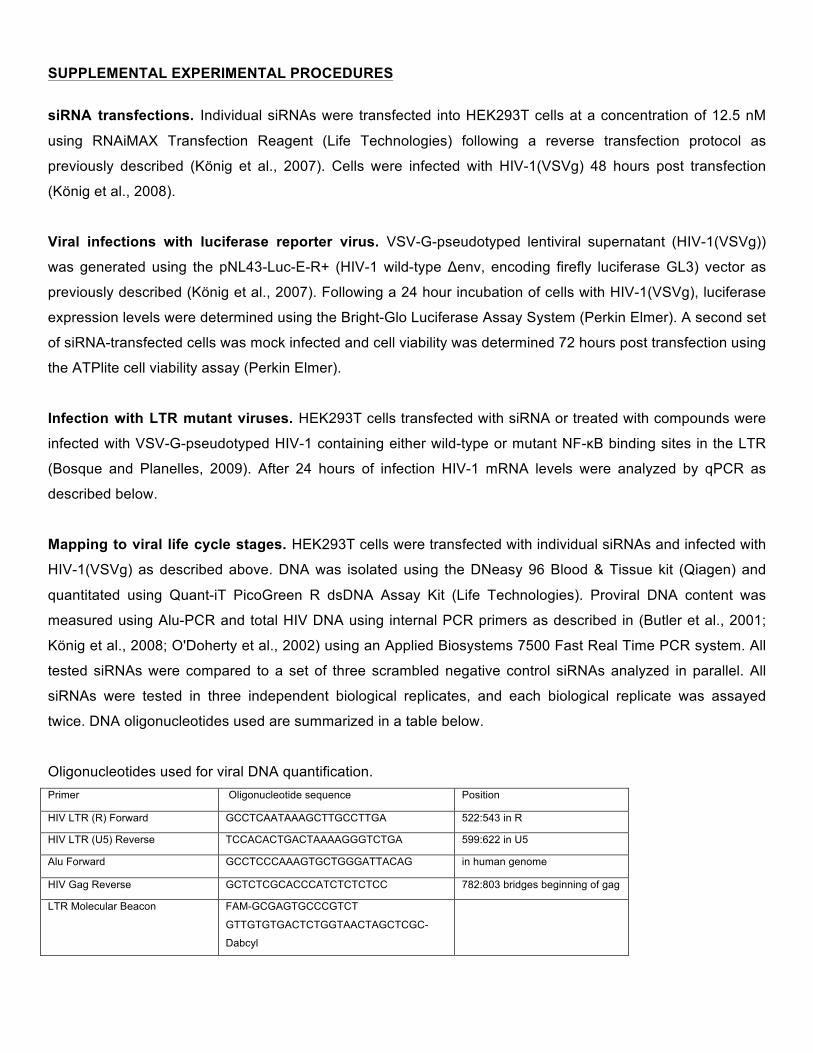
SUPPLEMENTAL EXPERIMENTAL PROCEDURES
siRNA transfections. Individual siRNAs were transfected into HEK293T cells at a concentration of 12.5 nM
using RNAiMAX Transfection Reagent (Life Technologies) following a reverse transfection protocol as
previously described (König et al., 2007). Cells were infected with HIV-1(VSVg) 48 hours post transfection
(König et al., 2008).
Viral infections with luciferase reporter virus. VSV-G-pseudotyped lentiviral supernatant (HIV-1(VSVg))
was generated using the pNL43-Luc-E-R+ (HIV-1 wild-type Δenv, encoding firefly luciferase GL3) vector as
previously described (König et al., 2007). Following a 24 hour incubation of cells with HIV-1(VSVg), luciferase
expression levels were determined using the Bright-Glo Luciferase Assay System (Perkin Elmer). A second set
of siRNA-transfected cells was mock infected and cell viability was determined 72 hours post transfection using
the ATPlite cell viability assay (Perkin Elmer).
Infection with LTR mutant viruses. HEK293T cells transfected with siRNA or treated with compounds were
infected with VSV-G-pseudotyped HIV-1 containing either wild-type or mutant NF-κB binding sites in the LTR
(Bosque and Planelles, 2009). After 24 hours of infection HIV-1 mRNA levels were analyzed by qPCR as
described below.
Mapping to viral life cycle stages. HEK293T cells were transfected with individual siRNAs and infected with
HIV-1(VSVg) as described above. DNA was isolated using the DNeasy 96 Blood & Tissue kit (Qiagen) and
quantitated using Quant-iT PicoGreen R dsDNA Assay Kit (Life Technologies). Proviral DNA content was
measured using Alu-PCR and total HIV DNA using internal PCR primers as described in (Butler et al., 2001;
König et al., 2008; O'Doherty et al., 2002) using an Applied Biosystems 7500 Fast Real Time PCR system. All
tested siRNAs were compared to a set of three scrambled negative control siRNAs analyzed in parallel. All
siRNAs were tested in three independent biological replicates, and each biological replicate was assayed
twice. DNA oligonucleotides used are summarized in a table below.
Oligonucleotides used for viral DNA quantification. Primer Oligonucleotide sequence Position
HIV LTR (R) Forward GCCTCAATAAAGCTTGCCTTGA 522:543 in R
HIV LTR (U5) Reverse TCCACACTGACTAAAAGGGTCTGA 599:622 in U5
Alu Forward GCCTCCCAAAGTGCTGGGATTACAG in human genome
HIV Gag Reverse GCTCTCGCACCCATCTCTCTCC 782:803 bridges beginning of gag
LTR Molecular Beacon FAM-GCGAGTGCCCGTCT
GTTGTGTGACTCTGGTAACTAGCTCGC-
Dabcyl
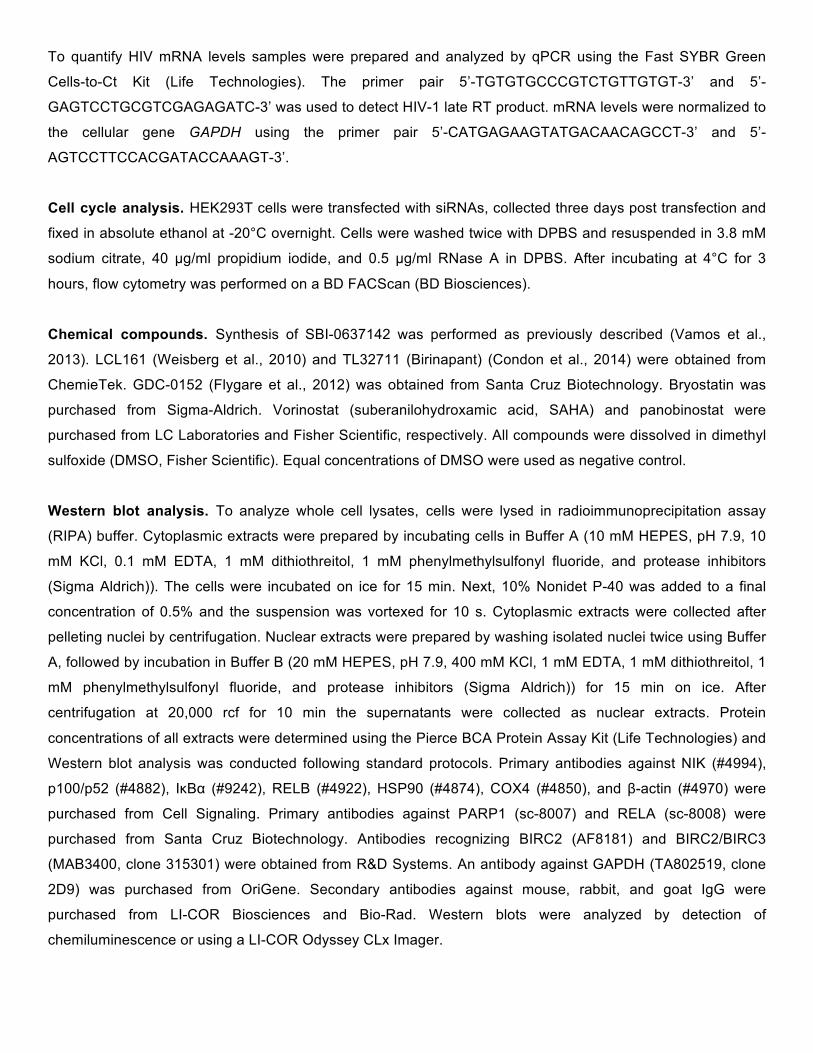
To quantify HIV mRNA levels samples were prepared and analyzed by qPCR using the Fast SYBR Green
Cells-to-Ct Kit (Life Technologies). The primer pair 5’-TGTGTGCCCGTCTGTTGTGT-3’ and 5’-
GAGTCCTGCGTCGAGAGATC-3’ was used to detect HIV-1 late RT product. mRNA levels were normalized to
the cellular gene GAPDH using the primer pair 5’-CATGAGAAGTATGACAACAGCCT-3’ and 5’-
AGTCCTTCCACGATACCAAAGT-3’.
Cell cycle analysis. HEK293T cells were transfected with siRNAs, collected three days post transfection and
fixed in absolute ethanol at -20°C overnight. Cells were washed twice with DPBS and resuspended in 3.8 mM
sodium citrate, 40 µg/ml propidium iodide, and 0.5 µg/ml RNase A in DPBS. After incubating at 4°C for 3
hours, flow cytometry was performed on a BD FACScan (BD Biosciences).
Chemical compounds. Synthesis of SBI-0637142 was performed as previously described (Vamos et al.,
2013). LCL161 (Weisberg et al., 2010) and TL32711 (Birinapant) (Condon et al., 2014) were obtained from
ChemieTek. GDC-0152 (Flygare et al., 2012) was obtained from Santa Cruz Biotechnology. Bryostatin was
purchased from Sigma-Aldrich. Vorinostat (suberanilohydroxamic acid, SAHA) and panobinostat were
purchased from LC Laboratories and Fisher Scientific, respectively. All compounds were dissolved in dimethyl
sulfoxide (DMSO, Fisher Scientific). Equal concentrations of DMSO were used as negative control.
Western blot analysis. To analyze whole cell lysates, cells were lysed in radioimmunoprecipitation assay
(RIPA) buffer. Cytoplasmic extracts were prepared by incubating cells in Buffer A (10 mM HEPES, pH 7.9, 10
mM KCl, 0.1 mM EDTA, 1 mM dithiothreitol, 1 mM phenylmethylsulfonyl fluoride, and protease inhibitors
(Sigma Aldrich)). The cells were incubated on ice for 15 min. Next, 10% Nonidet P-40 was added to a final
concentration of 0.5% and the suspension was vortexed for 10 s. Cytoplasmic extracts were collected after
pelleting nuclei by centrifugation. Nuclear extracts were prepared by washing isolated nuclei twice using Buffer
A, followed by incubation in Buffer B (20 mM HEPES, pH 7.9, 400 mM KCl, 1 mM EDTA, 1 mM dithiothreitol, 1
mM phenylmethylsulfonyl fluoride, and protease inhibitors (Sigma Aldrich)) for 15 min on ice. After
centrifugation at 20,000 rcf for 10 min the supernatants were collected as nuclear extracts. Protein
concentrations of all extracts were determined using the Pierce BCA Protein Assay Kit (Life Technologies) and
Western blot analysis was conducted following standard protocols. Primary antibodies against NIK (#4994),
p100/p52 (#4882), IκBα (#9242), RELB (#4922), HSP90 (#4874), COX4 (#4850), and β-actin (#4970) were
purchased from Cell Signaling. Primary antibodies against PARP1 (sc-8007) and RELA (sc-8008) were
purchased from Santa Cruz Biotechnology. Antibodies recognizing BIRC2 (AF8181) and BIRC2/BIRC3
(MAB3400, clone 315301) were obtained from R&D Systems. An antibody against GAPDH (TA802519, clone
2D9) was purchased from OriGene. Secondary antibodies against mouse, rabbit, and goat IgG were
purchased from LI-COR Biosciences and Bio-Rad. Western blots were analyzed by detection of
chemiluminescence or using a LI-COR Odyssey CLx Imager.
HIV-1 infection of Human CD4+ T cells. Peripheral blood mononuclear cells (PBMCs) were isolated by Ficoll
density gradient centrifugation (Histopaque, Sigma Aldrich) from buffy coats of healthy human donors (San
Diego Blood Bank). CD4+ T cells were subsequently isolated by negative selection using magnetic beads
(CD4+ T cell isolation kit II; Miltenyi Biotec). CD4+ T cells were cultured in RPMI1640 supplemented with 10%
FBS, 100 IU penicillin, 100 µg/ml streptomycin, 0.1 M HEPES, 2 mM L-glutamine, and 20 units/ml interleukin-2
(IL-2) (NIH AIDS Reagent Program). Cells were activated with 4 µg/ml phytohemagglutinin-P (PHA) (Sigma)
for 48 hours. Activated CD4+ T cells were treated with SBI-0637142, LCL-161, DMSO, or mock treated for 24
hours prior to infection with HIV-1(VSVg). Luciferase expression levels were determined using Bright-Glo
Luciferase Assay System (Perkin Elmer). Cell viability of treated cells was determined using ATPlite cell
viability assay (Perkin Elmer). Values were normalized to mock-treated cells; average value of DMSO-treated
cells was defined as 1.
cDNA overexpression. Complementary DNA of CD40 or LTβR in the expression vector pLX304 was
transfected into HEK293T cells using Lipofectamine 2000 transfection reagent (Life Technologies) according to
the manufacturer’s instructions. 24 hours after transfection cells were infected with HIV-1(VSVg) for 24 hours
prior to the analysis of luciferase expression levels using the Bright-Glo Luciferase Assay System (Perkin
Elmer).
Chromatin Immunoprecipitation: 2D10 cells were stimulated with 1 µM SBI-0637142 or DMSO for 9 h or
with 20 ng of human TNFα for 2 h as a control. Cross-linking was carried out using a two-step method as
previously described (Nowak et al., 2005). Cells were then lysed in RIPA buffer supplemented with protease
and phosphatase inhibitor cocktails (Sigma Aldrich). Total cell lysates were extensively sonicated using a
Covaris S220 Focused Ultrasonicator. Lysates were then cleared by centrifugation and supernatants were
diluted 10X in RIPA buffer without SDS. Immunoprecipitations were carried out as previously described (Carey
et al., 2009). The diluted whole cell lysates were incubated with Dynabeads protein G (Life Technology) and
anti-RELB or anti-RELA antibodies (sc-226 and sc-372, Santa Cruz Biotechnology), or a rabbit anti-human IgG
control overnight at 4°C. IP samples were washed with four different buffers according to the protocol (Carey et
al., 2009). To revert the cross-link, eluted samples were incubated overnight at 65°C in the presence of 0.3 M
NaCl. DNA fragments were precipitated in phenol-chloroform and DNA pellets were reconstituted in water.
Samples were prepared and analyzed by qPCR. Primer pairs were designed to span the NF-κB binding site-
containing region of the HIV-1 LTR, the promoter region of IκBα, or an intergenic region upstream of the
PABPC1 gene unknown to contain NF-κB binding sites as negative control. The following primer sequences
were used: 5’-AGGTTTGACAGCCGCCTA-3’ and 5’-AGAGACCCAGTACAGGCAAAA-3’ for the HIV-1 LTR, 5’-
GACGACCCCAATTCAAATCG-3’ and 5’-TCAGGCTCGGGGAATTTCC-3’ for the IκBα promoter, and 5’-
CATGGGTGGAGCTGGTCAAT-3’ and 5’-TCCTAGCAGAGATCCATGCAGAT-3’ for the negative control.
Knockout cell lines: NIK and NFKB2 knockout cells were generated using the Cas9 nuclease system.
sgRNAs oligos were designed using the CRISPR design tool (http://tools.genome-engineering.org) and were
cloned into the pSpCas9(BB) vector as previously described (Ran et al., 2013). Sorting of transfected cells by
FACS was carried out by co-expressing pSpCas9(BB) containing the specific sgRNAs oligos with the
pmCherry-C1 vector. The sgRNA sequences used to knock out NIK or NFKB2 were: 5’ –
CGTCTACAAGCTTGAGGCCG – 3’ specific for exon 2 of the NIK gene (NG_033823.1 – 31417 to 31436), and
5’ – CTTCACAGCCATATCGAAAT – 3’ specific for exon 5 of the NFKB2 gene (NG_033874.1 – 7627 to 7646).
Jurkat HIV latency model. JLat 10.6 cells (Jordan et al., 2003) from Dr. Eric Verdin were obtained through the
NIH AIDS Reagent Program, Division of AIDS, NIAID, NIH. 5A8 cells (Chan et al., 2013; Sakane et al., 2011;
Spina et al., 2013) were obtained from Dr. Warner C. Greene (Gladstone Institutes), and 2D10 cells (Pearson
et al., 2008) from Dr. Jonathan Karn (Case Western Reserve University). Latently infected Jurkat cells were
treated with compounds and subsequently analyzed for GFP expression by flow cytometry using a BD
LSRFortessa cell analyzer with high throughput sampler (BD Biosciences). Cell viability was determined using
the ATPlite cell viability assay (Perkin Elmer).
Analysis of drug synergy. The Bliss independence score (Bliss, 1939) was used to calculate the expected
level of latency reversal when combined treatment with drugs A and B is additive. The Bliss Score was
calculated using FAB = FA + FB * (1 – FA) where FA and FB represent the fraction of GFP+ cells reactivated upon
treatment with drug A and drug B alone and FAB represents the fraction of GFP+ cells reactivated upon
combined treatment with drug A and drug B. Synergy was calculated as follows: Synergy = ObservedAB / FAB
where ObservedAB represents the fraction of GFP+ cells observed upon combined treatment with drug A and
drug B.
Treatment of resting CD4+ T cells from aviremic HIV patients. LRA activity of compounds was evaluated
using the recently described REVEAL (rapid ex vivo evaluation of anti-latency) assay (Spivak et al., 2015).
Aviremic HIV-1 infected patients on ART were recruited for phlebotomy according to an approved institutional
review board protocol at the University of Utah (Spivak et al., 2015). Inclusion criteria mandated viral
suppression (less than 50 HIV-1 RNA copies/mL) for a minimum of six months, ART initiation during chronic
HIV-1 infection (greater than six months since seroconversion) and compliance with a stable ART regimen for
a minimum of twelve months per participant and provider report. Informed consent and phlebotomy were
performed in the Center for Clinical and Translational Science Clinical Services Core at the University of Utah
Medical Center.
Peripheral blood mononuclear cells were isolated from whole blood immediately after phlebotomy via
density gradient centrifugation, followed by negative selection of resting CD4+ T cells using magnetic bead
separation (Miltenyi Biotec and StemCell Technologies). Aliquots of 5x10⁶ resting CD4+ T cells were cultured
under multiple conditions: culture medium and DMSO (solvent) alone (negative control), CD3/CD28 antibody-
coated magnetic beads (positive control) and medium containing candidate latency reversing agents at
concentrations previously shown to induce viral reactivation. At 48 hours culture supernatants were collected
for real time quantitative polymerase chain reaction (qPCR). Supernatant from each sample was collected for

quantification of cell-free virions using a two-step qPCR that makes use of a primer and probe set for
conserved regions of the 3’ LTR of HIV-1 mRNA (Shan et al., 2013).
Analysis of resting CD4+ T cell activation. Resting CD4+ T cells isolated from the blood of healthy donors
were treated with DMSO, 10 µM SBI-0637142, 100 nM panobinostat, 30 nM bryostatin, or CD3/CD28
antibody-coated magnetic beads for 48 hours. Cells were stained with PE-labeled anti-CD69 antibody sc-
18880PE (Santa Cruz Biotechnology) and analyzed by FACS.
SUPPLEMENTAL REFERENCES Bliss, C.I. (1939). The toxicity of poisons applied jointly. Annals of Applied Biology 26, 585-615.
Butler, S.L., Hansen, M.S., and Bushman, F.D. (2001). A quantitative assay for HIV DNA integration in vivo. Nature medicine 7, 631-634.
Carey, M.F., Peterson, C.L., and Smale, S.T. (2009). Chromatin immunoprecipitation (ChIP). Cold Spring Harbor protocols 2009, pdb prot5279.
Chan, J.K., Bhattacharyya, D., Lassen, K.G., Ruelas, D., and Greene, W.C. (2013). Calcium/calcineurin synergizes with prostratin to promote NF-kappaB dependent activation of latent HIV. PloS one 8, e77749.
Condon, S.M., Mitsuuchi, Y., Deng, Y., Laporte, M.G., Rippin, S.R., Haimowitz, T., Alexander, M.D., Kumar, P.T., Hendi, M.S., Lee, Y.H., et al. (2014). Birinapant, a Smac-Mimetic with Improved Tolerability for the Treatment of Solid Tumors and Hematological Malignancies. Journal of medicinal chemistry.
Flygare, J.A., Beresini, M., Budha, N., Chan, H., Chan, I.T., Cheeti, S., Cohen, F., Deshayes, K., Doerner, K., Eckhardt, S.G., et al. (2012). Discovery of a potent small-molecule antagonist of inhibitor of apoptosis (IAP) proteins and clinical candidate for the treatment of cancer (GDC-0152). Journal of medicinal chemistry 55, 4101-4113.
Jordan, A., Bisgrove, D., and Verdin, E. (2003). HIV reproducibly establishes a latent infection after acute infection of T cells in vitro. The EMBO journal 22, 1868-1877.
König, R., Chiang, C.Y., Tu, B.P., Yan, S.F., DeJesus, P.D., Romero, A., Bergauer, T., Orth, A., Krueger, U., Zhou, Y., et al. (2007). A probability-based approach for the analysis of large-scale RNAi screens. Nature methods 4, 847-849.
Nowak, D.E., Tian, B., and Brasier, A.R. (2005). Two-step cross-linking method for identification of NF-kappaB gene network by chromatin immunoprecipitation. BioTechniques 39, 715-725.
O'Doherty, U., Swiggard, W.J., Jeyakumar, D., McGain, D., and Malim, M.H. (2002). A sensitive, quantitative assay for human immunodeficiency virus type 1 integration. J Virol 76, 10942-10950.
Ran, F.A., Hsu, P.D., Wright, J., Agarwala, V., Scott, D.A., and Zhang, F. (2013). Genome engineering using the CRISPR-Cas9 system. Nature protocols 8, 2281-2308.
Sakane, N., Kwon, H.S., Pagans, S., Kaehlcke, K., Mizusawa, Y., Kamada, M., Lassen, K.G., Chan, J., Greene, W.C., Schnoelzer, M., et al. (2011). Activation of HIV transcription by the viral Tat protein requires a demethylation step mediated by lysine-specific demethylase 1 (LSD1/KDM1). PLoS pathogens 7, e1002184.
Shan, L., Rabi, S.A., Laird, G.M., Eisele, E.E., Zhang, H., Margolick, J.B., and Siliciano, R.F. (2013). A novel PCR assay for quantification of HIV-1 RNA. J Virol 87, 6521-6525.
Spina, C.A., Anderson, J., Archin, N.M., Bosque, A., Chan, J., Famiglietti, M., Greene, W.C., Kashuba, A., Lewin, S.R., Margolis, D.M., et al. (2013). An in-depth comparison of latent HIV-1 reactivation in multiple cell model systems and resting CD4+ T cells from aviremic patients. PLoS pathogens 9, e1003834.
Weisberg, E., Ray, A., Barrett, R., Nelson, E., Christie, A.L., Porter, D., Straub, C., Zawel, L., Daley, J.F., Lazo-Kallanian, S., et al. (2010). Smac mimetics: implications for enhancement of targeted therapies in leukemia. Leukemia 24, 2100-2109.