Embed Size (px)
Citation preview
Supplemental Figure S1. Southern blot analysis of the MpPHOT gene. Four micrograms each of genomic DNA was digested with the restriction enzymes XbaI, PstI,or BamHI. After separation on a 0.6% agarose gel and transfer to a membrane, the blot was hybridized using an MpPHOT genomic fragment around the LOV2 domain as a probe at 50C as described in the Materials and Methods.
(kb)12.0
5.0
10.0
4.0
6.0
8.0
3.0

Supplemental Figure S2. Alignment of amino acid sequences of phototropins from M. polymorpha, Arabidopsis and C. reinhardtii. Mp, M. polymorpha; At, Arabidopsis; Cr, C. reinhardtii. Boxes indicate LOV domains (blue), LOV1 and LOV2, and Ser/The kinase domain (yellow). Red arrowheads indicate the autophosphorylated Ser residues essential for the activity of phototropins in Arabidopsis (Inoue et al., 2008; Inoue et al., 2011). Black asterisks indicate potentially phosphorylated amino acid residues in the N-terminal region conserved between Mpphot and Atphot1 or Atphot2 (Inoue et al., 2008; Inoue et al., 2011). Yellow asterisks indicate the residues for interaction with FMN conserved among the LOV1 and LOV2 of Mpphot, Atphot1, and Atphot2 (Crosson and Moffat, 2001). Red arrows indicate the region replaced by the hpt cassette by homologous recombination in MpphotKO. Multiple alignments were achieved using the MUSCLE program implemented in the Geneious software with default settings; shading of residues: black = 100% similar, dark grey = 80-100% similar, light grey = 60-80% similar and white < 60% similar.
* *
*
*** * * *
* * * *
* * *******

Supplemental Figure S3. Alignment of amino acid sequences of phototropins from a variety of plant species used for the phylogenetic analysis in Fig. 3B. Multiple alignments were achieved using the MUSCLE program implemented in the Geneious software with default settings. Unaligned gaps were first removed from the resulting alignment using Gblocks (http://molevol.cmima.csic.es/castresana/Gblocks_server.html), and then the conserved region covering the Jα helix and the C-terminal Ser/Thr kinase domain was extracted for the phylogenetic analysis. Shading of residues: black = 100% similar, dark grey = 80-100% similar, light grey = 60-80% similar and white < 60% similar. Phototropins from A. trichopoda (Atr_PHOT1 and Atr_PHOT2), Arabidopsis (At_PHOT1 and At_PHOT2), O. sativa (Os_PHOT1a and Os_PHOT1b), A. capillus-veneris(Ac_PHOT1 and Ac_PHOT2), S. moellendorffii (Sm_PHOT1-1, Sm_PHOT1-2, Sm_PHOT2-1, and Sm_PHOT2-2), P. patens (Pp_PHOTA1, Pp_PHOTA2, Pp_PHOTA3, Pp_PHOTA4, Pp_PHOTB1, Pp_PHOTB2, and Pp_PHOTB3), M. scalaris (Ms_PHOTAand Ms_PHOTB), O. tauri (Ot_PHOT), and C. reinhardtii (Cr_PHOT) were used.
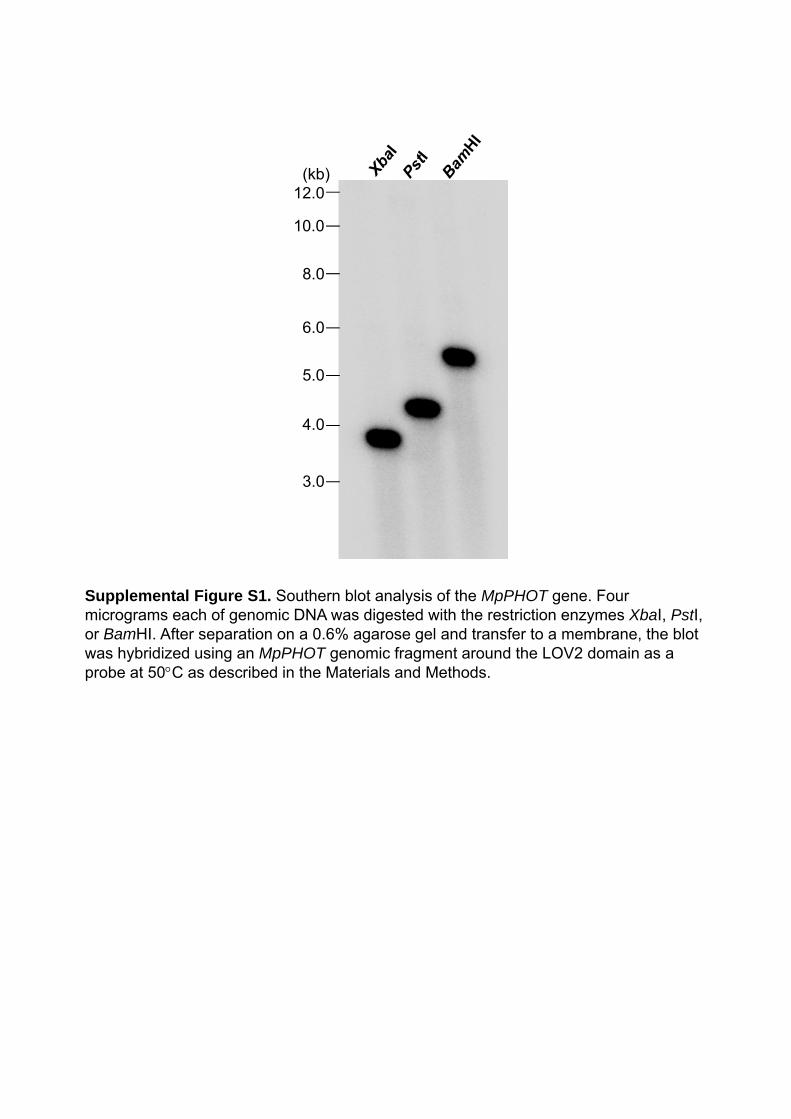
Supplemental Figure S4. Strategy for targeted disruption of the MpPHOT locus and analysis of homologous recombination events. A, Schematic diagram of targeted disruption of the Mpphot locus by homologous recombination. B, Genotyping of the MpphotKO lines. The positions of the primers used for PCR analysis are shown in A. C, Southern blot analysis of the MpPHOT locus and the integrated hpt sequence in the wild type and MpphotKO with restriction enzyme treatment (EcoRV and HindIII). Positions of probes are shown in A (P1, P2, and P3). The restriction sites and the predicted sizes of restriction fragments are shown in A.
B
C
WT#1 #2 WT#1 #2 WT#1 #2
GT_L0/P1RGT_L2/GT_R3 HIF/GT_R5
A
MpPHOT locus
DisruptedMpPHOT locus
M12.0
#1 #2
10.4 10.4
3.3
10.4
(kb)
WT #1 #2 WT #1 #2WT
WT #1 #2
6.06.99.6
6.0
9.6
(kb)WT #1 #2 WT #1 #2
EcoRV
HindIII
(kb)
5.03.0
1.0
P1 P2 P3
P1 P2 P3
ATG STOP
STOP
1 kb
ATG
HE
HE
HE
GT_L0GT_R5
GT_L2 GT_R3
HIFP1R
P3
P1 P2
10.4 3.36.9 6.0
HE
HE10.4
9.6
hpt ∆EnpMpEF
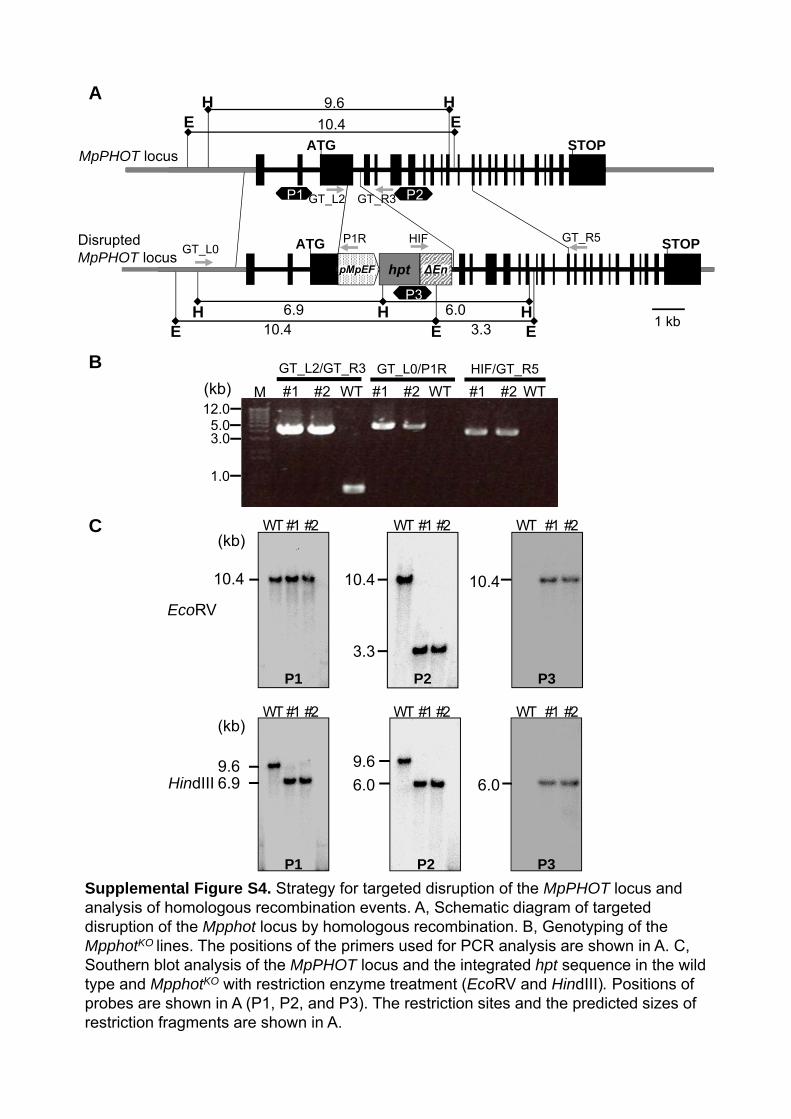
Supplemental Figure S5. Images of 20-d-old thalli of the wild type and MpphotKO. The thalli were grown from gemmae of wild type (top) and MpphotKO (bottom) under continuous white light for 20 d. Bar = 5 mm.
WT
MpphotKO

Supplemental Figure S6. Comparison of the ratio of the area occupied with chloroplasts to the area of whole cell surface of wild type, MpphotKO and gMpPHOT/MpphotKO. 3-d-old gemmalings grown under continuous white light were used. The area of whole cell surface and the area occupied with chloroplasts of three cells were measured before (white rectangle) and after 3-d dark treatment (grey rectangle). The area measurement was performed as described previously (Suetsuguet al., 2005a). Error bars = SEs (n = 3). Asterisks indicate the statistically significant differences, assessed by Student’s t-tests (P < 0.05). n.s.: not significant.
0
0.1
0.2
0.3
0.4
0.5
0.6
0.7
0.8
0.9
1
WT MpphotKO gMpPHOT/MpphotKO
0.5
0
1.0
Chl
oro
plas
t-co
vere
d ar
ea /
who
le c
ell s
urfa
ce a
rea
MpphotKO gMpPHOT/MpphotKO
WT
* *n.s.

Supplemental Figure S7. Chloroplast distribution of gMpPHOT-Citrine/MpphotKO under various light conditions. Gemmalings incubated under continuous white light for 3 d were used for this analysis. White light (top), high-fluence blue light (50 Wm−2, 120 min; middle), and dark treatment for 3 d (bottom). The outermost cell walls are indicated by arrowheads. Bars = 20 μm.
Whi
te li
ght
Blu
elig
htD
ark