Embed Size (px)
Citation preview
SUPPLEMENTAL FIGURE LEGENDS
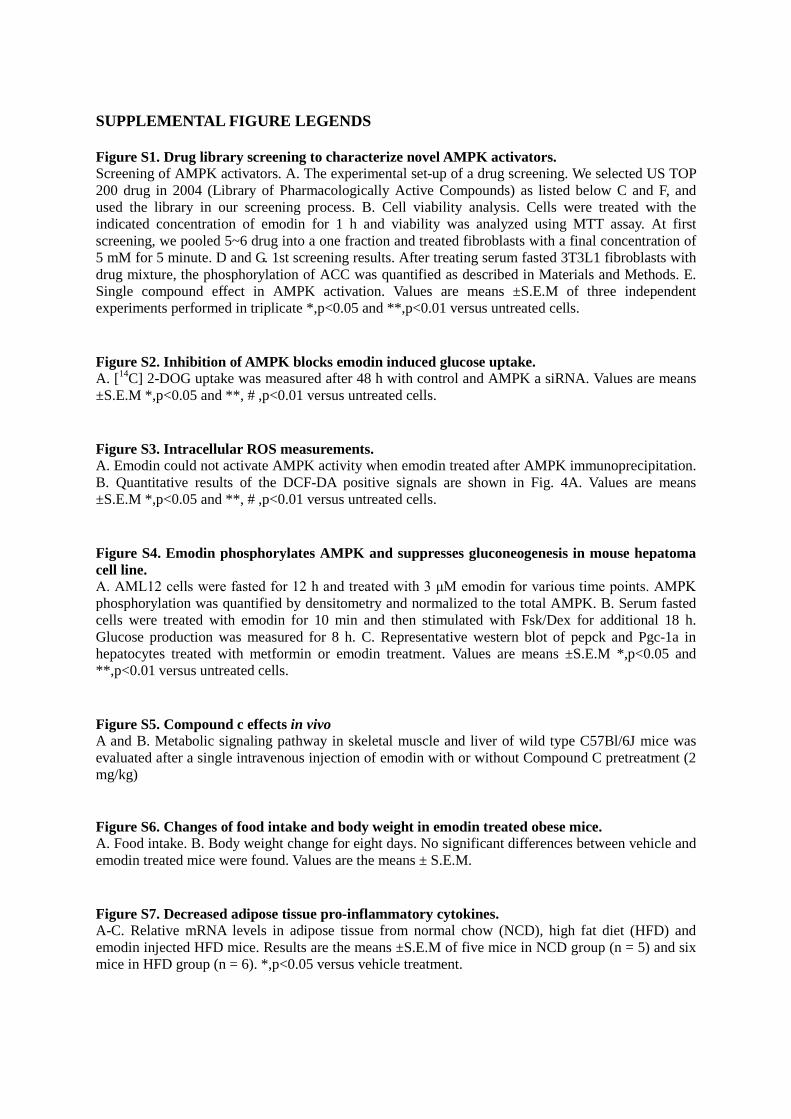
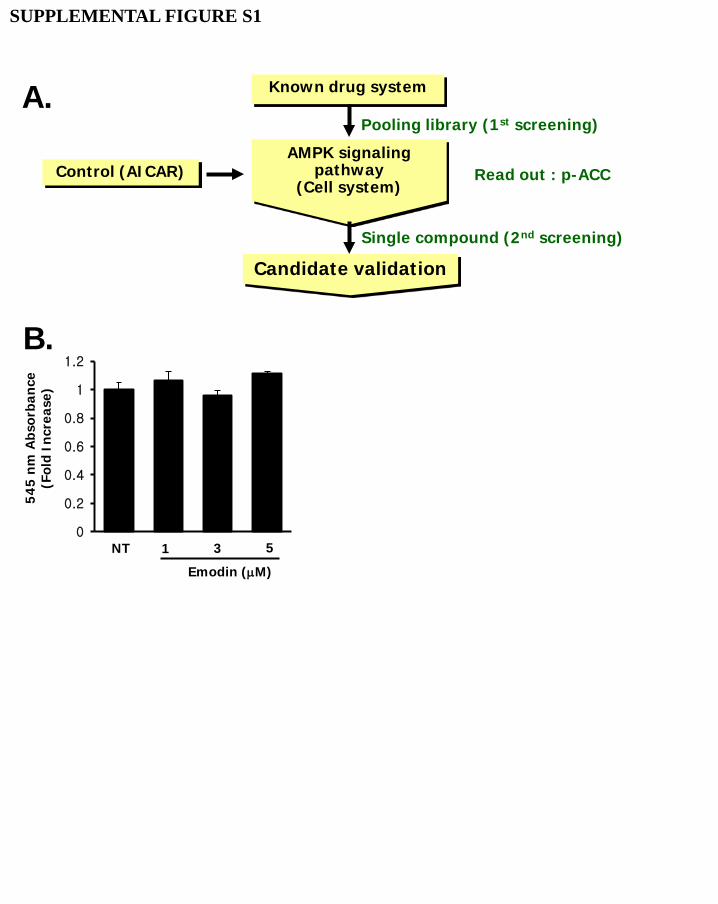
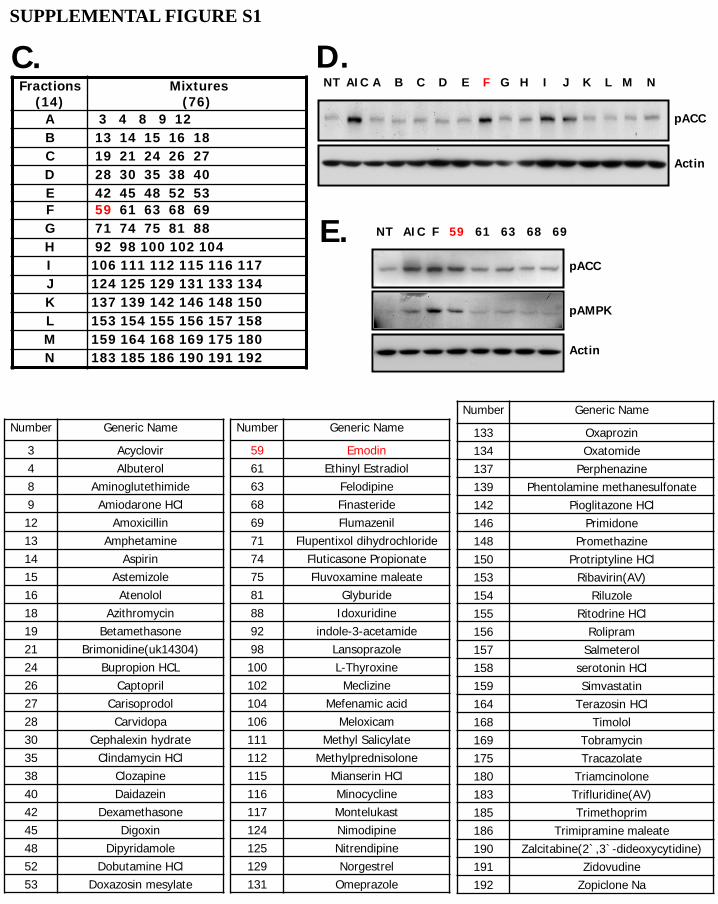
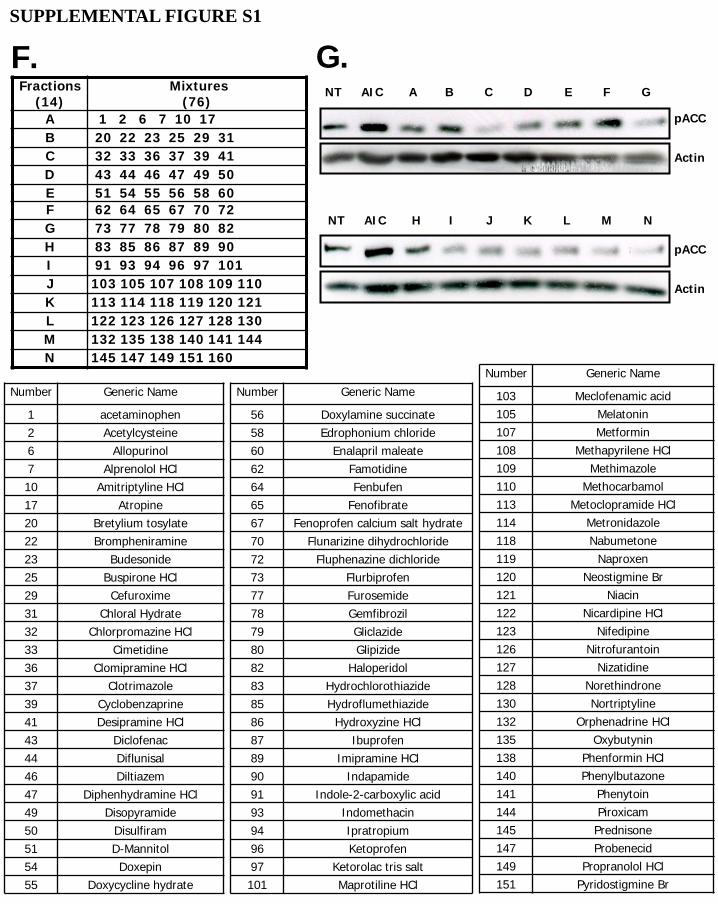
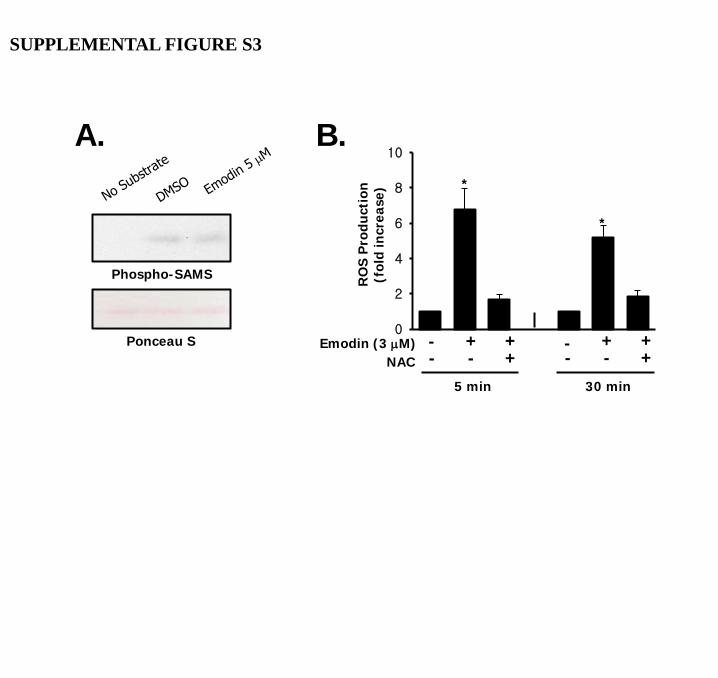
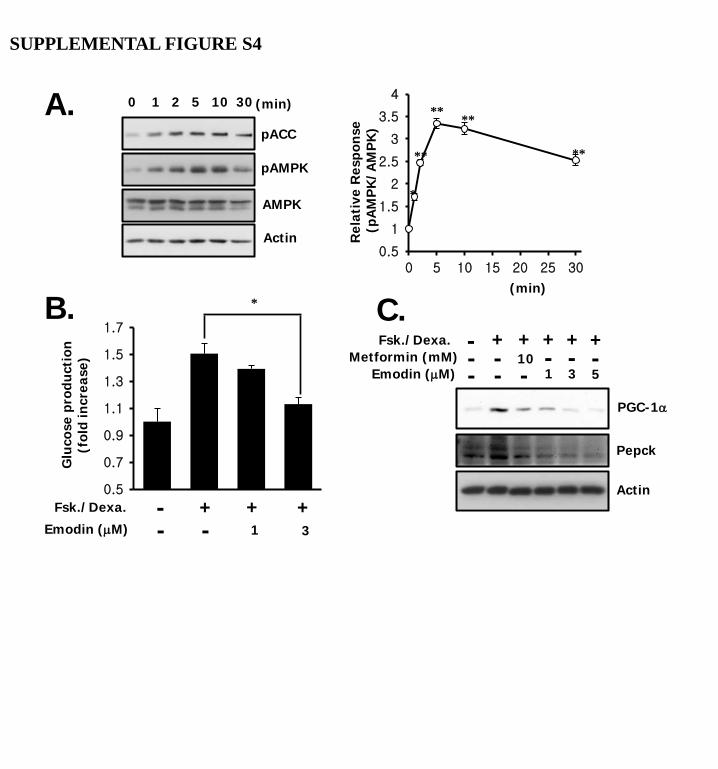
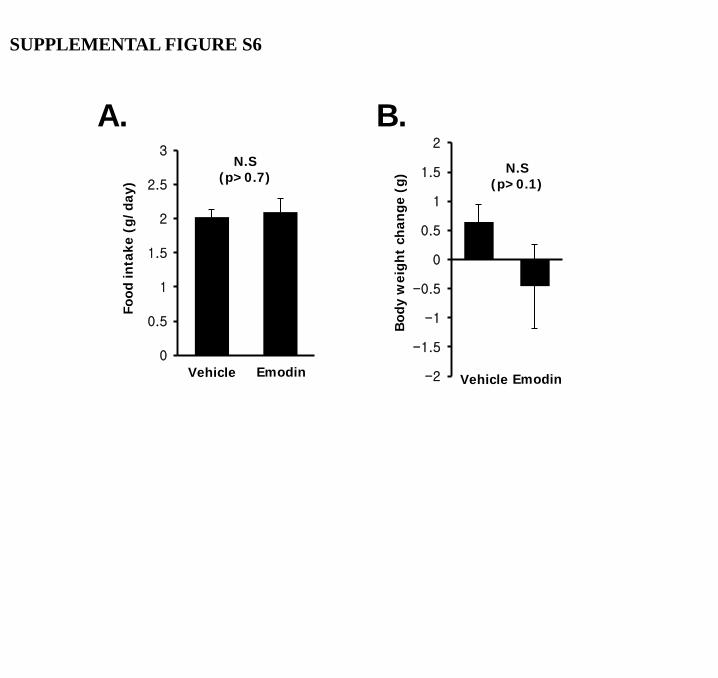
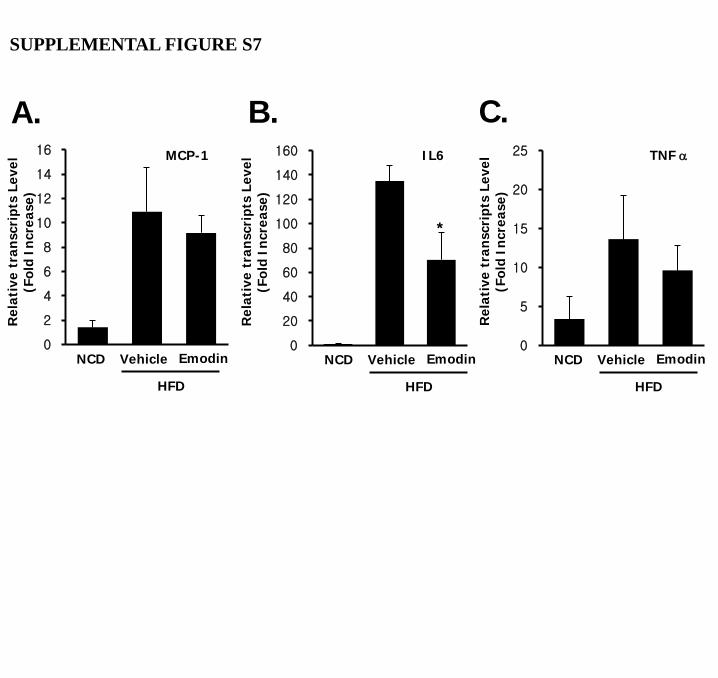
Figure S1. Drug library screening to characterize novel AMPK activators. Screening of AMPK activators. A. The experimental set-up of a drug screening. We selected US TOP 200 drug in 2004 (Library of Pharmacologically Active Compounds) as listed below C and F, and used the library in our screening process. B. Cell viability analysis. Cells were treated with the indicated concentration of emodin for 1 h and viability was analyzed using MTT assay. At first screening, we pooled 5~6 drug into a one fraction and treated fibroblasts with a final concentration of 5 mM for 5 minute. D and G. 1st screening results. After treating serum fasted 3T3L1 fibroblasts with drug mixture, the phosphorylation of ACC was quantified as described in Materials and Methods. E. Single compound effect in AMPK activation. Values are means ±S.E.M of three independent experiments performed in triplicate *,p<0.05 and **,p<0.01 versus untreated cells. Figure S2. Inhibition of AMPK blocks emodin induced glucose uptake. A. [14C] 2-DOG uptake was measured after 48 h with control and AMPK a siRNA. Values are means ±S.E.M *,p<0.05 and **, # ,p<0.01 versus untreated cells. Figure S3. Intracellular ROS measurements. A. Emodin could not activate AMPK activity when emodin treated after AMPK immunoprecipitation. B. Quantitative results of the DCF-DA positive signals are shown in Fig. 4A. Values are means ±S.E.M *,p<0.05 and **, # ,p<0.01 versus untreated cells. Figure S4. Emodin phosphorylates AMPK and suppresses gluconeogenesis in mouse hepatoma cell line. A. AML12 cells were fasted for 12 h and treated with 3 μM emodin for various time points. AMPK phosphorylation was quantified by densitometry and normalized to the total AMPK. B. Serum fasted cells were treated with emodin for 10 min and then stimulated with Fsk/Dex for additional 18 h. Glucose production was measured for 8 h. C. Representative western blot of pepck and Pgc-1a in hepatocytes treated with metformin or emodin treatment. Values are means ±S.E.M *,p<0.05 and **,p<0.01 versus untreated cells. Figure S5. Compound c effects in vivo A and B. Metabolic signaling pathway in skeletal muscle and liver of wild type C57Bl/6J mice was evaluated after a single intravenous injection of emodin with or without Compound C pretreatment (2 mg/kg) Figure S6. Changes of food intake and body weight in emodin treated obese mice. A. Food intake. B. Body weight change for eight days. No significant differences between vehicle and emodin treated mice were found. Values are the means ± S.E.M. Figure S7. Decreased adipose tissue pro-inflammatory cytokines. A-C. Relative mRNA levels in adipose tissue from normal chow (NCD), high fat diet (HFD) and emodin injected HFD mice. Results are the means ±S.E.M of five mice in NCD group (n = 5) and six mice in HFD group (n = 6). *,p<0.05 versus vehicle treatment.
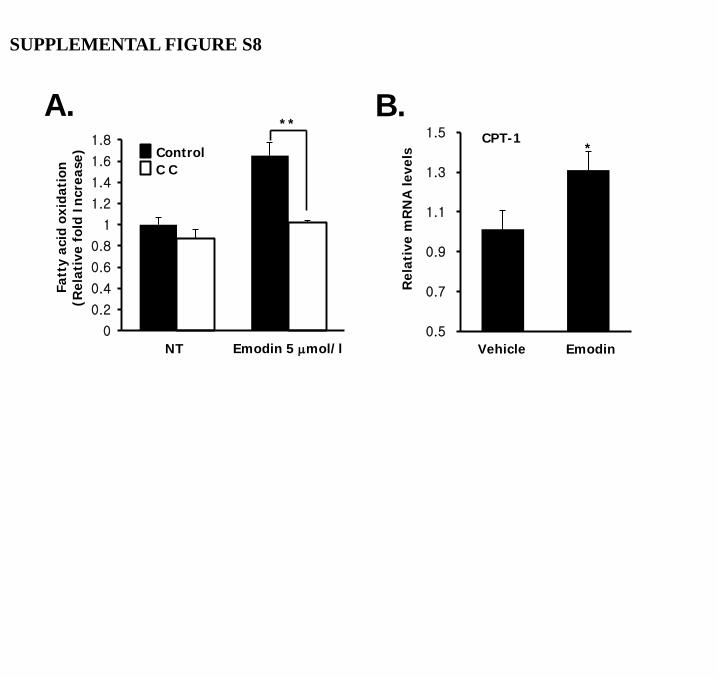
Figure S8. Change of lipid oxidation and lipid oxidation related gene levels with emodin treatment. A. Palmitate oxidation in myotubes in the presence and absence of emodin (5 mM). B. CPT-1a level was analyzed in skeletal muscle 8 days after emodin injection of the high fat induced obese model. Values are means ±S.E.M of three independent experiments performed in triplicate. *,p<0.05 and **,p<0.01 compared between two groups as indicated
AMPK signaling pathway
(Cell system)
Known drug system
Pooling library (1st screening)
Control (AICAR) Read out : p-ACC
Single compound (2nd screening)
Candidate validation
A.
SUPPLEMENTAL FIGURE S1
0
0.2
0.4
0.6
0.8
1
1.2
NT 3 5 1
Emodin (µM)
54
5 n
m A
bsor
ban
ce
(Fol
d In
crea
se)
B.
Fractions (14)
Mixtures (76)
A 3 4 8 9 12 B 13 14 15 16 18 C 19 21 24 26 27 D 28 30 35 38 40 E 42 45 48 52 53 F 59 61 63 68 69 G 71 74 75 81 88 H 92 98 100 102 104 I 106 111 112 115 116 117 J 124 125 129 131 133 134 K 137 139 142 146 148 150 L 153 154 155 156 157 158 M 159 164 168 169 175 180 N 183 185 186 190 191 192
C.
E. pACC
pAMPK
NT AIC F 59 61 63 68 69
Actin
A B C D E F G H I J K L M N NT AIC
pACC
Actin
D.
Number Generic Name
3 Acyclovir 4 Albuterol 8 Aminoglutethimide 9 Amiodarone HCl 12 Amoxicillin 13 Amphetamine 14 Aspirin 15 Astemizole 16 Atenolol 18 Azithromycin 19 Betamethasone 21 Brimonidine(uk14304) 24 Bupropion HCL 26 Captopril 27 Carisoprodol 28 Carvidopa 30 Cephalexin hydrate 35 Clindamycin HCl 38 Clozapine 40 Daidazein 42 Dexamethasone 45 Digoxin 48 Dipyridamole 52 Dobutamine HCl 53 Doxazosin mesylate
Number Generic Name
59 Emodin 61 Ethinyl Estradiol 63 Felodipine 68 Finasteride 69 Flumazenil 71 Flupentixol dihydrochloride 74 Fluticasone Propionate 75 Fluvoxamine maleate 81 Glyburide 88 Idoxuridine 92 indole-3-acetamide 98 Lansoprazole 100 L-Thyroxine 102 Meclizine 104 Mefenamic acid 106 Meloxicam 111 Methyl Salicylate 112 Methylprednisolone 115 Mianserin HCl 116 Minocycline 117 Montelukast 124 Nimodipine 125 Nitrendipine 129 Norgestrel 131 Omeprazole
Number Generic Name
133 Oxaprozin 134 Oxatomide 137 Perphenazine 139 Phentolamine methanesulfonate 142 Pioglitazone HCl 146 Primidone 148 Promethazine 150 Protriptyline HCl 153 Ribavirin(AV) 154 Riluzole 155 Ritodrine HCl 156 Rolipram 157 Salmeterol 158 serotonin HCl 159 Simvastatin 164 Terazosin HCl 168 Timolol 169 Tobramycin 175 Tracazolate 180 Triamcinolone 183 Trifluridine(AV) 185 Trimethoprim 186 Trimipramine maleate 190 Zalcitabine(2`,3`-dideoxycytidine) 191 Zidovudine 192 Zopiclone Na
SUPPLEMENTAL FIGURE S1
Fractions (14)
Mixtures (76)
A 1 2 6 7 10 17 B 20 22 23 25 29 31 C 32 33 36 37 39 41 D 43 44 46 47 49 50 E 51 54 55 56 58 60 F 62 64 65 67 70 72 G 73 77 78 79 80 82 H 83 85 86 87 89 90 I 91 93 94 96 97 101 J 103 105 107 108 109 110 K 113 114 118 119 120 121 L 122 123 126 127 128 130 M 132 135 138 140 141 144 N 145 147 149 151 160
F. G.
Number Generic Name
1 acetaminophen 2 Acetylcysteine 6 Allopurinol 7 Alprenolol HCl 10 Amitriptyline HCl 17 Atropine 20 Bretylium tosylate 22 Brompheniramine 23 Budesonide 25 Buspirone HCl 29 Cefuroxime 31 Chloral Hydrate 32 Chlorpromazine HCl 33 Cimetidine 36 Clomipramine HCl 37 Clotrimazole 39 Cyclobenzaprine 41 Desipramine HCl 43 Diclofenac 44 Diflunisal 46 Diltiazem 47 Diphenhydramine HCl 49 Disopyramide 50 Disulfiram 51 D-Mannitol 54 Doxepin 55 Doxycycline hydrate
Number Generic Name
56 Doxylamine succinate 58 Edrophonium chloride 60 Enalapril maleate 62 Famotidine 64 Fenbufen 65 Fenofibrate 67 Fenoprofen calcium salt hydrate 70 Flunarizine dihydrochloride 72 Fluphenazine dichloride 73 Flurbiprofen 77 Furosemide 78 Gemfibrozil 79 Gliclazide 80 Glipizide 82 Haloperidol 83 Hydrochlorothiazide 85 Hydroflumethiazide 86 Hydroxyzine HCl 87 Ibuprofen 89 Imipramine HCl 90 Indapamide 91 Indole-2-carboxylic acid 93 Indomethacin 94 Ipratropium 96 Ketoprofen 97 Ketorolac tris salt 101 Maprotiline HCl
Number Generic Name
103 Meclofenamic acid 105 Melatonin 107 Metformin 108 Methapyrilene HCl 109 Methimazole 110 Methocarbamol 113 Metoclopramide HCl 114 Metronidazole 118 Nabumetone 119 Naproxen 120 Neostigmine Br 121 Niacin 122 Nicardipine HCl 123 Nifedipine 126 Nitrofurantoin 127 Nizatidine 128 Norethindrone 130 Nortriptyline 132 Orphenadrine HCl 135 Oxybutynin 138 Phenformin HCl 140 Phenylbutazone 141 Phenytoin 144 Piroxicam 145 Prednisone 147 Probenecid 149 Propranolol HCl 151 Pyridostigmine Br
A B C D E F G NT AIC
pACC
Actin
pACC
Actin
H I J K L M N NT AIC
SUPPLEMENTAL FIGURE S1

SUPPLEMENTAL FIGURE S2
Ctl AMPK α
Emodin + -
pAMPK
AMPK
+ -
siRNA
Ctl-siRNA AMPKα -siRNA
2-[
14C
] de
oxyg
luco
se
upt
ake
**
0.5
0.7
0.9
1.1
1.3
1.5
1.7
NT Emodin 3 µM
A.
SUPPLEMENTAL FIGURE S3
RO
S P
rodu
ctio
n
(fol
d in
crea
se)
Emodin (3 µM) NAC
- + - -
+ +
- + - -
+ +
5 min 30 min
0
2
4
6
8
10 B.
*
*
A.
Ponceau S
Phospho-SAMS
0 1 2 5 10 30 (min)
pACC
pAMPK
AMPK
Actin 0.5
1
1.5
2
2.5
3
3.5
4
0 5 10 15 20 25 30
Rel
ativ
e R
espo
nse
(p
AM
PK
/AM
PK
)
(min)
** **
** **
*
A.
B.
0.5
0.7
0.9
1.1
1.3
1.5
1.7
Glu
cose
pro
duct
ion
(f
old
incr
ease
)
Fsk./Dexa. - + + - -
+ Emodin (µM) 1 3
*
PGC-1α
Pepck
Actin
Fsk./Dexa. Metformin (mM)
Emodin (µM) - - - + +
- - + +
- -
- 10 1 3
+ - 5
C.
SUPPLEMENTAL FIGURE S4

SUPPLEMENTAL FIGURE S5
Emodin Vehicle Skeletal muscle
pACC
pAMPK
Actin
pAKT
Emodin + CC
pp38 MAPK
pCaMKII
pERK
pIRS1
A
Emodin Vehicle Liver
pACC
pAMPK
Actin
pAKT
Emodin + CC
pp38 MAPK
pERK
B
SUPPLEMENTAL FIGURE S6
Food
inta
ke (
g/da
y)
Emodin Vehicle
N.S (p>0.7)
0
0.5
1
1.5
2
2.5
3
A.
-2
-1.5
-1
-0.5
0
0.5
1
1.5
2
Bod
y w
eigh
t ch
ange
(g)
N.S (p>0.1)
Emodin Vehicle
B.
SUPPLEMENTAL FIGURE S7
0
2
4
6
8
10
12
14
16
Rel
ativ
e tr
ansc
ript
s Le
vel
(Fol
d In
crea
se)
MCP-1
Vehicle Emodin NCD
HFD
0
20
40
60
80
100
120
140
160
*
IL6
Rel
ativ
e tr
ansc
ript
s Le
vel
(Fol
d In
crea
se)
Vehicle Emodin NCD
HFD
0
5
10
15
20
25 TNF α
Rel
ativ
e tr
ansc
ript
s Le
vel
(Fol
d In
crea
se)
Vehicle Emodin NCD
HFD
A. B. C.
SUPPLEMENTAL FIGURE S8
0
0.2
0.4
0.6
0.8
1
1.2
1.4
1.6
1.8
A.
NT
Control C C
Fatt
y ac
id o
xida
tion
(R
elat
ive
fold
In
crea
se)
**
Emodin 5 µmol/l
B.
0.5
0.7
0.9
1.1
1.3
1.5
Rel
ativ
e m
RN
A le
vels
CPT-1 *
Vehicle Emodin