Embed Size (px)
Citation preview
ASME Journal of Dynamic Systems, Measurement and Control, accepted, April 2010 (DS-09-1340).
1
SUPERVISORY CONTROL OF PARALLEL HYBRID ELECTRIC VEHICLES FOR FUEL AND EMISSIONS REDUCTION
Dongsuk Kum*, Huei Peng, and Norman K. Bucknor
Dongsuk Kum*
Department of Mechanical Engineering, University of Michigan G041 Lay Automotive Laboratory, Ann Arbor, MI 48109-2133 USA
Tel: (734) 647-9732 Fax: (734) 764-4256
Email: [email protected] (* Corresponding author)
Huei Peng
Department of Mechanical Engineering, University of Michigan G036 Lay Automotive Laboratory, Ann Arbor, MI 48109-2133 USA
Tel: (734) 936-0352 Fax: (734) 764-4256
Email: [email protected]
Norman K. Bucknor General Motors R&D Center
Powertrain Systems Research Laboratory, Warren, MI 48091 USA Tel: (734) 647-9732 Fax: (734) 764-4256
Email: [email protected]
ABSTRACT
Past research on Hybrid Electric Vehicles (HEVs) focused primarily on improving their fuel economy. Emission reduction is another important performance attribute that needs to be addressed. When emissions are considered for hybrid vehicles with a gasoline engine, horizon-based optimization methodologies should be used because the light-off of the three-way catalytic converter heavily depends on the warming-up of catalyst temperature. In this paper, we propose a systematic design method for a cold-start supervisory control algorithm based on the Dynamic Programming (DP) methodology. First, a system-level parallel HEV model is developed to efficiently predict tailpipe emissions as well as fuel economy.The optimal control problem for minimization of cold-start emissions and fuel consumption is then solved via DP. Since DP solution cannot be directly implemented as a real-time controller, more useful control strategies are extracted from DP solution over the entire state space via the comprehensive extraction method. The DP results indicate that the engine on/off, gear-shift, and power-split strategies must be properly adjusted to achieve fast catalyst warm-up with minimal cold-start engine-out emissions. Based on DP results, we proposed a rule-based control algorithm that is easy to implement and achieves near-optimal fuel economy and emissions performance.
Keywords — Emissions, Fuel Economy, Hybrid Electric Vehicles, Supervisory Powertrain Control
1 INTRODUCTION
Hybrid Electric Vehicles (HEVs) have been introduced to the market as a key technology for next generation ground vehicles, and fuel economy has been the focus of the past research [1]-[8]. Reduction of emissions is another major performance metric due to tightening regulations as well as environmental concerns [9]. Accurate prediction
Deleted: a
Deleted: are proper choices
Deleted: , and the
Deleted: As a promising solution to reducing petroleum fuel consumption,

ASME Journal of Dynamic Systems, Measurement and Control, accepted, April 2010 (DS-09-1340).
2
of tailpipe emissions requires modeling of transient emission dynamics. If we focus on the catalytic converter dynamics and its conversion efficiency, it is possible to develop a simple yet accurate model that is appropriate for the study of both fuel economy and emissions.
A number of articles have presented models for a three-way catalytic converter (TWC) to describe the heat/mass transfer in the after-treatment system and conversion efficiency as a function of the catalyst brick temperature and A/F ratio [10]-[15]. These models are primarily used for design and evaluation and are too complex for the development of control algorithms. As an alternative, lumped parameter models that utilize engine thermal networks and empirical data to describe exhaust system temperatures were developed [16][17]. These models are computationally efficient and can predict the after-treatment system responses to various engine loads and driving cycles. Recently, several control-oriented TWC models were developed [18]-[22]. These models are suitable for low-level controls because they focus on the effect of A/F ratio and spark timing on the combustion process and the catalyst warm-up. The supervisory control for HEV, on the other hand, needs to focus on the effect of power-split and gear selections on TWC dynamics and tailpipe emissions. In this study, we assume that proper servo-loops, i.e., A/F ratio and spark timing control, have been designed appropriately for all desired engine power commands.
Instantaneous and horizon optimal control are widely used in the design of supervisory control strategy [7]. The Dynamic Programming (DP) method guarantees global optimality even for nonlinear constrained systems and has been widely studied. One of its key challenges is the heavy computation load. In contrast, instantaneous optimization methods such as Equivalent Consumption Minimization Strategy (ECMS) are computationally efficient, but global optimality over the horizon is not guaranteed. The idea behind instantaneous optimal control approaches is that instantaneously optimized control commands may result in near-optimal performance [3][7], i.e.,
∫∫ ≈=∗TT
dttutLdttutLJ00
))(,(min))(,(min , (1)
where L is the instantaneous cost function. For HEVs, Eq.(1) is true if the open circuit voltage and internal resistance maps are not functions of the battery State of Charge (SOC) [7]. However, this near-optimality no longer holds when emissions are considered because tailpipe emissions heavily depend on the catalyst temperature. Therefore, a combined fuel and emissions optimization problem must be solved through horizon optimization methods.
A few recent HEV studies considered emission reduction as a part of the control objective and analyzed the trade-off between fuel economy and emissions [4],[23]-[26]. Most of them considered minimization of fuel consumption and engine-out emissions instead of tailpipe emissions [4][24][25]. Although reducing engine-out emissions helps to reduce tailpipe emissions, it is not the key factor. Since the conversion efficiency of a cold TWC is very low, fast catalyst warm-up and sustainment are the keys to minimizing tailpipe emissions. A study by Kolmanovsky et al. considered catalyst temperature as a dynamic state for a simplified hybrid powertrain model, and the optimal fuel economy problem with the maximum NOx constraint was solved by Sequential Quadratic Programming (SQP) [23]. Another study by Tate et al. formulated the tailpipe emission control problem for HEVs and solved it by shortest-path stochastic dynamic programming (SP-SDP), using a simplified after-treatment model [26]. These studies demonstrated that reduction of tailpipe emissions trades off with fuel economy, but the design of a real-time controller for optimal emissions and fuel economy performance was not discussed in the literature. The main contribution of the present paper is the development of a systematic design method for a supervisory powertrain controller (SPC) that simultaneously optimizes fuel economy and tailpipe emissions for an HEV with a TWC.
The paper is organized as follows: In Section II, a HEV powertrain model, with a simple emission model, is developed, followed by the validation of the emission model. An optimal supervisory control problem that minimizes both fuel consumption and emissions is solved via DP, and the trade-off between fuel economy and emission are presented in Section III. In Section IV, a systematic design method of a near-optimal cold-start supervisory powertrain controller is developed via the comprehensive extraction method. Finally, conclusions are presented in Section V.
2 HYBRID ELECTRIC VEHICLE MODEL
Since the fuel consumption model for supervisory control of HEV has been extensively discussed in the literature [4][27][28], the focus of the vehicle model will be on the emission model.
Deleted: and sufficiently
Deleted: -
ASME Journal of Dynamic Systems, Measurement and Control, accepted, April 2010 (DS-09-1340).
3
Transmission
Battery
ClutchEngineElectricMotor
Transmission
Battery
ClutchEngineElectricMotor
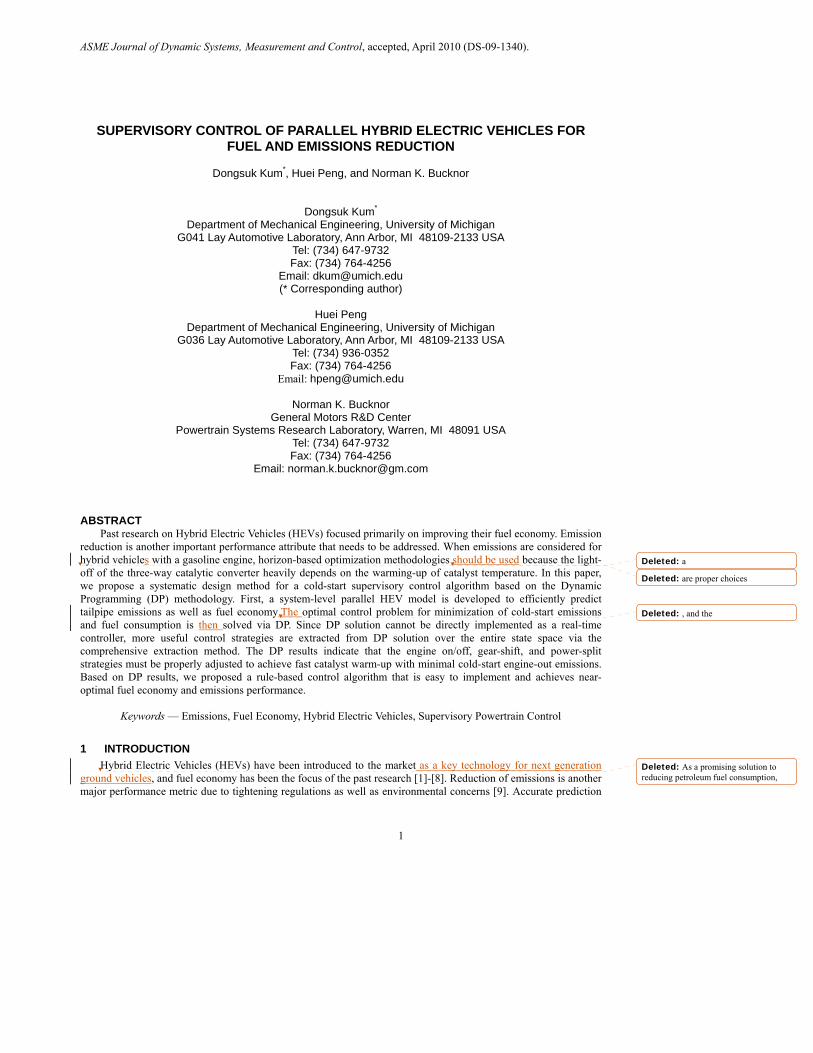
Figure 1: Schematic of the parallel hybrid electric vehicle
2.1 System Configuration
The target vehicle is a compact SUV with a pre-transmission parallel (power-assist) hybrid configuration. Figure 1 shows the schematic of the target vehicle. An engine-disconnect clutch replaces the torque converter for improved efficiency. The pre-transmission configuration allows a smaller M/G, easier packaging, and reduced spin losses over the post-transmission type [29]. Parameters of the vehicle are listed in Table 1.
Table 1: Vehicle parameters
Vehicle Curb weight: 1597 kg 2.4L, 4 Cylinder 127kw@5300 rpm (170 hp) SI Engine 217Nm@4500 rpm (160 lb-ft)
Transmission Automated Manual Transmission 4 speed, Gear Ratio: 2.95/1.62/1/0.68 Rated power: 20 kW AC Motor Max Torque: 200 Nm Capacity: 6 Ah Max Power: 20 kW # of Module: 40 NiMH Battery
Nominal Voltage: 7.5 volts/module
2.2 Fuel Economy Model A simple two-state (vehicle speed and SOC) vehicle model is used to predict power and energy flows for the
fuel economy evaluation. Other fast dynamics, such as intake manifold and motor dynamics, are neglected. Readers are referred to [4] for details. 2.3 Emission Model
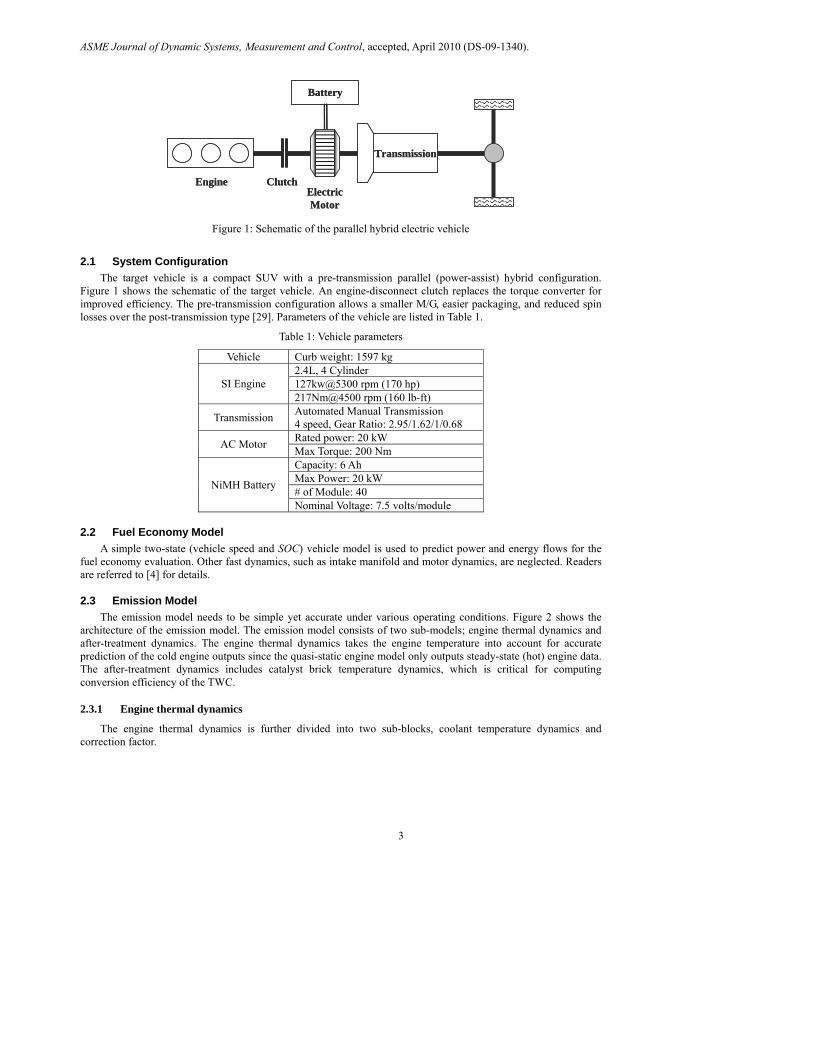
The emission model needs to be simple yet accurate under various operating conditions. Figure 2 shows the architecture of the emission model. The emission model consists of two sub-models; engine thermal dynamics and after-treatment dynamics. The engine thermal dynamics takes the engine temperature into account for accurate prediction of the cold engine outputs since the quasi-static engine model only outputs steady-state (hot) engine data. The after-treatment dynamics includes catalyst brick temperature dynamics, which is critical for computing conversion efficiency of the TWC.
2.3.1 Engine thermal dynamics
The engine thermal dynamics is further divided into two sub-blocks, coolant temperature dynamics and correction factor.
ASME Journal of Dynamic Systems, Measurement and Control, accepted, April 2010 (DS-09-1340).
4
Engine Thermal Dynamics
After-treatment Dynamics
Engine Thermal Dynamics
After-treatment Dynamics
Figure 2: Architecture of the emission model
Coolant temperature dynamics: Although the cylinder wall temperature is the key variable that affects the
combustion kinetics, the coolant temperature is frequently selected to represent the cylinder wall temperature because of 1) rapid response to the cylinder wall temperature, 2) ease of measurement, and 3) ease of modeling [17]. Under the assumption that the cooling system controller activates circulation of the coolant when the coolant temperature reaches a threshold value Tcool,max, a simple lumped thermal capacitor dynamics model is:
( ) ( )⎪⎩
⎪⎨⎧ −+−
=0
11coolatm
losscool
CFexh
gaincool TTTT
dtdT
ττmax,
max,
if,if,
coolcool
coolcool
TTTT
≥
< (2)
where Tcool is coolant temperature, Tatm is atmospheric temperature, and τgain and τloss are time constants. TexhCF
indicates the corrected (cold) exhaust gas temperature. Although combustion flame temperature would be more appropriate for heat-gain source temperature, Texh is used instead due to its accessibility.
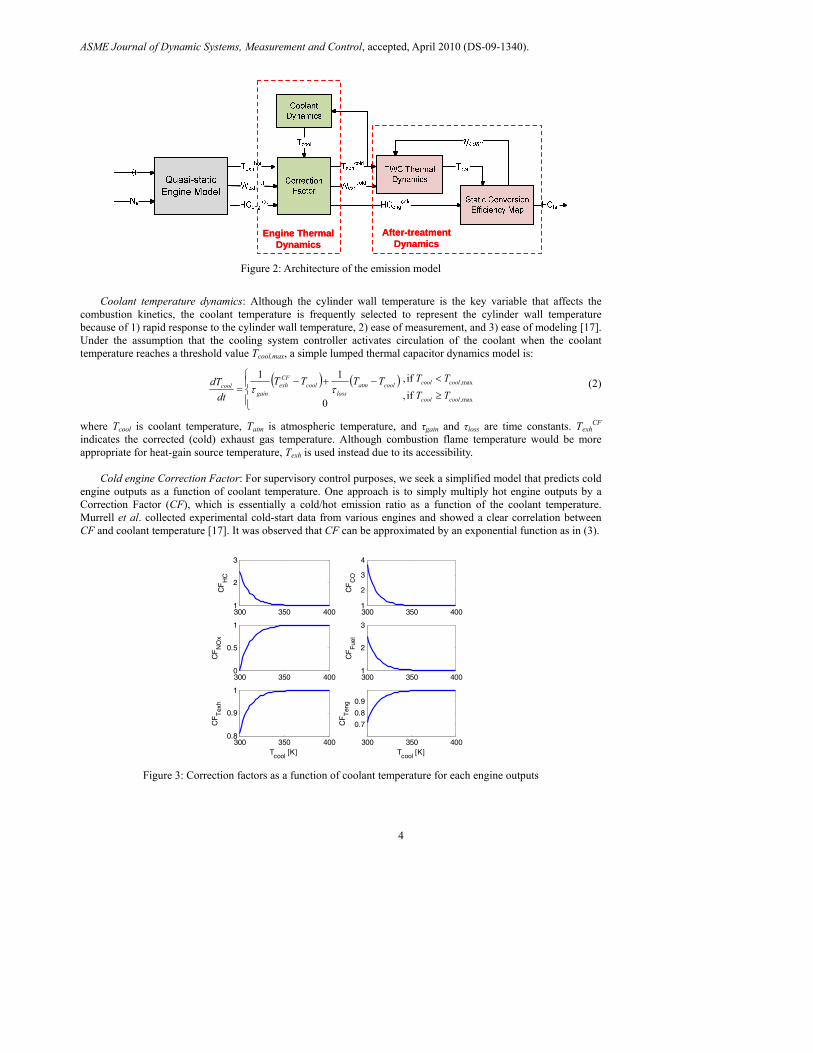
Cold engine Correction Factor: For supervisory control purposes, we seek a simplified model that predicts cold engine outputs as a function of coolant temperature. One approach is to simply multiply hot engine outputs by a Correction Factor (CF), which is essentially a cold/hot emission ratio as a function of the coolant temperature. Murrell et al. collected experimental cold-start data from various engines and showed a clear correlation between CF and coolant temperature [17]. It was observed that CF can be approximated by an exponential function as in (3).
300 350 4001
2
3
CF
HC
300 350 4001
2
3
4
CF
CO
300 350 4000
0.5
1
CF
NO
x
300 350 4001
2
3
CF
Fue
l
300 350 4000.8
0.9
1
CF
Tex
h
Tcool [K]300 350 400
0.7
0.8
0.9
CF
Ten
g
Tcool [K] Figure 3: Correction factors as a function of coolant temperature for each engine outputs
ASME Journal of Dynamic Systems, Measurement and Control, accepted, April 2010 (DS-09-1340).
5
))(exp(1 ,,0 jCFjcoolj KTTCF −−±= (3)
where T0,j and KCF,j are curve-fitting parameters for each engine output j. Figure 3 shows CF of each emission component, fuel consumption rate, torque, and exhaust temperature, as a function of coolant temperature. Note that the appropriate sign must be selected in (3) for each engine output. The cold engine outputs can be computed by multiplying hot engine outputs by CF as in (4).
jCFj jCF ⋅= (4)
where j represents engine outputs such as HC, CO, NOx, Tinlet, Te (engine torque), and fm (fuel consumption rate).
2.3.2 After-treatment dynamics
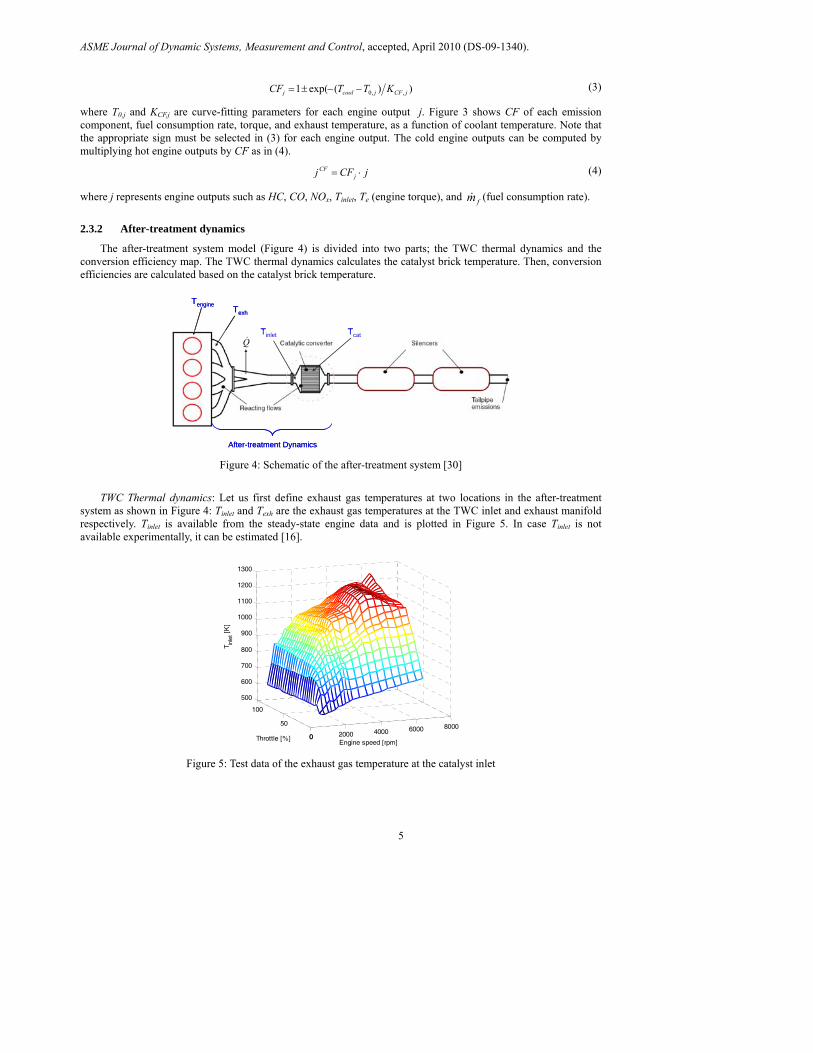
The after-treatment system model (Figure 4) is divided into two parts; the TWC thermal dynamics and the conversion efficiency map. The TWC thermal dynamics calculates the catalyst brick temperature. Then, conversion efficiencies are calculated based on the catalyst brick temperature.
Tinlet
Texh
After-treatment Dynamics
Tengine
QTcatTinlet
Texh
After-treatment Dynamics
Tengine
QTcat
Figure 4: Schematic of the after-treatment system [30]
TWC Thermal dynamics: Let us first define exhaust gas temperatures at two locations in the after-treatment
system as shown in Figure 4: Tinlet and Texh are the exhaust gas temperatures at the TWC inlet and exhaust manifold respectively. Tinlet is available from the steady-state engine data and is plotted in Figure 5. In case Tinlet is not available experimentally, it can be estimated [16].
0 2000 4000 6000 8000
0
50
100
500
600
700
800
900
1000
1100
1200
1300
Engine speed [rpm]Throttle [%]
T inle
t [K
]
Figure 5: Test data of the exhaust gas temperature at the catalyst inlet
ASME Journal of Dynamic Systems, Measurement and Control, accepted, April 2010 (DS-09-1340).
6
Given the inlet gas temperature, the brick temperature dynamics are modeled as a lumped thermal capacitor:
( ) ( ) ∑+−+−=i
iengiconviccatatmsatmcatCF
inletsengcatcat WKTTAhTTAWh
dtdT
Vc ,,,)( ηρ (5)
where Tcat is the catalyst brick temperature. The first term on the right side is heat gain from the exhaust gas, the second term is heat loss to the atmosphere, and the last term is the heat generated from emission conversion. Note that the heat transfer coefficient (hcat) is influenced by the gas flow rate, Weng. Assuming heat transfer coefficient hcat is a linear function of Weng, eq.(5) can be expressed as:
( ) ( ) ∑+−+−=i
iengiconviconvcatatmatm
catCF
inletinlet
engcat WKTTTTW
dtdT
,,,1 η
ττ (6)
where τinlet and τatm are time constants; Kconv,i is a conversion heat generation constant for each reacting emission; ηconv,i is conversion efficiency of each emission; Weng,i is flow rate of each emission; and i represents type of emission.
Conversion efficiency map: Based on the catalytic converter brick temperature, we can relate this information to the emission conversion efficiency [11]-[14], defined as:
ieng
itailiconv W
W
,
,, 1−≡η (7)
where Wtail,i is tailpipe flow rate of emission i. Both exponential and arctan functions are commonly used to approximate the conversion efficiency. In this study, arctan is selected due to its straightforward parameter tuning.
iexh
ieff
ilightoffcaticonv K
TT,
,
,, arctan4.05.0 ξη ⋅⎟
⎟⎠
⎞⎜⎜⎝
⎛⎟⎟⎠
⎞⎜⎜⎝
⎛ −⋅+= (8)
where Keff,i is a tuning parameter, and Tlightoff,i is the light-off temperature of emission i. The effect of the gas flow rate on conversion efficiency is approximated by a linear function [21]:
iengiengiexh bWaW +⋅=)(,ξ (9)
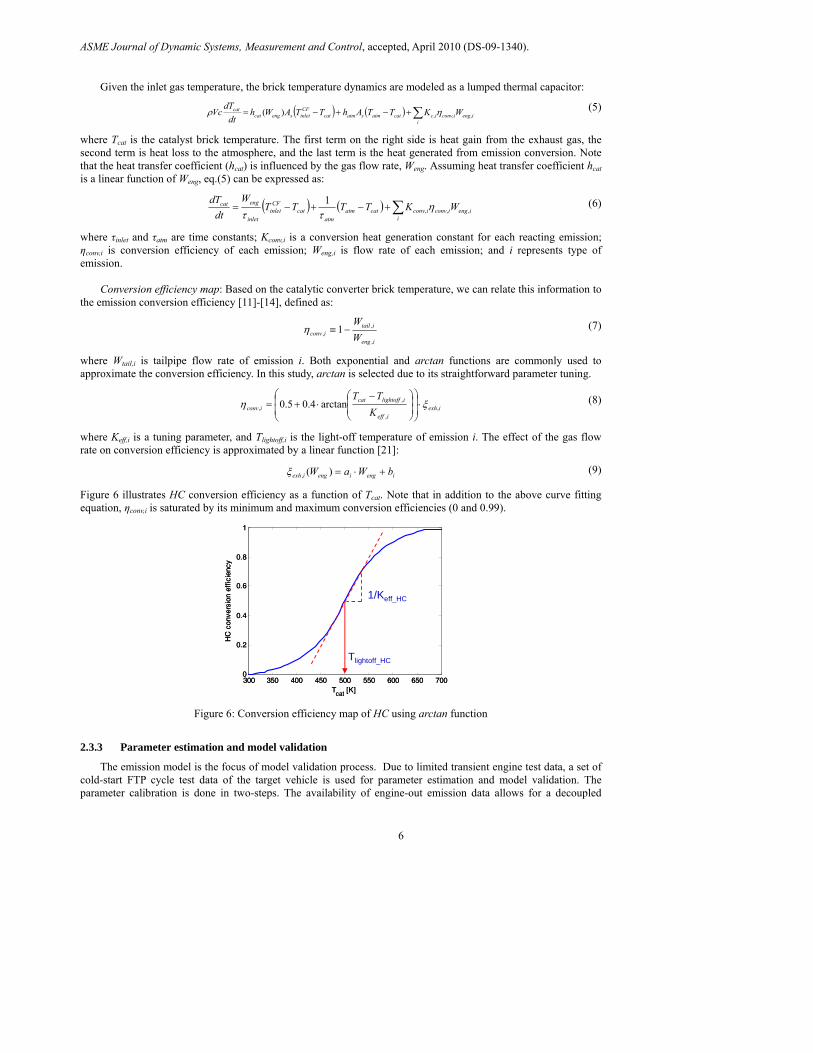
Figure 6 illustrates HC conversion efficiency as a function of Tcat. Note that in addition to the above curve fitting equation, ηconv,i is saturated by its minimum and maximum conversion efficiencies (0 and 0.99).
300 350 400 450 500 550 600 650 7000
0.2
0.4
0.6
0.8
1
Tcat [K]
HC
con
vers
ion
effic
ienc
y
1/Keff_HC
Tlightoff_HC
300 350 400 450 500 550 600 650 7000
0.2
0.4
0.6
0.8
1
Tcat [K]
HC
con
vers
ion
effic
ienc
y
1/Keff_HC
Tlightoff_HC
Figure 6: Conversion efficiency map of HC using arctan function
2.3.3 Parameter estimation and model validation
The emission model is the focus of model validation process. Due to limited transient engine test data, a set of cold-start FTP cycle test data of the target vehicle is used for parameter estimation and model validation. The parameter calibration is done in two-steps. The availability of engine-out emission data allows for a decoupled
ASME Journal of Dynamic Systems, Measurement and Control, accepted, April 2010 (DS-09-1340).
7
parameter tuning of the engine thermal dynamics and after-treatment dynamics. First, using the engine-out emissions test data, parameters of the after- treatment dynamics are tuned to match the catalyst temperature, conversion efficiency, and tailpipe emission responses of the model to those of the cold-start FTP cycle test data. With the catalytic converter model tuned properly, the cold engine model is then tuned to match both engine-out and tailpipe emission responses with those of the cold-start FTP cycle data.
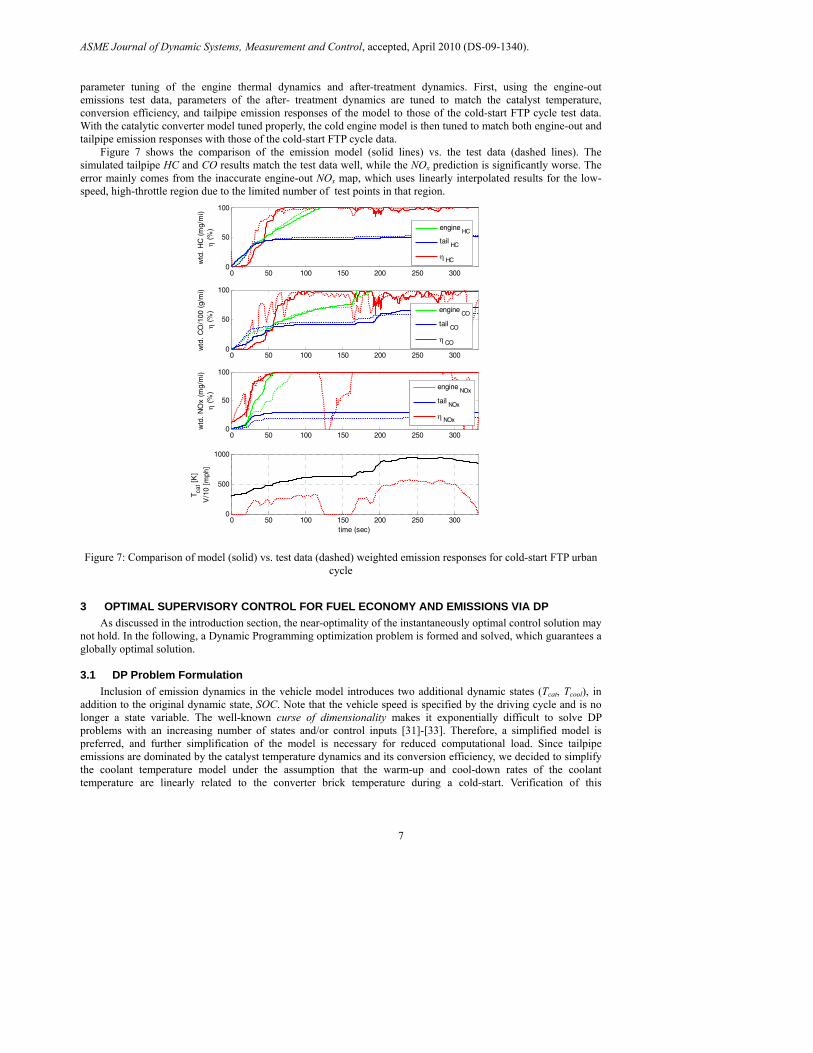
Figure 7 shows the comparison of the emission model (solid lines) vs. the test data (dashed lines). The simulated tailpipe HC and CO results match the test data well, while the NOx prediction is significantly worse. The error mainly comes from the inaccurate engine-out NOx map, which uses linearly interpolated results for the low-speed, high-throttle region due to the limited number of test points in that region.
Tcat
speed
0 50 100 150 200 250 3000
50
100w
td.
HC
(m
g/m
i)η
(%)
0 50 100 150 200 250 3000
50
100
wtd
. C
O/1
00 (
g/m
i)η
(%)
0 50 100 150 200 250 3000
50
100
wtd
. N
Ox
(mg/
mi)
η (%
)
0 50 100 150 200 250 3000
500
1000
T cat [
K]
V/1
0 [m
ph]
time (sec)
engine HC
tail HC
η HC
engine CO
tail CO
η CO
engine NOx
tail NOx
η NOx
Figure 7: Comparison of model (solid) vs. test data (dashed) weighted emission responses for cold-start FTP urban
cycle
3 OPTIMAL SUPERVISORY CONTROL FOR FUEL ECONOMY AND EMISSIONS VIA DP
As discussed in the introduction section, the near-optimality of the instantaneously optimal control solution may not hold. In the following, a Dynamic Programming optimization problem is formed and solved, which guarantees a globally optimal solution.
3.1 DP Problem Formulation
Inclusion of emission dynamics in the vehicle model introduces two additional dynamic states (Tcat, Tcool), in addition to the original dynamic state, SOC. Note that the vehicle speed is specified by the driving cycle and is no longer a state variable. The well-known curse of dimensionality makes it exponentially difficult to solve DP problems with an increasing number of states and/or control inputs [31]-[33]. Therefore, a simplified model is preferred, and further simplification of the model is necessary for reduced computational load. Since tailpipe emissions are dominated by the catalyst temperature dynamics and its conversion efficiency, we decided to simplify the coolant temperature model under the assumption that the warm-up and cool-down rates of the coolant temperature are linearly related to the converter brick temperature during a cold-start. Verification of this

ASME Journal of Dynamic Systems, Measurement and Control, accepted, April 2010 (DS-09-1340).
8
assumption can be found from the literature [17], and the coolant temperature is approximated by a linear function of the brick temperature until it reaches the coolant circulation threshold temperature, Tcool,max.
⎩⎨⎧ −+
=max,
_ )(
cool
atmcatratioTatmcool T
TTKTT
max,
max,
if,if,
coolcool
coolcool
TTTT
≥
< (10)
Replacing the original coolant temperature dynamics (2) with (10) reduces the number of dynamic states to two, which results in a DP problem with manageable computation load. Table 2 summarizes the key variables of the DP problem, which consists of a discrete and a continuous control input and two dynamic states, whereas vehicle velocity (V) and power demand (Pdem) are specified by the FTP-72 driving cycle.
Table 2: Trade-off Between Fuel Economy and HC
Variables Grid Stage (k) Time [0:1:final time]
Engine Torque (Teng) [-1, 0:5:210] Control (u) Gear (Gr) [1 2 3 4] SOC [0.5:0.01:0.7] State (x) Catalyst Temperature (Tcat) [300:40:700, 900]
Note that the engine off command is included in this DP problem by augmenting Teng grid with -1. Also, motor torque (Tm/g) is eliminated as a control variable by the drivability constraint defined as
engdemgm TTT −=/
(11)
where Tdem is torque demand at the transmission input. The optimal control problem is defined as follows:
Minimize ( )∑−
=
Δ⋅+Δ⋅+⋅++Δ⋅=1
0/
N
koffonkkk EGrHCFCSOCJ λγβα (12)
Subject to
max__min_
maxmin
max_/_/min_/
max__min_
max__min_
battkbattbatt
k
gmkgmgm
ekee
ekee
PPPSOCSOCSOC
TTT
TTT
NNN
≤≤≤≤
≤≤
≤≤
≤≤
(13)
Although three types of major harmful emissions (HC, CO, and NOx) were modeled, the emission regulations put emphasis on eliminating cold-start HC for gasoline engines [34]. Therefore, only HC is included in the cost function to illustrate the design method of cold-start SPC in this study. Due to numerical difficulties of DP implementation for the charge sustaining constraint,
initialfinal SOCSOC = , (14)
it is replaced by the ΔSOC term in the cost function, and α must be adjusted to match the final SOC with the initial SOC. Penalty terms on frequent engine on/off and gear-shifts were also added to help separate engine on/off modes and gear selections from each other for the extraction process in Section IV. 3.2 Results and Discussion
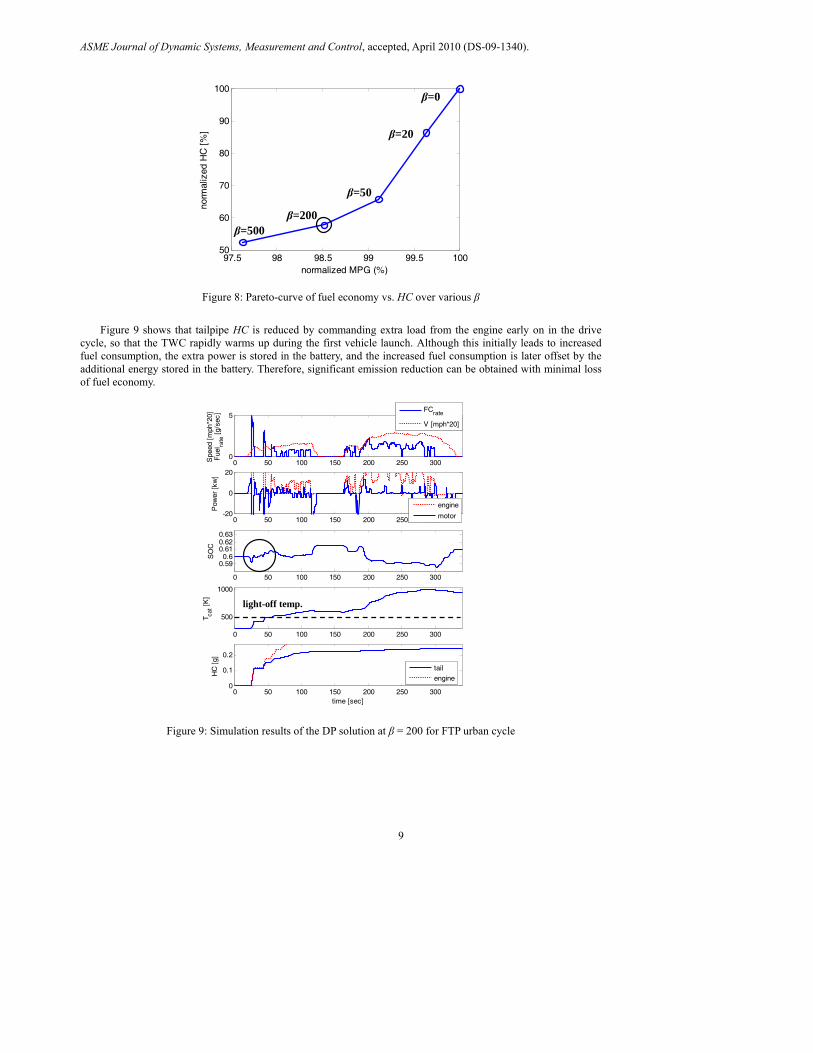
The trade-off between fuel economy and HC is studied by varying coefficient β. Figure 8 shows that a trade-off exists between fuel economy and tailpipe HC, and a substantial tailpipe HC reduction can be achieved by a slight fuel economy loss, through a significantly shortened light-off time.
ASME Journal of Dynamic Systems, Measurement and Control, accepted, April 2010 (DS-09-1340).
9
97.5 98 98.5 99 99.5 10050
60
70
80
90
100
normalized MPG (%)
norm
aliz
ed H
C [
%] β=20
β=0
β=50
β=200β=500
Figure 8: Pareto-curve of fuel economy vs. HC over various β
Figure 9 shows that tailpipe HC is reduced by commanding extra load from the engine early on in the drive
cycle, so that the TWC rapidly warms up during the first vehicle launch. Although this initially leads to increased fuel consumption, the extra power is stored in the battery, and the increased fuel consumption is later offset by the additional energy stored in the battery. Therefore, significant emission reduction can be obtained with minimal loss of fuel economy.
0 50 100 150 200 250 3000
5
Spe
ed [
mph
*20]
Fue
l rate
[g/
sec]
FCrate
V [mph*20]
0 50 100 150 200 250 300-20
0
20
Pow
er [
kw]
engine
motor
0 50 100 150 200 250 300
0.590.6
0.610.620.63
SO
C
0 50 100 150 200 250 300
500
1000
T cat [
K]
0 50 100 150 200 250 3000
0.1
0.2
time [sec]
HC
[g]
tail
engine
light-off temp.
Figure 9: Simulation results of the DP solution at β = 200 for FTP urban cycle
ASME Journal of Dynamic Systems, Measurement and Control, accepted, April 2010 (DS-09-1340).
10
4 COLD-START SUPERVISORY POWERTRAIN CONTROLLER Despite guaranteed optimality of the DP solution, its solution cannot be directly implemented, and extraction of
an implementable feedback controller is needed. The conventional extraction method used in [4] utilizes the single optimal solution, which does not provide enough information during the cold-start phase due to the short warm-up time. In addition, learning from transitions outside of the optimal path helps to alleviate the “cycle beating” nature of the learned behavior. Thus, a new extraction method is proposed for the design of a DP-based cold-start Supervisory Powertrain Controller (SPC). 4.1 Comprehensive Extraction Method
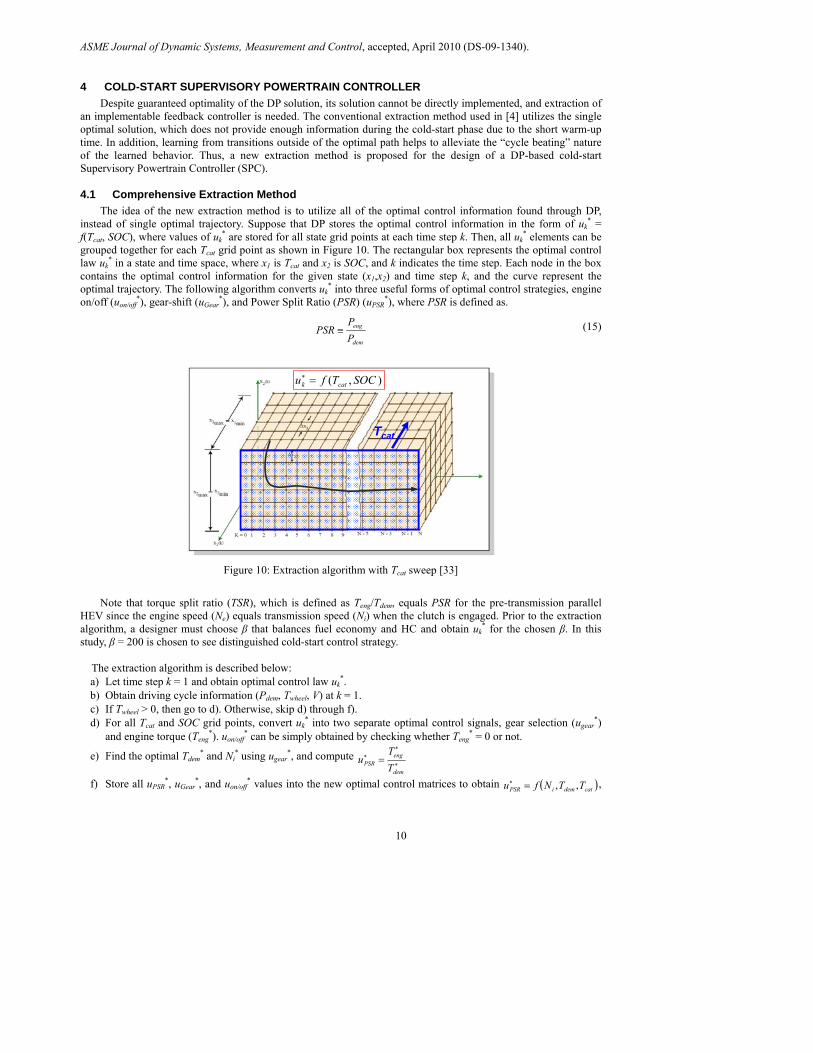
The idea of the new extraction method is to utilize all of the optimal control information found through DP, instead of single optimal trajectory. Suppose that DP stores the optimal control information in the form of uk
* = f(Tcat, SOC), where values of uk
* are stored for all state grid points at each time step k. Then, all uk* elements can be
grouped together for each Tcat grid point as shown in Figure 10. The rectangular box represents the optimal control law uk
* in a state and time space, where x1 is Tcat and x2 is SOC, and k indicates the time step. Each node in the box contains the optimal control information for the given state (x1,x2) and time step k, and the curve represent the optimal trajectory. The following algorithm converts uk
* into three useful forms of optimal control strategies, engine on/off (uon/off
*), gear-shift (uGear*), and Power Split Ratio (PSR) (uPSR
*), where PSR is defined as.
dem
eng
PP
PSR ≡ (15)
),( SOCTfu catk =∗
Tcat
Figure 10: Extraction algorithm with Tcat sweep [33]
Note that torque split ratio (TSR), which is defined as Teng/Tdem, equals PSR for the pre-transmission parallel
HEV since the engine speed (Ne) equals transmission speed (Ni) when the clutch is engaged. Prior to the extraction algorithm, a designer must choose β that balances fuel economy and HC and obtain uk
* for the chosen β. In this study, β = 200 is chosen to see distinguished cold-start control strategy.
The extraction algorithm is described below: a) Let time step k = 1 and obtain optimal control law uk
*. b) Obtain driving cycle information (Pdem, Twheel, V) at k = 1. c) If Twheel > 0, then go to d). Otherwise, skip d) through f). d) For all Tcat and SOC grid points, convert uk
* into two separate optimal control signals, gear selection (ugear*)
and engine torque (Teng*). uon/off
* can be simply obtained by checking whether Teng* = 0 or not.
e) Find the optimal Tdem* and Ni
* using ugear*, and compute
∗
∗∗ =
dem
engPSR T
Tu
f) Store all uPSR*, uGear
*, and uon/off* values into the new optimal control matrices to obtain ( )catdemiPSR TTNfu ,,=∗ ,
ASME Journal of Dynamic Systems, Measurement and Control, accepted, April 2010 (DS-09-1340).
11
( )catdemGear TPVfu ,,=∗ , ( )catwheeloffon TTVfu ,,/ =∗ , and ( )catdemioffon TTNfu ,,/ =∗ .
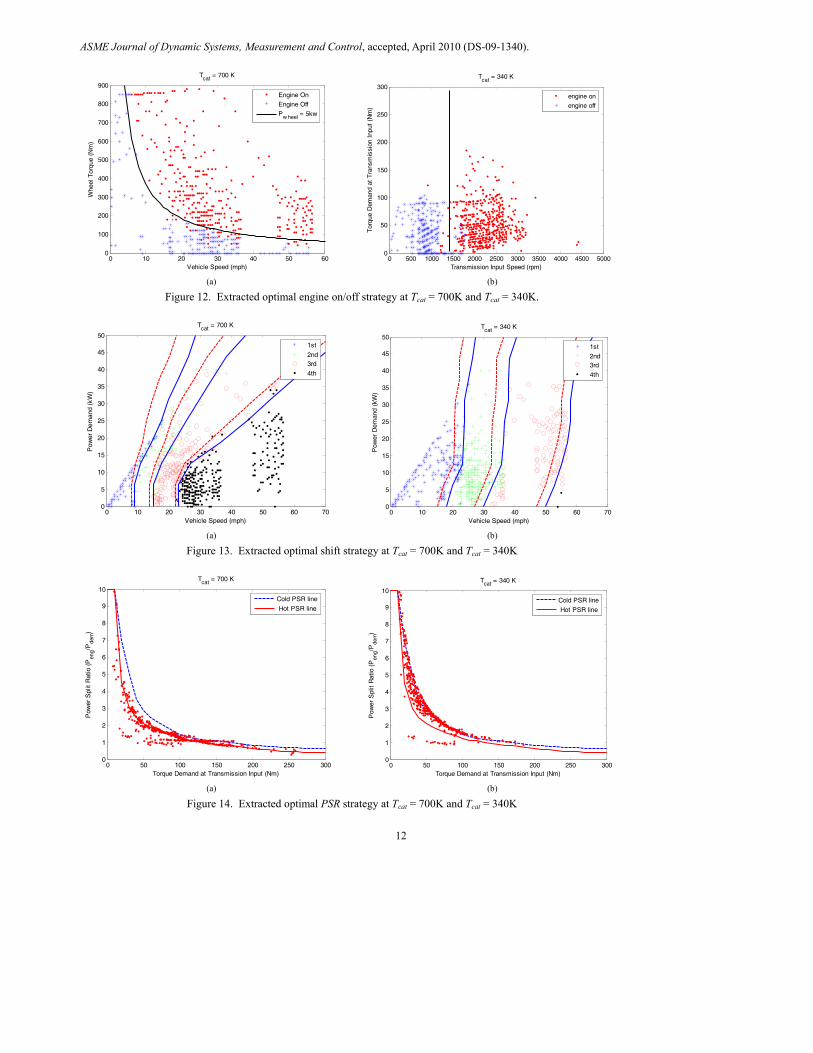
g) Repeat a) through f) for all k. Two representative sets of optimal control matrices for cold and hot strategies, Tcat = 340K and 700K
respectively, are selected and plotted in Figure 11-13. Extracted results for other temperatures are almost identical to either Tcat = 340K or Tcat = 700K. Figs. 11-13 indicate that all three control strategies, engine on/off, gear-shift, and PSR, should be adjusted during a cold-start for reduced emissions. Figure 11(a) shows that the optimal engine on/off decision can be made by the power demand at the wheel when the catalyst is hot. On the other hand, data points for the cold catalyst did not show a clear separation of engine on/off data. Instead, engine-on and off data are much more distinguishable when they are plotted on a transmission input speed (Ni) vs. torque demand at the transmission input (Tdem) plane as Figure 11(b) shows. Note that when the catalyst is cold the engine is not turned on until the transmission input speed (Ni) reaches 1500 rpm, even when high power is demanded by the driver. This is to make sure that the engine operates at higher speed when the engine turns on during cold-start. Figure 12 indicates that both cold and hot optimal shift strategies have clearly separable gear data on a V vs. Pdem plane, which allows use of a conventional shift-map. During cold-start, a late-shift strategy is necessary to promote faster catalyst warm-up by operating the engine at higher speeds. Note that EV mode shift-map was similarly extracted. Figure 13 shows that cold and hot optimal PSR data points can be approximated by two separate lines. The cold PSR line is located higher than the hot PSR line for increased Texh and faster catalyst warm-up. Note that PSR lines can be replaced by the optimal engine torque map, Teng
*= f(Ne,Tdem,Tcat), where Teng* data are plotted on a Te vs. Tdem vs. Ne space to
form optimal engine torque surfaces. This method includes Ne as an additional axis for better approximation of DP results. In summary, the extracted results show that the engine on/off and shift strategy play key roles in achieving optimal charge management and fast catalyst warm-up by determining the optimal engine speed, while PSR mainly focuses on optimizing engine operations for the given speed. Therefore, finding the optimal power-split strategy for pre-determined engine on/off and gear-shift strategies is not a proper approach to formulate the optimization problem.
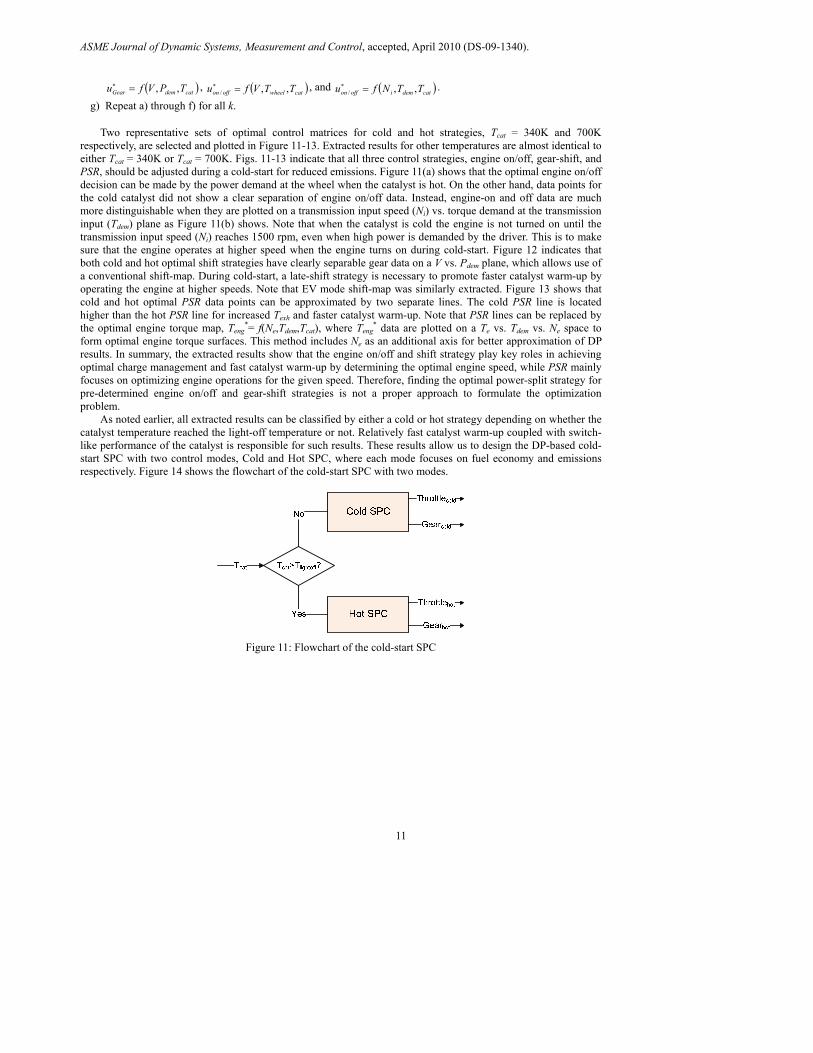
As noted earlier, all extracted results can be classified by either a cold or hot strategy depending on whether the catalyst temperature reached the light-off temperature or not. Relatively fast catalyst warm-up coupled with switch-like performance of the catalyst is responsible for such results. These results allow us to design the DP-based cold-start SPC with two control modes, Cold and Hot SPC, where each mode focuses on fuel economy and emissions respectively. Figure 14 shows the flowchart of the cold-start SPC with two modes.
Figure 11: Flowchart of the cold-start SPC
ASME Journal of Dynamic Systems, Measurement and Control, accepted, April 2010 (DS-09-1340).
12
0 10 20 30 40 50 600
100
200
300
400
500
600
700
800
900
Vehicle Speed (mph)
Whe
el T
orqu
e (N
m)
Tcat = 700 K
Engine On
Engine Off
Pw heel = 5kw
0 500 1000 1500 2000 2500 3000 3500 4000 4500 50000
50
100
150
200
250
300
Transmission Input Speed (rpm)
Tor
que
Dem
and
at T
rans
mis
sion
Inp
ut (
Nm
)
Tcat = 340 K
engine on
engine off
(a) (b)
Figure 12. Extracted optimal engine on/off strategy at Tcat = 700K and Tcat = 340K.
0 10 20 30 40 50 60 700
5
10
15
20
25
30
35
40
45
50
Vehicle Speed (mph)
Pow
er D
eman
d (k
W)
Tcat = 700 K
1st
2nd3rd
4th
0 10 20 30 40 50 60 700
5
10
15
20
25
30
35
40
45
50
Vehicle Speed (mph)
Pow
er D
eman
d (k
W)
Tcat = 340 K
1st
2nd3rd
4th
(a) (b)
Figure 13. Extracted optimal shift strategy at Tcat = 700K and Tcat = 340K
0 50 100 150 200 250 3000
1
2
3
4
5
6
7
8
9
10
Torque Demand at Transmission Input (Nm)
Pow
er S
plit
Rat
io (
Pen
g/Pde
m)
Tcat = 700 K
Cold PSR line
Hot PSR line
0 50 100 150 200 250 3000
1
2
3
4
5
6
7
8
9
10
Torque Demand at Transmission Input (Nm)
Pow
er S
plit
Rat
io (
Pen
g/Pde
m)
Tcat = 340 K
Cold PSR line
Hot PSR line
(a) (b)
Figure 14. Extracted optimal PSR strategy at Tcat = 700K and Tcat = 340K
ASME Journal of Dynamic Systems, Measurement and Control, accepted, April 2010 (DS-09-1340).
13
4.2 Hot SPC Algorithm
The logic of the DP-based Hot SPC algorithm for a fully warmed-up catalyst is described as follows.
If Pdem<Pon/off, Turn off the engine and select the gear using the Electric Vehicle (EV) shift-map
/m g demP P=
If V<20mph, then disengage the clutch for engine disconnect Else, engage the clutch.
Else, Turn on the engine Select the gear using the engine-on mode shift-map and find Tdem and Ni Find PSR from Tdem and Ni and compute
demeng PPSRP ⋅=
Compute M/G power:/m g dem engP P P= −
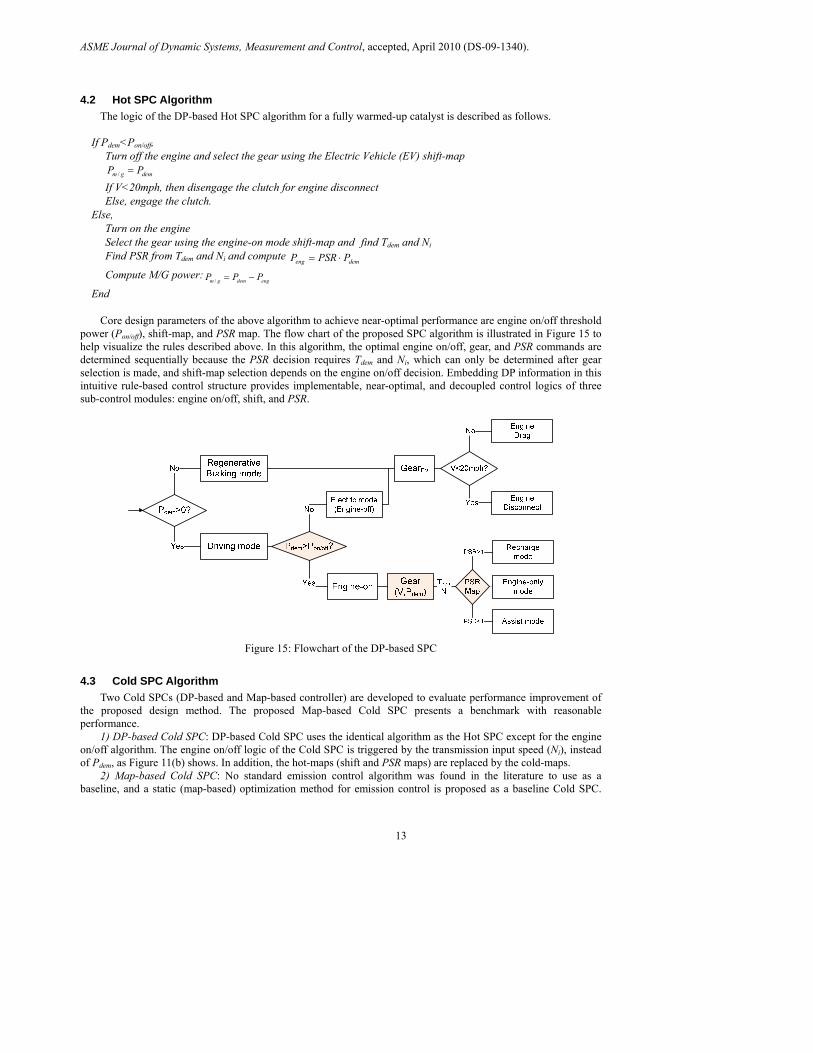
End Core design parameters of the above algorithm to achieve near-optimal performance are engine on/off threshold
power (Pon/off), shift-map, and PSR map. The flow chart of the proposed SPC algorithm is illustrated in Figure 15 to help visualize the rules described above. In this algorithm, the optimal engine on/off, gear, and PSR commands are determined sequentially because the PSR decision requires Tdem and Ni, which can only be determined after gear selection is made, and shift-map selection depends on the engine on/off decision. Embedding DP information in this intuitive rule-based control structure provides implementable, near-optimal, and decoupled control logics of three sub-control modules: engine on/off, shift, and PSR.
Figure 15: Flowchart of the DP-based SPC
4.3 Cold SPC Algorithm
Two Cold SPCs (DP-based and Map-based controller) are developed to evaluate performance improvement of the proposed design method. The proposed Map-based Cold SPC presents a benchmark with reasonable performance.
1) DP-based Cold SPC: DP-based Cold SPC uses the identical algorithm as the Hot SPC except for the engine on/off algorithm. The engine on/off logic of the Cold SPC is triggered by the transmission input speed (Ni), instead of Pdem, as Figure 11(b) shows. In addition, the hot-maps (shift and PSR maps) are replaced by the cold-maps.
2) Map-based Cold SPC: No standard emission control algorithm was found in the literature to use as a baseline, and a static (map-based) optimization method for emission control is proposed as a baseline Cold SPC.

ASME Journal of Dynamic Systems, Measurement and Control, accepted, April 2010 (DS-09-1340).
14
Since tail-pipe emissions are significantly influenced by the catalytic converter temperature, the optimization problem must be carefully formulated for an effective emission reduction. The idea of the Map-based Cold SPC is to find the optimal throttle and shift strategy that minimizes engine-out HC and maximizes the exhaust temperature for fast catalyst warm-up based on transient engine maps. The static optimization problem is formulated and solved as follows.
Objective: Find the throttle (φ) and gear (Gr) that maximizes the following value function.
ratecoolHCinletcoolT
CFrate
CFinletcoolrateinlet
HCTCFTTCFHCTTHCTf
inlet⋅⋅−⋅=
⋅−=)()(
),,(γ
γ (16)
where Tinlet and HCrate are hot engine-maps, γ is a weighting factor for hydrocarbon, and CFi(Tcool) is the correction factor dependent on coolant temperature. Eq.(16) is introduced to maximize the exhaust gas temperature at the catalyst inlet (Tinlet) but minimize hydrocarbon rate (HCrate).
In Figure 16, an example contour plot of the value function at Tcool = 400K and γ = 8000 illustrates how the optimal throttle and gear combination, which maximizes the value function, can be computed. γ is used to balance fast warm-up and lower HC by trial-and-error. The red dashed line represents the optimal throttle line that maximizes the value function at each engine speed (Ne), and this line changes as Tcool increases. Four x marks represent each gear selection on the optimal throttle line for a given vehicle speed. The optimal gear can be easily selected by evaluating value functions at these four points. These points will move along the optimal throttle line as the vehicle accelerates.
700
700
700
700
700
750
750
750
750
750
750
800
800
800
800
800
850
850
850
850
850
900
900
900
900
900
950
950
1000
1000
Engine Speed (rpm)
Thr
ottle
(%
)
1000 1500 2000 2500 3000 3500 4000 4500 5000 5500 60000
10
20
30
40
50
60
70
80
90
100
xx
xx
700
700
700
700
700
750
750
750
750
750
750
800
800
800
800
800
850
850
850
850
850
900
900
900
900
900
950
950
1000
1000
Engine Speed (rpm)
Thr
ottle
(%
)
1000 1500 2000 2500 3000 3500 4000 4500 5000 5500 60000
10
20
30
40
50
60
70
80
90
100
xx
xx
Figure 16: A sample contour plot of the value function f for Tcool = 400 K and γ = 8000.
Off-line optimization algorithm: Since Tinlet and HCrate are functions of φ and Ne, the value function can be
expressed as a function of φ, Ne, and Tcool, i.e.,
),,(),,( coolecoolrateinlet TNgTHCTf ϕ⇒ (17)
The new value function g can then be used in the following off-line optimization algorithm. a) For a given vehicle speed (V), an engine speed vector (Ne) can be computed using the gear ratio vector (Gr). b) For a given Tcool and Ne vector, the optimal throttle vector (φopt) can be obtained from the pre-computed
optimal throttle look-up table. c) For given φopt, Ne, and Tcool, the value function g(x) can then be evaluated and compared with each other to
find the optimal Gr and φ for given V and Tcool. d) Repeat steps a) through c) for all V and Tcool to generate cold-start gear and throttle look-up tables,
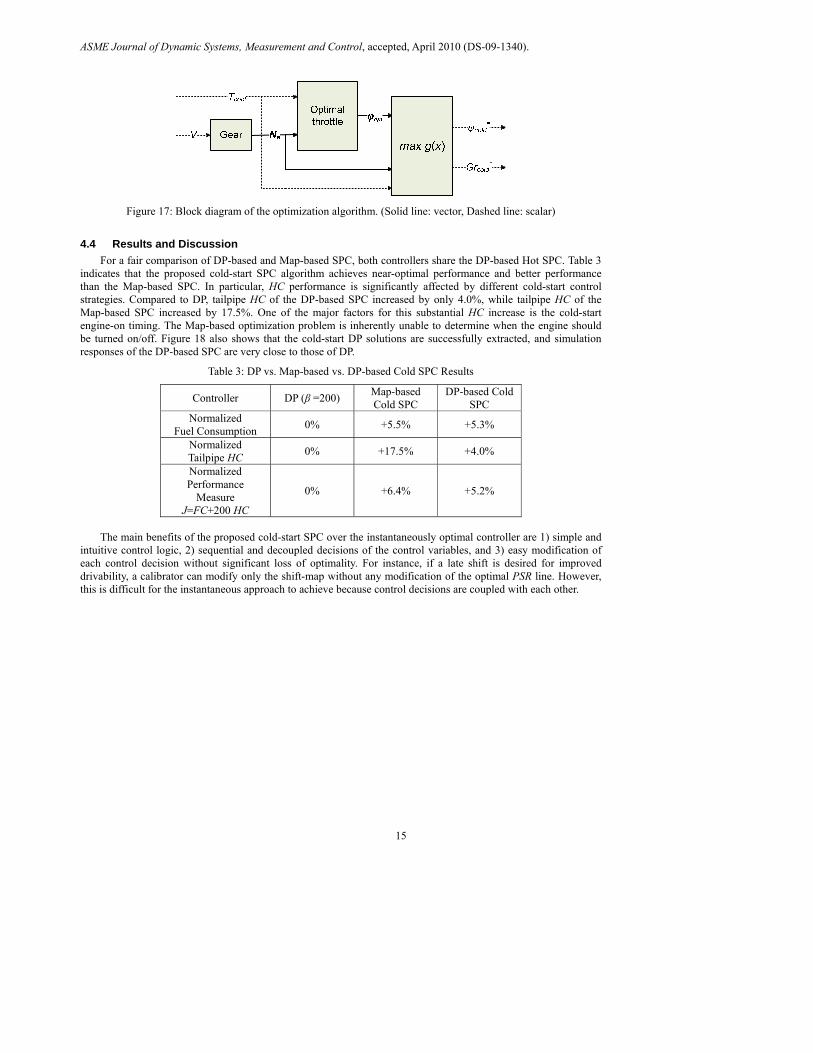
),(),,( coolcoldcoolcold TVTVGr ϕ . The overall structure of the algorithm described above is shown in Figure 17.
ASME Journal of Dynamic Systems, Measurement and Control, accepted, April 2010 (DS-09-1340).
15
Figure 17: Block diagram of the optimization algorithm. (Solid line: vector, Dashed line: scalar)
4.4 Results and Discussion
For a fair comparison of DP-based and Map-based SPC, both controllers share the DP-based Hot SPC. Table 3 indicates that the proposed cold-start SPC algorithm achieves near-optimal performance and better performance than the Map-based SPC. In particular, HC performance is significantly affected by different cold-start control strategies. Compared to DP, tailpipe HC of the DP-based SPC increased by only 4.0%, while tailpipe HC of the Map-based SPC increased by 17.5%. One of the major factors for this substantial HC increase is the cold-start engine-on timing. The Map-based optimization problem is inherently unable to determine when the engine should be turned on/off. Figure 18 also shows that the cold-start DP solutions are successfully extracted, and simulation responses of the DP-based SPC are very close to those of DP.
Table 3: DP vs. Map-based vs. DP-based Cold SPC Results
Controller DP (β =200) Map-based Cold SPC
DP-based Cold SPC
Normalized Fuel Consumption 0% +5.5% +5.3%
Normalized Tailpipe HC 0% +17.5% +4.0%
Normalized Performance
Measure J=FC+200 HC
0% +6.4% +5.2%
The main benefits of the proposed cold-start SPC over the instantaneously optimal controller are 1) simple and
intuitive control logic, 2) sequential and decoupled decisions of the control variables, and 3) easy modification of each control decision without significant loss of optimality. For instance, if a late shift is desired for improved drivability, a calibrator can modify only the shift-map without any modification of the optimal PSR line. However, this is difficult for the instantaneous approach to achieve because control decisions are coupled with each other.

ASME Journal of Dynamic Systems, Measurement and Control, accepted, April 2010 (DS-09-1340).
16
0 20 40 60 80 100 1200
2
4
Gea
r
SPC
DP
0 20 40 60 80 100 1200
0.02
HC
rate
[g/
s] SPC
DP
0 20 40 60 80 100 120
400
600
T cat [
K]
SPC
DP
0 20 40 60 80 100 1200
2
4
PS
R
SPC
DP
0 20 40 60 80 100 1200.58
0.6
0.62
SO
C
time [sec]
SPC
DP
light-off temp.
Figure 18: DP vs. DP-based SPC cold-start simulation results.
5 CONCLUSION
This paper studies control of HEVs for simultaneous fuel economy and emission optimization. When emissions are considered, horizon-based design approaches have an advantage over instantaneous optimization approaches because tailpipe emissions heavily depend on the warming-up of the catalytic converter, a slow dynamics that depends on the behavior over a time horizon. The Dynamic Programming (DP) approach was selected to obtain the globally optimal solution, and the results showed that significant reductions in emissions can be achieved at a small loss of fuel economy.
A comprehensive extraction technique is proposed to extract three control strategies (engine on/off, gear-shift, and power-split) from the DP solution over the entire state space. The extracted information indicates that these three control strategies should be adjusted during a cold-start to achieve fast catalyst warm-up with light cold-start engine-out HC emissions for parallel HEVs. The extracted information is then put together to form a DP-based SPC, and its results are compared to DP results and a Map-based algorithm. Simulation results show that DP-based SPC achieved substantial HC reduction over the Map-based algorithm.
ACKNOWLEDGEMENT The authors would like to thank Professor Dennis Assanis and Professor Jing Sun for valuable discussions
regarding the emission model development. We also thank Dr. Gary Smyth, Director of GM R&D’s Powertrain Systems Research Lab, and Dr. Madhu Raghavan, Hybrid Systems Group Manager, for their support of this project.
REFERENCES [1] Brahma, A., Guezennec, Y., and Rizzoni, G., 2000, “Dynamic optimization of mechanical/ electrical power flow
in parallel hybrid electric vehicles,” Proc. of 5th Int. Symposium in Advanced Vehicle Control, Ann Arbor, MI. [2] Schouten, N., Salman, M., and Kheir, N., 2002, “Fuzzy logic control for parallel hybrid vehicles,” IEEE Trans.
on Control Systems Technology, vol. 10, no. 3, pp. 460-468.
Deleted: SPC
Deleted: SPC
Deleted: As a future work, the proposed methodology will be applied to PHEV control, where catalyst cool-down becomes a potential issue due to the prolonged engine-off time.
ASME Journal of Dynamic Systems, Measurement and Control, accepted, April 2010 (DS-09-1340).
17
[3] Paganelli, G., Delprat, S., Guerra, T.M., Rimaux, J., and Santin, J. J., 2002, "Equivalent consumption minimization strategy for parallel hybrid powertrains," Proc. Fall VTC-01 Conference, Atlantic City, NJ.
[4] Lin, C.-C. and Peng, H., 2003, “Power management strategy for a parallel hybrid electric truck,” IEEE Trans. on Control Systems Technology, vol. 11, no. 6, pp. 839-849.
[5] Delprat, S., Lauber, J., Guerra T. M., and Rimaux, J., 2004, “Control of a parallel hybrid powertrain: optimal control,” IEEE Transactions on Vehicular Technology, vol. 53, no. 3, pp. 872-881 ,2004.
[6] Won, J.-S., Langari, R., and Ehsani, M., 2005, “An energy management and charge sustaining strategy for a parallel hybrid vehicle with CVT.” IEEE Transactions on Control Systems Technology, vol. 13, no. 2, pp. 313-320.
[7] Sciarretta, A. and Guzzella, L., 2007, “Control of hybrid electric vehicles: optimal energy-management strategies,” IEEE Control Systems Magazine, vol. 27, no. 2, pp. 60-70.
[8] Liu, J. and Peng, H., 2008, “Modeling and control of a power-split hybrid vehicle,” IEEE Trans. on Control Systems Technology, vol. 16, no. 6, pp. 1242-1251.
[9] Dieselnet, “Emission Standards – United States – California,” [online], Available at http://www.dieselnet.com/standards/us/ld_ca.php
[10] Koltsakis, G. C., Konstantinidis, P. A., and Stamatelos, A. M., 1997, “Development and application range of mathematical models for 3-way catalytic converters,” Applied Catalysis B: Environmental, vol. 12, pp.161-191.
[11] Chan, S.H., Hoang, D.L., and Zhou, P. L., 2000, “Heat transfer and chemical kinetics in the exhaust system of a cold-start engine fitted with a three-way catalytic converter,” Proceedings of the Institution of Mechanical Engineers, vol. 214, Part D, pp. 765-777.
[12] Kallenbach, J., Florchinger, P., and Heibel, A., 1999, “Modeling of automotive aftertreatment catalysts,” SAE, paper 1999-01-3043, 1999.
[13] Laing, P. M., Shane, M. D., Son, S., Adamczyk, A. A., and Li, P., 1999, “A simplified approach to modeling exhaust system emissions: SIMTWC,” SAE, paper 1999-01-3476.
[14] Shen, H., Shamim, T., and Sengupta, S., 1999, “An investigation of catalytic converter performances during cold starts,” SAE, paper 1999-01-3473.
[15] Wurzenberger, J. C., Auzinger, G., Heinzle, R., and Wanker, R., 2006, “1D modeling of reactive fluid dynamics, cold start behavior of exhaust systems.” SAE, paper 2006-01-1544.
[16] Eriksson, L., 2002, “Mean value models for exhaust system temperatures,” SAE, paper 2002-01-0374. [17] Murrell, J. D., Lewis, G. M., Baker, D. M., and Assanis, D. N., 1997 “An early-design methodology for
predicting transient fuel economy and catalyst-out exhaust emissions,” SAE, paper 971838. [18] Brandt, E. P., Wang, Y., and Grizzle, J. W., 2000, “Dynamic modeling of a three-way catalyst for SI engine
exhaust emission control,” IEEE Transactions on Control Systems Technology, vol. 8, no. 5, pp. 767-776. [19] Sun, J., and Sivashankar, N., 1998, “Issues in cold start emission control for automotive IC engines,” Proc. of
the American Control Conference, Philadelphia, Pennsylvania. [20] Shaw, B. T., Fischer, G. D., and Hedrick, J. K., 2002, “A simplified cold-start catalyst thermal model to reduce
hydrocarbon emissions,” IFAC 15th Triennial World Congress, Barcelona, Spain. [21] Sanketi, P. R., Hedrick, J. K., and Kaga, T., 2005, “A simplified catalytic converter model for automotive cold-
start control applications,” Proc. of IMECE2005, Orlando, Florida. [22] Wilcutts, M. A., and Hedrick, J. K., 2007, “Model-based control for automotive cold start applications,” Vehicle
System Dynamics, vol. 45, no. 5, pp. 399-411. [23] Kolmanovsky, I., Nieuwstadt, M., and Sun, J., 1999, “Optimization of complex powertrain systems for fuel
economy and emissions,” IEEE Int. Conference on Control Applications, Hawaii. [24] Johnson, V., Wipke, K., and Rausen, D., 2000, “HEV control strategy for real-time optimization of fuel
economy and emissions,” SAE, paper 2000-01-1543. [25] Lukic, S. M., and Emadi, A., 2004, “Emissions and fuel economy trade-off for hybrid vehicles using fuzzy
logic,” Mathematics and computers in simulation, vol. 66 no. 2-3, pp. 155-172. [26] Tate, E., 2006, “Techniques for HEV Controller Synthesis,” Ph.D. dissertation, University of Michigan. [27] Rizzoni, G., Guezennec, Y., Brahma, A., Wei, X., and Miller, T., 2006, “VP-SIM: A unified approach to energy
and power flow modeling simulation and analysis of hybrid vehicles,” SAE, paper 2000-01-1565. [28] Rousseau, A., Pagerit, S., Monnet, G., and Feng, A., 2001, “The new PNGV System Analysis Toolkit PSAT
V4.1 – evolution and improvement,” SAE, paper 2001-01-2536. [29] Miller, J. M., 2004, Propulsion Systems for Hybrid Vehicles. The Institution of Engineering and Technology. [30] Onorati, A., D’Errico, G., and Ferrari, G., 2000, “1D fluid dynamic modeling of unsteady reacting flows in the
exhaust system with catalytic converter for SI engines,” SAE, paper 2000-01-0210.

ASME Journal of Dynamic Systems, Measurement and Control, accepted, April 2010 (DS-09-1340).
18
[31] Bellman, R., 1957, Dynamic Programming. New Jersey: Princeton University Press. [32] Bertsekas, D. P., 2005, Dynamic Programming and Optimal Control. 3rd ed., NH: Athena Scientific. [33] Kirk, D., 1970, Optimal Control Theory: An Introduction. New Jersey: Prentice-Hall. [34] Shaw, B. T., 2002, “Modeling and Control of Automotive Coldstart Hydrocarbon Emissions,” Ph.D.
dissertation, University of California, Berkeley.