Embed Size (px)
Citation preview

1
Supermarkets and planning regulation
Rachel Griffith and Heike Harmgart
Institute for Fiscal Studies and
Economics Department, University College London
Value-added per hour (US 1995$) in retail
0
5
10
15
20
25
1980
1990
2000
2003
UKUSFrance
Source: Groningen Growth and Development Centre, 60-Industry Database, October 2005, http://www.ggdc.net/,updated from O'Mahony and van Ark (2003)
Retail labour productivity has grown faster in US and France; retail sector accounts for large part of UK-US productivity gap

2
Reforms to planning regulation
• Regulations restrict development of new out of town stores
• Highlighted as a reason for poor productivity performance:McKinsey StudyBarker Review in land use regulation and productivity
• Why impact on productivity?– fewer new stores -> slower adoption of ICT and new technologies– more smaller stores -> more stores below minimum efficient scale – less entry -> less competition
Number of new stores opened by big four supermarkets (Adsa, Sainsbury, Safeway and Tesco)
0
20
40
60
80
100
120
140
1991
1992
1993
1994
1995
1996
1997
1998
1999
2000
2001
2002
2003
Num
ber o
f new
sto
res
open
ed in
Eng
land
Big stores Small stores
reform to planning regulations
3
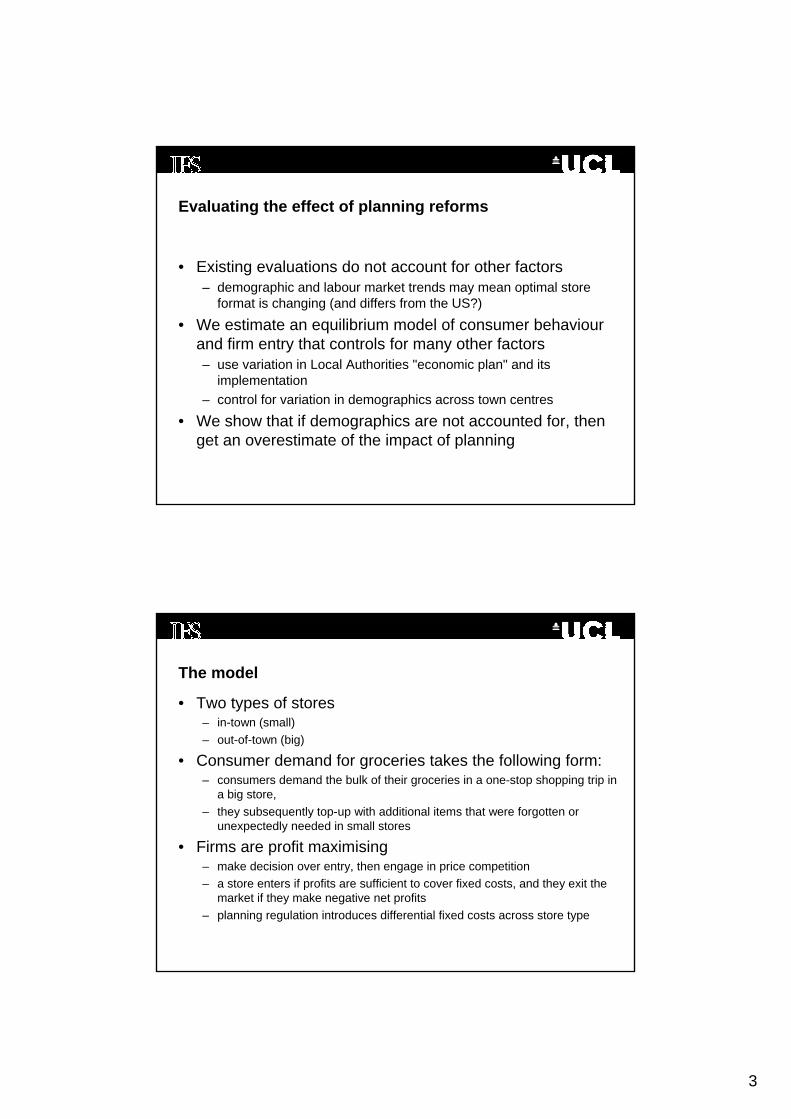
Evaluating the effect of planning reforms
• Existing evaluations do not account for other factors – demographic and labour market trends may mean optimal store
format is changing (and differs from the US?)
• We estimate an equilibrium model of consumer behaviour and firm entry that controls for many other factors– use variation in Local Authorities "economic plan" and its
implementation– control for variation in demographics across town centres
• We show that if demographics are not accounted for, then get an overestimate of the impact of planning
The model
• Two types of stores – in-town (small) – out-of-town (big)
• Consumer demand for groceries takes the following form:– consumers demand the bulk of their groceries in a one-stop shopping trip in
a big store,– they subsequently top-up with additional items that were forgotten or
unexpectedly needed in small stores
• Firms are profit maximising– make decision over entry, then engage in price competition– a store enters if profits are sufficient to cover fixed costs, and they exit the
market if they make negative net profits– planning regulation introduces differential fixed costs across store type

4
The model
profits of each firm when there are nfirms in the market
( ) jnfjfjfjfnfj RWY εγθβαλ ++++=Π
Populationfactors that affectvariable profits
factors that affectfixed costs
unobserved factorsthat affect profits
Data
• Supermarket location– Institute of Grocery Distributors (IGD)
• Geographic markets– ODPM town centres
• Planning applications– ODPM data on A1 and A3 applications
• Demographic Data– ONS and ODPM

5
Number of town centres with market configuration
845845Total2108 or more687606895
116106412410031042142592871151380
stores less than15,000 sq ft
Stores of 15,000 sq ftor moreMarket configuration
Selected coefficients in model for determinants of number of big stores
(0.2089)(0.2027)0.36760.5335% plan 97-01
(0.0014)-0.0024Retail rateable value
Fixed costs(0.0014)0.0038Office floorspace per hectare
(0.1632)0.9381Dist to nearest town centre
(0.0979)-0.2312Uemployment rate
Variable costs(0.0068)0.0377Population (1000s)
6
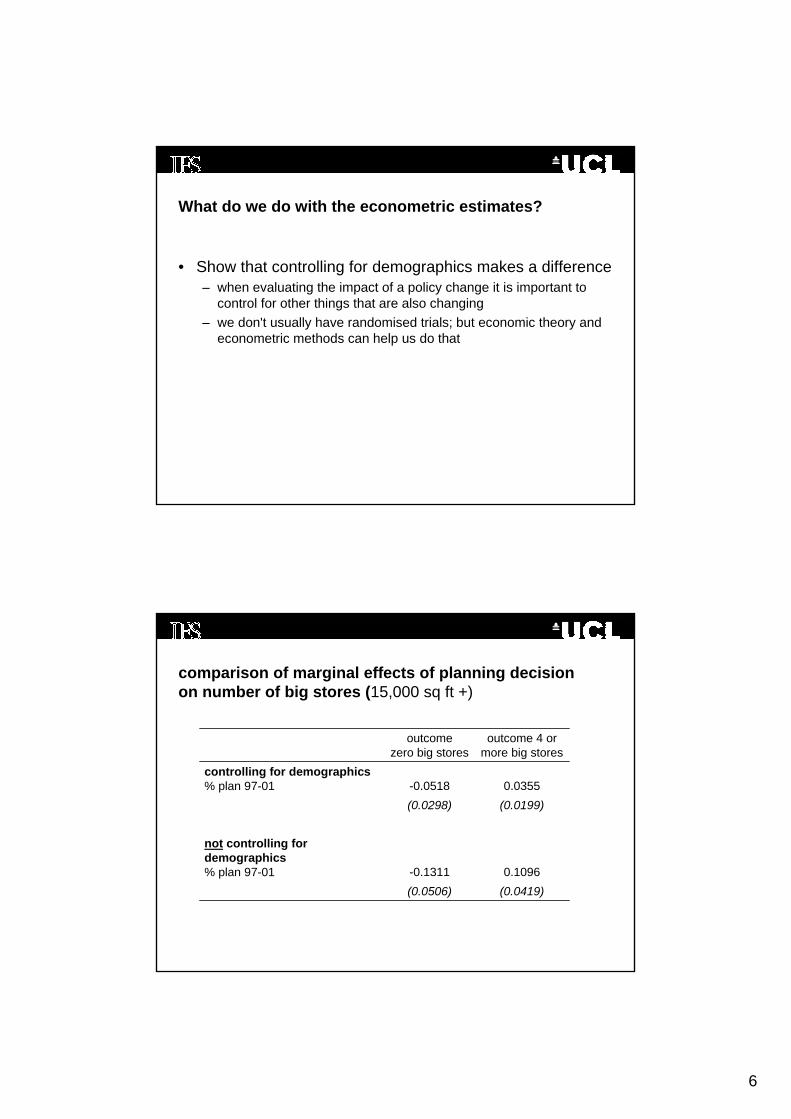
What do we do with the econometric estimates?
• Show that controlling for demographics makes a difference– when evaluating the impact of a policy change it is important to
control for other things that are also changing– we don't usually have randomised trials; but economic theory and
econometric methods can help us do that
comparison of marginal effects of planning decisionon number of big stores (15,000 sq ft +)
(0.0419)(0.0506)0.1096-0.1311
not controlling for demographics% plan 97-01
(0.0199)(0.0298)0.0355-0.0518
controlling for demographics% plan 97-01
outcome 4 or more big stores
outcomezero big stores
7
What do we do with the econometric estimates?
• Show that controlling for demographics makes a difference– when evaluating the impact of a policy change it is important to
control for other things that are also changing– we don't usually have randomised trials; but economic theory and
econometric methods can help us do that
• Use our model to quantify (some of) the costs of restrictive planning regulations
How can we quantify the costs?
• Concern about impact of planning regulations has been that they lead to inefficiencies and reduced competition– what impact on prices?
• Use data on a large number of food products purchased in different areas– how do prices of food in supermarkets differ when there is one big
store compared to two big stores, three big stores, ....

8
Estimated difference in price of food compared to a town centre with 1 big store
-1.88%-1.88%number of big stores=4+-1.73%-1.68%number of big stores=3-1.88%-1.70%number of big stores=2
median of 109 food categories
mean across 109food categories
Estimated difference in prices in town centres with 4 big stores compare to those with 1 big store

9
Predicted change in market structures if all existing planning applications were approved
0.014-0.001-0.005-0.0084+0.0110.004-0.001-0.01430.0080.0080.006-0.02120.0030.0060.012-0.0210 or 1
4+320 or 1Actual equilibrium structure
Predicted equilibrium structure
Combine information on (1) estimated differences in equilibrium number of stores with (2) estimated price differences
-0.03276%Total-0.01561%4+-0.02649%3-0.03744%2-0.03615%0 or 1
Mean % reduction in
price
Actual equilibrium structure

10
Combine that with average weekly houehold expenditure £41.90 per week (from Expenditure and Food Survey 2001/2002)
-1.37-0.03276%Total-0.65-0.01561%4+-1.11-0.02649%3-1.56-0.03744%2-1.51-0.03615%0 or 1
Mean reduction in pence on weekly household
food expenditure
Mean % reduction in
price
Actual equilibrium structure
Multiply that times the number of households in town centres with that equilibrium number of stores
-£210,187-1.37-0.03276%Total-£21,475-0.65-0.01561%4+-£26,029-1.11-0.02649%3-£67,326-1.56-0.03744%2-£95,357-1.51-0.03615%0 or 1
Total £ reduction in weekly household food expenditure
Mean reduction in pence on weekly household
food expenditure
Mean % reduction in
price
Actual equilibrium structure
The total savings in terms of weekly expenditure is £210,187Multiply that times 52 weeks to get an annual estimated increasein consumer surplus of £11m
11
Variation in prices directly linked to planning approvals
• Further corroborative evidence – we look directly at how prices of groceries vary across markets with
different levels of land use regulations
• We do this for the same 109 food categories– we find that the mean coefficient is -0.0454, the median is -0.0439
• What impact does this imply?– compare a market that sits at the 25th percentile in terms of the
rate of approval of land use applications (this is 0.75) – with one that sits at the 75th percentiles (this is 0.95) – we would see a difference in prices of around 1% on average
Policy implications
• Store size may be important determinant of output per worker, but are planning regulations the main driver of smaller store size?– Important to get the counterfactual right when evaluating policies – May still want to reform planning regulations, but don’t necessarily
expect big impact on productivity
• Using economic theory and econometric methods we can obtain estimates of the monetary costs of planning regulation, e.g. in terms of prices consumers pay– these need to be offset against the anticipated benefits, e.g. in
terms of reduced congestion etc.

12
Further work on retail food prices
• If firms very inefficient then would expect higher prices (driven by higher costs)
• Also, repeated competition investigations in food retail– would expect higher mark-ups
• Perception of high food prices by consumers
• How do prices of food compare between the UK and US?
-5%
0%
5%
10%
15%
20%
25%
30%
1975
1977
1979
1981
1983
1985
1987
1989
1991
1993
1995
1997
1999
2001
2003
2005
12-m
onth
infla
tion
rate
GB US
Food at home inflation rates (US and UK), 1975 – 2006
13
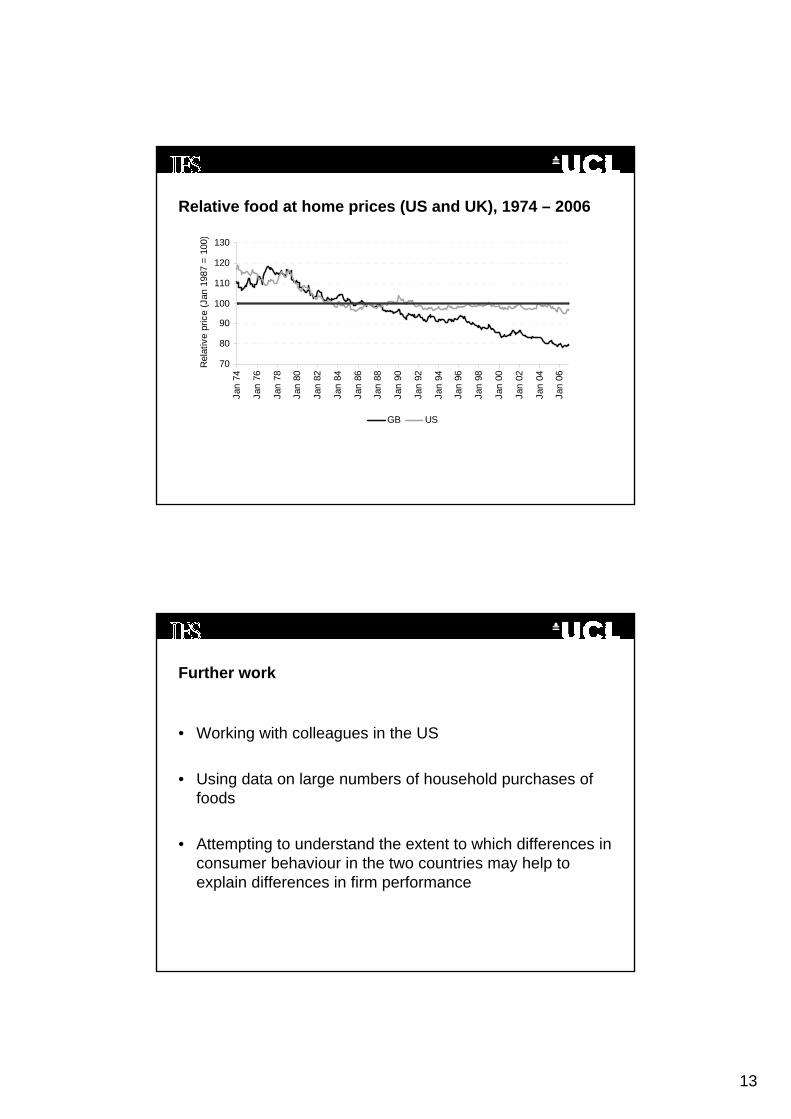
Relative food at home prices (US and UK), 1974 – 2006
70
80
90
100
110
120
130Ja
n 74
Jan
76
Jan
78
Jan
80
Jan
82
Jan
84
Jan
86
Jan
88
Jan
90
Jan
92
Jan
94
Jan
96
Jan
98
Jan
00
Jan
02
Jan
04
Jan
06
Rel
ativ
e pr
ice
(Jan
198
7 =
100 )
GB US
Further work
• Working with colleagues in the US
• Using data on large numbers of household purchases of foods
• Attempting to understand the extent to which differences in consumer behaviour in the two countries may help to explain differences in firm performance