Embed Size (px)
Citation preview
SUPERCRITICAL AQUEOUS SOLUTIONS
OF SODIUM CHLORIDE:
CLASSICAL INSIGHTS INTO NUCLEATION AND REACTIVITY
by
ISTOK GORAZD NAHTIGAL
A thesis submitted to the Department of Chemistry
In conformity with the requirements for
the degree of Master of Science
Queen’s University
Kingston, Ontario, Canada
(November, 2008)
Copyright © Istok Gorazd Nahtigal, 2008
ii
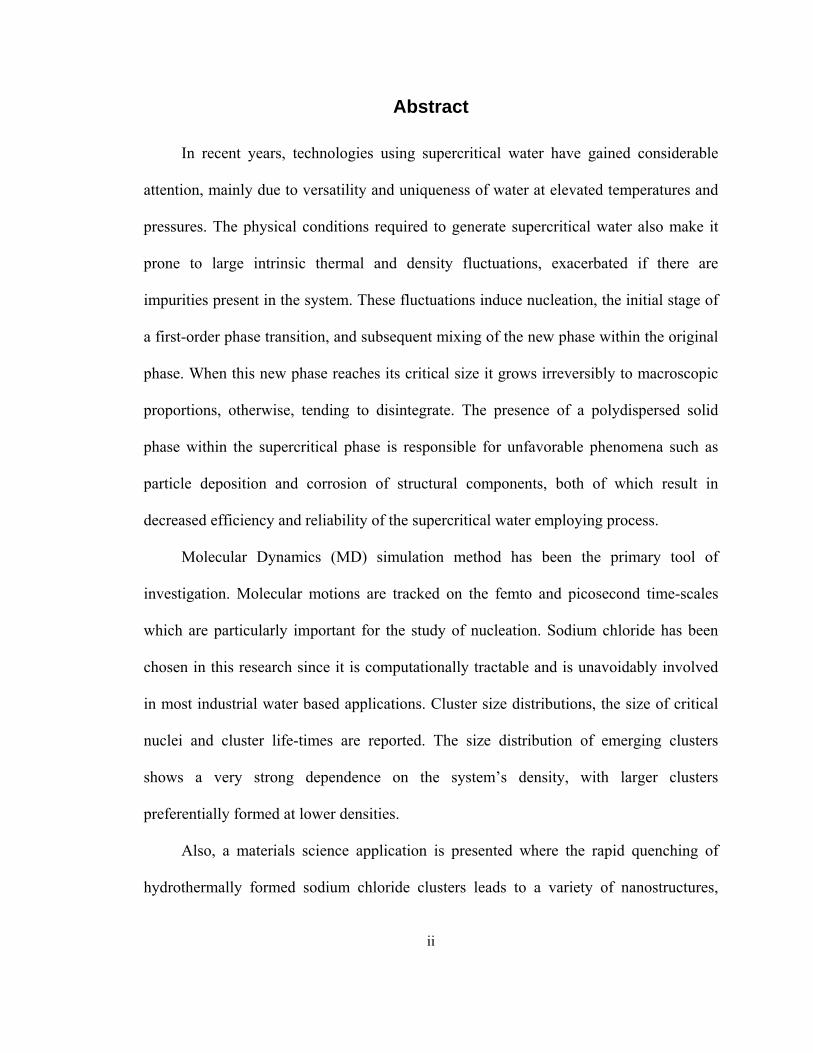
Abstract
In recent years, technologies using supercritical water have gained considerable
attention, mainly due to versatility and uniqueness of water at elevated temperatures and
pressures. The physical conditions required to generate supercritical water also make it
prone to large intrinsic thermal and density fluctuations, exacerbated if there are
impurities present in the system. These fluctuations induce nucleation, the initial stage of
a first-order phase transition, and subsequent mixing of the new phase within the original
phase. When this new phase reaches its critical size it grows irreversibly to macroscopic
proportions, otherwise, tending to disintegrate. The presence of a polydispersed solid
phase within the supercritical phase is responsible for unfavorable phenomena such as
particle deposition and corrosion of structural components, both of which result in
decreased efficiency and reliability of the supercritical water employing process.
Molecular Dynamics (MD) simulation method has been the primary tool of
investigation. Molecular motions are tracked on the femto and picosecond time-scales
which are particularly important for the study of nucleation. Sodium chloride has been
chosen in this research since it is computationally tractable and is unavoidably involved
in most industrial water based applications. Cluster size distributions, the size of critical
nuclei and cluster life-times are reported. The size distribution of emerging clusters
shows a very strong dependence on the system’s density, with larger clusters
preferentially formed at lower densities.
Also, a materials science application is presented where the rapid quenching of
hydrothermally formed sodium chloride clusters leads to a variety of nanostructures,
iii
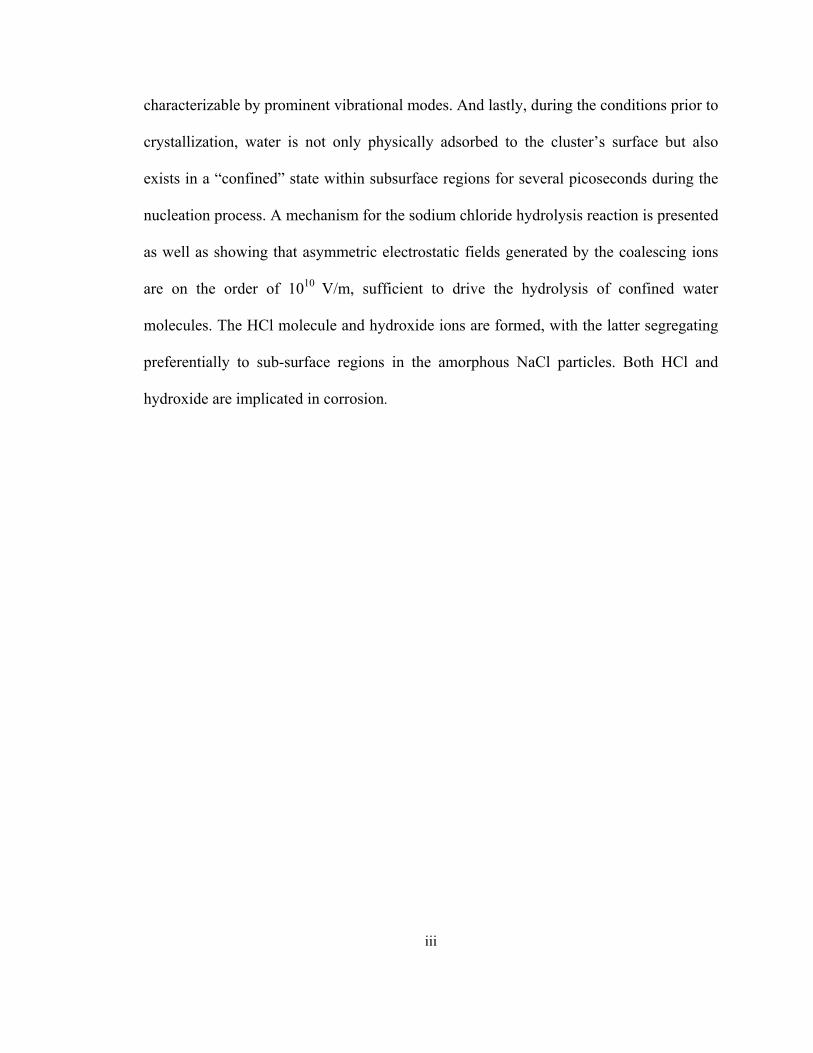
characterizable by prominent vibrational modes. And lastly, during the conditions prior to
crystallization, water is not only physically adsorbed to the cluster’s surface but also
exists in a “confined” state within subsurface regions for several picoseconds during the
nucleation process. A mechanism for the sodium chloride hydrolysis reaction is presented
as well as showing that asymmetric electrostatic fields generated by the coalescing ions
are on the order of 1010 V/m, sufficient to drive the hydrolysis of confined water
molecules. The HCl molecule and hydroxide ions are formed, with the latter segregating
preferentially to sub-surface regions in the amorphous NaCl particles. Both HCl and
hydroxide are implicated in corrosion.
iv
Acknowledgements
The completion of this work entirely on my own would have been a daunting task,
be it not for the support of a number of people, whom have contributed to the overall
production of this thesis, through numerous valuable discussions, administrative support,
and dedicated instruction. Properly thanking every person who has been a part of this
work would take many additional pages, and I hope that this small section will serve as
representative of my sincerest thanks to all those involved.
First and foremost, I would like to thank my advisor, Dr. Igor Svishchev, I greatly
appreciate the freedom he has given me to pursue this work in the ways I wanted and the
guidance he has provided along the way. From this experience I have gained confidence
in myself as a researcher.
Andriy Plugatyr, an invaluable co-worker and friend, was always ready and willing
to help get me acquainted with all aspects of activities in our lab, and of course I cannot
forget the debates or discussions about the wonders of science and research.
I must also thank, Alexander Zasetsky, our resident programming guru, whose
knowledge of FORTRAN and SharcNet much simplified the large scale MD simulations.
Additionally I would like to thank Professors Natalie Cann, Errol Lewars and Bill
Atkinson who served as members of my examination committee. I am pleased that all of
them agreed to help me with this work, and provide their time and advice.
Last but not least, I would like to thank my family and friends who realized in
advance that they would not understand my musings, yet were always willing to listen,
simply because it was me.

v
Dedicated to my father and friend, Jozef Nahtigal
Who always stimulated my mind, showed me the power of ingenuity, and that there is
always a solution to every problem.
vi
Statement of Originality
I hereby certify that all of the work described within this thesis is the original work
of the author. Any published (or unpublished) ideas and/or techniques from the work of
others are fully acknowledged in accordance with the standard referencing practices.
Istok Gorazd Nahtigal
November, 2008
vii
Table of Contents Abstract ............................................................................................................................... ii
Acknowledgements............................................................................................................ iv
Statement of Originality..................................................................................................... vi
Table of Contents.............................................................................................................. vii
List of Tables ..................................................................................................................... ix
List of Figures and Illustrations .......................................................................................... x
Chapter 1: Introduction ..................................................................................................... 1
1.0 Rationale ..................................................................................................................... 1 1.1 Objectives ................................................................................................................... 2 Chapter 2: Literature Review............................................................................................ 3
2.0 Supercritical Water and Solutions .............................................................................. 3 2.0.1 Phase Behavior................................................................................................. 3 2.0.2 Electrolyte Partitioning .................................................................................... 7 2.0.3 Electrochemical Processes ............................................................................... 7 2.1 Amorphous and Crystalline Sodium Chloride............................................................ 9 2.2 Molecular Modeling.................................................................................................. 10 2.2.1 Water Models................................................................................................. 11 2.2.2 Molecular Dynamics Simulation ................................................................... 13 2.2.3 Periodic Boundary Conditions....................................................................... 17 2.2.4 Long-Range Forces........................................................................................ 18 2.2.5 Radial Distribution Functions ........................................................................ 19 2.2.6 Time-Dependant Properties ........................................................................... 20 2.3 Applied Classical Nucleation Theory ....................................................................... 21 2.4 References for Chapter 2 .......................................................................................... 24 Chapter 3: Nucleation of nanoparticles in supercritical water........................................ 27
3.0 Introduction............................................................................................................... 27 3.1 Simulation details...................................................................................................... 29 3.2 Nucleation rate .......................................................................................................... 31 3.3 Size and structure...................................................................................................... 33 3.4 Results and discussion .............................................................................................. 35 3.5 Conclusions............................................................................................................... 48 3.6 References for Chapter 3 .......................................................................................... 49
viii
Chapter 4: Simulating hydrothermal synthesis of ionic nanoparticles ........................... 51
4.0 Introduction............................................................................................................... 51 4.1 Computational details ............................................................................................... 54 4.2 Results and discussion .............................................................................................. 56 4.2.1 Structure and binding energy ......................................................................... 56 4.2.2 Dynamics ....................................................................................................... 63 4.3 Concluding remarks .................................................................................................. 69 4.4 References for Chapter 4 .......................................................................................... 70 Chapter 5: Generation and integration of NaOH into NaCl clusters in supercritical water: Acid-base partioning.............................................................................................. 72 5.0 Introduction............................................................................................................... 72 5.1 Definition of reaction process................................................................................... 75 5.2 Kinetics and thermodynamics................................................................................... 77 5.3 Electrostatics ............................................................................................................. 79 5.4 Simulation details...................................................................................................... 84 5.5 Results and discussion .............................................................................................. 88 5.5.1 Solute-water pair distribution functions......................................................... 88 5.5.2 Distribution of species ................................................................................... 90 5.5.3 Electric fields involved in reaction ................................................................ 92 5.6 Conclusion ................................................................................................................ 96 5.7 References for Chapter 5 .......................................................................................... 98 Chapter 6: Summary and Future Direction................................................................... 102
6.0 Conclusions and future outlook .............................................................................. 102 Appendix A Glossary of terms and abbreviations .......................................................... 104
List of Tables Chapter 2: Literature Review Table 1. Parameters for common water models. Figure 4 is used as reference. Chapter 3: Nucleation of nanoparticles in supercritical water Table 1. The Lennard-Jones interaction parameters and site charges from Smith and
Dang. Table 2. Details of MD simulations and statistics for largest NaCl clusters. Table 3. Nucleation rates and critical nucleus sizes. Chapter 4: Simulating hydrothermal synthesis of ionic nanoparticles Table 1. Configurations and binding energies for NaCl clusters studied. Binding
energies are given in eV based on the Coulomb plus Lennard-Jones potential. White spheres represent sodium and dark are chloride.
Chapter 5: Generation and integration of NaOH into NaCl clusters in supercritical water: Acid-base partioning Table 1. Reported dipole moments and polarizabilities of species simulated. Table 2. Lennard-Jones interaction parameters and site charges used in simulations.
x
List of Figures and Illustrations Chapter 2: Literature Review Figure 1. The phase–boundary curves of water in a p – T diagram. The sublimation curve psubl and the several melting curves pm plotted in bold. The dashed line corresponds to the range of validity of the Wagner and PruB equation of state for water with regard to pressure.2 Figure 2. Pressure-Temperature projections of the phase diagrams for two types of
binary saltwater systems. (w), water; (s), solid; (cp), critical point; (tp), triple point; (V) vapour phase; (L), liquid phase; (S), solid phase; (E), eutectic point; (-----), critical curve (V=L); (……..), three phase curve (V+L+SS).
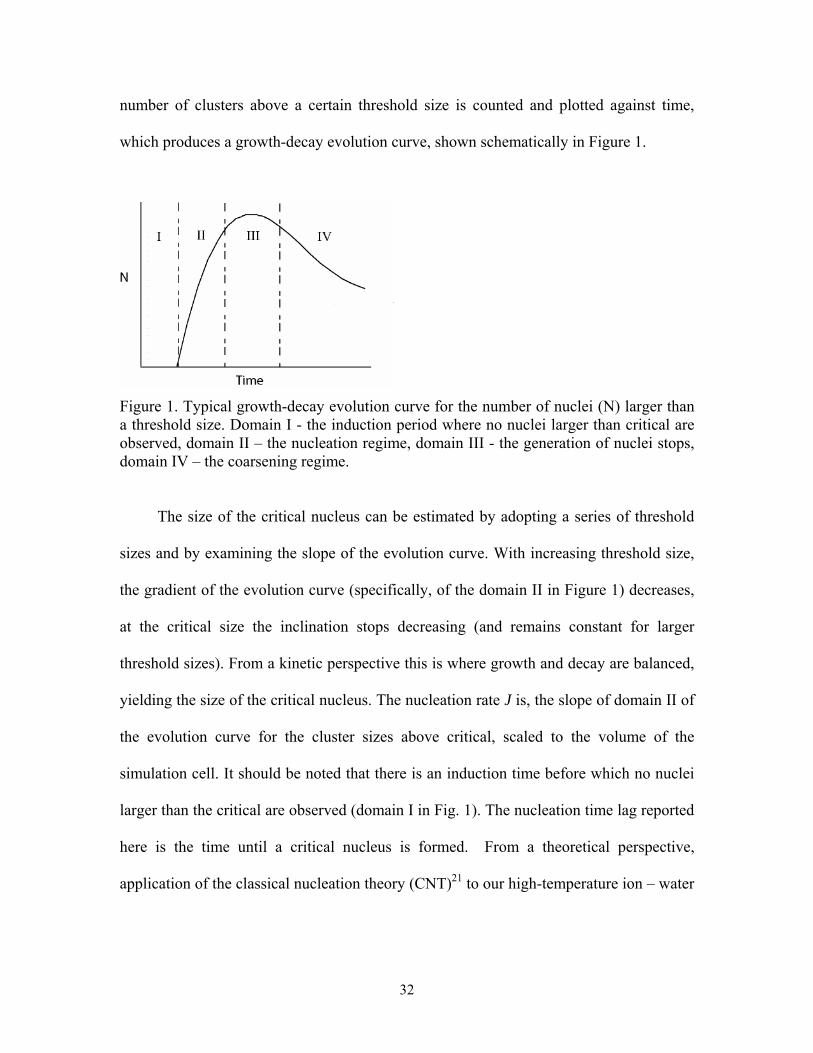
Figure 3. Temperature-composition phase diagram at 250 bar. Figure 4. Visual representation of common planar water model. Figure 5. Block diagram illustrating major sections of the molecular dynamics process. Figure 6. Cubic periodic boundary conditions with cutoff radius shown. Figure 7. Oxygen-oxygen RDF for water at ambient conditions. Chapter 3: Nucleation of nanoparticles in supercritical water Figure 1. Typical growth-decay evolution curve for the number of nuclei (N) larger
than a threshold size. Domain I - the induction period where no nuclei larger than critical are observed, domain II – the nucleation regime, domain III - the generation of nuclei stops, domain IV – the coarsening regime.
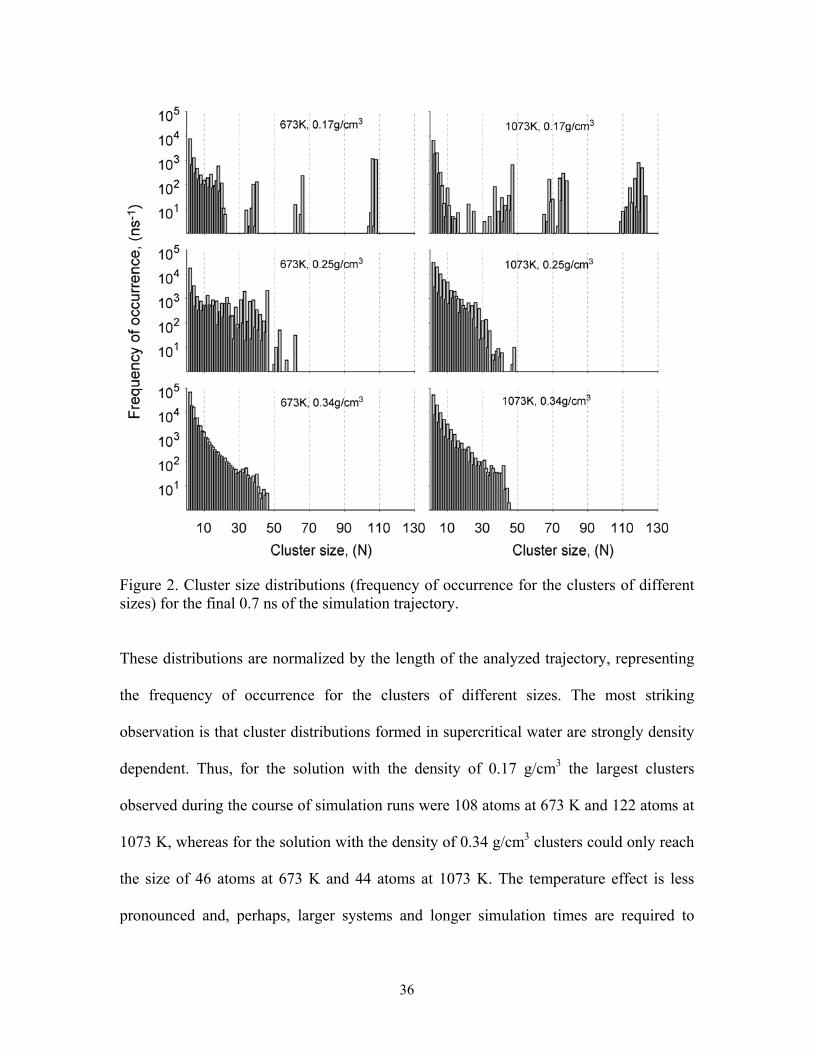
Figure 2. Cluster size distributions (frequency of occurrence for the clusters of different
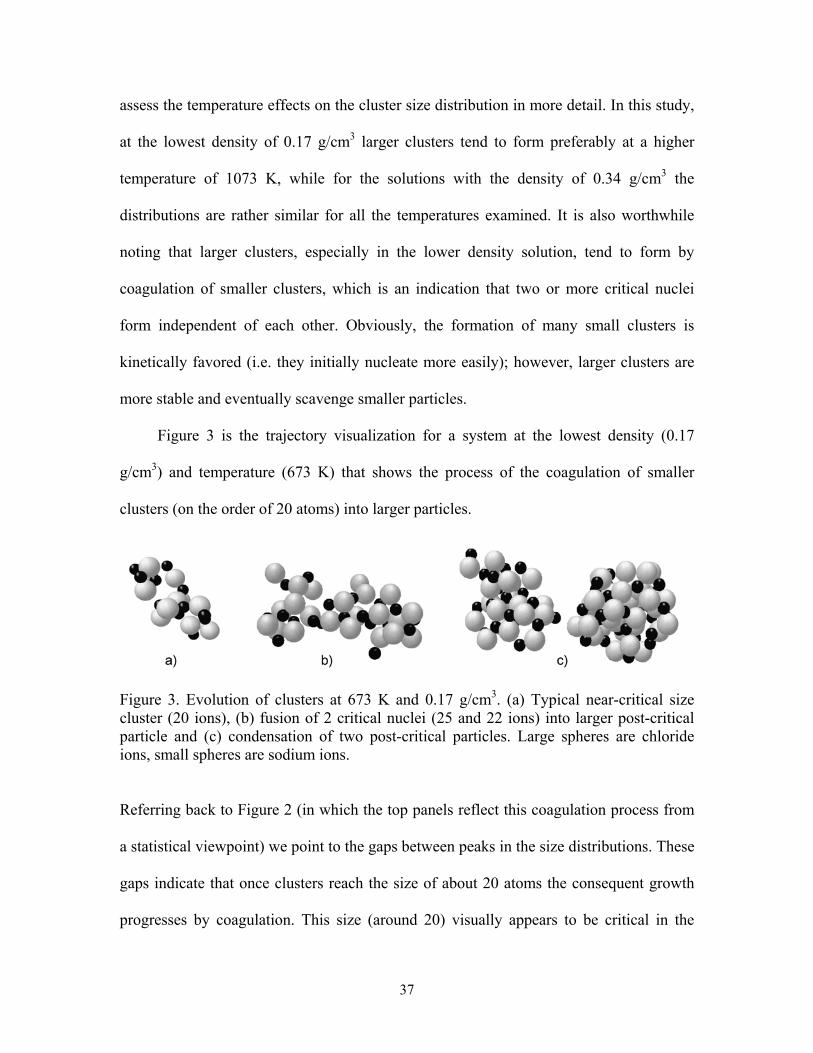
sizes) for the final 0.7 ns of the simulation trajectory. Figure 3. Evolution of clusters at 673 K and 0.17 g/cm3. (a) Typical near-critical size
cluster (20 ions), (b) fusion of 2 critical nuclei (25 and 22 ions) into larger post-critical particle and (c) condensation of two post-critical particles. Large spheres are chloride ions, small spheres are sodium ions.
Figure 4. Example of a post-critical amorphous NaCl particle composed of 112 atoms
formed by condensation of smaller clusters at 1073 K and 0.17 g/cm3.
xi
Figure 5. Time dependence of the concentration (N/V) of clusters larger than a threshold size (growth-decay evolution) in the 673 K and 0.17 g/cm3 system. Threshold sizes are (a) 16, (b) 20, (c) 22 and (d) 24 ions; each point represents block-average over 50 ps. The thin solid line reflects the slope of the growth curve. In (c) and (d) the nucleation rate stops decreasing, remaining constant at 1.19x1028 cm-3s-1 , for thresholds above N = 22.
Figure 6. Cluster size evolution with time at 673K for high (the black line) and low (the
gray line) densities. Figure 7. Life-times of NaCl clusters as a function of their size at 1073 K. Figure 8. Order parameter distribution N(q4) for NaCl clusters at 1073 K and 0.17
g/cm3; the histogram for crystalline NaCl sample is shown as a reference. Figure 9. Time evolution of principle components (eigenvalues) of moments of inertia
tensor for the largest cluster at the temperature of 673 K and density of 0.17 g/cm3.
Figure 10. Fusion event between 40 and 66 atom clusters at 673 K and density of 0.17
g/cm3. a) 0.54ns, b) 0.57ns and c) 0.60ns. Figure 11. Hydrodynamic radii at (a) 673 K and 0.17 g/cm3, (b) 673 K and 0.34 g/cm3.
Superimposed are logarithmic fitting curves of the form Rhyd = k1·Ln(N) + k2, where k1 and k2 are fitting parameters.
Figure 12. Gyration radii at (a) 673 K and 0.17 g/cm3, (b) 673 K and 0.34 g/cm3. Note
that the upper and lower data groupings in (b) give indication that clusters of near critical sizes may exist in two forms, diffuse and compact.
Chapter 4: Simulating hydrothermal synthesis of ionic nanoparticles Figure 1. Mean Na+ – Cl- separation in clusters studied. Figure 2. Mean cohesion energy as a function of cluster size. For comparison, the
cohesive energy of crystalline NaCl is 8eV. Figure 3. Fourteen ion cluster (Na7Cl7) showing tetrahedral (4 : 4) arrangement as seen
in the wurtzite structure. Can be also viewed as a two-component analog of the lonsdaleite structure, but without the inversion symmetry in the middle of the bond.
xii
Figure 4. Calculated density of vibrational states for the chain and ring forms of the dimer.
Figure 5. Density of vibrational states for clusters with similar shape profiles: rods. Figure 6. Density of vibrational states for clusters with similar shape profiles: plates. Figure 7. Density of vibrational states for clusters with similar shape profiles: terraced
plates. Figure 8. Cube and plate versions of the 64-ion cluster showing the presence of bulk-
like behaviour characterized by the preserved 200 cm-1 peak. Figure 9. Density of vibrational states for the NaCl dimer showing a pronounced
isotope effect. Dimer definitions are (Na 35Cl)2 as the pure and Na235Cl37Cl as
the isotopic. Chapter 5: Generation and integration of NaOH into NaCl clusters in supercritical water: Acid-base partioning Figure 1. Temperature dependence of the Gibbs energy of formation for the following
reactions: i) H+
(aq)+ Cl-(aq) HCl(g), ii) Na+
(aq)+ Cl-(aq) NaCl(s), iii) Na+
(aq)+ OH-(aq)
NaOH(s)
Figure 2. Ion – dipole interaction. The ions have a radial electric field E which is parallel to the dipole moment vectors.
Figure 3. Commonly occurring water-ion configurations which persist for 3 - 15ps
within core regions of the nucleating cluster. Chlorides shown are surface bound whereas the sodiums are subsurface. a) single component chain b) two component H-bonded chain. Arrangement seen in b) tends to be rare whereas a single water molecule between ions as in a) is very common during the condensation of small clusters.
Figure 4. Amorphous cluster with inset water molecule of interest. Moving from left to
right, Na+ …. OH2(sc) …. Cl- transforms to Na+ …. OH- …. HCl(g) where, blue is water, red is OH- and emerald green is HCl, with white representing hydrogens.
Figure 5. Na+ - OW radial distribution for sub and supercritical densities. The coordination numbers for water molecules around sodium ions are as follows: High density 4.8, low density 4.9, ambient 5.8.
xiii
Figure 6. Cl- - HW radial distribution for sub and supercritical density. The coordination numbers for water molecules around chloride ions are as follows: High density 5.0, low density 5.0, ambient 7.1.
Figure 7. OOH- - HW radial distribution for sub and supercritical density. The
coordination numbers for water molecules around hydroxide ion are as follows: High density 2.7, low density 2.5, ambient 3.0. Higher g(r) for lower density represents less interchanging of water molecules.
Figure 8. ClHCl - HW radial distribution for sub and supercritical density. Lower density
shows a minimum with 2 water molecules weakly associated to the chlorine of HCl.
Figure 9. Screen shots of simulation cell at 230ps at conditions 15MPa and 723K.
a) Simulation with 1 OH- ion (red) and 1 HCl molecules (emerald green). b) Simulation with 4 OH- ions and 4 HCl molecules. Points of interest common to both conditions are the lack of any association of HCl to the cluster, the amorphicity of the cluster containing subsurface hydroxide.
Figure 10. Amorphous cluster with hydroxide localized to subsurface regions. Figure 11. Cluster showing localized water binding to sodium sites and surface
hydroxide. Figure 12. Cluster represented by spheres (left) and electrostatic potential contour plot of
same cluster (right). Plots of this type allow the visualization of the collective electrostatic contours of the cluster as a whole as well as obtaining values for the electrostatic potential between sites. Note regions of delocalized charge as result of asymmetric geometry and symmetric crystal-like regions. Red regions represent areas of positive charge whereas green regions are negative charge.
1
Chapter 1
Introduction
Of all known substances, water in all its forms is without a doubt the most
important substance in our existence. It is the essence of life as we know it, playing an
integral role in atmospheric, biological, geological and technological fields. Water and
aqueous solutions under the supercritical condition has become the subject of much
research and speculation. Despite their importance, relatively few people in the world
study supercritical water systems experimentally and theoretically, with the subject still
very much at the infancy stage. In part, the lack of understanding of the underlying
molecular interactions and dynamics are due to the fact that experiments in supercritical
water are often difficult and costly to perform and the “need to know” about these
systems in the past was not at the level it is today. Computational techniques have
become an important resource in trying to learn more about water under these conditions
and are the leading source of information in this field today.
1.0 Rationale
With the advent of the Generation IV nuclear reactor development program being
established, an essential amount of study will need to be focused on the identification of
suitable water chemistry that will minimize corrosion rates and stress corrosion cracking
(SCC), as well as minimize product deposition on in-core and out-core surfaces. Areas of
specific importance include the transport and deposition of corrosion products, an
2
improved understanding of hydrolysis reactions under supercritical water conditions and
the effect of hydrolysis products on corrosion and SCC. The common aspect leading to
the above issues is the fact that pure, impurity-free water does not exist. According to any
environmental chemistry textbook, the most common impurities present in natural waters
are dissolved mineral salts, one of which being sodium chloride. The focus of the present
work will aim to address and understand some of the properties of sodium chloride-water
solutions at elevated temperatures and pressures.
1.1 Objectives
Based on the present need to fill the information gap in these research areas, the
focus of this work has two main objectives. First is to study the formation of critical
nuclei in supercritical aqueous solutions of NaCl. Critical nuclei act as the progenitors to
larger clusters and nanoparticles which agglomerate forming deleterious mineral deposits.
Nanoparticle sizes and associated nucleation rates will be determined.
The second objective is to explore the salt driven hydrolysis reaction, which leads
to the generation of caustics involved in corrosion.
3
Chapter 2
Literature Review 2.0 Supercritical water and solutions In view of the multitude of applications and basic importance of water, there is still
much to be learnt about this substance. Interest in high temperature, high pressure water
has increased considerably in the past few decades, largely due to the increasing number
of technologically important applications, primarily being power generation1. Water is a
protic solvent exhibiting atypical properties which can be attributed to the extensive
collection of hydrogen bonds. Density, viscosity and dielectric permittivity all change
dramatically with temperature and pressure2. Transitions of water among vapor, liquid
and solid phases is qualitatively familiar to most everyone, however the supercritical
phase is less well-known.
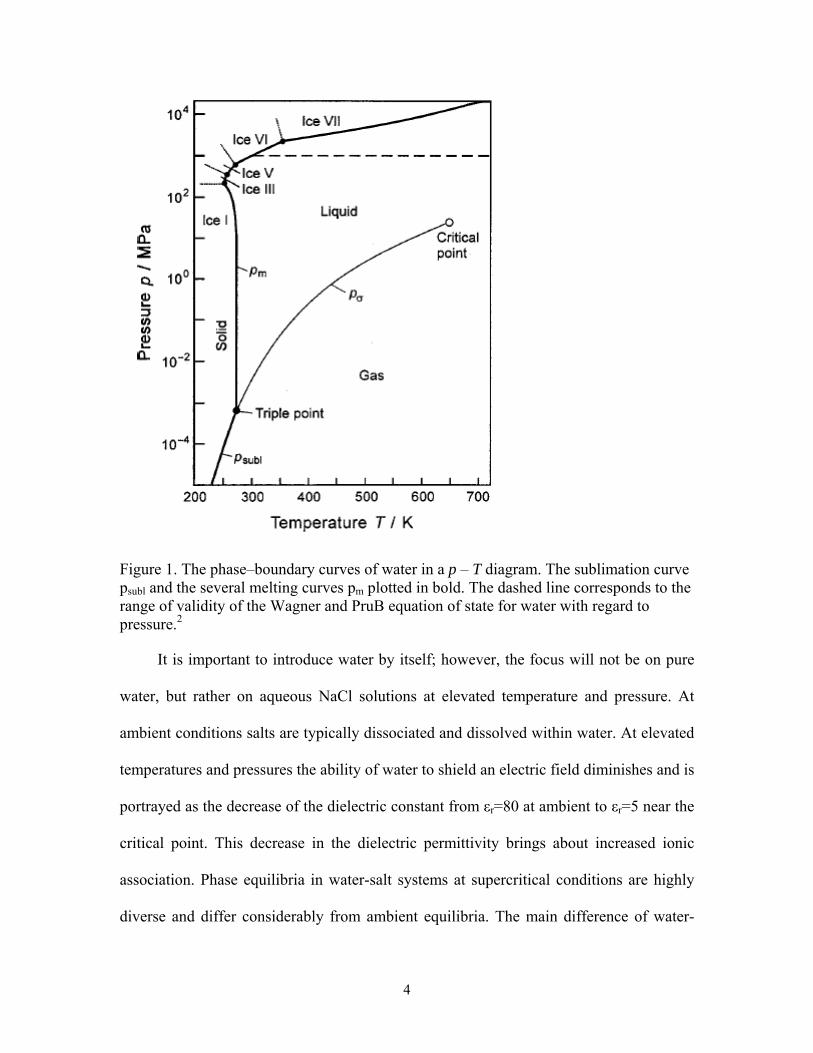
2.0.1 Phase Behavior Supercritical water is defined to exist above its critical parameters (TC = 647.096 K,
ρC = 0.322 g/cm3 and PC = 22.064 MPa)2, where it is possible to go from liquid-like
densities to vapor-like densities without passing through a phase transition; as such the
supercritical phase presents itself as an attractive medium for chemical reactions and
separation processes. Figure 1 shows the phase diagram of water, with the supercritical
region beginning at the termination of the liquid-vapor coexistence line, labeled critical
point.
4
Figure 1. The phase–boundary curves of water in a p – T diagram. The sublimation curve psubl and the several melting curves pm plotted in bold. The dashed line corresponds to the range of validity of the Wagner and PruB equation of state for water with regard to pressure.2 It is important to introduce water by itself; however, the focus will not be on pure
water, but rather on aqueous NaCl solutions at elevated temperature and pressure. At
ambient conditions salts are typically dissociated and dissolved within water. At elevated
temperatures and pressures the ability of water to shield an electric field diminishes and is
portrayed as the decrease of the dielectric constant from εr=80 at ambient to εr=5 near the
critical point. This decrease in the dielectric permittivity brings about increased ionic
association. Phase equilibria in water-salt systems at supercritical conditions are highly
diverse and differ considerably from ambient equilibria. The main difference of water-
5
salt systems is the ability of salt solids, due to their refractory nature, to participate in the
fluid equilibria at sub and supercritical conditions; as such, the phase behavior is
complicated by two-phase solid-liquid and vapor-liquid regions, three phase equilibrium
points and critical solution points3.
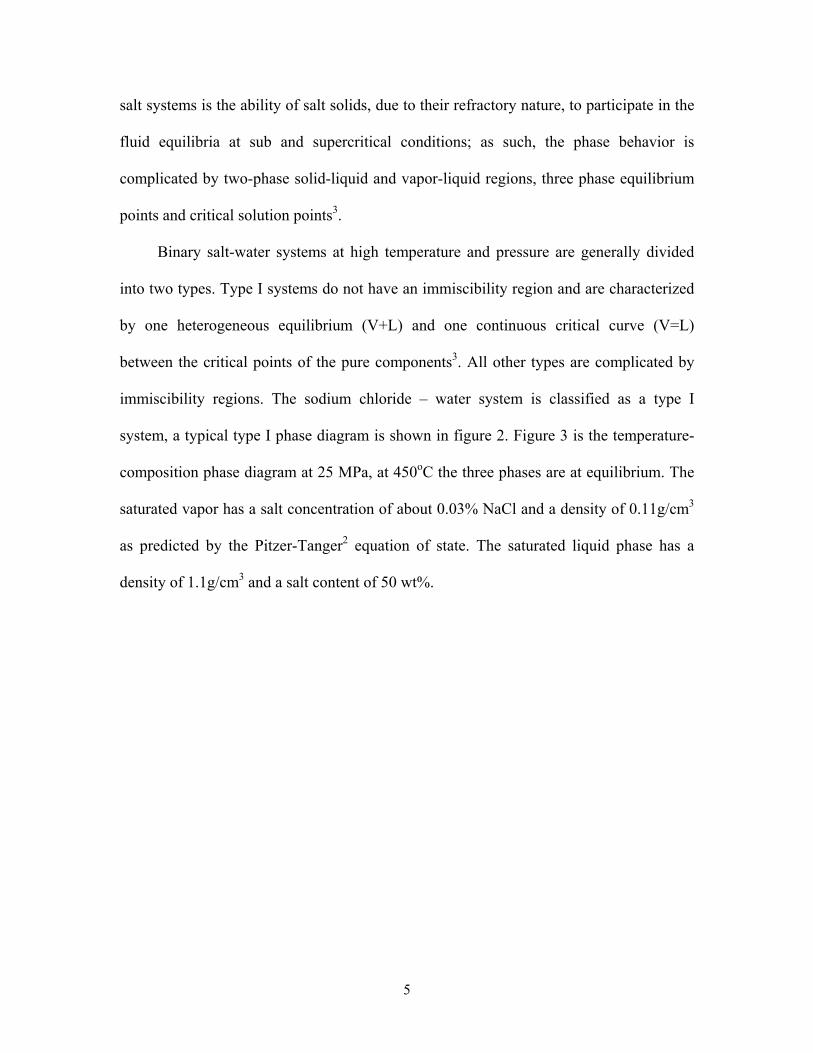
Binary salt-water systems at high temperature and pressure are generally divided
into two types. Type I systems do not have an immiscibility region and are characterized
by one heterogeneous equilibrium (V+L) and one continuous critical curve (V=L)
between the critical points of the pure components3. All other types are complicated by
immiscibility regions. The sodium chloride – water system is classified as a type I
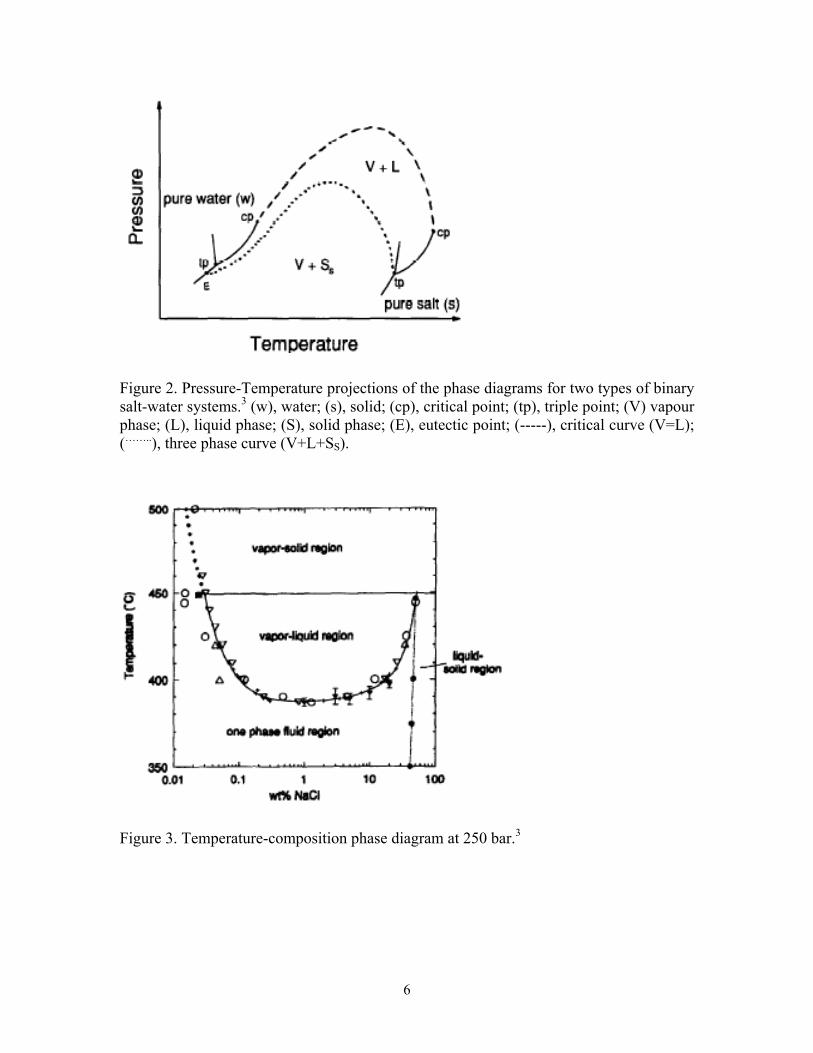
system, a typical type I phase diagram is shown in figure 2. Figure 3 is the temperature-
composition phase diagram at 25 MPa, at 450oC the three phases are at equilibrium. The
saturated vapor has a salt concentration of about 0.03% NaCl and a density of 0.11g/cm3
as predicted by the Pitzer-Tanger2 equation of state. The saturated liquid phase has a
density of 1.1g/cm3 and a salt content of 50 wt%.
6
Figure 2. Pressure-Temperature projections of the phase diagrams for two types of binary salt-water systems.3 (w), water; (s), solid; (cp), critical point; (tp), triple point; (V) vapour phase; (L), liquid phase; (S), solid phase; (E), eutectic point; (-----), critical curve (V=L); (……..), three phase curve (V+L+SS).
Figure 3. Temperature-composition phase diagram at 250 bar.3
7
2.0.2 Electrolyte Partitioning
The supercritical phase is defined by a wide density range; therefore the
partitioning of solutes in these densities is of fundamental and practical interest. Attempts
to understand partitioning have been made from classical theoretical standpoints, but the
difficulty in obtaining consistent, reliable experimental data has hindered advances in
theory. Measurements from solubility, conductivity and mass spectrometric methods
have been made on a limited number of systems with the results often being inconsistent.
Experimental studies by Armellini and Tester3, 4, Pitzer5, 6, Hanf and Sole7, and Barnett
and Landman8 have shown that HCl and NaOH are also present in high temperature NaCl
solutions, which further complicate the phase behavior. The presence of the highly
volatile HCl leads to higher chloride levels at gas-like densities leading to the partitioning
of acidic and basic species. The behavior of these species in supercritical water is a strong
function of phase density; consequently, fluctuations in density stimulate nucleation,
precipitation, hydrolysis and corrosion events.
2.03 Electrochemical Processes Understanding the physics and chemistry of high temperature aqueous solutions
represents a new frontier in electrochemical studies, both of which are technically
challenging and technologically important. Studies on electrochemical processes
occurring at hydrothermal conditions are driven by the growing need to understand
corrosion at these conditions. Electrochemical reactions in aqueous solutions involve two
main processes; mass transport of ions and charge transfers. Charge transfer depends on
the electric potential between high and low density regions in the supercritical phase (ie.
8
between particle surface and the solution). The main property in an electrochemical
system is the electrochemical potential. The electrochemical potential is best described as
a thermodynamic measure which combines the energy stored in the form of chemical
potential and electrostatics. It is expressed as αµ i~ and defined as; ααα µµ EFziii ⋅⋅+=~ ,
where αµi and iz are the chemical potential and charge of species i, respectively; F is
Faraday’s constant and αE is the inner electric potential in phase α. αE is not a
measurable quantity, but the difference between the inner electric potentials of two
electrically conducting phases can be measured by electrochemical experiments. The zeta
potential a key parameter of the electric double layer and part of the inner electric
potential can be obtained from electrokinetic studies of solid/liquid interfaces9.
Salt particles formed at supercritical states are nanoscopic, therefore possessing
high surface to volume ratios. Heterogeneous surfaces are known to be electrically active,
possessing the potential to drive interfacial oxidation/reduction reactions. Understanding
the kinetics of electrochemical reactions requires measurements of the appropriate kinetic
parameters which are still lacking for hydrothermal solutions. Experiments are
complicated by the lack of electrochemical sensors that can reliably operate at these
extreme conditions. Steady state cyclic voltammetry has been applied to near
supercritical conditions by Liu et al10. It is well known that electrochemical systems
exhibit random fluctuations (electrochemical noise) in the current and voltage readings
around their open circuit values. A new technique termed electrochemical noise analysis,
developed by Zhou et al.11 has shown that these noise signals contain valuable kinetic
information. This method uniquely lends itself the measurement of electrochemical
kinetics and corrosion in sub and supercritical systems, as it requires no reference
9
electrode and only two identical electrodes of the material under study. In regard to
electrochemical measurements in general, any of the established electrochemical analysis
techniques may be applied to studies at high temperatures and pressures, the problem lies
not with the methods but rather the lack of reliable electrodes and buffer solutions that
can be used at these conditions.
2.1 Amorphous and Crystalline NaCl The bulk crystal structure of NaCl is well established; in brief, it forms crystals
with cubic symmetry12. This same basic structure is found in many other binary minerals,
and is known as the rock-salt structure. It consists of two mutually interpenetrating face-
centered cubic (fcc) lattices held together by electrostatic forces. The common crystalline
form of this salt is rather uninteresting from a materials science viewpoint; however,
imperfect crystals are of interest13. Imperfect crystals possess a defect in the form of a
vacancy, interstitial foreign atom or a dislocation. The common theme to these defects is
the effect of disorder they impose13. I find it useful to introduce these general concepts
since they will recur as themes within the context of this work.
Topological disorder is caused by vacancies and dislocations, the extent of this
disorder can be highly variable. Amorphous or vitrified materials are characterized as
ones with little to no short-range order and complete lack of long-range order.
Amorphous materials are by no means “new”, the most familiar amorphous material
being common window glass. Amorphous materials exhibit properties which are unique
to them and are not shared by their crystalline counterparts13. The term “glass” is a
specific form of amorphous phase which exhibits an abrupt change in derivative
10
thermodynamic properties (ie. heat capacity, thermal expansivity) from crystal-like to
liquid-like values with change of temperature13. This term is only mentioned as a primer
for potential future results, where glass-like NaCl may be synthesized by compression of
NaCl nanoparticles of mixed morphologies.
Experimental results on the structure of NaCl crystallites or amorphous particles by
neutron or X-ray diffraction to my knowledge do not exist yet. There have been results
from mass spectrometric methods providing sizes and compositions of charged
particles14, 15. Largely, data comes from quantum mechanical16, 17 and classical
calculations18-21. Both of these computational methods indicate that these particles have
unique vibrational signatures, thus, probing these vibrational modes using infrared or
microwave spectroscopy16 may provide an indirect method to determine their structure.
2.2 Molecular Modeling Water from natural sources is an essential working component in many systems,
power generation being one. Water used in this application exists under extreme
conditions, making physical experiments difficult and costly to perform. Computational
techniques have become an important tool for researchers exploring the physico-chemical
properties of water at elevated temperatures and pressures. Molecular Dynamics
simulation is a method which can provide molecular level information concerning
thermodynamic, kinetic and structural properties of water and its solutions at these
conditions. The following sections shall introduce some of the commonly used water
models and the basic details of the molecular modeling process.
11
2.2.1 Water Models Computer simulation provides experimental / theoretical insight into the
interactions between atom and / or molecules. Molecular models which reliably and
accurately reproduce physical properties at specific thermodynamic state points are
essential, in order for the information to be valid and representative. Molecular models
tend to be semi-empirical, in other words created based on experimental data. Among the
most commonly used effective potentials are the SPC/E22 and TIP4P23, both of which are
rigid, non-polarizable models with three to four fixed-atom sites and a Lennard-Jones
interaction site. The SPC/E model, despite its simplicity is probably the most successful
non-polarizable model used for high temperature water studies. Its ability to reproduce
many thermodynamic properties, as well as structure and dynamics of real water over a
wide range of thermodynamic states has given it its status. The condensed phase tends to
be poorly described by rigid, non-polarizable models due to their inability to account for
electronic polarization, which plays an important role in the physico-chemical processes
in water. The most successful polarizable model is the PPC model24. It maintains the
simplicity of the classic point charge models but it accounts for the polarization in terms
of varying the magnitude of the charge on its three sites and the position of the negative
charge. Unlike other polarizable models, which typically perform 3-10 times slower than
SPC/E, PPC model is only 1.5 times slower25.
The simplest models have three interaction sites, corresponding to the three atoms
of the water molecule. Each atom is assigned a point charge, and the oxygen atom also
gets Lennard-Jones parameters. The 3-site models are very popular for Molecular
Dynamics simulations because of their simplicity and computational efficiency. Most
12
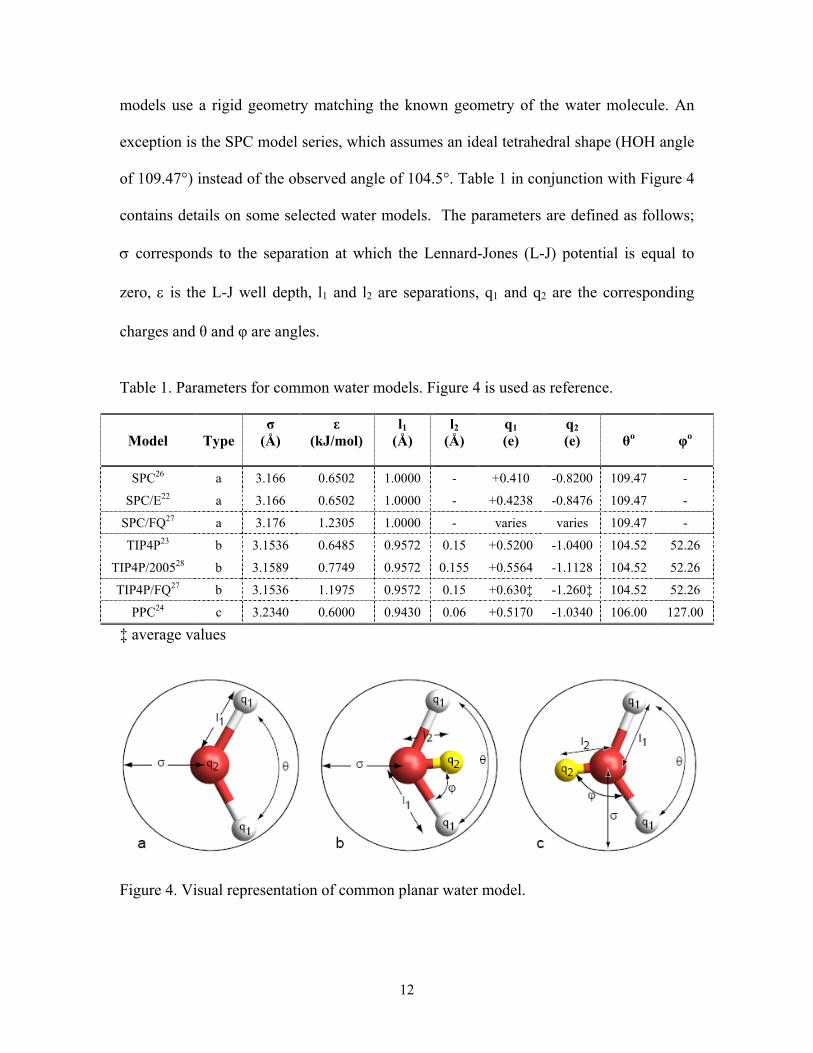
models use a rigid geometry matching the known geometry of the water molecule. An
exception is the SPC model series, which assumes an ideal tetrahedral shape (HOH angle
of 109.47°) instead of the observed angle of 104.5°. Table 1 in conjunction with Figure 4
contains details on some selected water models. The parameters are defined as follows;
σ corresponds to the separation at which the Lennard-Jones (L-J) potential is equal to
zero, ε is the L-J well depth, l1 and l2 are separations, q1 and q2 are the corresponding
charges and θ and φ are angles.
Table 1. Parameters for common water models. Figure 4 is used as reference.
Model
Type
σ (Å)
ε (kJ/mol)
l1 (Å)
l2 (Å)
q1 (e)
q2 (e)
θo
φo
SPC26 a 3.166 0.6502 1.0000 - +0.410 -0.8200 109.47 -
SPC/E22 a 3.166 0.6502 1.0000 - +0.4238 -0.8476 109.47 -
SPC/FQ27 a 3.176 1.2305 1.0000 - varies varies 109.47 -
TIP4P23 b 3.1536 0.6485 0.9572 0.15 +0.5200 -1.0400 104.52 52.26
TIP4P/200528 b 3.1589 0.7749 0.9572 0.155 +0.5564 -1.1128 104.52 52.26
TIP4P/FQ27 b 3.1536 1.1975 0.9572 0.15 +0.630‡ -1.260‡ 104.52 52.26
PPC24 c 3.2340 0.6000 0.9430 0.06 +0.5170 -1.0340 106.00 127.00
‡ average values
Figure 4. Visual representation of common planar water model.
13
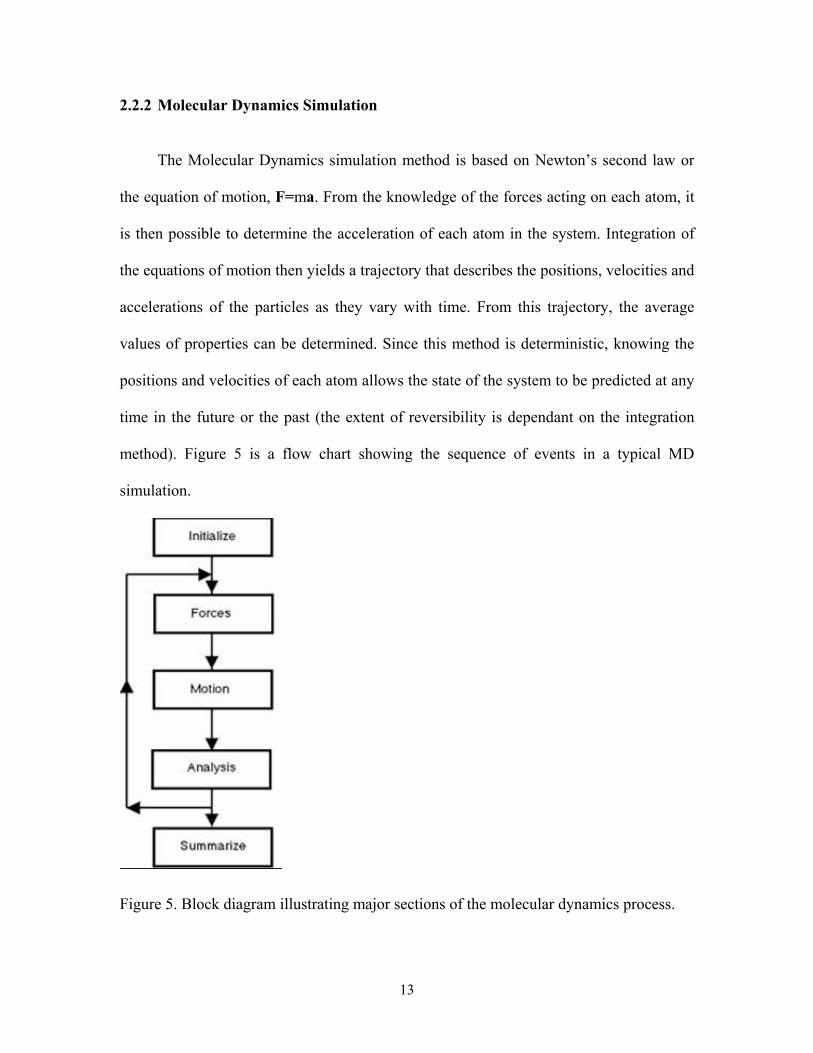
2.2.2 Molecular Dynamics Simulation
The Molecular Dynamics simulation method is based on Newton’s second law or
the equation of motion, F=ma. From the knowledge of the forces acting on each atom, it
is then possible to determine the acceleration of each atom in the system. Integration of
the equations of motion then yields a trajectory that describes the positions, velocities and
accelerations of the particles as they vary with time. From this trajectory, the average
values of properties can be determined. Since this method is deterministic, knowing the
positions and velocities of each atom allows the state of the system to be predicted at any
time in the future or the past (the extent of reversibility is dependant on the integration
method). Figure 5 is a flow chart showing the sequence of events in a typical MD
simulation.
Figure 5. Block diagram illustrating major sections of the molecular dynamics process.
14
Molecular Dynamics simulations can be time consuming and computationally
expensive, however, computers which are faster, less expensive and compact are enabling
simulations to be run up to the several nanosecond time scales. Presented below is a brief
review of the molecular dynamics process, omitting many of the detailed equations and
concepts29. Since this work does not specifically concern the development of molecular
dynamics techniques, I refer the interested reader to; Computer Simulation of Liquids29,
by M.P. Allen and D.J. Tildesley, which provides superb in-depth details.
Newton’s equation of motion is given by iii amF vv= , which can be expanded to
2
2
dtxd
mdtvd
mamF ii
iiii
vvvv
⋅=⋅=⋅= , (1)
where Fv
, im and ixv are the force, mass and position of particle i, respectively. The force
can also be expressed as the gradient of the potential energy: UF ii −∇=v
. Combining
these two equations then yields
2
2
dtxd
mU iii
v
=∇− , (2)
where U is the potential energy of the system. The potential energy term U is expressed
as a combination of electrostatic and non-covalent pair interactions. Electrostatic
interactions come from the interactions between electric charges:
( )ij
jiij
C
rqq
rU04πε
= , (3)
15
where iq and jq are the charges on sites i and j, ijr represents the separation between the
sites and 0ε is the permittivity of free space. The non-covalent interactions are expressed
as a Lennard-Jones potential which describes the attractive and repulsive forces acting
between molecules:
( )⎥⎥
⎦
⎤
⎢⎢
⎣
⎡
⎟⎟⎠
⎞⎜⎜⎝
⎛−⎟
⎟⎠
⎞⎜⎜⎝
⎛=
612
4ij
ij
ij
ijijij
LJ
rrrU
σσε , (4)
where ijσ is the separation at which 0=LJU , ijr is the distance between two atoms and
ijε is the depth of the potential energy well. Collectively the total potential energy can be
represented by the following equation:
( ) ( )( ) ∑∑∑∑>> ⎟⎟
⎟
⎠
⎞
⎜⎜⎜
⎝
⎛+
⎥⎥
⎦
⎤
⎢⎢
⎣
⎡
⎟⎟⎠
⎞⎜⎜⎝
⎛−⎟
⎟⎠
⎞⎜⎜⎝
⎛=+=
i ij ij
ji
ij
ij
ij
ijij
i ijij
Cij
LJ
rqq
rrrUrUU
0
612
44
πεσσ
ε (5)
It is important to note that the terms ijσ and ijε represent the interaction between unlike
atoms in different molecules29. In this study they are approximated using the Lorentz -
Berthelot mixing rules:
( )jiij σσσ +=21 and )( jjiiij εεε = (6)
In order to calculate a trajectory, one only requires the initial positions of the atoms,
an initial distribution of velocities and the acceleration, which is determined by the
gradient of the potential energy function. The positions and the velocities at time zero are
used to determine the positions and velocities at subsequent times29. The initial positions
for crystalline materials can be obtained from experimental structures, such as x-ray and
16
neutron diffraction or by NMR spectroscopy30, whereas fluid structures are typically
constructed by randomizing the starting positions.
The initial distribution of velocities are usually determined from a random
distribution with the magnitudes conforming to the required temperature and corrected so
there is no net momentum in any one direction. The velocities are often chosen randomly
from a Maxwell-Boltzmann or Gaussian distribution at a given temperature29. The
temperature can be calculated from the velocities using the relation
∑=
=N
i i
i
B mp
NkT
1
2
31 (7)
where N is the number of atoms in the system31.
The equations of motion are time dependant; consequently, they require integration
algorithms. These algorithms all assume that the position and dynamical properties
(velocity, acceleration, jerk, etc.) can be approximated as a Taylor expansion31. The
Verlet algorithm29, 32 is a widely used method which uses the positions and accelerations
at time t, and positions from the previous step to directly calculate new positions at
dtt + . A number of other integration algorithms exist with the Gear predictor-corrector
method29 being one example. This integration scheme is typically applied when rotational
motions are involved, due to the more convenient solving of differential equations. The
general scheme of the predictor-corrector algorithm is summarized as follows:
i) predict the positions, velocities, accelerations, etc., at a time t+dt, using the current
values of these quantities.
ii) evaluate the forces, and hence accelerations from the new positions.
iii) correct the predicted positions, velocities, accelerations, etc., using the new
positions.
17
iv) calculate any variables of interest, energy, order parameters etc., before returning to
i) for the next step in the loop.
2.2.3 Periodic Boundary Conditions The correct treatment of the boundary and its effect are crucial to simulation
methods because it permits the use of relatively small number of particles to calculate
macroscopic properties. Simulations require the presence of a potential wall in order to
prevent the species from infinitely drifting apart. The existence of this potential wall
causes the forces acting on the species near the wall of the simulation cell (surface) to be
much different than the ones found near the center of the cell (bulk). Surface effects can
be compensated for by introducing periodic boundary conditions, where the main cell
typically a cube, is surrounded by periodic images of the original cell29. As a molecule
leaves the central box it is simultaneously replaced by its periodic image which enters
from the opposite direction. This ensures that each species is surrounded by
approximately the same number of species throughout the simulation. At some distance
the intermolecular interaction of two non-electrostatically interacting particles is very
small and can be neglected, due to this fact only particles that fall within a certain
distance are taken into account during the calculation, this distance is typically set at half
the cell length (see figure 6) which prevents the counting of a species and its virtual at the same
time29.
18
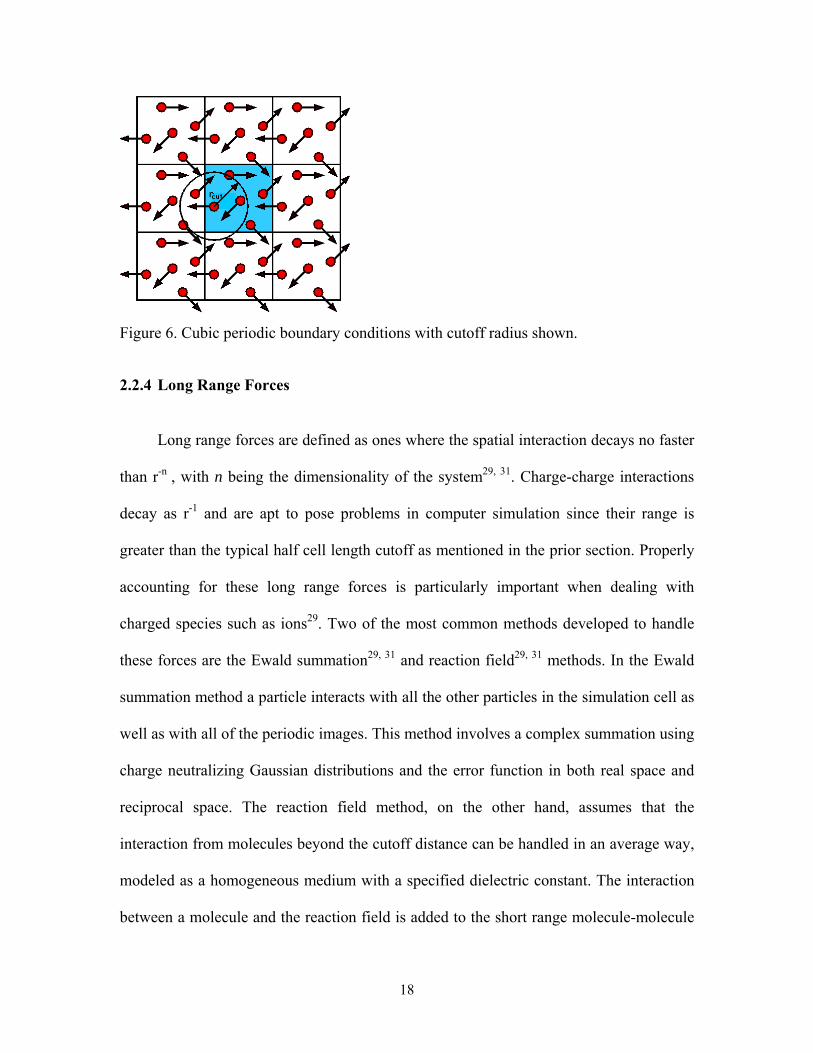
Figure 6. Cubic periodic boundary conditions with cutoff radius shown. 2.2.4 Long Range Forces Long range forces are defined as ones where the spatial interaction decays no faster
than r-n , with n being the dimensionality of the system29, 31. Charge-charge interactions
decay as r-1 and are apt to pose problems in computer simulation since their range is
greater than the typical half cell length cutoff as mentioned in the prior section. Properly
accounting for these long range forces is particularly important when dealing with
charged species such as ions29. Two of the most common methods developed to handle
these forces are the Ewald summation29, 31 and reaction field29, 31 methods. In the Ewald
summation method a particle interacts with all the other particles in the simulation cell as
well as with all of the periodic images. This method involves a complex summation using
charge neutralizing Gaussian distributions and the error function in both real space and
reciprocal space. The reaction field method, on the other hand, assumes that the
interaction from molecules beyond the cutoff distance can be handled in an average way,
modeled as a homogeneous medium with a specified dielectric constant. The interaction
between a molecule and the reaction field is added to the short range molecule-molecule
19
interaction. This method is typically applied to simulations with large cutoffs and/or
systems with few ions.
2.2.5 Radial Distribution Functions The radial distribution function (RDF) is an example of a pair correlation function
g(r), which on average describes how species in the system are radially spaced around
one another29. In a crystal, the RDF has an infinite number of sharp peaks and troughs,
whose separations and heights are characteristic of the lattice structure31. The RDF of a
liquid is intermediate between a solid and a gas, with a smaller number of peaks which
decay to unity at large distances29. The RDF is formally defined as:
( ) ( )⟩−∑∑⟨=≠
ijiji
rrNVrg δ2 (8)
where V is the volume of the sphere, N the number of species in the volume and δ is the
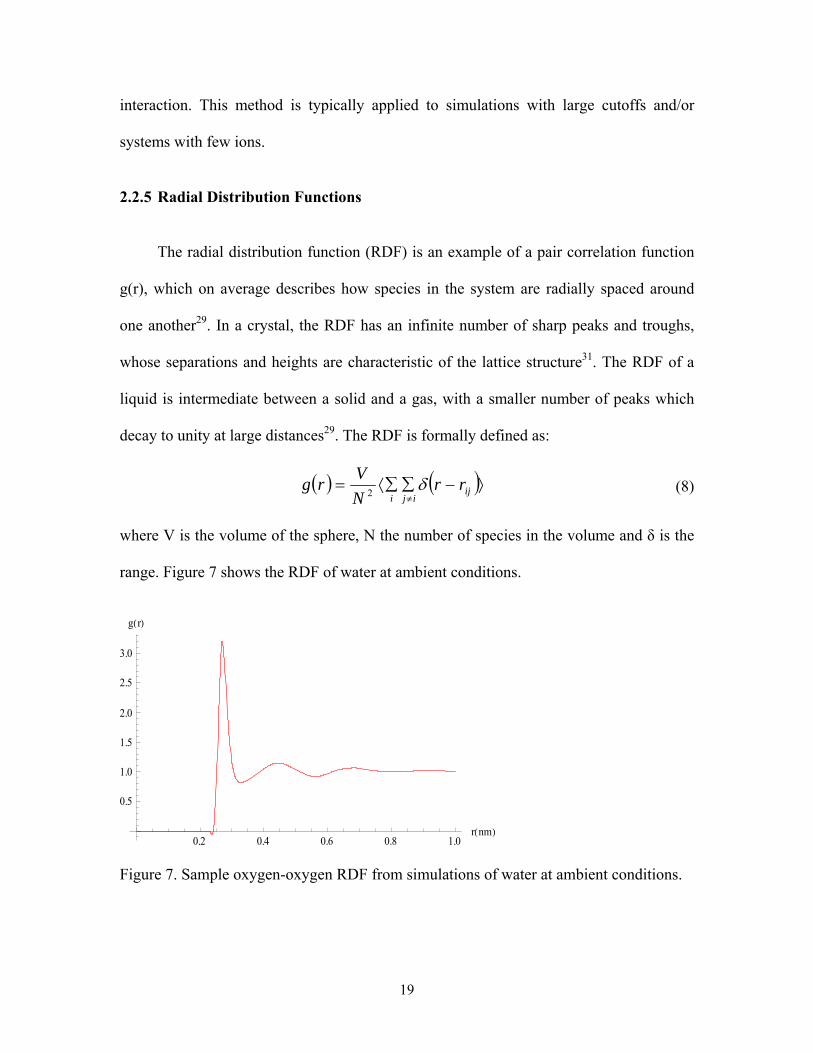
range. Figure 7 shows the RDF of water at ambient conditions.
0.2 0.4 0.6 0.8 1.0rHnmL
0.5
1.0
1.5
2.0
2.5
3.0
gHrL
Figure 7. Sample oxygen-oxygen RDF from simulations of water at ambient conditions.
20
Integration of the RDF yields a numerical average of neighboring species, termed
the coordination number29. Furthermore, radial distribution functions are also related to
the structure factor measured by neutron or X-ray scattering experiments. The relation
being through a spatial Fourier transform of the RDF29, 31.
2.2.6 Time-Dependant Properties Molecular dynamics generates configurations of the system that are connected
temporally; therefore a MD simulation can be used to calculate time-dependent
properties. Time-dependent properties calculated as time correlation functions enable the
value of some property at some instant to be correlated with the value of the same or
another value at a later time29, 31. The most common correlation function is the velocity
autocorrelation function (VACF) whose value indicates how closely the velocity at time t
is correlated with the initial velocity, providing information on the dynamical processes
occurring in a system29. The velocity autocorrelation coefficient can be calculated by
averaging over the number of species in the simulation and normalized with the initial
value, taking the general form:
( ) ( ) ( )( ) ( )∑
= ⋅
⋅=
N
i ii
iiVV vv
vtvN
tc1 00
01 (9)
Autocorrelation functions (ACF) are not limited to linear velocity; other common
ACFs include angular velocity, dipole moment and current to name a few. These
functions similar to RDF can also be Fourier transformed to yield various types of
spectra29, 31.
21
2.3 Applied Classical Nucleation Theory The modern theory of homogeneous nucleation is due to the pioneering work by
Volmer and Weber (1926), Farkas (1927), Becker and Döring (1935), Zeldovich (1943),
and others. Presented here is a brief and simplified version of homogeneous nucleation
theory and its inadequacy when applied to multi-component systems.
Within the framework of the classical nucleation theory (CNT), the total Gibbs free
energy of the formation of a condensed (new phase) nucleus is a combination of the
energy “gain” (the new phase is energetically favorable) in transforming a unit of volume
of the system to the new phase and the energy “loss” due to the formation of an
interface33-36. For a multi-component system, with a number of simplifications imposed,
the expression for the formation free energy of nuclei reads
σµµ AnGn
i
vi
lii +−=∆ ∑
=1)( , (1)
where σ is the surface tension of the vapor-liquid (old phase-new phase) interface, liµ is
the chemical potential of the component i in the condensed (new) phase, viµ is the
chemical potential in vapor (old phase), ni is the number of molecules of the component i,
and A is the surface area of the particle (which is equal to 24 Rπ in the case of spherical
particles). The set of corresponding Gibbs-Thompson equations, which also define the
size of critical nuclei in multi-component systems, can be written as36, 37
02
)( =+−R
ivi
li
συµµ , (2)
where iυ is the partial molecular volume of component i, and R is the particle radius
(nuclei are assumed to have spherical shape). In theory, once the size of critical nucleus
22
(radius R*) is determined, one can compare the experimental value for the nucleation rate
with that obtained from the following equation
)/*exp( TkGKJ b∆= , (3)
where the value *G∆ corresponds to the free energy of formation of the critical nucleus
R*, bk is the Boltzmann constant, T is temperature, and K is the pre-exponential factor,
which depends on specific characteristics of molecular systems under consideration. The
difficulties in applying the CNT approach to a real multi-component system can be
expressed by listing the simplifications36 that are used in deriving equations 1 through 3:
(a) two subsystems (i.e. vapor (old) and condensed (new) phase) are uniform; in other
words, they are a uniform mixture of the components in both the old and new phase; (b)
this same assumption of uniformity applies to the interface; (c) the interface is considered
to be infinitely sharp; (d) condensed particles have spherical shape; and (e) σ is taken to
be the surface tension value for planar interfaces.
It is therefore not surprising that the estimates obtained by CNT can differ by many
orders of magnitude from those obtained experimentally. The deviations may very likely
arise from the inhomogeneity of the formed condensed (new) phases. It is believed, that
the differences result primarily from an inadequate account of the interface effect. Real
interfaces may have a complex density profile, strikingly non-uniform structure and
composition, and finite thickness. All these restrictions make it extremely difficult to
quantitatively describe the nucleation process on a CNT based approach alone.
Analytical approximations for nucleation based on the kinetics rather than the
Gibbsian thermodynamics have also been developed and considerable progress has been
made in this direction38, 39. Despite that, the derivation of an accurate analytical model for
23
the nucleation rate in multi-component systems based on kinetic approaches is far from
being completed. For example, after rather complicated algebra, the authors of the work39
have derived an analytical expression for the steady-state rate of binary nucleation. The
quantitative estimates of nucleation parameters, however, require extensive calculations
using density functional theory (DFT), which is necessary to obtain “real density
profiles” for components at the interface.
Alternatively, computer simulation methods can be used to study nucleation in
multi-component systems. These techniques are free of many of the above mentioned
shortages, of course not being free of their own. Being based on model potentials that
effectively (in comparison to an “exact” description of quantum mechanics) approximate
intermolecular interactions, the methods enable an accurate description and/or prediction
of macroscopic properties for many-body systems. In particular, by using the MD
simulation method one can look at the process of nucleus formation and growth in
complex molecular systems, in “real” time, as well as examine their size, shape, and
composition. The main limitation of Molecular Dynamics simulations stems from
relatively short length and time scales. The system size and time typically accessible by
the Molecular Dynamics method at present is on the order of several thousand molecules
over the time period of 1 to 100 nanoseconds. This is, nevertheless, sufficient for the
present work, where the aim has been to probe the process of NaCl cluster formation at
high temperature and pressure, where the value of nucleation rate is significantly higher.
24
2.4 References
(1) Bellows, J. C. 14th International Conference on the Properties of Water and Steam. Journal of Solution Chemistry 2003, 32, 612-617.
(2) Wagner, W.; Pruβ, A. The IAPWS Formulation 1995 for the Thermodynamic Properties of Ordinary Water Substance for General and Scientific use. J. Phys. Chem. Ref. Data 2002, 31, 387-535.
(3) Armellini, F. J.; Tester, J. W. Experimental Methods for Studying Salt Nucleation and Growth from Supercritical Water. The Journal of Supercritical Fluids, 1991, 4, 254-264.
(4) Armellini, F. J.; Tester, J. W. Solubility of Sodium Chloride and Sulfate in Sub- and Supercritical Water Vapor from 450–550°C and 100–250 Bar. Fluid Phase Equilibria, 1993, 84, 123-142.
(5) Pitzer, K. S. Sodium Chloride Vapor at very High Temperatures: Linear Polymers are Important. J. Chem. Phys. 1996, 104, 6724-6729.
(6) Pitzer, K. S. Aqueous Electrolytes at Near-Critical and Supercritical Temperatures. Int. J. Thermophys. 1998, 19, 355-366.
(7) Hanf N.W.; Sole M.J. High Temperature Hydrolysis of Sodium Chloride. Trans. Faraday Soc. 1970, 66, 3065.
(8) Barnett, R. N.; Landman, U. Water Adsorption and Reactions on Small Sodium Chloride Clusters. J. Phys. Chem. 1996, 100, 13950-13958.
(9) Palmer, D. A.; Fernández-Prini, R.; Harvey, A. H., Eds.; In Aqueous Systems at Elevated Temperatures and Pressures; Elsevier Academic Press: London, UK, 2004;
(10) Liu, C. y.; Snyder, S. R.; Bard, A. J. Electrochemistry in Near-Critical and Supercritical Fluids. 9. Improved Apparatus for Water Systems (23-385 °C). The Oxidation of Hydroquinone and Iodide. J Phys Chem. B 1997, 101, 1180-1185.
(11) Zhou, X. Y.; Lvov, S. N.; Wei, X. J.; Benning, L. G.; Macdonald, D. D. Quantitative Evaluation of General Corrosion of Type 304 Stainless Steel in Subcritical and Supercritical Aqueous Solutions Via Electrochemical Noise Analysis. Corros. Sci. 2002, 44, 841-860.
(12) Wells, A. F. In Structural Inorganic Chemistry; Oxford University Press: London, UK, 1962;
(13) Elliot, S. R. In Physics of Amorphous Materials; John Wiley & Sons Inc.: 1990
25
(14) Zhang, D.; Cooks, R. G. Doubly Charged Cluster Ions [(NaCl)m(Na)2]2+: Magic Numbers, Dissociation, and Structure. International Journal of Mass Spectrometry 2000, 195-196, 667-684.
(15) Pflaum, R.; Sattler, K.; Recknagel, E. Multiphoton Stimulated Desorption: The Magic Numbers of Neutral Sodium Chloride Clusters. Chemical Physics Letters 1987, 138, 8-12.
(16) McCaffrey, P. D.; Mawhorter, R. J.; Turner, A. R.; Brain, P. T.; Rankin, D. W. H. Accurate Equilibrium Structures obtained from Gas-Phase Electron Diffraction Data: Sodium Chloride. J. Phys. Chem. A 2007, 111, 6103-6114.
(17) Ayuela, A.; López, J. M.; Alonso, J. A.; Luaña, V. Theoretical Study of NaCl Clusters. Zeitschrift für Physik D Atoms, Molecules and Clusters 1993, 26, 213-215.
(18) Martin, T. P. NaCl Polymers. J. Chem. Phys. 1977, 67, 5207-5212.
(19) Martin, T. P. Interaction of Finite NaCl Crystals with Infrared Radiation. Phys. Rev. B 1970, 1, 3480-3488.
(20) Phillips, N. G.; Conover, C. W. S.; Bloomfield, L. A. Calculations of the Binding Energies and Structures of Sodium Chloride Clusters and Cluster Ions. J. Chem. Phys. 1991, 94, 4980-4987.
(21) Doye, J. P. K.; Wales, D. J. Structural Transitions and Global Minima of Sodium Chloride Clusters. Phys. Rev. B 1999, 59, 2292-2300.
(22) Berendsen, H. J. C.; Grigera, J. R.; Straatsma, T. P. The Missing Term in Effective Pair Potentials. J. Phys. Chem. 1987, 91, 6269-6271.
(23) Jorgensen, W. L.; Chandrasekhar, J.; Madura, J. D.; Impey, R. W.; Klein, M. L. Comparison of Simple Potential Functions for Simulating Liquid Water. J. Chem. Phys. 1983, 79, 926-935.
(24) Kusalik, P. G.; Svishchev, I. M. The Spatial Structure in Liquid Water. Science 1994, 265, 1219-1221.
(25) Svishchev, I. M.; Kusalik, P. G.; Wang, J.; Boyd, R. J. Polarizable Point-Charge Model for Water: Results Under Normal and Extreme Conditions. J. Chem. Phys. 1996, 105, 4742-4750
(26) Berendsen, H. J. C.; Postma, J. P. M.; van Gunsteren, W. F.; Hermans, J. In Intermolecular Forces; Pullman, B., Ed.; Reidel, Dordrecht, Holland: 1981;
(27) Rick, S. W.; Stuart, S. J.; Berne, B. J. Dynamical Fluctuating Charge Force Fields: Application to Liquid Water. J. Chem. Phys. 1994, 101, 6141-6156
26
(28) Abascal, J. L. F.; Vega, C. A General Purpose Model for the Condensed Phases of Water: TIP4P/2005. J. Chem. Phys. 2005, 123, 234505
(29) Allen, M. P.; Tildesley, D. J. In Computer Simulation of Liquids; Clarendon Press New York, NY, USA: 1989;
(30) Frenkel, D.; Smit, B. In Understanding Molecular Simulation: From Algorithms to Applications; Academic Press: 2002;
(31) Leach, A. R. In Molecular Modeling: Principles and Applications; Longman: Essex, England, 1996;
(32) Verlet, L. Computer Experiments on Classical Fluids. I. Thermodynamical Properties of Lennard-Jones Molecules. Phys. Rev. 1967, 159, 98
(33) Nishioka, K.; Kusaka, I. Thermodynamic Formulas of Liquid Phase Nucleation from Vapor in Multi-component Systems. J. Chem. Phys. 1992, 96, 5370-5376
(34) Oxtoby, D. W.; Kashchiev, D. A General Relation between the Nucleation Work and the Size of the Nucleus in Multi-component Nucleation. J. Chem. Phys. 1994, 100, 7665-7671
(35) Laaksonen, A.; McGraw, R.; Vehkamäki, H. Liquid-Drop Formalism and Free- Energy Surfaces in Binary Homogeneous Nucleation Theory. J. Chem. Phys. 1999, 111, 2019-2027
(36) Vehkamäki, H. In Classical Nucleation Theory in Multi-component Systems; Springer: Berlin, Germany, 2006;
(37) Wilemski, G. Composition of the Critical Nucleus in Multi-component Vapor Nucleation. J. Chem. Phys. 1984, 80, 1370-1372
(38) Nowakowski, B.; Ruckenstein, E. A Kinetic Treatment of Heterogeneous Nucleation. J. Phys. Chem. 1992, 96, 2313-2316
(39) Djikaev, Y.; Ruckenstein, E. Kinetic Theory of Binary Nucleation Based on a First Passage Time Analysis. J. Chem. Phys. 2006, 124, 124521
27
Chapter 3
Nucleation of NaCl nanoparticles in supercritical water 1
3.0 Introduction
High-temperature water is used in many traditional and modern technologies, such
as power generation, hazardous waste extraction and destruction, materials processing,
etc. One of the most serious problems in hydrothermal applications is the formation of
solid salt particles from metastable steam and supercritical solutions. The thermodynamic
conditions in the moisture transition region in power turbines are able to activate the
mechanism of nucleation and growth of particles composed of concentrated liquid salt
solutions.1, 2 These salt solutions provide the basis for nucleation of solid salt particles,
which in turn, promote a significantly higher frequency of corrosion events within this
region. The processes in supercritical water oxidation (SCWO) reactors are also affected
by the presence of such solid particles that may salt out from a solution in the
supercritical region and thus have serious ramifications on the process efficiency and
safety.3 The equilibrium phase diagram for NaCl - H2O system is thought to be well
studied4-6 however, the formation of solid salt particles is thought to be a kinetic process
taking place in a metastable state of a system and is as yet not completely understood.
First-order phase transitions such as crystallization proceed through the nucleation
and growth of critical embryos (by monomer deposition and cluster-cluster
coalescence).7, 8 The nucleation process requires some impetus, usually in the form of 1 A similar but modified version of this chapter appears as: Istok G. Nahtigal, Alexander Y. Zasetsky and
Igor M. Svishchev, J. Phys. Chem. B, 112(25), 7537-7545, 2008
28
spontaneous density or composition fluctuations within the metastable phase.8 In
heterogeneous cases, the surface itself may catalyze or promote nucleation. With the
creation of a new phase an energy cost is associated; the penalty is the interface energy,
which diminishes as the cluster surface to volume ratio decreases. In a metastable system
this leads to the existence of a critical size, beyond which growth is favored. The critical
sized nucleus, or embryo, need not possess the properties of the stable
thermodynamically phase, but one that is closest in free energy to the parent phase. 8, 9
In aqueous environment the number density ratio of solute to solvent species is
typically small, with the solvent maintaining thermal equilibrium. Ions interact as solvent
separated species, partial dehydration of the ions results in the formation of contact pairs,
which then evolve into a cluster. Solvated clusters tend to have both crystal-like and
liquid-like (amorphous-like) orders. An embryo which grows to a size larger than the
critical size will most likely continue to grow to a macroscopic size, whereas ones
smaller than critical will likely reduce in size.10, 11 From a kinetic perspective, a critical
embryo can be viewed as a transient species appearing and disappearing at some steady
rate specific to the thermodynamic conditions.
The nucleation dynamics and cluster structures can be directly examined by using
molecular dynamics (MD) simulations. The MD method provides critical microscopic
insights into the nucleation events; it also enables the calculation of the nucleation rate
which has thus far, been difficult to measure experimentally.13 The kinetics of the initial
stages of NaCl cluster formation in SCW have been recently12 examined for 3 state points
of low density (0.10 to 0.14 g/cm3) and high salt concentration (20.2 wt%). It is the
purpose of this paper to investigate the nucleation of NaCl clusters in hydrothermal
29
solutions in a wider range of density and temperature from the trajectories generated by
the MD method. We explore NaCl – water system at a lower salt concentration (5.1 wt%)
that is more useful for providing direct insights into the particle formation kinetics in
SCWO and power circuits.
3.1 Simulation Details In the present work we have employed parallel molecular dynamics code for an
arbitrary molecular mixture (M.DynaMix) by Lyubartsev and Laaksonen14, which has
been modified to perform the clustering analysis. Simulations have been carried out on a
Linux cluster built on the Tyan/Opteron 64 platform. The simple point charge extended
(SPC/E) model was used for water.15 This model provides a reasonably good prediction
of the structure and dielectric constant for water at the conditions of interest; the
calculated values for the dielectric constant are, approximately, 81 at 298 K and 6 at TC,
as compared with 78.0 and 5.3, respectively, for real water. We have also employed
parameters from Smith and Dang16 to model ion-ion and ion–water interactions, as they
have been optimized for use with the SPC/E water model. Table 1 lists site charges, q,
and Lennard-Jones parameters, ε and σ.
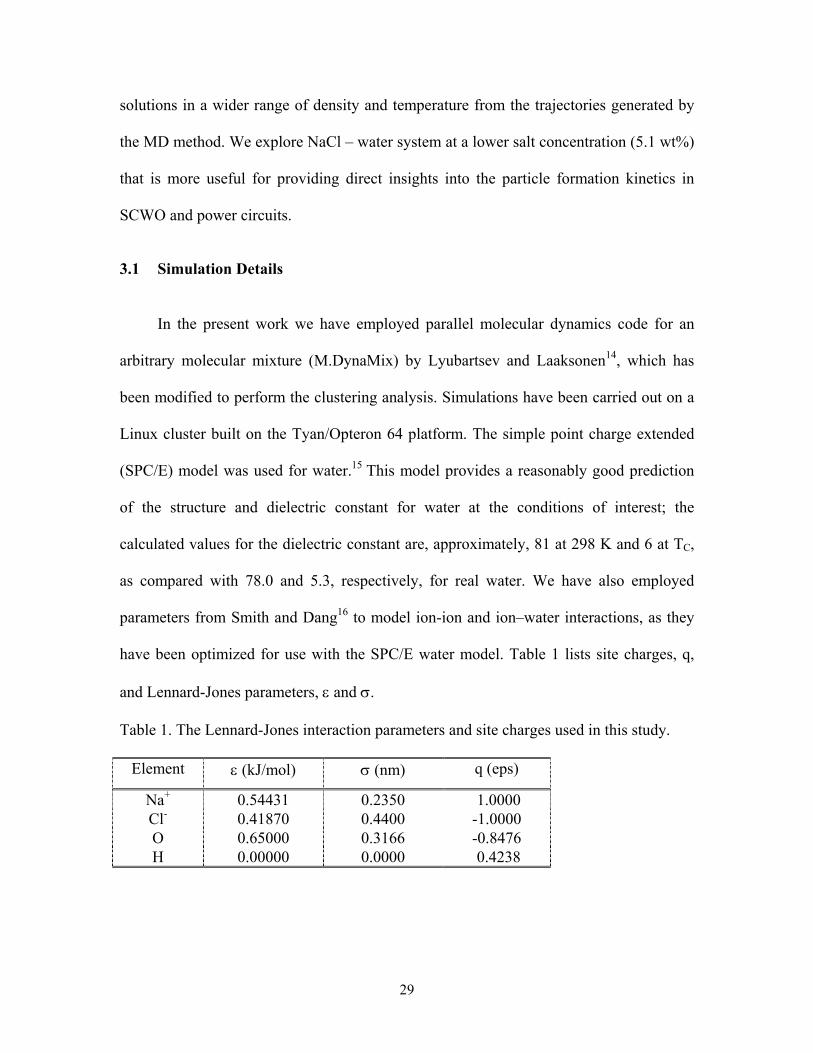
Table 1. The Lennard-Jones interaction parameters and site charges used in this study.
Element ε (kJ/mol) σ (nm) q (eps)
Na+ 0.54431 0.2350 1.0000 Cl- 0.41870 0.4400 -1.0000 O 0.65000 0.3166 -0.8476 H 0.00000 0.0000 0.4238
30
The Lorentz - Berthelot mixing rules were applied for cross terms:
2ji
ij
σσσ
+= and jiij εεε = . (1)
The equations of motion were solved by using Verlet leap-frog algorithm, with the time
step of 2 fs and the SHAKE constraints scheme17 was applied to keep molecules rigid.
Simulations have been performed in the canonical (NVT) ensemble with temperature
controlled by the Nosé-Hoover thermostat.18
We have employed the reaction field (RF) periodic boundary conditions using
cubic geometry for the basic simulation cell. “Conducting” boundary was assumed with
the RF cut-off radius being set at 2.5 nm. We have also performed a test run for the
system with the density of 0.34 g/cm3 at temperature of 673 K using the Ewald method.
The total energy calculated using Ewald sums was found to be -24.57 kJ/mol, while the
RF method yields -24.39 kJ/mol. Note that the energy difference is within the sampling
(statistical) error (of about 1.5%). The average pressure values calculated with both
methods were also very similar.
In each simulation 4000 water molecules were initially equilibrated at the
temperature of interest and 132 ions were then randomly distributed over the simulation
cell in such a way to prevent the formation of any contact ion-pairs at the beginning and
the overlap with water molecules. The solution concentration was 5.1 %wt of NaCl. The
ion condensation processes were sampled after a short equilibration period of 1 ps
following ion insertion. The system size, production run lengths, temperatures and
solution densities are as specified in Table 2.
31
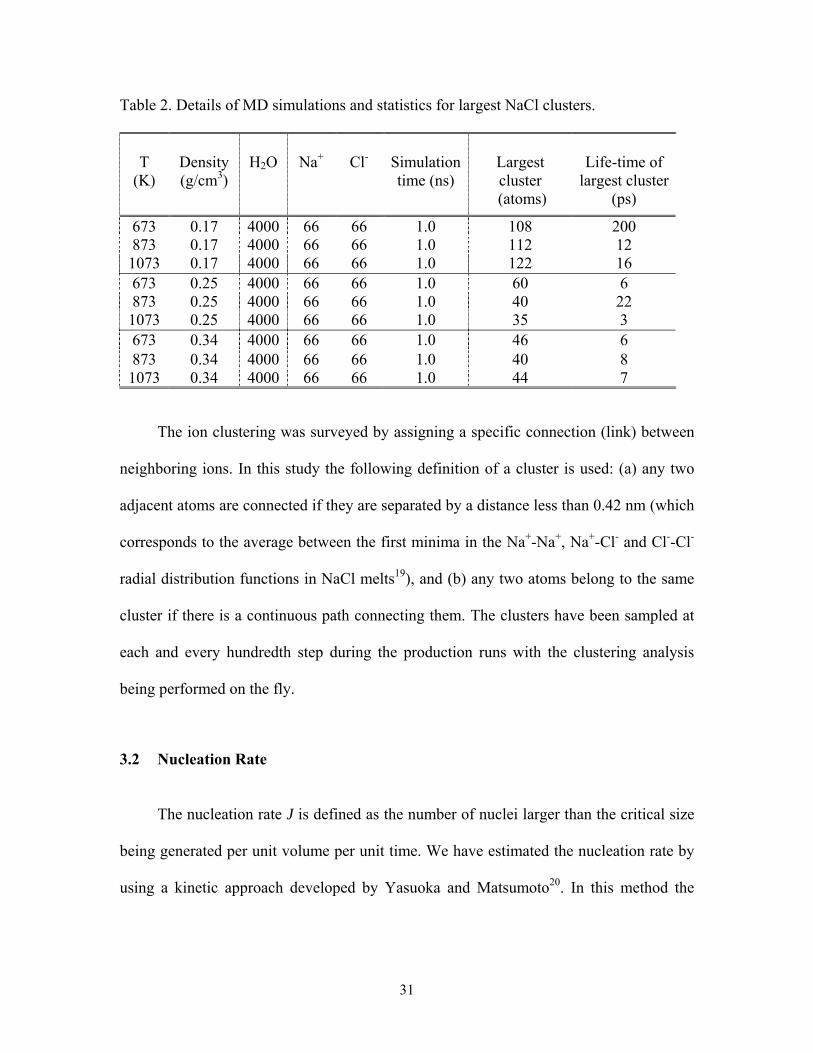
Table 2. Details of MD simulations and statistics for largest NaCl clusters.
T
(K)
Density (g/cm3)
H2O
Na+
Cl-
Simulation time (ns)
Largest cluster
(atoms)
Life-time of
largest cluster (ps)
673 0.17 4000 66 66 1.0 108 200 873 0.17 4000 66 66 1.0 112 12 1073 0.17 4000 66 66 1.0 122 16 673 0.25 4000 66 66 1.0 60 6 873 0.25 4000 66 66 1.0 40 22 1073 0.25 4000 66 66 1.0 35 3 673 0.34 4000 66 66 1.0 46 6 873 0.34 4000 66 66 1.0 40 8 1073 0.34 4000 66 66 1.0 44 7
The ion clustering was surveyed by assigning a specific connection (link) between
neighboring ions. In this study the following definition of a cluster is used: (a) any two
adjacent atoms are connected if they are separated by a distance less than 0.42 nm (which
corresponds to the average between the first minima in the Na+-Na+, Na+-Cl- and Cl--Cl-
radial distribution functions in NaCl melts19), and (b) any two atoms belong to the same
cluster if there is a continuous path connecting them. The clusters have been sampled at
each and every hundredth step during the production runs with the clustering analysis
being performed on the fly.
3.2 Nucleation Rate The nucleation rate J is defined as the number of nuclei larger than the critical size
being generated per unit volume per unit time. We have estimated the nucleation rate by
using a kinetic approach developed by Yasuoka and Matsumoto20. In this method the
32
number of clusters above a certain threshold size is counted and plotted against time,
which produces a growth-decay evolution curve, shown schematically in Figure 1.
Figure 1. Typical growth-decay evolution curve for the number of nuclei (N) larger than a threshold size. Domain I - the induction period where no nuclei larger than critical are observed, domain II – the nucleation regime, domain III - the generation of nuclei stops, domain IV – the coarsening regime.
The size of the critical nucleus can be estimated by adopting a series of threshold
sizes and by examining the slope of the evolution curve. With increasing threshold size,
the gradient of the evolution curve (specifically, of the domain II in Figure 1) decreases,
at the critical size the inclination stops decreasing (and remains constant for larger
threshold sizes). From a kinetic perspective this is where growth and decay are balanced,
yielding the size of the critical nucleus. The nucleation rate J is, the slope of domain II of
the evolution curve for the cluster sizes above critical, scaled to the volume of the
simulation cell. It should be noted that there is an induction time before which no nuclei
larger than the critical are observed (domain I in Fig. 1). The nucleation time lag reported
here is the time until a critical nucleus is formed. From a theoretical perspective,
application of the classical nucleation theory (CNT)21 to our high-temperature ion – water
33
mixture will not be straightforward, as it requires accurate knowledge of its phase
equilibria and surface tension of NaCl melts (or crystals).
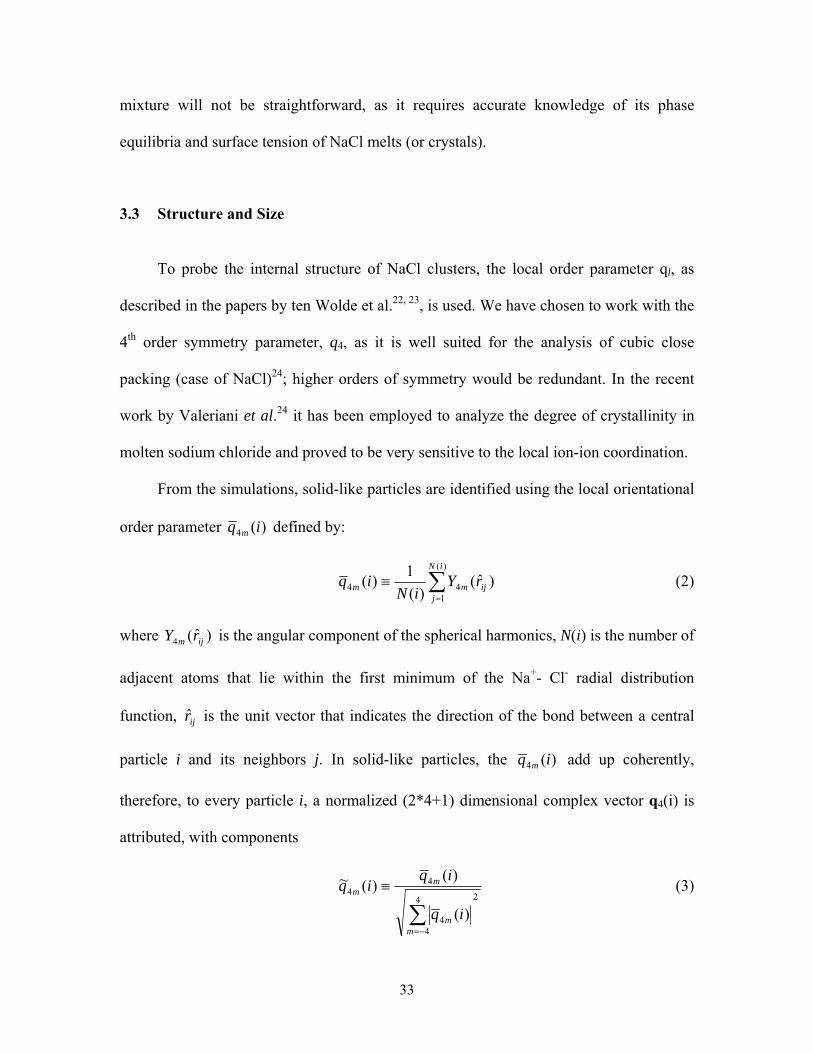
3.3 Structure and Size To probe the internal structure of NaCl clusters, the local order parameter ql, as
described in the papers by ten Wolde et al.22, 23, is used. We have chosen to work with the
4th order symmetry parameter, q4, as it is well suited for the analysis of cubic close
packing (case of NaCl)24; higher orders of symmetry would be redundant. In the recent
work by Valeriani et al.24 it has been employed to analyze the degree of crystallinity in
molten sodium chloride and proved to be very sensitive to the local ion-ion coordination.
From the simulations, solid-like particles are identified using the local orientational
order parameter )(4 iq m defined by:
∑=
≡)(
144 )ˆ(
)(1)(
iN
jijmm rY
iNiq (2)
where )ˆ(4 ijm rY is the angular component of the spherical harmonics, N(i) is the number of
adjacent atoms that lie within the first minimum of the Na+- Cl- radial distribution
function, ijr̂ is the unit vector that indicates the direction of the bond between a central
particle i and its neighbors j. In solid-like particles, the )(4 iq m add up coherently,
therefore, to every particle i, a normalized (2*4+1) dimensional complex vector q4(i) is
attributed, with components
24
44
44
)(
)()(~
∑−=
≡
mm
mm
iq
iqiq (3)
34
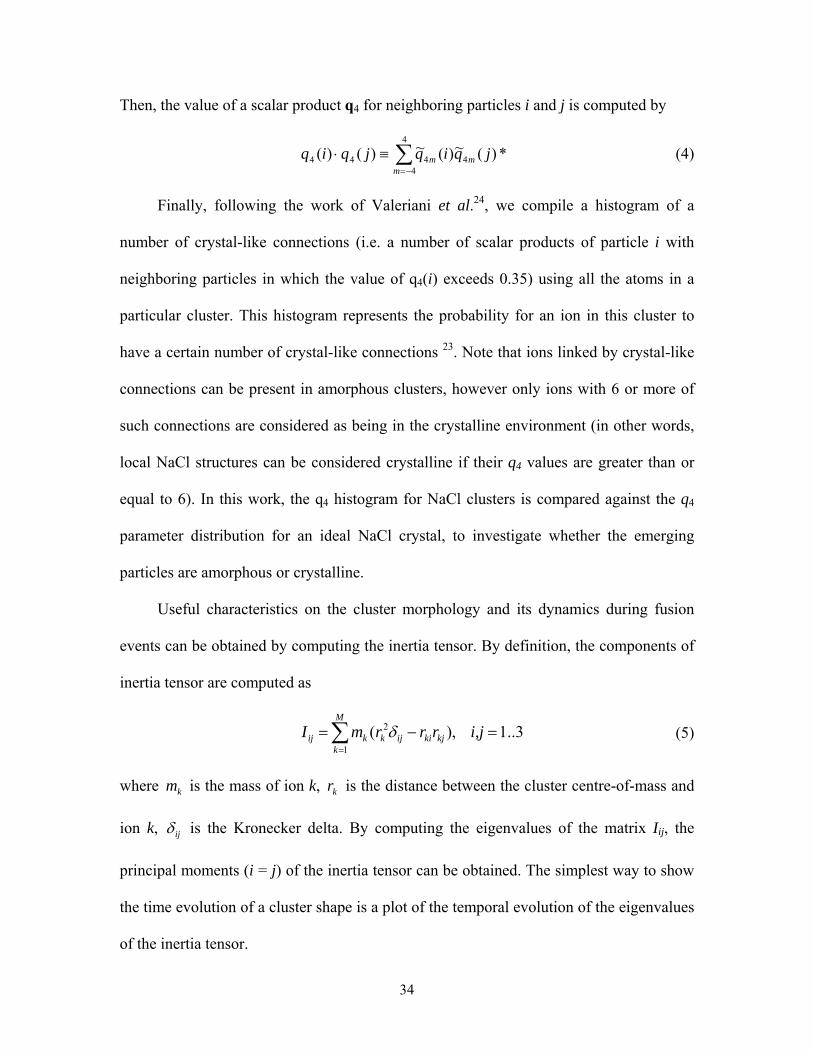
Then, the value of a scalar product q4 for neighboring particles i and j is computed by
∑−=
≡⋅4
44444 *)(~)(~)()(
mmm jqiqjqiq (4)
Finally, following the work of Valeriani et al.24, we compile a histogram of a
number of crystal-like connections (i.e. a number of scalar products of particle i with
neighboring particles in which the value of q4(i) exceeds 0.35) using all the atoms in a
particular cluster. This histogram represents the probability for an ion in this cluster to
have a certain number of crystal-like connections 23. Note that ions linked by crystal-like
connections can be present in amorphous clusters, however only ions with 6 or more of
such connections are considered as being in the crystalline environment (in other words,
local NaCl structures can be considered crystalline if their q4 values are greater than or
equal to 6). In this work, the q4 histogram for NaCl clusters is compared against the q4
parameter distribution for an ideal NaCl crystal, to investigate whether the emerging
particles are amorphous or crystalline.
Useful characteristics on the cluster morphology and its dynamics during fusion
events can be obtained by computing the inertia tensor. By definition, the components of
inertia tensor are computed as
1..3 ,)(1
2 =−= ∑=
i,jrrrmIM
kkjkiijkkij δ (5)
where km is the mass of ion k, kr is the distance between the cluster centre-of-mass and
ion k, ijδ is the Kronecker delta. By computing the eigenvalues of the matrix Iij, the
principal moments (i = j) of the inertia tensor can be obtained. The simplest way to show
the time evolution of a cluster shape is a plot of the temporal evolution of the eigenvalues
of the inertia tensor.
35
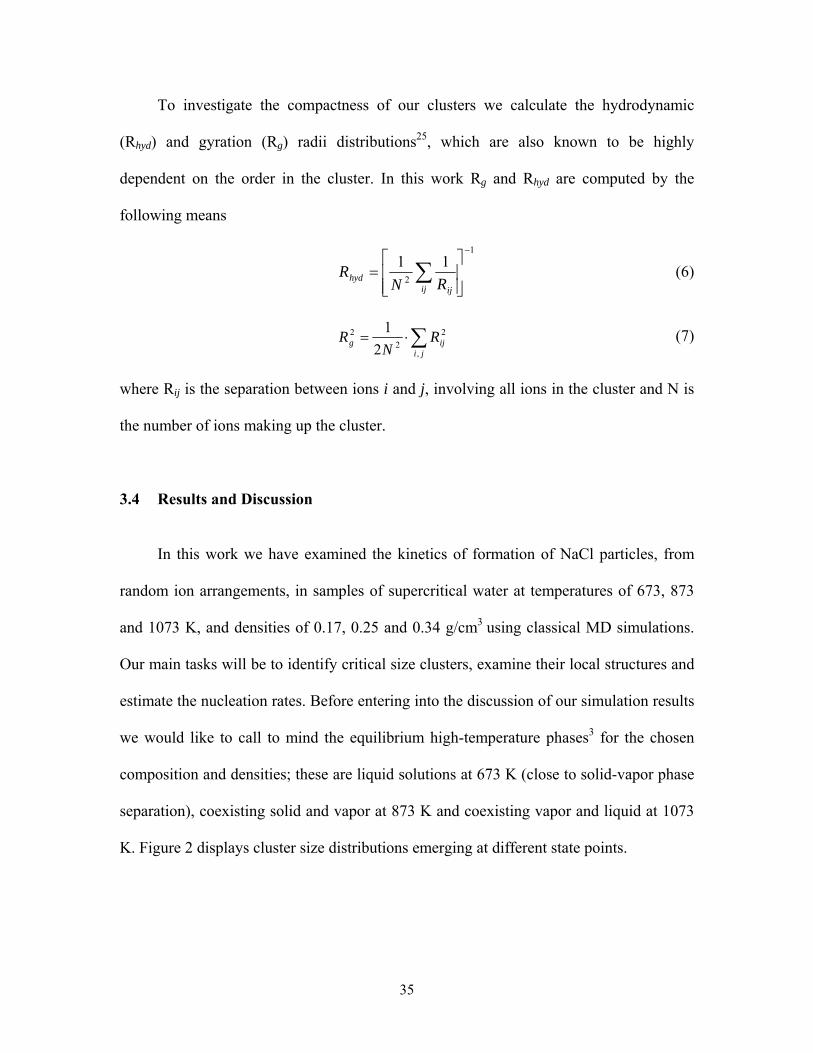
To investigate the compactness of our clusters we calculate the hydrodynamic
(Rhyd) and gyration (Rg) radii distributions25, which are also known to be highly
dependent on the order in the cluster. In this work Rg and Rhyd are computed by the
following means
1
2
11−
⎥⎥⎦
⎤
⎢⎢⎣
⎡= ∑
ij ijhyd RN
R (6)
∑⋅=ji
ijg RN
R,
22
2
21 (7)
where Rij is the separation between ions i and j, involving all ions in the cluster and N is
the number of ions making up the cluster.
3.4 Results and Discussion In this work we have examined the kinetics of formation of NaCl particles, from
random ion arrangements, in samples of supercritical water at temperatures of 673, 873
and 1073 K, and densities of 0.17, 0.25 and 0.34 g/cm3 using classical MD simulations.
Our main tasks will be to identify critical size clusters, examine their local structures and
estimate the nucleation rates. Before entering into the discussion of our simulation results
we would like to call to mind the equilibrium high-temperature phases3 for the chosen
composition and densities; these are liquid solutions at 673 K (close to solid-vapor phase
separation), coexisting solid and vapor at 873 K and coexisting vapor and liquid at 1073
K. Figure 2 displays cluster size distributions emerging at different state points.
36
Figure 2. Cluster size distributions (frequency of occurrence for the clusters of different sizes) for the final 0.7 ns of the simulation trajectory.
These distributions are normalized by the length of the analyzed trajectory, representing
the frequency of occurrence for the clusters of different sizes. The most striking
observation is that cluster distributions formed in supercritical water are strongly density
dependent. Thus, for the solution with the density of 0.17 g/cm3 the largest clusters
observed during the course of simulation runs were 108 atoms at 673 K and 122 atoms at
1073 K, whereas for the solution with the density of 0.34 g/cm3 clusters could only reach
the size of 46 atoms at 673 K and 44 atoms at 1073 K. The temperature effect is less
pronounced and, perhaps, larger systems and longer simulation times are required to
37
assess the temperature effects on the cluster size distribution in more detail. In this study,
at the lowest density of 0.17 g/cm3 larger clusters tend to form preferably at a higher
temperature of 1073 K, while for the solutions with the density of 0.34 g/cm3 the
distributions are rather similar for all the temperatures examined. It is also worthwhile
noting that larger clusters, especially in the lower density solution, tend to form by
coagulation of smaller clusters, which is an indication that two or more critical nuclei
form independent of each other. Obviously, the formation of many small clusters is
kinetically favored (i.e. they initially nucleate more easily); however, larger clusters are
more stable and eventually scavenge smaller particles.
Figure 3 is the trajectory visualization for a system at the lowest density (0.17
g/cm3) and temperature (673 K) that shows the process of the coagulation of smaller
clusters (on the order of 20 atoms) into larger particles.
Figure 3. Evolution of clusters at 673 K and 0.17 g/cm3. (a) Typical near-critical size cluster (20 ions), (b) fusion of 2 critical nuclei (25 and 22 ions) into larger post-critical particle and (c) condensation of two post-critical particles. Large spheres are chloride ions, small spheres are sodium ions.
Referring back to Figure 2 (in which the top panels reflect this coagulation process from
a statistical viewpoint) we point to the gaps between peaks in the size distributions. These
gaps indicate that once clusters reach the size of about 20 atoms the consequent growth
progresses by coagulation. This size (around 20) visually appears to be critical in the
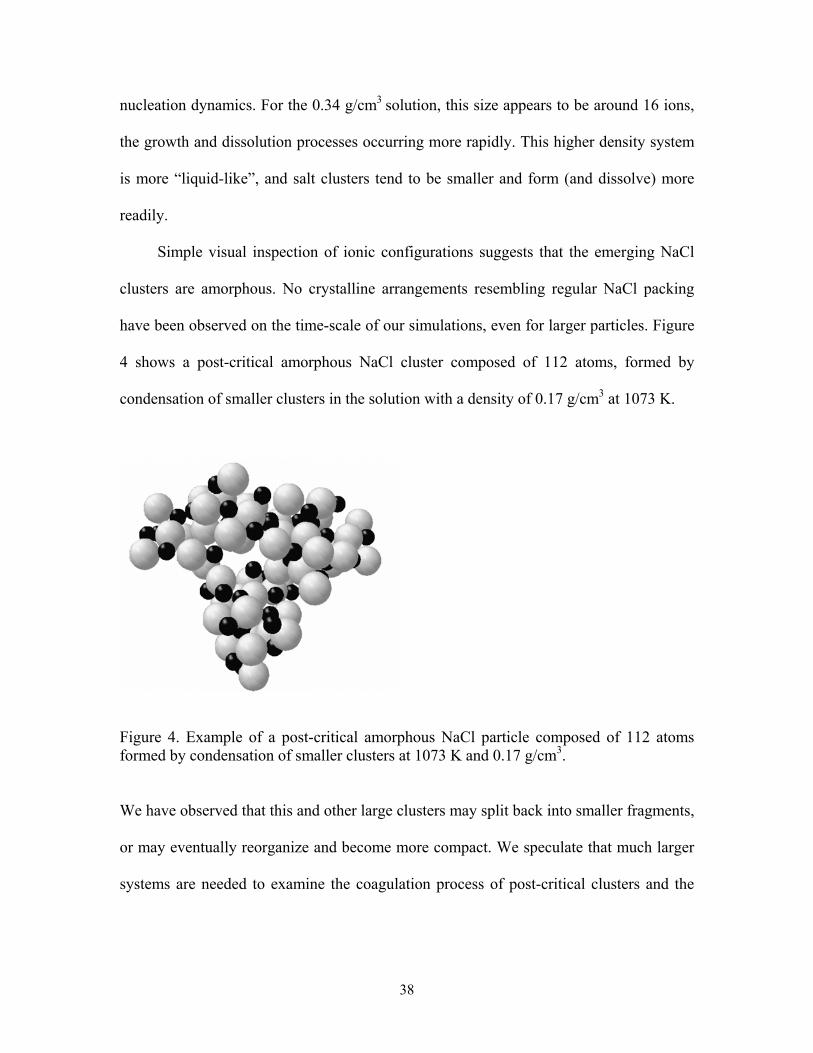
38
nucleation dynamics. For the 0.34 g/cm3 solution, this size appears to be around 16 ions,
the growth and dissolution processes occurring more rapidly. This higher density system
is more “liquid-like”, and salt clusters tend to be smaller and form (and dissolve) more
readily.
Simple visual inspection of ionic configurations suggests that the emerging NaCl
clusters are amorphous. No crystalline arrangements resembling regular NaCl packing
have been observed on the time-scale of our simulations, even for larger particles. Figure
4 shows a post-critical amorphous NaCl cluster composed of 112 atoms, formed by
condensation of smaller clusters in the solution with a density of 0.17 g/cm3 at 1073 K.
Figure 4. Example of a post-critical amorphous NaCl particle composed of 112 atoms formed by condensation of smaller clusters at 1073 K and 0.17 g/cm3.
We have observed that this and other large clusters may split back into smaller fragments,
or may eventually reorganize and become more compact. We speculate that much larger
systems are needed to examine the coagulation process of post-critical clusters and the
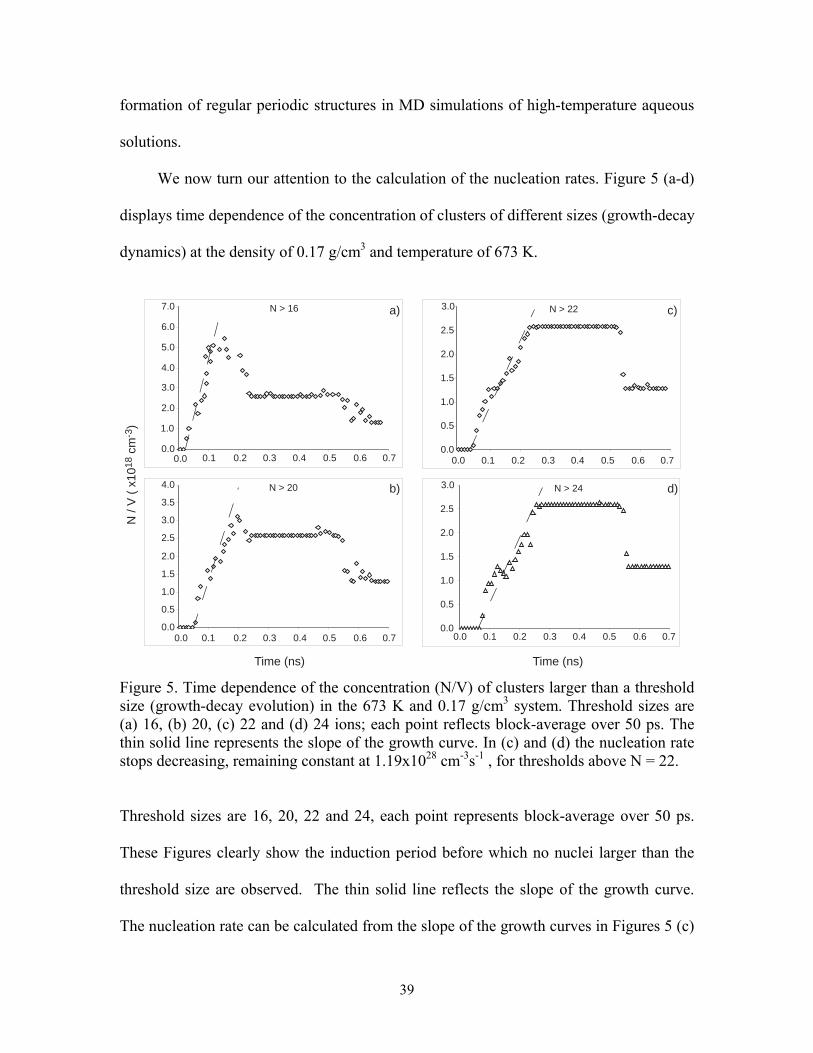
39
formation of regular periodic structures in MD simulations of high-temperature aqueous
solutions.
We now turn our attention to the calculation of the nucleation rates. Figure 5 (a-d)
displays time dependence of the concentration of clusters of different sizes (growth-decay
dynamics) at the density of 0.17 g/cm3 and temperature of 673 K.
N /
V (
x101
8 cm
-3)
Time (ns)
b)
a)
0.0
1.0
2.0
3.0
4.0
5.0
6.0
7.0
0.0 0.1 0.2 0.3 0.4 0.5 0.6 0.7
0.0
0.5
1.0
1.5
2.0
2.5
3.0
3.5
4.0
0.0 0.1 0.2 0.3 0.4 0.5 0.6 0.7
N > 16
N > 20
0.0 0.1 0.2 0.3 0.4 0.5 0.6 0.70.0
0.5
1.0
1.5
2.0
2.5
3.0 N > 24
c)
0.0
0.5
1.0
1.5
2.0
2.5
3.0
0.0 0.1 0.2 0.3 0.4 0.5 0.6 0.7
N > 22
d)
Time (ns) Figure 5. Time dependence of the concentration (N/V) of clusters larger than a threshold size (growth-decay evolution) in the 673 K and 0.17 g/cm3 system. Threshold sizes are (a) 16, (b) 20, (c) 22 and (d) 24 ions; each point reflects block-average over 50 ps. The thin solid line represents the slope of the growth curve. In (c) and (d) the nucleation rate stops decreasing, remaining constant at 1.19x1028 cm-3s-1 , for thresholds above N = 22.
Threshold sizes are 16, 20, 22 and 24, each point represents block-average over 50 ps.
These Figures clearly show the induction period before which no nuclei larger than the
threshold size are observed. The thin solid line reflects the slope of the growth curve.
The nucleation rate can be calculated from the slope of the growth curves in Figures 5 (c)
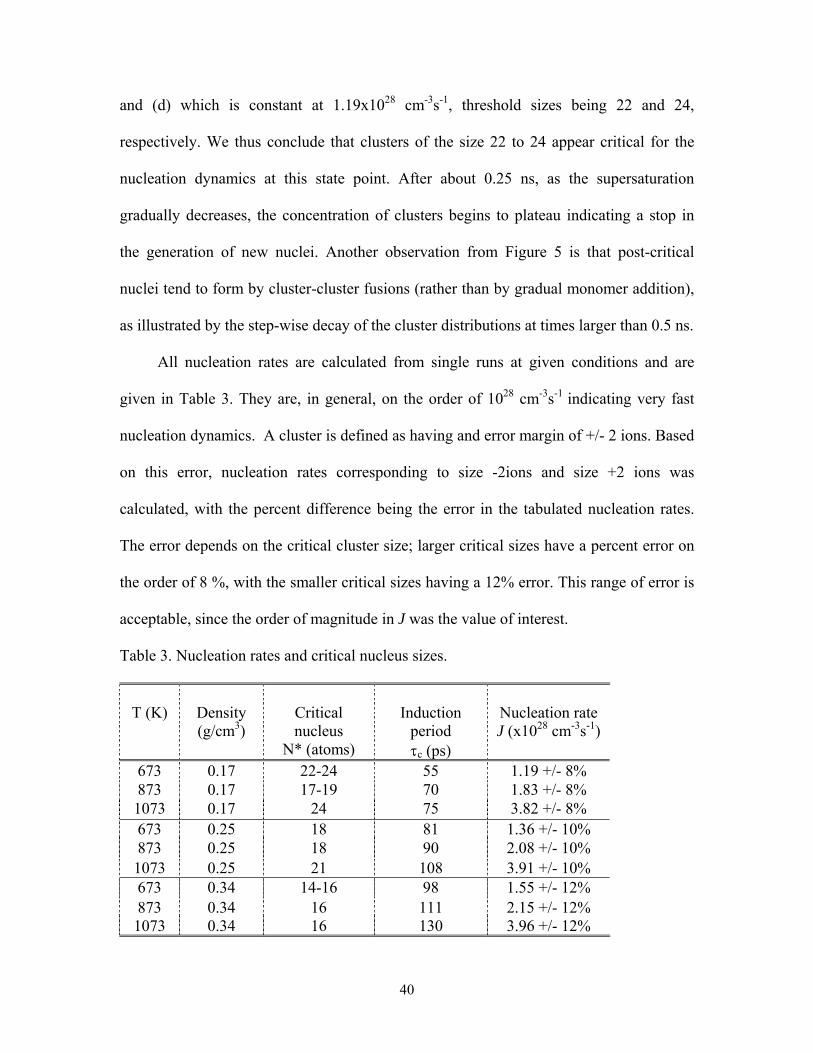
40
and (d) which is constant at 1.19x1028 cm-3s-1, threshold sizes being 22 and 24,
respectively. We thus conclude that clusters of the size 22 to 24 appear critical for the
nucleation dynamics at this state point. After about 0.25 ns, as the supersaturation
gradually decreases, the concentration of clusters begins to plateau indicating a stop in
the generation of new nuclei. Another observation from Figure 5 is that post-critical
nuclei tend to form by cluster-cluster fusions (rather than by gradual monomer addition),
as illustrated by the step-wise decay of the cluster distributions at times larger than 0.5 ns.
All nucleation rates are calculated from single runs at given conditions and are
given in Table 3. They are, in general, on the order of 1028 cm-3s-1 indicating very fast
nucleation dynamics. A cluster is defined as having and error margin of +/- 2 ions. Based
on this error, nucleation rates corresponding to size -2ions and size +2 ions was
calculated, with the percent difference being the error in the tabulated nucleation rates.
The error depends on the critical cluster size; larger critical sizes have a percent error on
the order of 8 %, with the smaller critical sizes having a 12% error. This range of error is
acceptable, since the order of magnitude in J was the value of interest.
Table 3. Nucleation rates and critical nucleus sizes.
T (K)
Density (g/cm3)
Critical nucleus
N* (atoms)
Induction
period τc (ps)
Nucleation rate J (x1028 cm-3s-1)
673 0.17 22-24 55 1.19 +/- 8% 873 0.17 17-19 70 1.83 +/- 8% 1073 0.17 24 75 3.82 +/- 8% 673 0.25 18 81 1.36 +/- 10% 873 0.25 18 90 2.08 +/- 10% 1073 0.25 21 108 3.91 +/- 10% 673 0.34 14-16 98 1.55 +/- 12% 873 0.34 16 111 2.15 +/- 12% 1073 0.34 16 130 3.96 +/- 12%
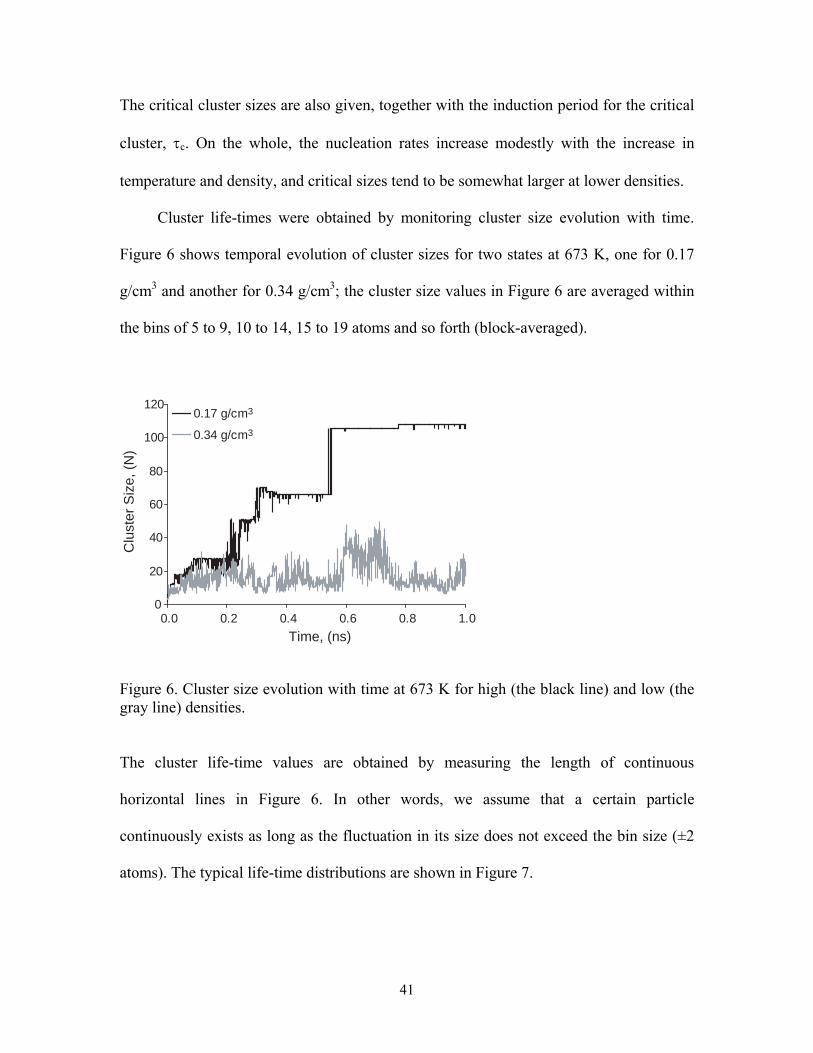
41
The critical cluster sizes are also given, together with the induction period for the critical
cluster, τc. On the whole, the nucleation rates increase modestly with the increase in
temperature and density, and critical sizes tend to be somewhat larger at lower densities.
Cluster life-times were obtained by monitoring cluster size evolution with time.
Figure 6 shows temporal evolution of cluster sizes for two states at 673 K, one for 0.17
g/cm3 and another for 0.34 g/cm3; the cluster size values in Figure 6 are averaged within
the bins of 5 to 9, 10 to 14, 15 to 19 atoms and so forth (block-averaged).
Clu
ster
Siz
e, (N
)
Time, (ns)
0
20
40
60
80
100
120
0.0 0.2 0.4 0.6 0.8 1.0
0.17 g/cm3
0.34 g/cm3
Figure 6. Cluster size evolution with time at 673 K for high (the black line) and low (the gray line) densities.
The cluster life-time values are obtained by measuring the length of continuous
horizontal lines in Figure 6. In other words, we assume that a certain particle
continuously exists as long as the fluctuation in its size does not exceed the bin size (±2
atoms). The typical life-time distributions are shown in Figure 7.
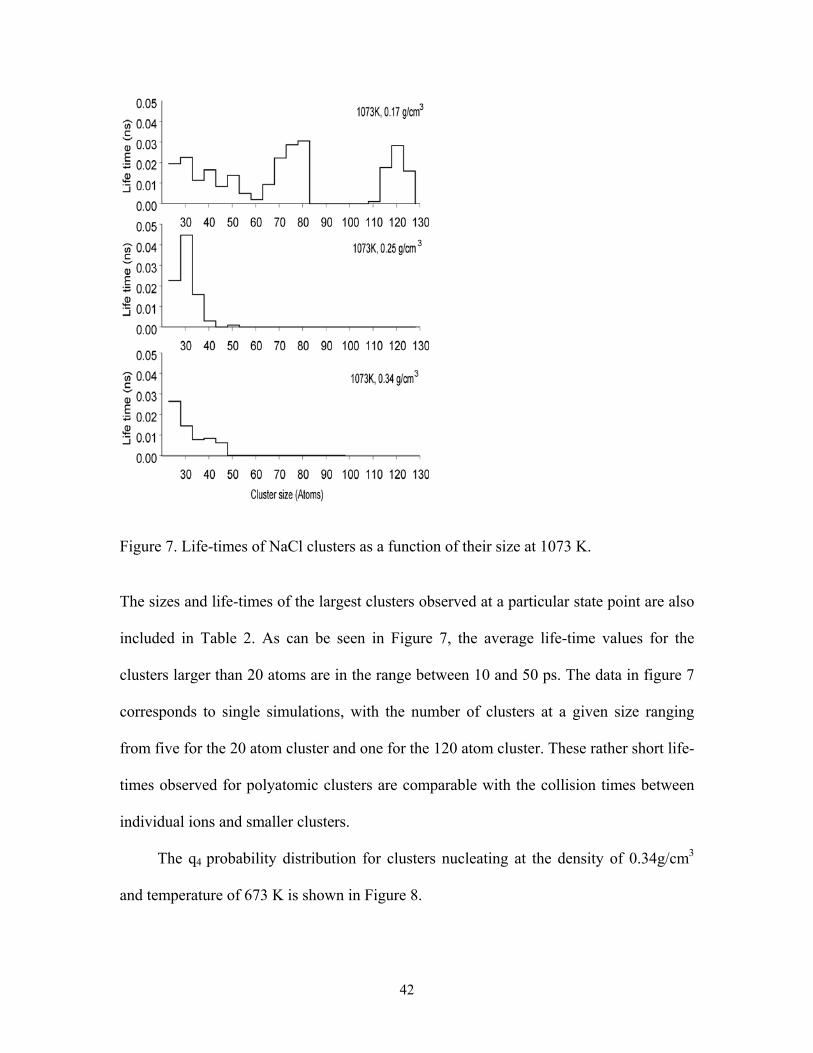
42
Figure 7. Life-times of NaCl clusters as a function of their size at 1073 K.
The sizes and life-times of the largest clusters observed at a particular state point are also
included in Table 2. As can be seen in Figure 7, the average life-time values for the
clusters larger than 20 atoms are in the range between 10 and 50 ps. The data in figure 7
corresponds to single simulations, with the number of clusters at a given size ranging
from five for the 20 atom cluster and one for the 120 atom cluster. These rather short life-
times observed for polyatomic clusters are comparable with the collision times between
individual ions and smaller clusters.
The q4 probability distribution for clusters nucleating at the density of 0.34g/cm3
and temperature of 673 K is shown in Figure 8.
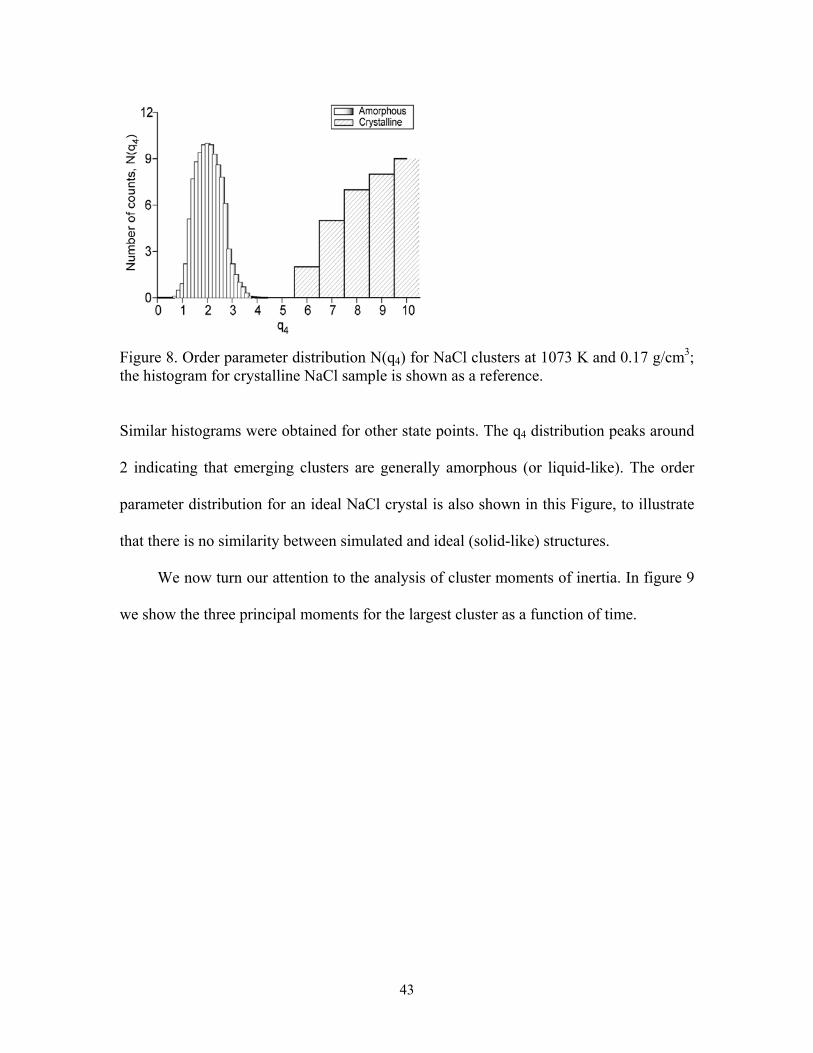
43
Figure 8. Order parameter distribution N(q4) for NaCl clusters at 1073 K and 0.17 g/cm3; the histogram for crystalline NaCl sample is shown as a reference.
Similar histograms were obtained for other state points. The q4 distribution peaks around
2 indicating that emerging clusters are generally amorphous (or liquid-like). The order
parameter distribution for an ideal NaCl crystal is also shown in this Figure, to illustrate
that there is no similarity between simulated and ideal (solid-like) structures.
We now turn our attention to the analysis of cluster moments of inertia. In figure 9
we show the three principal moments for the largest cluster as a function of time.
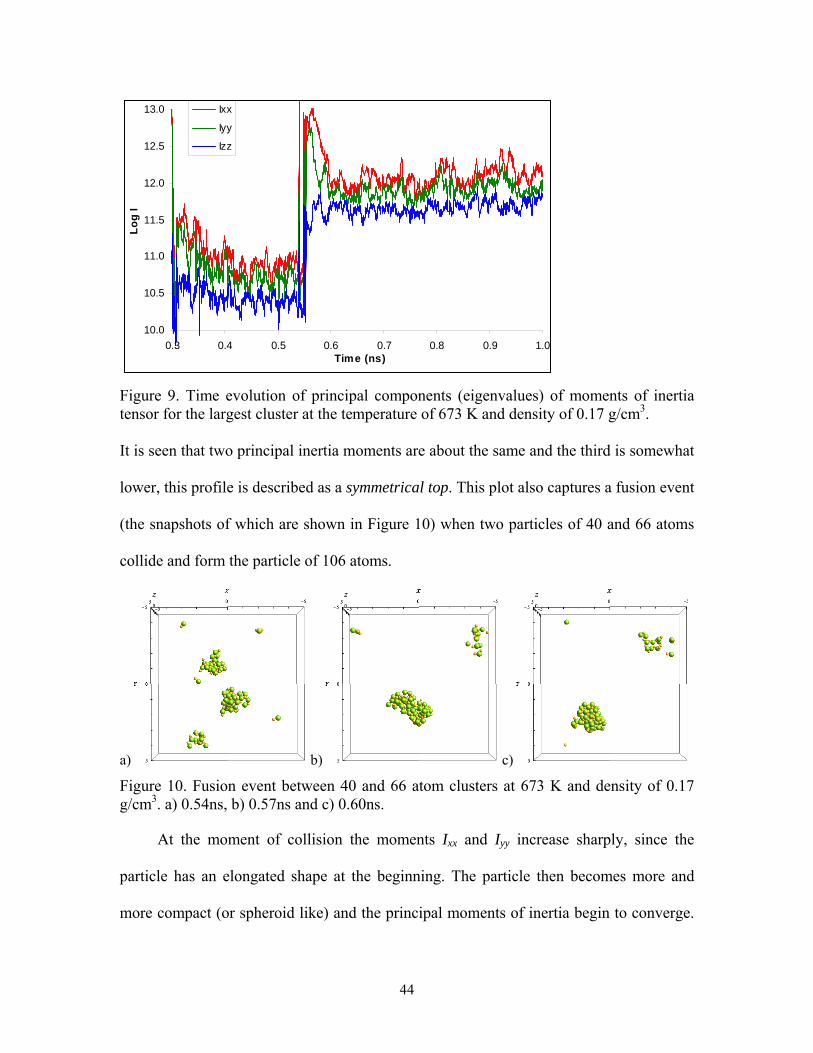
44
10.0
10.5
11.0
11.5
12.0
12.5
13.0
0.3 0.4 0.5 0.6 0.7 0.8 0.9 1.0Time (ns)
Log
I
Ixx
Iyy
Izz
Figure 9. Time evolution of principal components (eigenvalues) of moments of inertia tensor for the largest cluster at the temperature of 673 K and density of 0.17 g/cm3. It is seen that two principal inertia moments are about the same and the third is somewhat
lower, this profile is described as a symmetrical top. This plot also captures a fusion event
(the snapshots of which are shown in Figure 10) when two particles of 40 and 66 atoms
collide and form the particle of 106 atoms.
a) b) c)
Figure 10. Fusion event between 40 and 66 atom clusters at 673 K and density of 0.17 g/cm3. a) 0.54ns, b) 0.57ns and c) 0.60ns. At the moment of collision the moments Ixx and Iyy increase sharply, since the
particle has an elongated shape at the beginning. The particle then becomes more and
more compact (or spheroid like) and the principal moments of inertia begin to converge.
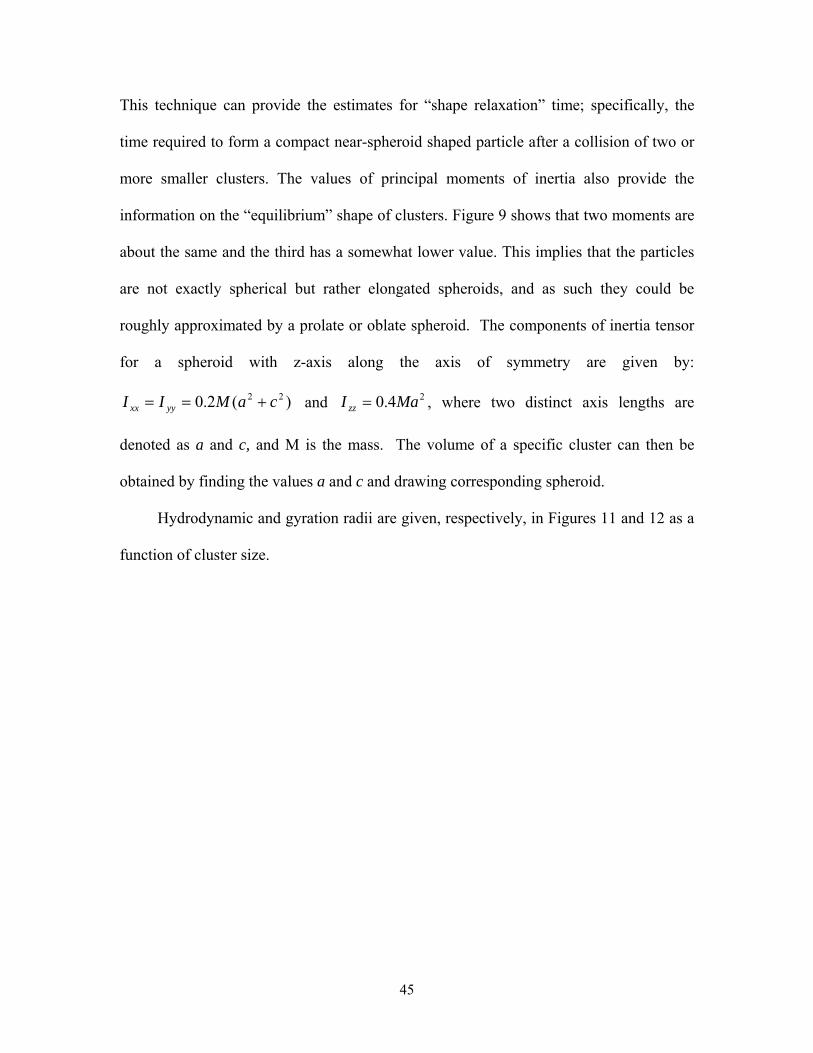
45
This technique can provide the estimates for “shape relaxation” time; specifically, the
time required to form a compact near-spheroid shaped particle after a collision of two or
more smaller clusters. The values of principal moments of inertia also provide the
information on the “equilibrium” shape of clusters. Figure 9 shows that two moments are
about the same and the third has a somewhat lower value. This implies that the particles
are not exactly spherical but rather elongated spheroids, and as such they could be
roughly approximated by a prolate or oblate spheroid. The components of inertia tensor
for a spheroid with z-axis along the axis of symmetry are given by:
)(2.0 22 caMII yyxx +== and 24.0 MaI zz = , where two distinct axis lengths are
denoted as a and c, and M is the mass. The volume of a specific cluster can then be
obtained by finding the values a and c and drawing corresponding spheroid.
Hydrodynamic and gyration radii are given, respectively, in Figures 11 and 12 as a
function of cluster size.
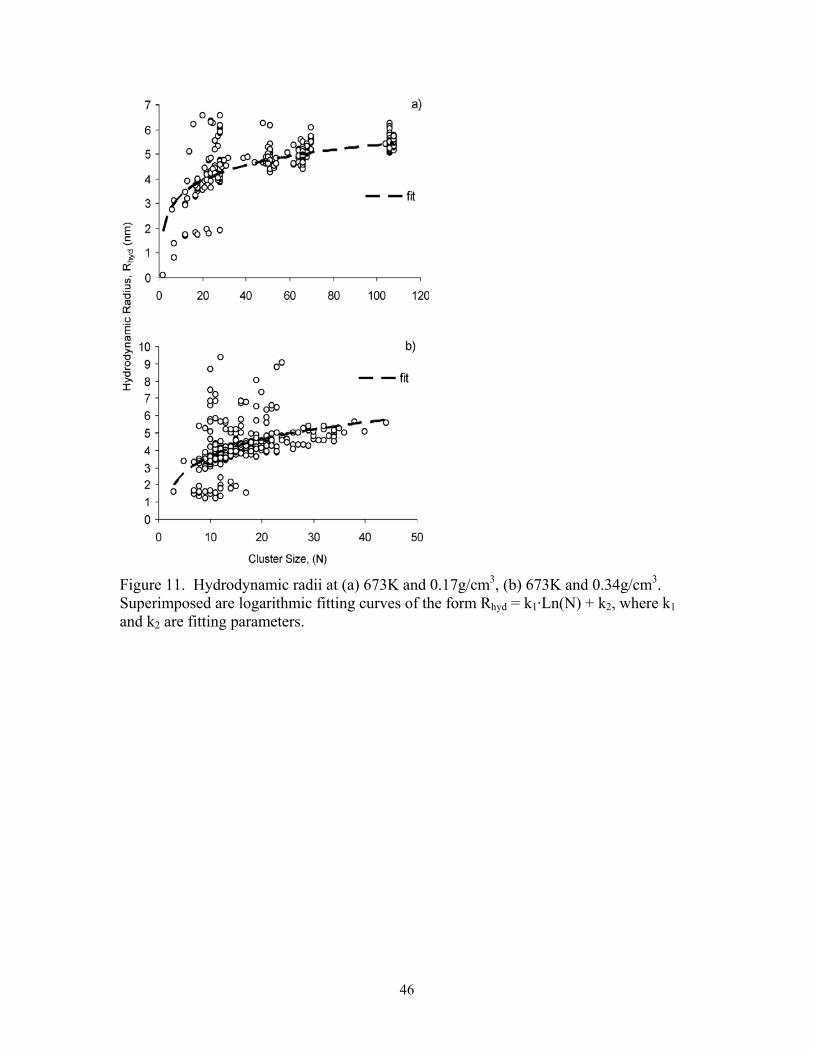
46
Figure 11. Hydrodynamic radii at (a) 673K and 0.17g/cm3, (b) 673K and 0.34g/cm3. Superimposed are logarithmic fitting curves of the form Rhyd = k1·Ln(N) + k2, where k1 and k2 are fitting parameters.
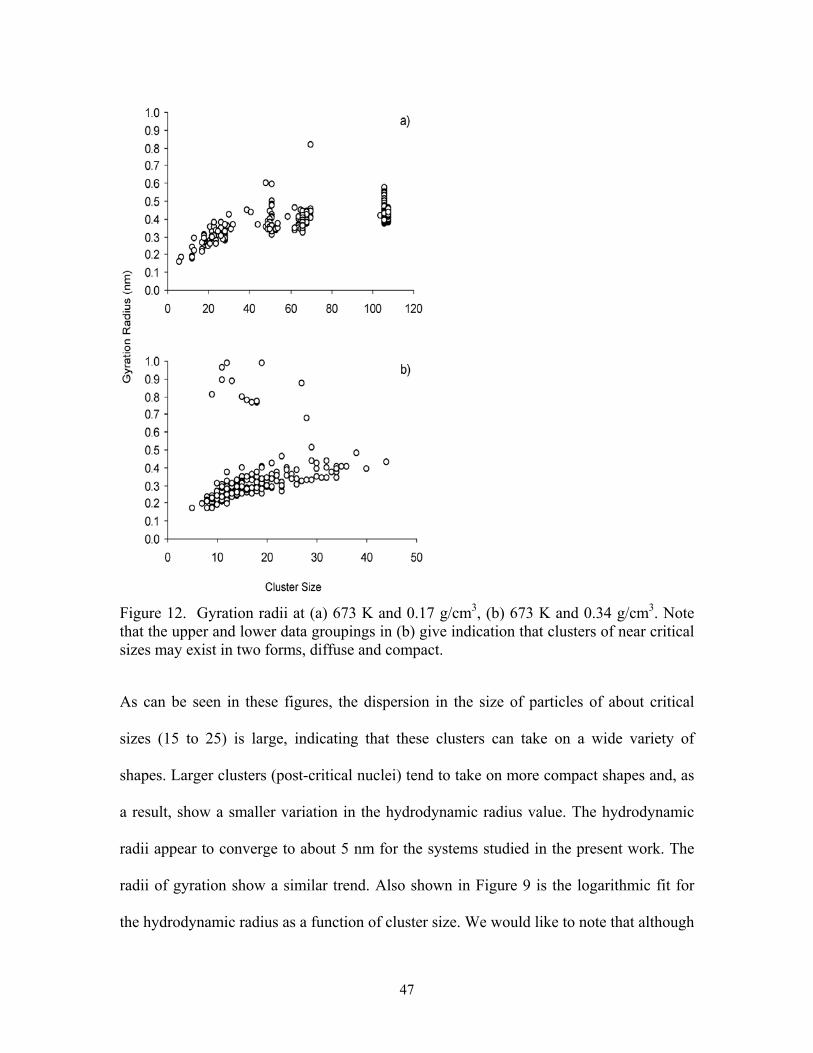
47
Figure 12. Gyration radii at (a) 673 K and 0.17 g/cm3, (b) 673 K and 0.34 g/cm3. Note that the upper and lower data groupings in (b) give indication that clusters of near critical sizes may exist in two forms, diffuse and compact.
As can be seen in these figures, the dispersion in the size of particles of about critical
sizes (15 to 25) is large, indicating that these clusters can take on a wide variety of
shapes. Larger clusters (post-critical nuclei) tend to take on more compact shapes and, as
a result, show a smaller variation in the hydrodynamic radius value. The hydrodynamic
radii appear to converge to about 5 nm for the systems studied in the present work. The
radii of gyration show a similar trend. Also shown in Figure 9 is the logarithmic fit for
the hydrodynamic radius as a function of cluster size. We would like to note that although
48
cluster geometries vary substantially, the ion-ion separations in the larger clusters on
average approach crystal-like values. For example, the Na+ - Cl- separations of about
0.285 nm (equilibrium bond length found in NaCl crystals) are found for the clusters with
N > 30. Presumably, these clusters will have the potential to exhibit crystalline character.
3.5 Conclusions Using MD simulations we have investigated the kinetics of formation of sodium
chloride clusters in supercritical water over wide range of state conditions. The cluster
size distributions, the size of critical nuclei and cluster life-times are reported. The size
distribution of emerging clusters shows a very strong dependence on the system’s
density, with larger clusters formed at lower densities. The clusters consisting of
approximately 14 to 24 ions appear critical for the thermodynamic states examined. The
cluster – cluster fusion events seem to be important in the formation of larger particles,
particularly at low densities. The life-time values for clusters containing more than 20
ions are found to be on the order of 10 ps. We have calculated the nucleation rates, which
appear to be on the order of 1028 cm-3s-1. We have also probed the degree of local order in
emerging clusters, and it appears to be amorphous. Whereas this simulation work
provides molecular-level insights into the crucial nucleation events, further simulations
using larger samples are necessary to provide a direct comparison with experimental data
on nucleation 5, 26 and to observe formation of regular crystalline particles.
49
3.6 References (1) Bellows, J.C.; In: Water, Steam and Aqueous Solutions for Electric Power;
Nakahara, M.; Matubayasi, N.; Ueno, M.; Yasuoka, K.; Watanabe, K. Eds.; Maruzen Co. Ltd.: Tokyo, 2005; p612.
(2) Galobardes, J.F.; Van Hare, D.R.; Rogers, L.B. J. Chem. Eng. Data. 1981, 26, 363. (3) Hong, G.T.; Armellini, F.J.; Tester, J.W.; In: Physical Chemistry of Aqueous
Systems; White Jr., H.J.; Sengers, J.V.; Neumann D.B.; Bellows, J.C. Eds.; Begell House: New York, 1994; p565.
(4) Pitzer, K.S. Int. J. Thermophysics. 1998, 19, 2. (5) Armellini, F.J.; Tester, J.W. J. Supercrit. Fluids. 1991, 4, 254. (6) Bischoff, J.L. Am. J. Sci. 1991, 291, 309. (7) Maksimov, I.L. Crystallography Reports 2002, 47, 105. (8) Debenedetti, P.G.; In: Metastable Liquids: Concept and Principles; Princeton Press:
New Jersey, 1996. (9) Ostwald, W. Z. Phys. Chem. 1897, 22, 289. (10) Katz, J.L. Pure & Appl. Chem. 1992, 64, 1661. (11) Mokross, B.J. J. Non-Cryst. Solids 2001, 284, 91. (12) Lummen, N.; Kvamme, B.; Phys. Chem. Chem. Phys. 2007, 9 (25), 3251-3260. (13) Gasser, U.; Weeks, E.R.; Schofield, A.; Pusey, P.N.; Weitz, D.A. Science. 2001, 292, 258. (14) Lyubartsev, A.P.; Laaksonen, A. Comput. Phys. Commun. 2000, 128, 565. (15) Berendsen, H.J.C.; Grigera, J.R.; Straatsma, T.P. J. Phys. Chem. 1987, 91, 6269. (16) Smith, D.E.; Dang, L.X. J. Chem. Phys. 1994, 100, 3757. (17) Ryckaert, J.P.; Ciccotti, G.; Berendsen, H.J.C. J. Comput. Phys. 1977, 23, 327. (18) Nosé, S. Mol. Phys. 1984, 52, 255. (19) Lyubartsev, A.P.; Laaksonen, A. J. Phys. Chem. 1996, 100, 16410.
50
(20) Yasuoka, K.; Matsumoto, M. J. Chem. Phys. 1998, 109, 8451. (21) Huitema, H.E.A.; van der Eerden, J.P; Janssen, J.J.M.; Human, H. Phys. Rev. B. 2000, 62, 14690. (22) ten Wolde, P.R.; Ruiz-Montero, M.J.; Frenkel, D. J. Chem. Phys. 1999, 110, 1591. (23) ten Wolde, P.R.; Ruiz-Montero, M.J.; Frenkel, D. J. Chem. Phys. 1996, 104, 9932. (24) Valeriani, C.; Sanz, E.; Frenkel, D. J. Chem. Phys. 2005, 122, 194501. (25) Grosberg, A.Y.; Khokhlov, AR.; In: Statistical Physics of Macromolecules, Atanov, Y.A. Ed.; AIP Press: New York, 1994. (26) Strey, R.; Wagner, P.E.; Viisanen, Y. J. Phys. Chem. 1994, 98, 7748.
51
Chapter 4
Simulating hydrothermal synthesis of ionic nanoparticles 2
4.0 Introduction Crystal engineering involves the design and synthesis of solid-state structures with
desired properties and is based on the understanding and utilization of intermolecular
interactions. Building crystals involves the assembly of small units, or synthons, on the
nanoscale creating macroscopic structures which exhibit the structural character of the
synthon.1 Bulk solids typically exist in some thermodynamically preferred structures, but
on the nanoscale these structures may not be the favoured ones, thus adopting other
configurations. It is well-known that metal clusters can change between icosahedral,
dodecahedral and close-packed morphologies. Salt clusters are generally assumed to have
one energetically favourable morphology. Numerous investigations have shown, for
example, that multiple isomers of sodium chloride clusters with more then 20 atoms tend
to form cuboidal fragments of a close-packed (rocksalt) lattice. For small clusters, that
cannot form such structures, different geometries have been suggested.
Polymorphism2 was not fully understood and utilized in the earlier days of crystal
engineering but is now one of the most interesting areas of research. Initial synthetic
work on polymorphism focused on hydrogen bonding and π-π stacking in organic
systems3, 4 and with recent extensions to inorganic systems3, 5 involving coordination
bonds to a metallic center. Ionic interactions have not received as much interest even
though they are conceptually the simplest type of bond to understand.6 In this paper we
2 A similar but modified version of this chapter has been submitted to PCCP. It is currently under review.
52
present the results of a numerical investigation of sodium chloride clusters that have been
formed hydrothermally and rapidly quenched, resulting in a variety of nanostructures
including those that do not assemble into a cuboid.
In a prior work7 we have explored the properties of supercritical water (SCW) as a
tuneable medium from which various cluster sizes can be selected depending on their
nucleation rates and arrival (nucleation lag) times. The uniqueness of supercritical water
as a solvent is that the solubility of a material, to a large extent, can be controlled (small
changes in pressure give rise to large changes in density and solvent power), which can
be exploited in materials processing. The clusters observed in SCW are in an amorphous
state, due to the high temperature and hydrating environment. The ion-dipole interactions
present between water molecules and the cluster yield numerous structural arrangements,
with some water molecules being trapped inside the cluster, as a result this does not bias
any one potential structure. Motivated by this observation, we have simulated rapid
quenching of supercritical sodium chloride solutions into a low temperature, low density
argon gas. This induces the removal of trapped and hydrating water molecules, thus
allowing the emerging NaCl clusters to restructure (crystallize) into more stable, compact
entities.
Primary focus will be on the structure of clusters with sizes up to 32 ions, with
some mention of larger clusters. The distinction between nano and bulk has somewhat of
a blurred definition, as such, is one of the central questions in cluster science. Clusters are
sometimes regarded as confined bulk solids, whereas other approaches treat clusters as a
large molecule. Clusters that are on the size order of nanometres, show properties that are
atypical to bulk systems. Both electric fields and mechanical strain vary from one atomic
53
site to another, depending highly on the shape of the cluster and positions of the ions. In
an ionic cluster, the mere removal or addition of a single ion can give a large change in
the internal stability (cohesive energy). Equilibrium configurations obtained by quantum
mechanical calculations for NaCl clusters containing up to 70 ions have been well
characterized in the past with good structural agreement between the works.8, 9
Abundance patterns from mass spectra are also important sources of cluster information.
Examples of structural transitions have been seen in these “gas-phase” experiments, with
the measured populations showing particularly stable clusters known as "magic clusters".
These clusters exist in the lowest energy morphology and have been explained by using
either electronic or structural models. Structurally they correspond to cubic close packed
(ccp) fragments resembling the bulk rock-salt crystal lattice.10, 11 Experiments to date
have shown that alkali halide clusters tend to form face centered cubic (fcc) lattice
fragments for particles with more than 20 atoms.10-12 Direct experimental determination
of the spatial distribution of atoms or molecules in a cluster is a very difficult task, hence
the turn to simulation studies. Simulations have shown the emergence of both cubic
clusters and cuboids fused with hexagonal rings.9
The second area of interest in this study is the dynamic behaviour of these clusters.
The timescales of interest here are those associated with the ion - ion vibrations and
rotations of the cluster as a whole. One of the traditional links between experiments in
condensed matter physics and numerical simulations has been the vibrational frequency
distribution, or the density of states (DOS), yielding information about the microstructure
and related dynamical processes.13-19 Whereas the diatomics (such as the NaCl molecule)
possess only one absorption line, intermediate cluster sizes yield complex vibrational
54
spectra characterizing individual structural units and their interactions. The dynamic
behaviour of clusters as they pass from one configuration to another can be monitored by
following the rotations and vibrations of the cluster. Configurational changes in the
cluster alter its vibrational spectrum, and are seen as changes to the intensities and
displacements of the characteristic peaks, giving each cluster a unique frequency
signature. The high-frequency vibrational bands in nanoclusters are usually blue shifted
with respect to that of bulk crystals.13 Other manifestations of configurational changes
have been reported from experimental spectra of nanocrystals 14-16, such as the
enhancement of the low-frequency modes, as well as the effects of pressure and
surrounding medium.16, 17
Finally, this work is to emphasize the importance of hydrothermally generated
small nanoparticles for the synthetic work. These nanoparticles are a mixture of
thermodynamic and kinetic (e.g. quenched metastable) products.2 In the latter case,
particle transformation into a more stable configuration may require breakage of
chemical bonds and/or change of coordination (shape); hence, their mechanical stability.
In practice, it can lead to the production of powders and composite materials with
controllable shape and morphology. Other potential interest is their use as crystallization
seeds and synthons for larger nanostructures.
4.1 Computational Details
The systems investigated here contain the commonly occurring sodium chloride
clusters homogeneously nucleated in supercritical water and quenched in a low density
argon bath. To do this, we have first generated the NaCl cluster populations form the
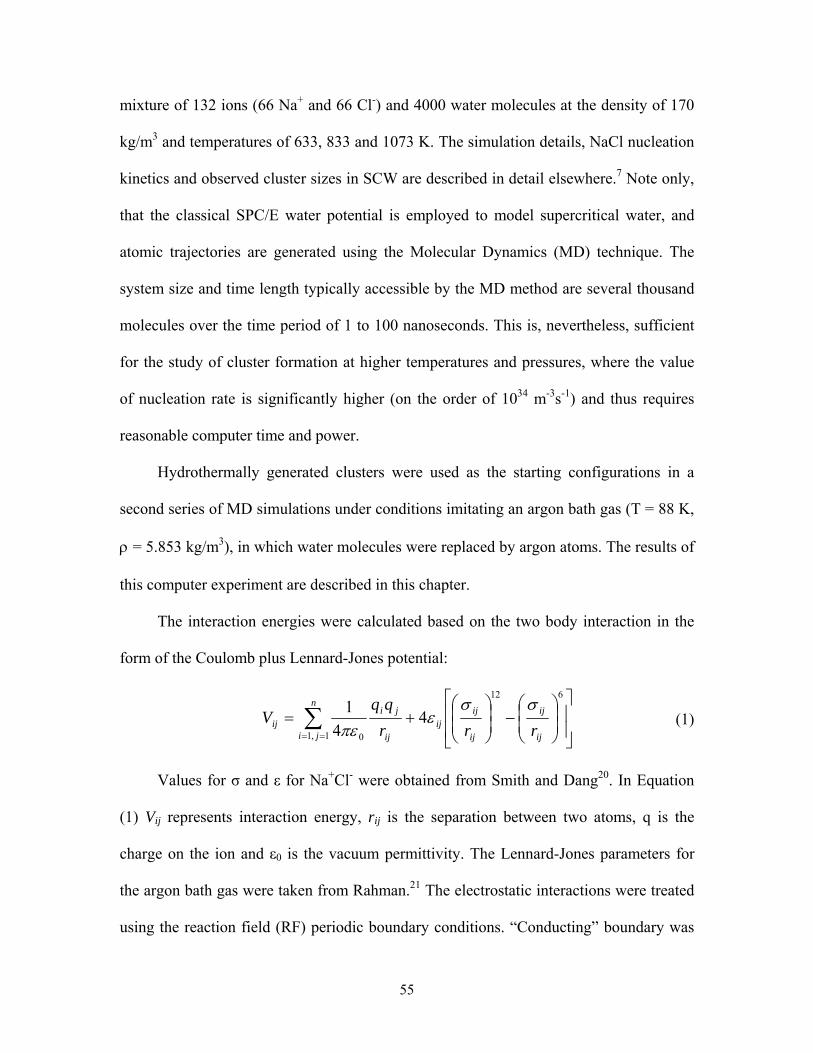
55
mixture of 132 ions (66 Na+ and 66 Cl-) and 4000 water molecules at the density of 170
kg/m3 and temperatures of 633, 833 and 1073 K. The simulation details, NaCl nucleation
kinetics and observed cluster sizes in SCW are described in detail elsewhere.7 Note only,
that the classical SPC/E water potential is employed to model supercritical water, and
atomic trajectories are generated using the Molecular Dynamics (MD) technique. The
system size and time length typically accessible by the MD method are several thousand
molecules over the time period of 1 to 100 nanoseconds. This is, nevertheless, sufficient
for the study of cluster formation at higher temperatures and pressures, where the value
of nucleation rate is significantly higher (on the order of 1034 m-3s-1) and thus requires
reasonable computer time and power.
Hydrothermally generated clusters were used as the starting configurations in a
second series of MD simulations under conditions imitating an argon bath gas (T = 88 K,
ρ = 5.853 kg/m3), in which water molecules were replaced by argon atoms. The results of
this computer experiment are described in this chapter.
The interaction energies were calculated based on the two body interaction in the
form of the Coulomb plus Lennard-Jones potential:
⎥⎥
⎦
⎤
⎢⎢
⎣
⎡
⎟⎟⎠
⎞⎜⎜⎝
⎛−⎟
⎟⎠
⎞⎜⎜⎝
⎛+= ∑
==
612
1,1 0
44
1
ij
ij
ij
ijij
n
ji ij
jiij rrr
qqV
σσε
πε (1)
Values for σ and ε for Na+Cl- were obtained from Smith and Dang20. In Equation
(1) Vij represents interaction energy, rij is the separation between two atoms, q is the
charge on the ion and ε0 is the vacuum permittivity. The Lennard-Jones parameters for
the argon bath gas were taken from Rahman.21 The electrostatic interactions were treated
using the reaction field (RF) periodic boundary conditions. “Conducting” boundary was

56
assumed with the RF and Lennard-Jones interaction cut-off radius being set at half of the
cubic cell length. The simulations were performed in the canonical NVT ensemble with
temperature controlled by an isokinetic Gaussian thermostat. Equations of motions were
integrated using the Gear predictor-corrector algorithm with a time step of 0.5 fs. The
simulation run times were 500 ps long.
The velocity autocorrelation functions where Fourier transformed, yielding the
power spectra corresponding to the density of vibrational states:
dtevtvC tiV
ω
πω −
∞
∞−∫ ⋅= )0()(
21)( , (2)
where v(t) represents the atomic velocity, CV(ω) and ω correspond to the intensity and
frequency of the vibrational states, respectively. This study was conducted using a
Transport GX28 parallel system containing dual 64 bit AMD Opteron processors running
under Linux.
4.2 Results and Discussion
4.2.1 Structure and binding energy
Our first focus will be on ion separations and cohesive (binding) energy. As
mentioned above, atomic coordinates from “real” NaCl particles, nucleated in
supercritical water were used as the starting configurations for argon solvent quench.
These configurations were brought to a low temperature and density environment
(representing argon gas above its liquid at atmospheric pressure) and allowed to
equilibrate for 0.5 ns.
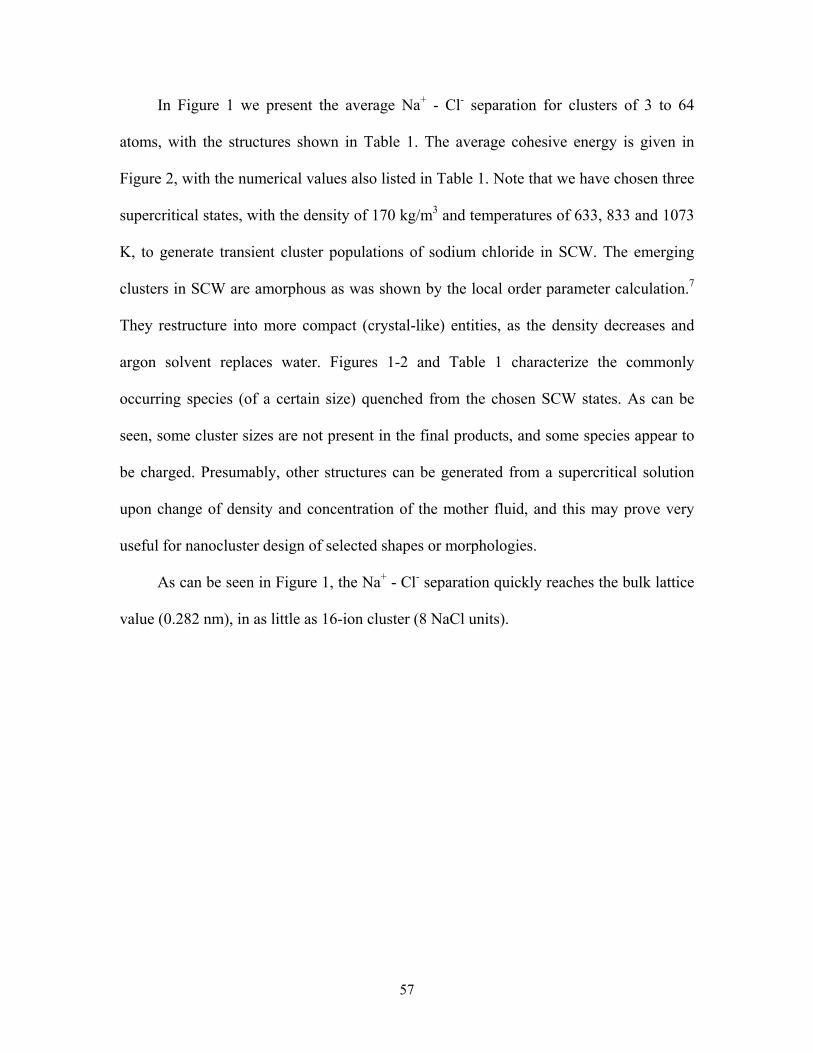
57
In Figure 1 we present the average Na+ - Cl- separation for clusters of 3 to 64
atoms, with the structures shown in Table 1. The average cohesive energy is given in
Figure 2, with the numerical values also listed in Table 1. Note that we have chosen three
supercritical states, with the density of 170 kg/m3 and temperatures of 633, 833 and 1073
K, to generate transient cluster populations of sodium chloride in SCW. The emerging
clusters in SCW are amorphous as was shown by the local order parameter calculation.7
They restructure into more compact (crystal-like) entities, as the density decreases and
argon solvent replaces water. Figures 1-2 and Table 1 characterize the commonly
occurring species (of a certain size) quenched from the chosen SCW states. As can be
seen, some cluster sizes are not present in the final products, and some species appear to
be charged. Presumably, other structures can be generated from a supercritical solution
upon change of density and concentration of the mother fluid, and this may prove very
useful for nanocluster design of selected shapes or morphologies.
As can be seen in Figure 1, the Na+ - Cl- separation quickly reaches the bulk lattice
value (0.282 nm), in as little as 16-ion cluster (8 NaCl units).
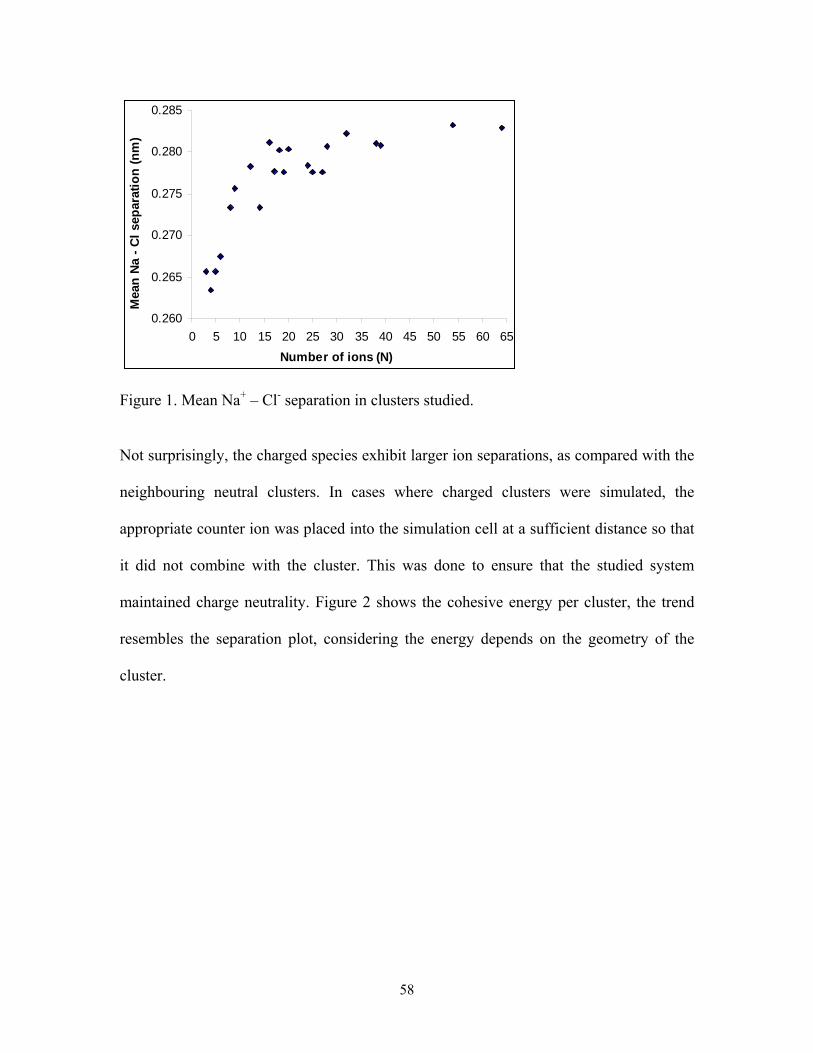
58
0.260
0.265
0.270
0.275
0.280
0.285
0 5 10 15 20 25 30 35 40 45 50 55 60 65Number of ions (N)
Mea
n Na
- Cl
sep
arat
ion
(nm
)
Figure 1. Mean Na+ – Cl- separation in clusters studied.
Not surprisingly, the charged species exhibit larger ion separations, as compared with the
neighbouring neutral clusters. In cases where charged clusters were simulated, the
appropriate counter ion was placed into the simulation cell at a sufficient distance so that
it did not combine with the cluster. This was done to ensure that the studied system
maintained charge neutrality. Figure 2 shows the cohesive energy per cluster, the trend
resembles the separation plot, considering the energy depends on the geometry of the
cluster.
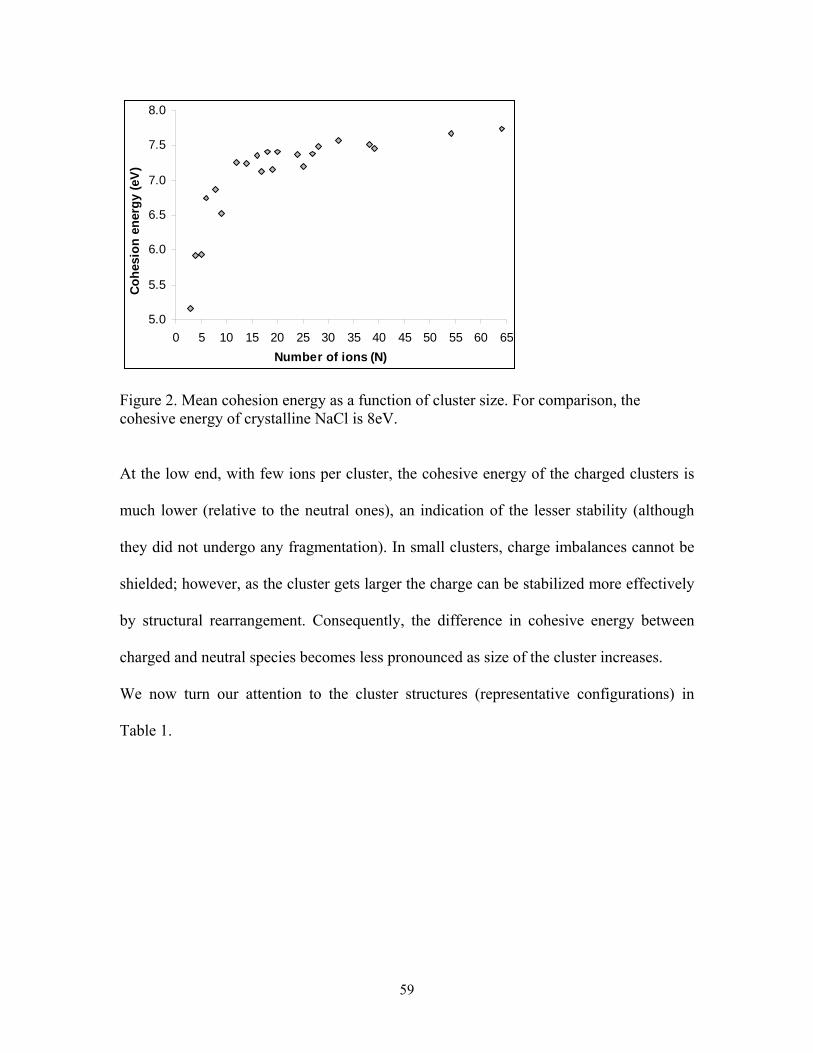
59
5.0
5.5
6.0
6.5
7.0
7.5
8.0
0 5 10 15 20 25 30 35 40 45 50 55 60 65Number of ions (N)
Cohe
sion
ene
rgy
(eV)
Figure 2. Mean cohesion energy as a function of cluster size. For comparison, the cohesive energy of crystalline NaCl is 8eV.
At the low end, with few ions per cluster, the cohesive energy of the charged clusters is
much lower (relative to the neutral ones), an indication of the lesser stability (although
they did not undergo any fragmentation). In small clusters, charge imbalances cannot be
shielded; however, as the cluster gets larger the charge can be stabilized more effectively
by structural rearrangement. Consequently, the difference in cohesive energy between
charged and neutral species becomes less pronounced as size of the cluster increases.
We now turn our attention to the cluster structures (representative configurations) in
Table 1.
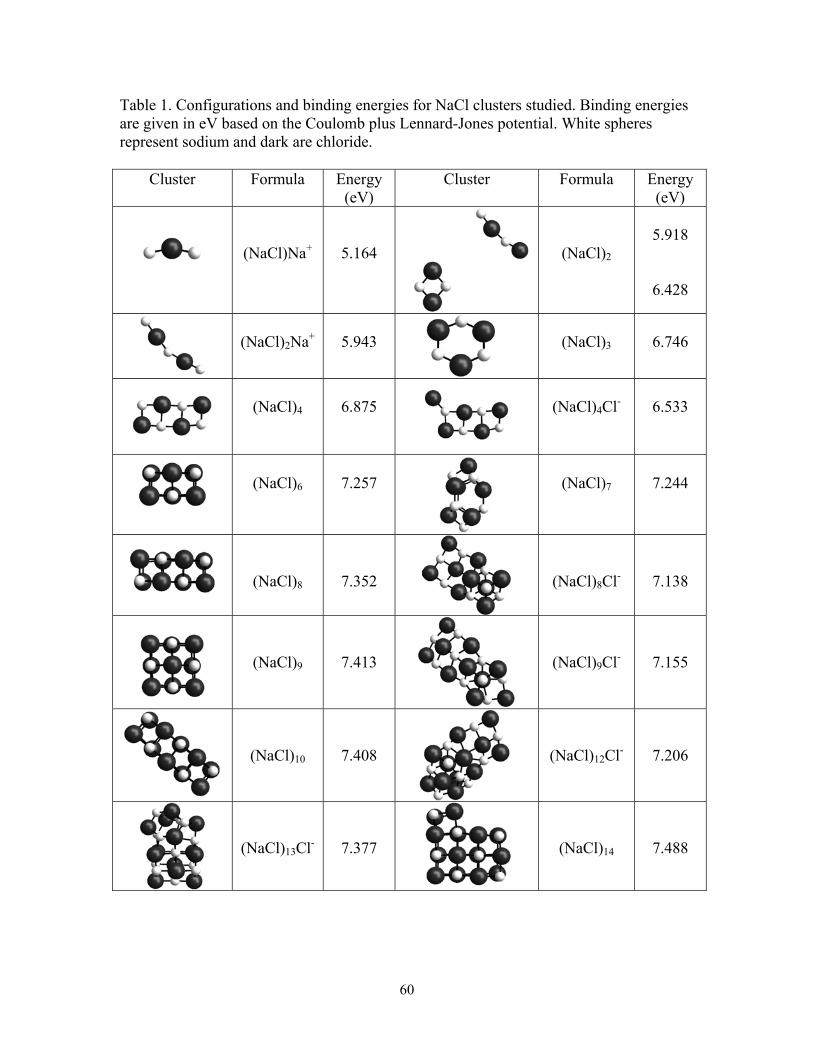
60
Table 1. Configurations and binding energies for NaCl clusters studied. Binding energies are given in eV based on the Coulomb plus Lennard-Jones potential. White spheres represent sodium and dark are chloride.
Cluster Formula Energy (eV)
Cluster Formula Energy (eV)
(NaCl)Na+
5.164
(NaCl)2
5.918
6.428
(NaCl)2Na+
5.943
(NaCl)3
6.746
(NaCl)4
6.875
(NaCl)4Cl-
6.533
(NaCl)6
7.257
(NaCl)7
7.244
(NaCl)8
7.352
(NaCl)8Cl-
7.138
(NaCl)9
7.413
(NaCl)9Cl-
7.155
(NaCl)10
7.408
(NaCl)12Cl-
7.206
(NaCl)13Cl-
7.377
(NaCl)14
7.488
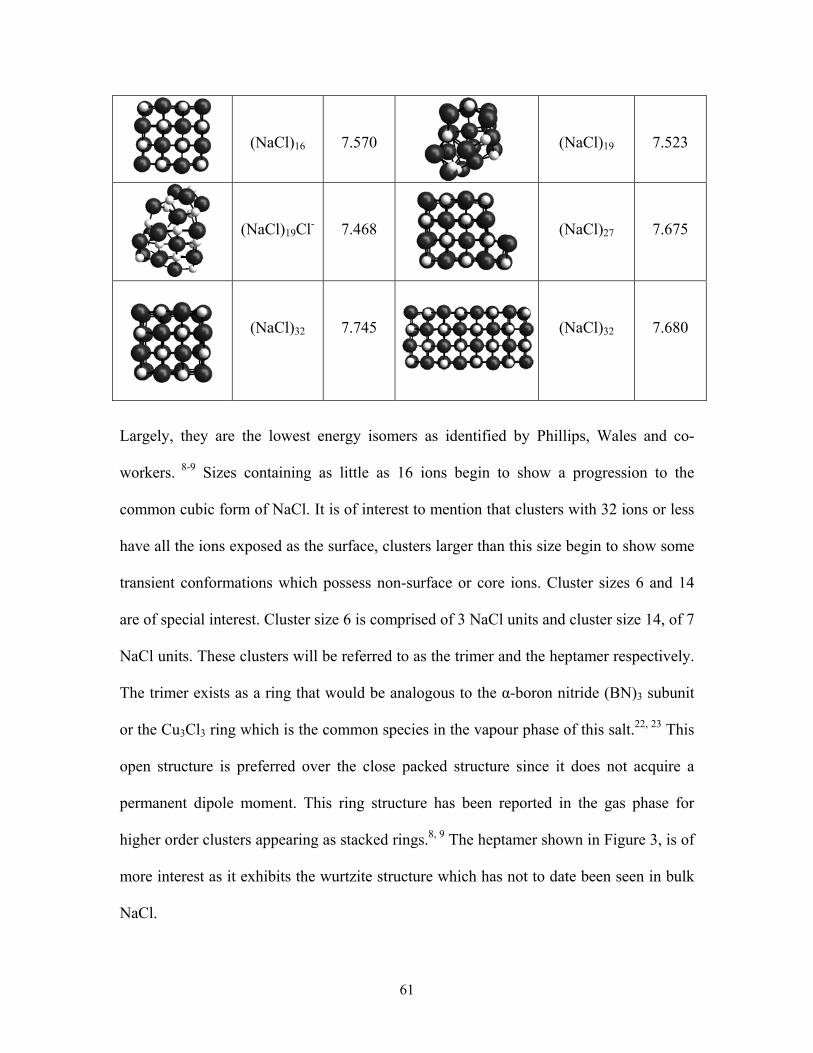
61
(NaCl)16
7.570
(NaCl)19
7.523
(NaCl)19Cl-
7.468
(NaCl)27
7.675
(NaCl)32
7.745
(NaCl)32
7.680
Largely, they are the lowest energy isomers as identified by Phillips, Wales and co-
workers. 8-9 Sizes containing as little as 16 ions begin to show a progression to the
common cubic form of NaCl. It is of interest to mention that clusters with 32 ions or less
have all the ions exposed as the surface, clusters larger than this size begin to show some
transient conformations which possess non-surface or core ions. Cluster sizes 6 and 14
are of special interest. Cluster size 6 is comprised of 3 NaCl units and cluster size 14, of 7
NaCl units. These clusters will be referred to as the trimer and the heptamer respectively.
The trimer exists as a ring that would be analogous to the α-boron nitride (BN)3 subunit
or the Cu3Cl3 ring which is the common species in the vapour phase of this salt.22, 23 This
open structure is preferred over the close packed structure since it does not acquire a
permanent dipole moment. This ring structure has been reported in the gas phase for
higher order clusters appearing as stacked rings.8, 9 The heptamer shown in Figure 3, is of
more interest as it exhibits the wurtzite structure which has not to date been seen in bulk
NaCl.
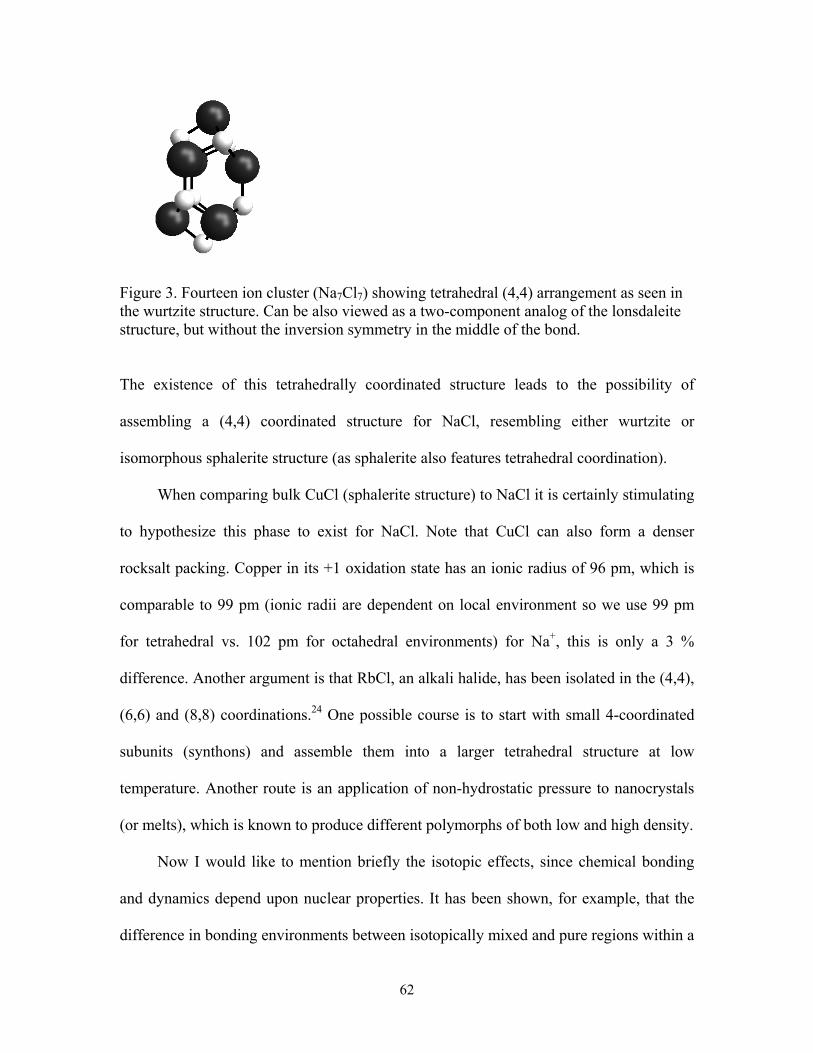
62
Figure 3. Fourteen ion cluster (Na7Cl7) showing tetrahedral (4,4) arrangement as seen in the wurtzite structure. Can be also viewed as a two-component analog of the lonsdaleite structure, but without the inversion symmetry in the middle of the bond.
The existence of this tetrahedrally coordinated structure leads to the possibility of
assembling a (4,4) coordinated structure for NaCl, resembling either wurtzite or
isomorphous sphalerite structure (as sphalerite also features tetrahedral coordination).
When comparing bulk CuCl (sphalerite structure) to NaCl it is certainly stimulating
to hypothesize this phase to exist for NaCl. Note that CuCl can also form a denser
rocksalt packing. Copper in its +1 oxidation state has an ionic radius of 96 pm, which is
comparable to 99 pm (ionic radii are dependent on local environment so we use 99 pm
for tetrahedral vs. 102 pm for octahedral environments) for Na+, this is only a 3 %
difference. Another argument is that RbCl, an alkali halide, has been isolated in the (4,4),
(6,6) and (8,8) coordinations.24 One possible course is to start with small 4-coordinated
subunits (synthons) and assemble them into a larger tetrahedral structure at low
temperature. Another route is an application of non-hydrostatic pressure to nanocrystals
(or melts), which is known to produce different polymorphs of both low and high density.
Now I would like to mention briefly the isotopic effects, since chemical bonding
and dynamics depend upon nuclear properties. It has been shown, for example, that the
difference in bonding environments between isotopically mixed and pure regions within a
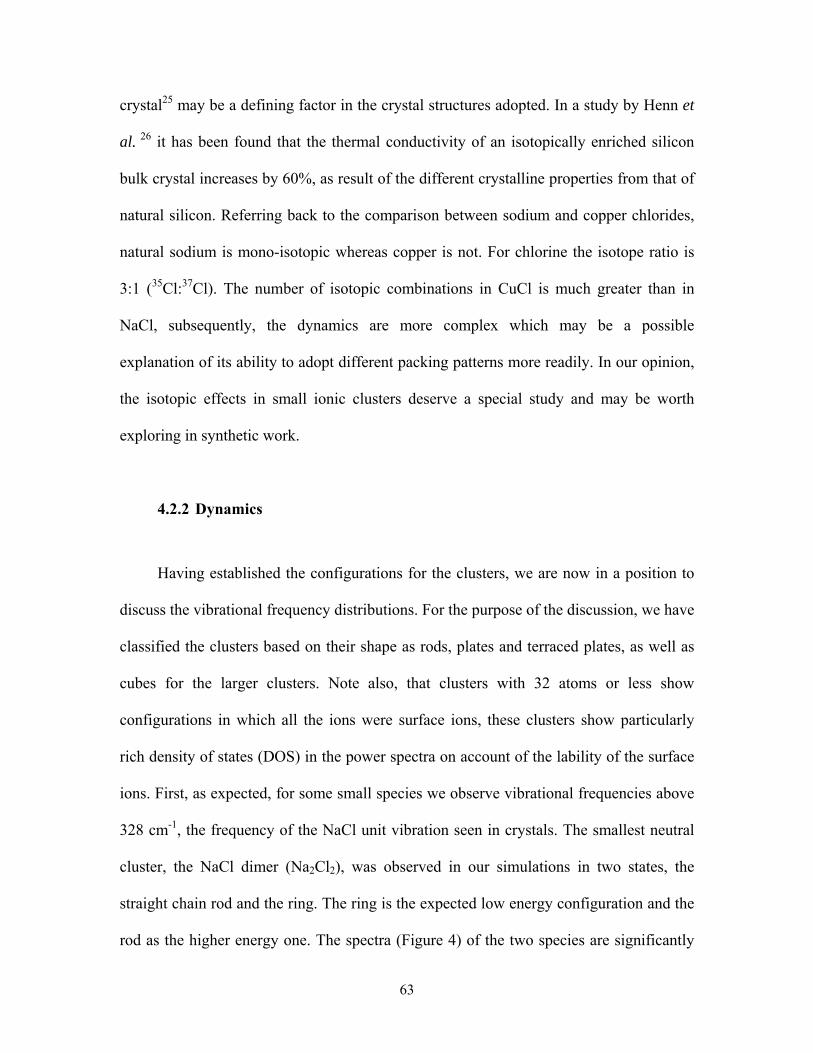
63
crystal25 may be a defining factor in the crystal structures adopted. In a study by Henn et
al. 26 it has been found that the thermal conductivity of an isotopically enriched silicon
bulk crystal increases by 60%, as result of the different crystalline properties from that of
natural silicon. Referring back to the comparison between sodium and copper chlorides,
natural sodium is mono-isotopic whereas copper is not. For chlorine the isotope ratio is
3:1 (35Cl:37Cl). The number of isotopic combinations in CuCl is much greater than in
NaCl, subsequently, the dynamics are more complex which may be a possible
explanation of its ability to adopt different packing patterns more readily. In our opinion,
the isotopic effects in small ionic clusters deserve a special study and may be worth
exploring in synthetic work.
4.2.2 Dynamics
Having established the configurations for the clusters, we are now in a position to
discuss the vibrational frequency distributions. For the purpose of the discussion, we have
classified the clusters based on their shape as rods, plates and terraced plates, as well as
cubes for the larger clusters. Note also, that clusters with 32 atoms or less show
configurations in which all the ions were surface ions, these clusters show particularly
rich density of states (DOS) in the power spectra on account of the lability of the surface
ions. First, as expected, for some small species we observe vibrational frequencies above
328 cm-1, the frequency of the NaCl unit vibration seen in crystals. The smallest neutral
cluster, the NaCl dimer (Na2Cl2), was observed in our simulations in two states, the
straight chain rod and the ring. The ring is the expected low energy configuration and the
rod as the higher energy one. The spectra (Figure 4) of the two species are significantly
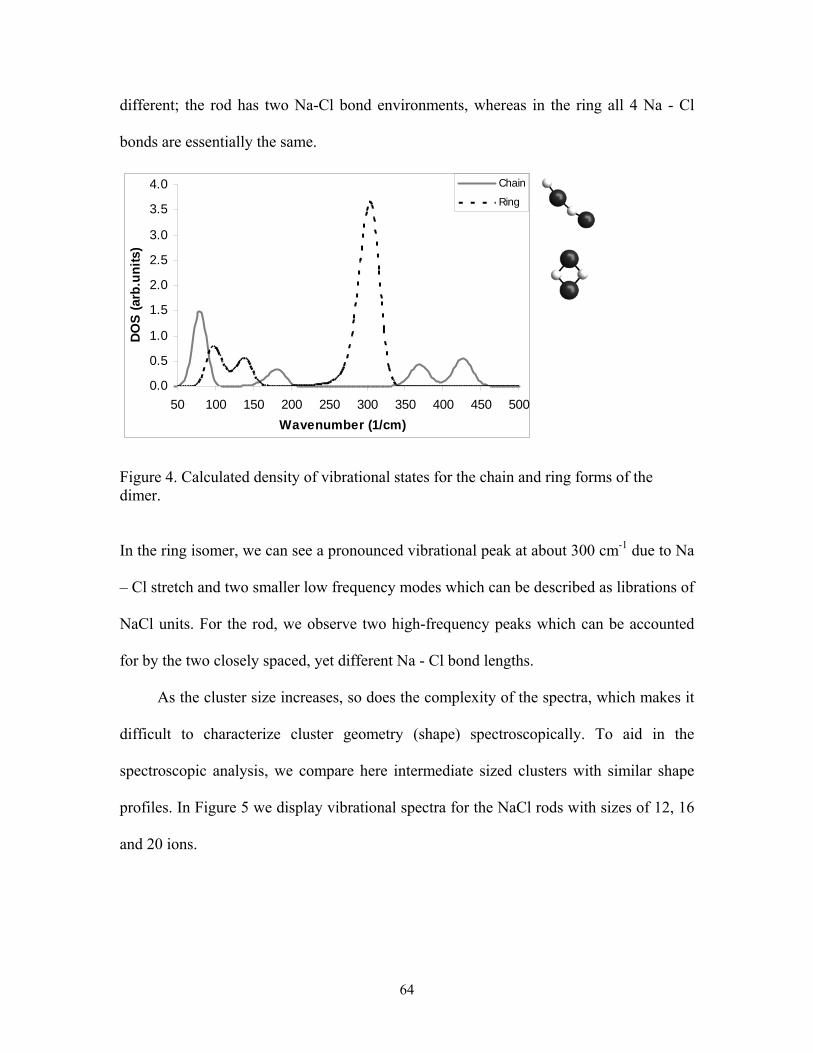
64
different; the rod has two Na-Cl bond environments, whereas in the ring all 4 Na - Cl
bonds are essentially the same.
0.0
0.5
1.0
1.5
2.0
2.5
3.0
3.5
4.0
50 100 150 200 250 300 350 400 450 500Wavenumber (1/cm)
DOS
(arb
.uni
ts)
Chain
Ring
Figure 4. Calculated density of vibrational states for the chain and ring forms of the dimer.
In the ring isomer, we can see a pronounced vibrational peak at about 300 cm-1 due to Na
– Cl stretch and two smaller low frequency modes which can be described as librations of
NaCl units. For the rod, we observe two high-frequency peaks which can be accounted
for by the two closely spaced, yet different Na - Cl bond lengths.
As the cluster size increases, so does the complexity of the spectra, which makes it
difficult to characterize cluster geometry (shape) spectroscopically. To aid in the
spectroscopic analysis, we compare here intermediate sized clusters with similar shape
profiles. In Figure 5 we display vibrational spectra for the NaCl rods with sizes of 12, 16
and 20 ions.
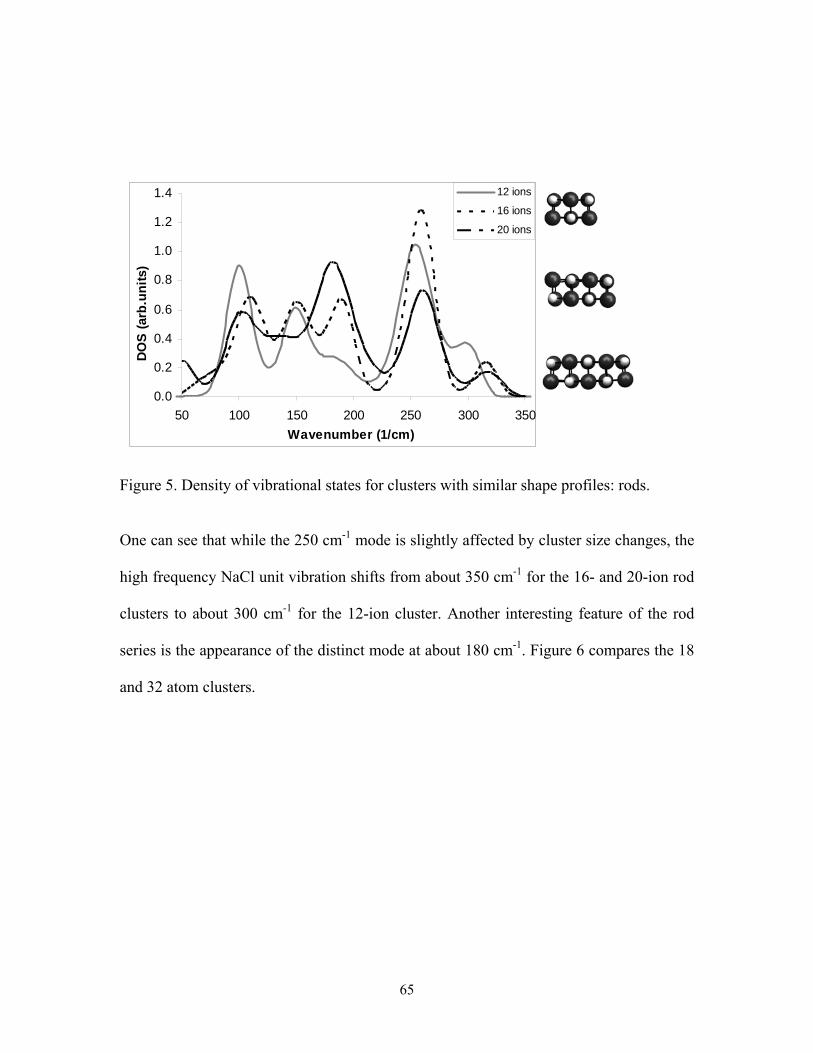
65
Figure 5. Density of vibrational states for clusters with similar shape profiles: rods.
One can see that while the 250 cm-1 mode is slightly affected by cluster size changes, the
high frequency NaCl unit vibration shifts from about 350 cm-1 for the 16- and 20-ion rod
clusters to about 300 cm-1 for the 12-ion cluster. Another interesting feature of the rod
series is the appearance of the distinct mode at about 180 cm-1. Figure 6 compares the 18
and 32 atom clusters.
0.0
0.2
0.4
0.6
0.8
1.0
1.2
1.4
50 100 150 200 250 300 350Wavenumber (1/cm)
DO
S (a
rb.u
nits
)
12 ions
16 ions
20 ions
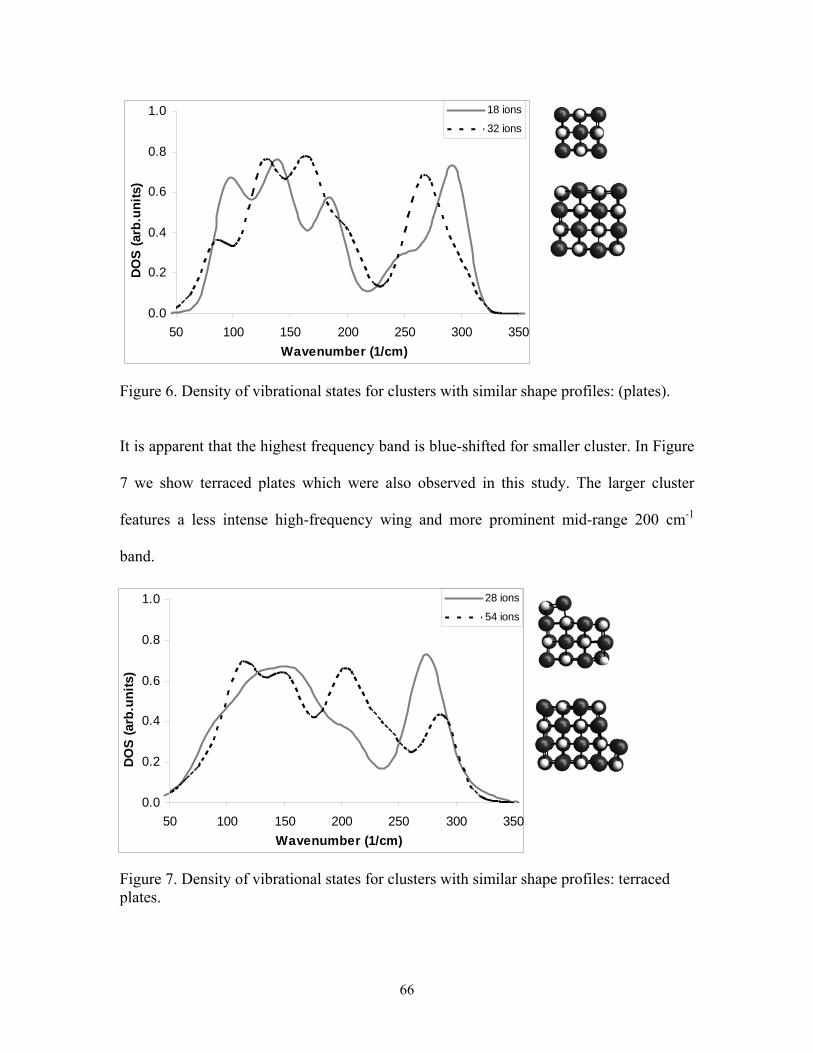
66
Figure 6. Density of vibrational states for clusters with similar shape profiles: (plates).
It is apparent that the highest frequency band is blue-shifted for smaller cluster. In Figure
7 we show terraced plates which were also observed in this study. The larger cluster
features a less intense high-frequency wing and more prominent mid-range 200 cm-1
band.
Figure 7. Density of vibrational states for clusters with similar shape profiles: terraced plates.
0.0
0.2
0.4
0.6
0.8
1.0
50 100 150 200 250 300 350Wavenumber (1/cm)
DO
S (a
rb.u
nits
)
18 ions
32 ions
0.0
0.2
0.4
0.6
0.8
1.0
50 100 150 200 250 300 350Wavenumber (1/cm)
DO
S (a
rb.u
nits
)
28 ions
54 ions
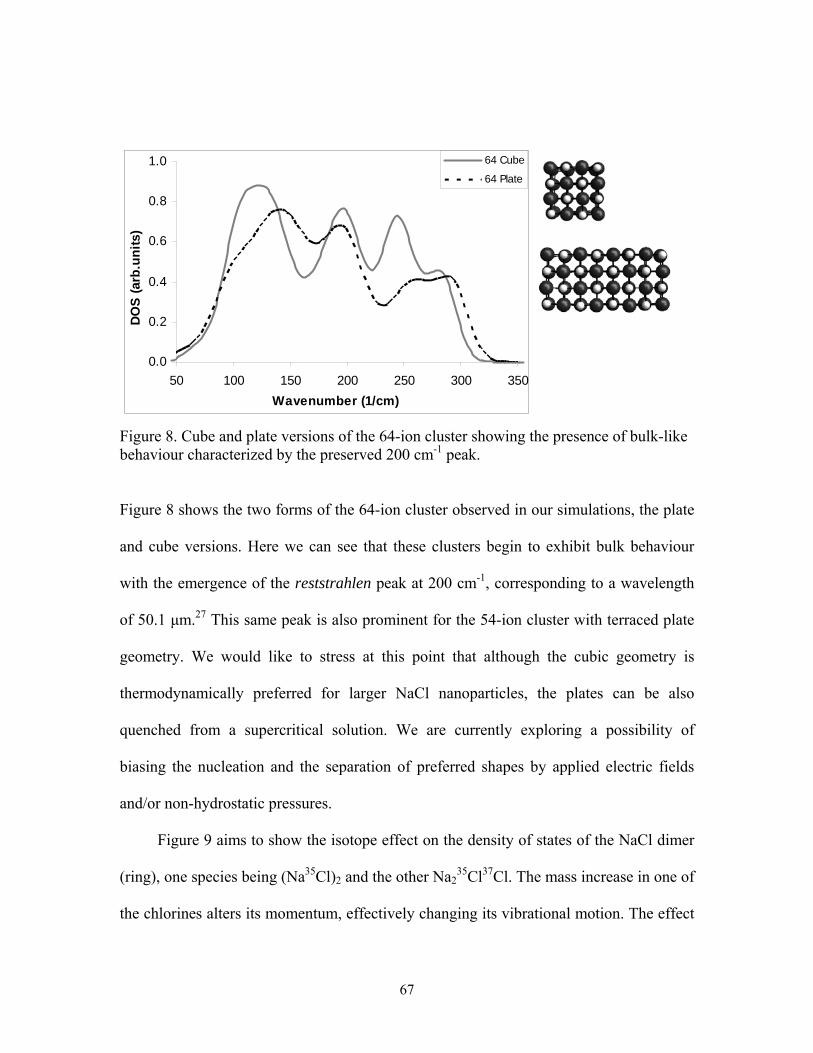
67
0.0
0.2
0.4
0.6
0.8
1.0
50 100 150 200 250 300 350Wavenumber (1/cm)
DO
S (a
rb.u
nits
)
64 Cube
64 Plate
Figure 8. Cube and plate versions of the 64-ion cluster showing the presence of bulk-like behaviour characterized by the preserved 200 cm-1 peak.
Figure 8 shows the two forms of the 64-ion cluster observed in our simulations, the plate
and cube versions. Here we can see that these clusters begin to exhibit bulk behaviour
with the emergence of the reststrahlen peak at 200 cm-1, corresponding to a wavelength
of 50.1 µm.27 This same peak is also prominent for the 54-ion cluster with terraced plate
geometry. We would like to stress at this point that although the cubic geometry is
thermodynamically preferred for larger NaCl nanoparticles, the plates can be also
quenched from a supercritical solution. We are currently exploring a possibility of
biasing the nucleation and the separation of preferred shapes by applied electric fields
and/or non-hydrostatic pressures.
Figure 9 aims to show the isotope effect on the density of states of the NaCl dimer
(ring), one species being (Na35Cl)2 and the other Na235Cl37Cl. The mass increase in one of
the chlorines alters its momentum, effectively changing its vibrational motion. The effect
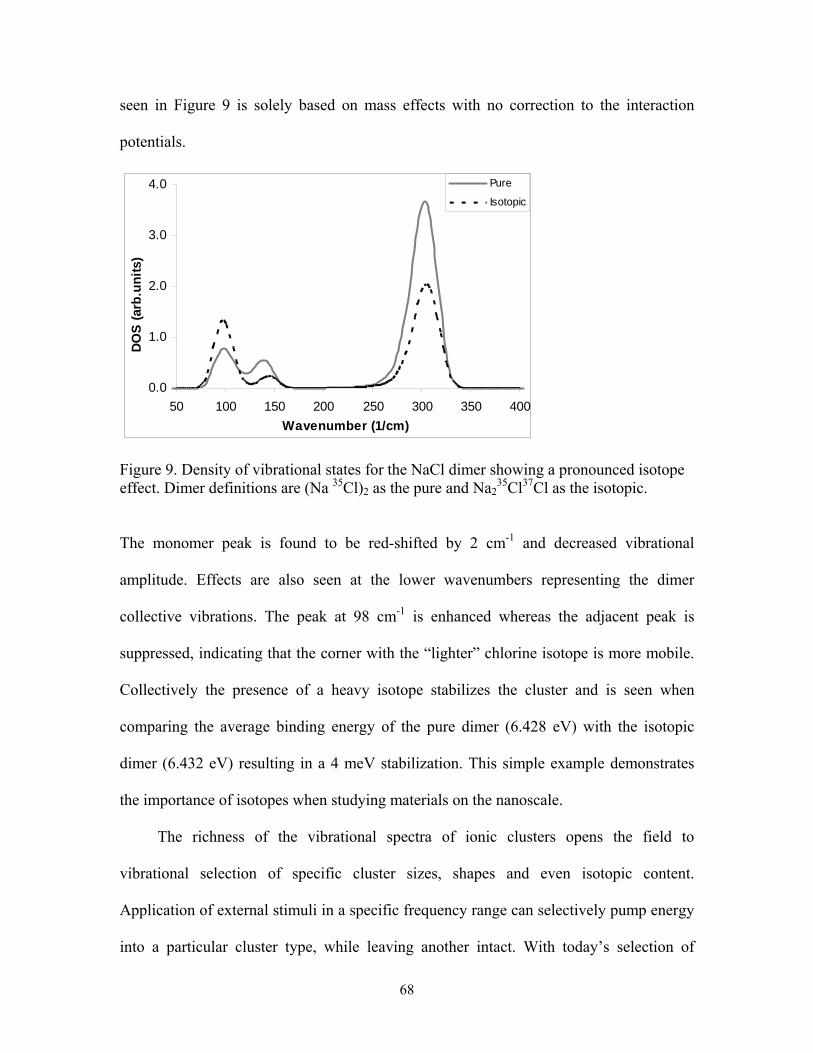
68
seen in Figure 9 is solely based on mass effects with no correction to the interaction
potentials.
0.0
1.0
2.0
3.0
4.0
50 100 150 200 250 300 350 400Wavenumber (1/cm)
DO
S (a
rb.u
nits
)
Pure
Isotopic
Figure 9. Density of vibrational states for the NaCl dimer showing a pronounced isotope effect. Dimer definitions are (Na 35Cl)2 as the pure and Na2
35Cl37Cl as the isotopic.
The monomer peak is found to be red-shifted by 2 cm-1 and decreased vibrational
amplitude. Effects are also seen at the lower wavenumbers representing the dimer
collective vibrations. The peak at 98 cm-1 is enhanced whereas the adjacent peak is
suppressed, indicating that the corner with the “lighter” chlorine isotope is more mobile.
Collectively the presence of a heavy isotope stabilizes the cluster and is seen when
comparing the average binding energy of the pure dimer (6.428 eV) with the isotopic
dimer (6.432 eV) resulting in a 4 meV stabilization. This simple example demonstrates
the importance of isotopes when studying materials on the nanoscale.
The richness of the vibrational spectra of ionic clusters opens the field to
vibrational selection of specific cluster sizes, shapes and even isotopic content.
Application of external stimuli in a specific frequency range can selectively pump energy
into a particular cluster type, while leaving another intact. With today’s selection of
69
variable IR/RF equipment, selection of a particular cluster type is within experimental
capability.
4.3 Concluding Remarks Nanomaterials designed by means of crystal engineering require a “usable” source
of raw materials, the building blocks from which the new materials will be built.
Hydrothermal synthesis in supercritical water can be used to produce very small ionic
nanoparticles. Only a few of these particles will be thermodynamically, kinetically or
statistically sustained within a set of conditions. Ionic associations are not constrained to
specific spatial orientations as in covalent bonds; thus, bonding configurations are more
flexible. This flexibility then opens the field to numerous different metastable
configurations which can be used as a synthon source in building larger nanostructures.
In this section I have examined small NaCl nanoparticles generated by rapid
quenching of supercritical aqueous solutions. These nanoparticles are a mixture of
thermodynamic and kinetic products. In particular, we have observed both the cube and
plate versions of the 64-ion cluster. Another interesting product was the NaCl heptamer,
as it exhibits the (4,4) coordination structure which is not present in bulk NaCl. We have
described their spectroscopic signatures and estimated relative stabilities (binding
energies). The main conclusion is that hydrothermal synthesis can be used to produce a
variety of small ionic cluster products; however further study is needed in nanomaterial
collection and selection subsequent to their generation. One possible suggestion is that
with application of external perturbations (such as electric fields and shear), the
nucleation process can be biased toward a specific conformation (morphology). Also,
70
isotopic effects need to be seriously considered in studies on nanomaterials due to their
effects on the dynamics and stability.
4.4 References
(1) Desiraju, G.R. Angew. Chem. Int. Ed. Engl. 1995, 34, 2311
(2) Threlfall, T. Org. Process Res. Dev. 2003, 7, 1017
(3) Desiraju, G.R. Nature, 2001, 412, 397
(4) McGrady, G.S.; Odlyha, M.; Prince, P.D.; Steed, J.W. Cryst. Eng. Comm. 2002, 4(49), 271 (5) Wang, C.F.; Zhu, Z.Y.; Zhou, X.G.; Weng, L.H.; Shen, Q.S.; Yan, Y.G. Inorg. Chem.Comm. 2006, 9, 1326 (6) Wells, A.F. Structural Inorganic Chemistry 3rd Ed., Oxford University Press, 1962
(7) Nahtigal, I.G.; Zasetsky, A.Y.; Svishchev, I.M. J. Phys. Chem. B 2008 (in press)
(8) Phillips, N.G.; Conover, C.W.S.; Bloomfield, L.A. J. Chem. Phys. 1991, 94(7), 4980 (9) Doye, J.P.K.; Wales, D.J. Phys. Rev. B., 1999, 59, 2292
(10) Campana, J.E.; Barlak, T.M.; Colton, R.J.; DeCorpo, J.J.; Wyatt, J.R.; Dunlap, B.I. Phys Rev. Lett. 1981, 47, 1046 (11) Twu, Y.J.; Conover, C.W.S.; Yang, Y.A.; Bloomfield, L.A. Phys Rev. B. 1990, 42, 5306 (12) Pflaum, R.; Pfau, P.; Sattler, K.; Recknagel, E. Surf. Sci. 1985, 156, 165
(13) Kara, A.; Rahman, T.S. Phys. Rev. Lett. 1998, 81, 1453
(14) Papandrew, A.B.; Yue, A.F.; Fultz, B.; Halevy, I.; Sturhahn, W.; Toellner, T.S.; Alp, E.E.; Mao, H. Phys. Rev. B. 2004, 69, 144301 (15) Fultz, B.; Ahn, C.C.; Alp, E.E.; Sturhahn, W.; Toellner, T.S. Phys. Rev. Lett. 1997, 79, 937
71
(16) Trampenau, J.; Bauszus, K.; Petry, W.; Herr, U. Nanostruct. Mater. 1995, 6, 551
(17) Voisin, C.; Christofilos, D.; Fatti, N.D.; Vallee, F. Physica B. 2002, 89, 316
(18) Farnworth, B.; Timusk, T. Phys. Rev. B. 1974, 10, 2799
(19) Farnworth, B.; Timusk, T. Phys. Rev. B. 1976, 14, 5119
(20) Smith, D.E.; Dang, L.X. J. Chem. Phys. 1994, 100, 3757
(21) Rahman, A. Phys. Rev. 1964, 136, 405
(22) Brewer, L.; Lofgren, N.L. JACS, 1950, 72, 3038
(23) Hargittai, M.; Schwerdtfeger, P.; Réffy, B.; Brown, R. Chem. Eur. J. 2003, 9, 327
(24) Pyper, N.C.; Kirkland, A.I.; Harding, J.H. J. Phys: Cond. Mater. 2006, 18, 683
(25) Plekhanov, V.G. Materials Science and Engineering: R: Reports, 2001, 35, 139
(26) Henn, R.W.; Asen-Palmer, M.; Gemlin, E.; Cardona, M.; Pohl, H.J.; Devyatych, G.G.; Sennikov, P.G. Solid State Comm. 2000, 115, 243 (27) Barnes, R.B. Phys. Rev. 1933, 43, 31
72
Chapter 5
Generation and integration of NaOH into NaCl clusters in supercritical water: Acid-base partitioning 3
5.0 Introduction The properties of acids and bases control much of the aqueous chemistry of
geochemical, industrial and biological systems. Their behaviour at ambient conditions is
well characterized, but at high temperatures and pressures the behaviour of acids, bases,
salts and even the auto-ionization of water are much different. Research on the solubility
of solutes at these conditions has mainly been motivated by the power industry, in efforts
to increase the efficiency of the Rankine cycle. Studies of solutes at hydrothermal
conditions are numerous in both experimental and computational aspects; however, few
researchers have studied the high temperature hydrolysis reaction of the common salt,
NaCl. This reaction is by no means a rare event; evidence of the reaction has been
reported in the past1-5 remaining largely unaddressed, consequently providing substantial
motivation for this work. Analogous reactions of CaCl2 with water at supercritical
conditions have been experimentally reported as generating significant HCl in the vapour
phase via hydrolysis,6 in addition, the salt hydrolysis reaction is also the cornerstone of
the calcium bromide cycle, a developing technology for potential large scale production
of hydrogen gas from water.7 The reaction we are addressing in this study is
NaCl(s, l) + nH2O(sc) NaOH(s, l) + HCl(g) + (n-1)H2O (1)
3 A similar but modified version of this chapter will be submitted to J. Chem. Phys.
73
At ambient conditions this reaction is endothermic with an enthalpy of 136 kJ/mol.
In aqueous solutions, hydrogen chloride and alkali hydroxides dissociate and behave
similarly to other electrolytes, however; they exhibit a strong tendency to associate at
high temperatures and low solution densities.8, 9 Salt nucleation and water hydrolysis are
complications which become quite serious when dealing with solutions at these states.
Information on the fundamental aspects of the pure hydrolysis reaction is rather
scant. The work here is concerned with the formation and partitioning of the reaction
products based on nano-scale electrostatic and kinetic driving forces. In order to gain an
understanding of the processes involved at supercritical conditions, it is necessary to
examine local electric fields and the fate of the NaCl /H2O reaction products at high
temperature and pressure conditions. This seemingly simple system is more complex than
initially expected.
Binary nucleation processes between ions and water at elevated temperatures lead
to unique chemical behaviour such as proton and/or charge transfers, resulting in the
generation of caustics, which ultimately lead to corrosion of piping and turbine blades.
Fluctuations in fluid density induce changes in ion solvation and subsequent ion
association. Regions in and surrounding the cluster tend to exhibit physicochemical and
thermodynamic behaviour, which cannot be explained by assigning any one type of phase
definition, in essence exhibiting all three. Macroscopically three phases (solid, liquid and
gas) are seen but on the spatial and temporal scale of nanoparticles these thermodynamic
phase definitions are not entirely valid, as such, a kinetic view should govern rather than
the thermodynamic view. Examining the electrostatics and kinetics of ion-ion and ion-
water interactions in solutions from sub to supercritical conditions provides a
74
fundamental understanding of the behaviour of electrolytes under these extreme
conditions.
In a series of modeling studies, I have confirmed that for strong electrolytes (e.g.,
NaCl and NaOH) the observed solute partitioning is consistent with the assumption of
complete association of electrolytes to neutral species in low-density supercritical water,
with very modest association in the high density state, even at relatively high
concentrations. For weaker electrolytes the degree of interaction with water in low
density at a given temperature and concentration is lower than at high densities, implying
higher volatility of HCl with decreasing density.8 The partitioning of electrolytes between
liquid-like and gas-like densities is an important consideration in a number of natural and
technological systems. For example, corrosion and deposition of solids has been found in
the moisture transition regions of hydrothermal power plants even under relatively
stringent guidelines for impurity limits of the feed water used in the cycle.10, 11 The
behaviour of aqueous electrolytes is of fundamental interest, in that the partitioning of
solutes between high and low densities can be interpreted in terms of the extent of
association of the solutes to neutral species.
Before beginning to envision countermeasures to corrosion and deposition
problems, the driving forces for the hydrolysis reaction such as the nano-scale kinetics,
critical densities and nanoparticle-water electrodynamics need to be understood. The
interaction of water with salt nanoparticles provides the opportunity to study the
behaviour of a highly polar molecule in asymmetric electric fields. We have confirmed
that the salts form a solid phase solution of NaCl-NaOH resulting in the effective removal
of hydroxide from the supercritical water phase, with the volatile HCl molecule
75
remaining in the supercritical phase. We provide results displaying sub-surface hydroxide
localization in amorphous NaCl clusters, surface hydroxide bound at anionic sites in the
NaCl crystallites and the preferential bonding of surface water to cationic sites. To
visualize the asymmetric electric fields we have constructed 3D electrostatic potential
contour plots of the NaCl cluster, showing regions of electric potential which are of
sufficient strength to drive the dissociation of water found in these regions.
5.1 Definition of Reaction Process
The atypical bulk properties of water are attributed to its unique structure, namely
its three-dimensional hydrogen-bonded network. Water influenced by electric fields
exhibits structural changes which alters its properties. Water which is structurally
modified due to its proximity to an ion, solid interface and/or trapped in confined spaces
is often referred to as vicinal or confined water.12 The common trait to the above
environments is the presence of strong electric fields which affect water’s ability to
hydrogen bond. In the solid and liquid state the strength by which water molecules hold
on to hydrogen depends on their hydrogen bonding.
Proton mobility has been shown to be abnormally high compared to all other ionic
species, indicating that normal ionic diffusion plays a minor role.13, 14 One theory
describing this proton mobility is the Grötthus chain mechanism which states that charge
migration is driven by successive jumps of protons from one oxygen to the next.15, 16
Onsager17 suggested that H-bonded water chains could serve as H+/OH- transfer
channels. The formation of hydroxide and hydronium/free proton is greatest when
76
bonding to the water molecule is strongest, consequently, strengthened hydrogen bonding
increases the Grötthus rate of transfer in electrical fields. Small cations possess a high
surface charge density which induces strong bonding of water around them due to the
polarization of water by ion-dipole interactions. These ion-water interactions become
partially covalent with substantial charge transfer to the solvent. Bock et al18 have
reported from quantum mechanical studies that the net charge on the Mg+2 of Mg[H2O]+2
ion/complex decreases from +2 to +1.18, which is a substantial charge transfer to the
water molecule.18 Analogous bonding and charge transfer occur around small singly
charged ions as well,19 where the cation alters the charge distribution of the water
molecule, decreasing the charge on the oxygen while increasing the positive charge on
the hydrogen.
In classical simulations the breakage and formation of bonds cannot be accurately
modelled because the electrons are not explicitly accounted for, however; if only the
initial and final state is considered one can postulate the following basic scheme. For this
scheme we focus solely on the proton transfer between a sodium bound water molecule
and an adjacent chloride ion. The proton in this hydrogen bond lies in a double potential
well, one associated with the donor and one with the acceptor. The barrier separating the
two wells becomes lower as the donor and acceptor atoms come closer, eventually
leading to a configuration that gives a symmetric proton potential with the hydrogen
belonging to either of the two atoms at any instant.
The charge carrier in this case is H+ and the driving force being the high asymmetric
electrostatic potentials flanking the water molecule. This potential drives the concerted
one step reaction where the proton is trans-located from the water to the chloride leaving
77
a tightly bound Na+OH- ion pair and a weakly interacting HCl molecule. The hydroxide
binds sodium more strongly than HCl, this, along with the high temperature dynamics
(time varying electric potential) of the cluster, quickly breaks the transfer path,
preventing recombination. The high affinity and small effective radius of OH results in
the rapid formation of a tightly bound sodium ion shell around it, essentially preventing
any further events where it can be reincorporated as an H-bond acceptor to water or HCl.
5.2 Kinetics and Thermodynamics
Hydrogen bond dynamics of water solvated anions has been studied Mallik et al20,
21 in both ambient and supercritical conditions. They report chloride-water lifetimes to be
2.4 ps at ambient and 0.23 ps at a supercritical density of 1.0 g/cm3. Experimental studies
by Kropman22 and Bakker23 show that the water chloride oscillator has vibrational
lifetime of 2.6 ps at ambient, whereas the H-bond between water molecules has a
characteristic lifetime of only 0.8ps. Our studies show that water trapped between ions or
confined to core regions of the cluster have residence times ranging from 3-15 ps. These
residence times are significantly longer than water molecules found in ion hydration
shells. Considering real water, the molecule vibrates in a number of ways24 with
vibrational periods ranging from 9-20 fs. This means that the water molecule undergoes
about 1000 intramolecular motions during its confinement time. This results in numerous
configurations where the hydrogen may exist in a symmetrical potential between oxygen
and chloride. To witness the proton transfer would require a QM approach, but based on
the QM studies involving water and small clusters (8 ions or less)5 one can provide an
extrapolation of the undertakings based on purely geometric and energetic definitions.
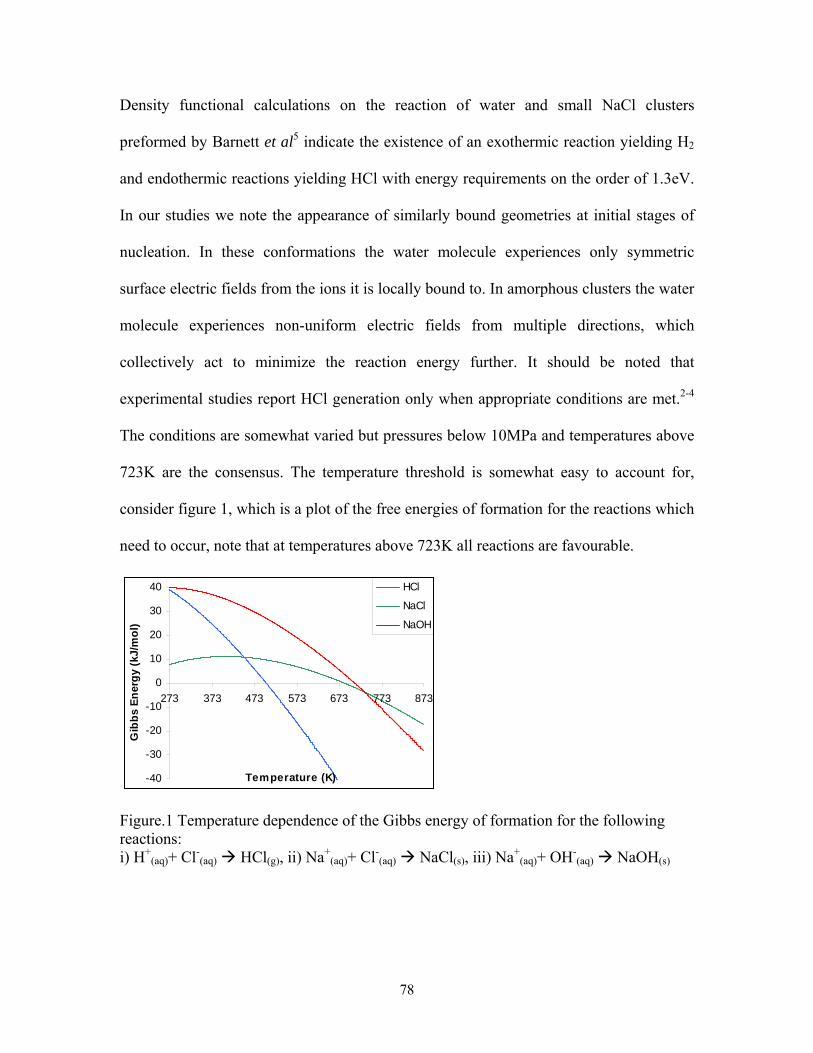
78
Density functional calculations on the reaction of water and small NaCl clusters
preformed by Barnett et al5 indicate the existence of an exothermic reaction yielding H2
and endothermic reactions yielding HCl with energy requirements on the order of 1.3eV.
In our studies we note the appearance of similarly bound geometries at initial stages of
nucleation. In these conformations the water molecule experiences only symmetric
surface electric fields from the ions it is locally bound to. In amorphous clusters the water
molecule experiences non-uniform electric fields from multiple directions, which
collectively act to minimize the reaction energy further. It should be noted that
experimental studies report HCl generation only when appropriate conditions are met.2-4
The conditions are somewhat varied but pressures below 10MPa and temperatures above
723K are the consensus. The temperature threshold is somewhat easy to account for,
consider figure 1, which is a plot of the free energies of formation for the reactions which
need to occur, note that at temperatures above 723K all reactions are favourable.
-40
-30
-20
-10
0
10
20
30
40
273 373 473 573 673 773 873
Temperature (K)
Gib
bs E
nerg
y (k
J/m
ol)
HCl
NaCl
NaOH
Figure.1 Temperature dependence of the Gibbs energy of formation for the following reactions: i) H+
(aq)+ Cl-(aq) HCl(g), ii) Na+
(aq)+ Cl-(aq) NaCl(s), iii) Na+
(aq)+ OH-(aq) NaOH(s)
79
Consequently, this temperature also corresponds to the vapour-liquid – vapour-solid
transition region of NaCl-H2O phase diagram.25 Explaining the pressure effect lies with
the density of the solution. At pressures near 10MPa the solution density can be
considered vapour-like, here hydrated clusters begin to lose significant amounts of
hydrating water molecules allowing the cluster to become more compact and crystal-like.
5.3 Electrostatics It is the purpose of this section to introduce the equations used in the determination
of the electric fields and forces within ionic clusters. The nuclei of an ion or molecule are
usually considered as point charges, and the electrons as a continuous charge distribution.
A spherically symmetric charge distribution such as an ion has no permanent dipole
moment, whereas a heteronuclear molecule can be expected to have one under the
condition that the positive and negative charges do not coincide. In the presence of an
external electric field, an atom or molecule experiences some distortion of its charge
cloud, effectively separating the centers of positive and negative charge, which affects the
total dipole moment by creating an induced dipole moment, written as:
.....21 2EEind βαµ += , (2)
where E is the electric field, α and β are the dipole polarizability and hyperpolarizibility,
respectively. Considering that the dipole moment is proportional to the separation
between two point charges:
δµ q= , (3)
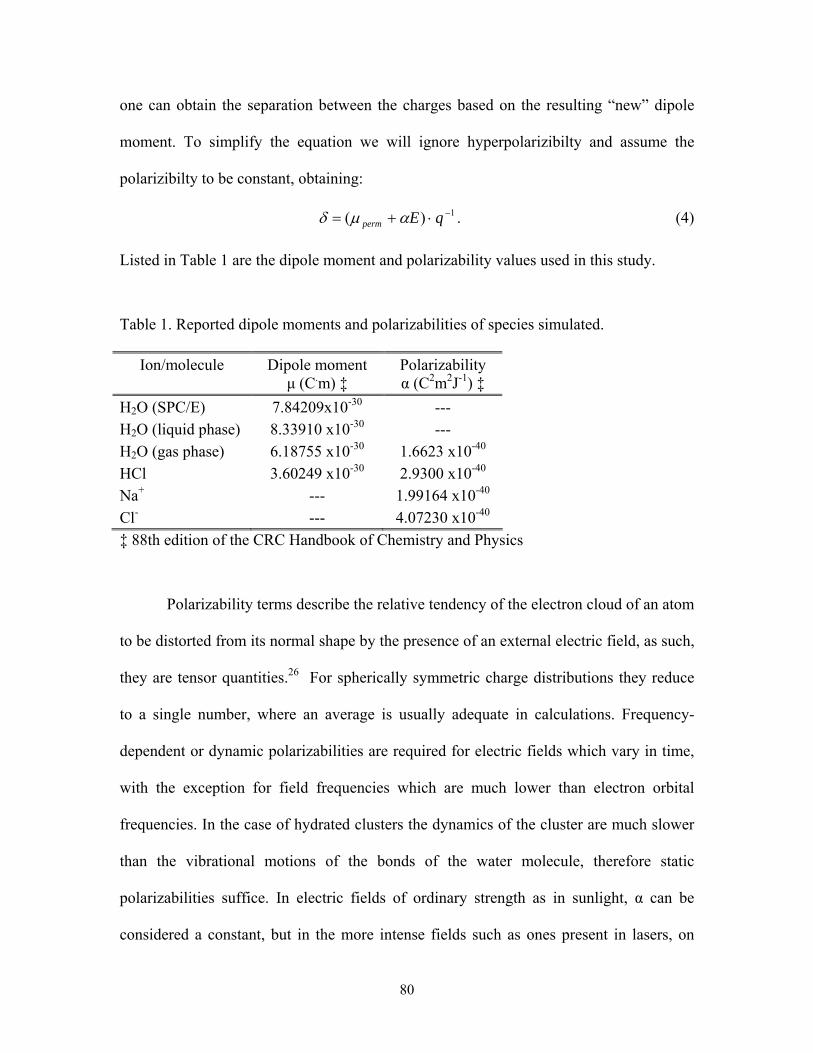
80
one can obtain the separation between the charges based on the resulting “new” dipole
moment. To simplify the equation we will ignore hyperpolarizibilty and assume the
polarizibilty to be constant, obtaining:
1)( −⋅+= qEperm αµδ . (4)
Listed in Table 1 are the dipole moment and polarizability values used in this study.
Table 1. Reported dipole moments and polarizabilities of species simulated.
Ion/molecule Dipole moment µ (C.m) ‡
Polarizability α (C2m2J-1) ‡
H2O (SPC/E) 7.84209x10⁻³⁰ --- H2O (liquid phase) 8.33910 x10⁻³⁰ --- H2O (gas phase) 6.18755 x10⁻³⁰ 1.6623 x10-40 HCl 3.60249 x10⁻³⁰ 2.9300 x10-40 Na+ --- 1.99164 x10-40 Cl- --- 4.07230 x10-40 ‡ 88th edition of the CRC Handbook of Chemistry and Physics
Polarizability terms describe the relative tendency of the electron cloud of an atom
to be distorted from its normal shape by the presence of an external electric field, as such,
they are tensor quantities.26 For spherically symmetric charge distributions they reduce
to a single number, where an average is usually adequate in calculations. Frequency-
dependent or dynamic polarizabilities are required for electric fields which vary in time,
with the exception for field frequencies which are much lower than electron orbital
frequencies. In the case of hydrated clusters the dynamics of the cluster are much slower
than the vibrational motions of the bonds of the water molecule, therefore static
polarizabilities suffice. In electric fields of ordinary strength as in sunlight, α can be
considered a constant, but in the more intense fields such as ones present in lasers, on
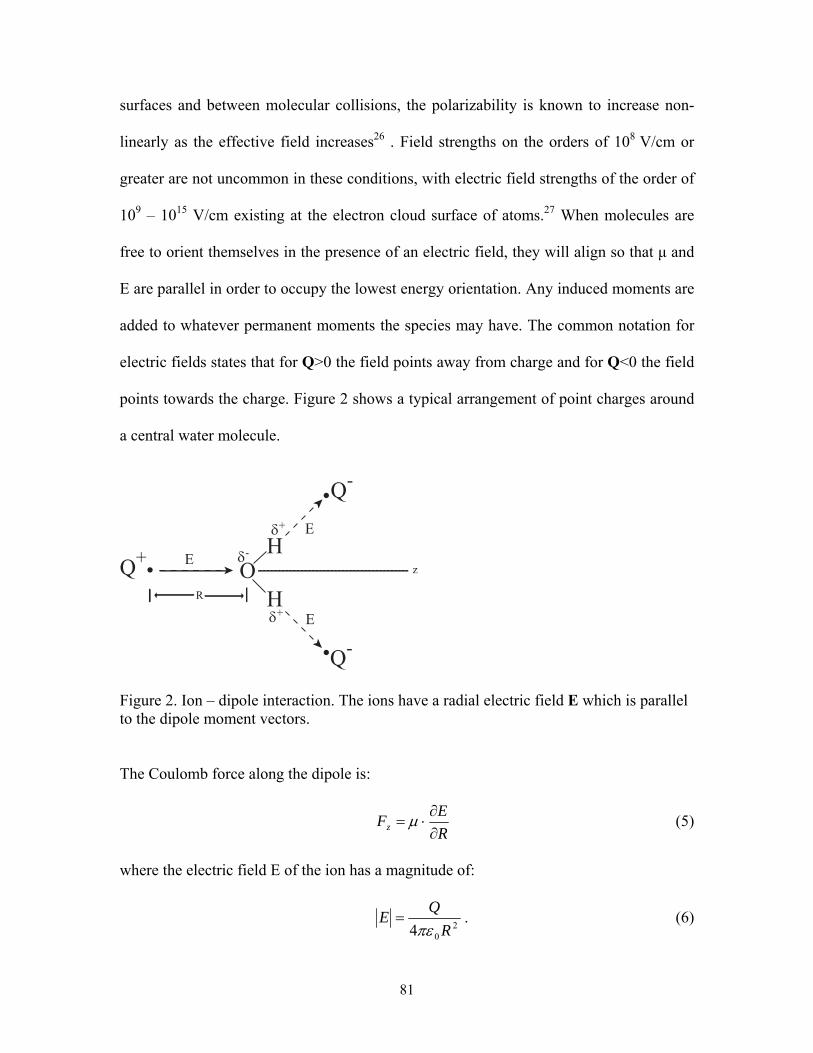
81
surfaces and between molecular collisions, the polarizability is known to increase non-
linearly as the effective field increases26 . Field strengths on the orders of 108 V/cm or
greater are not uncommon in these conditions, with electric field strengths of the order of
109 – 1015 V/cm existing at the electron cloud surface of atoms.27 When molecules are
free to orient themselves in the presence of an electric field, they will align so that µ and
E are parallel in order to occupy the lowest energy orientation. Any induced moments are
added to whatever permanent moments the species may have. The common notation for
electric fields states that for Q>0 the field points away from charge and for Q<0 the field
points towards the charge. Figure 2 shows a typical arrangement of point charges around
a central water molecule.
Q+ OH
Hδ+
δ+
δ-
Q-
Q-
zE
E
E
R
Figure 2. Ion – dipole interaction. The ions have a radial electric field E which is parallel to the dipole moment vectors.
The Coulomb force along the dipole is:
REFz ∂
∂⋅= µ (5)
where the electric field E of the ion has a magnitude of:
204 R
QEπε
= . (6)
82
In the presence of an external electric field, polarizability α, must be considered resulting
in the instantaneous force on the dipole being:
520
2
2
8 RQ
REEFz επ
αα −=∂∂
⋅= , (7)
with interaction energy being obtained by integrating Fz from ∞ to R yielding:
420
2
2
32)(
RQdRFRV
R
zind επα
−=−= ∫∞
. (8)
Solving electrostatic problems inevitably requires the use of Gauss’ law.27
πρ4=Ε⋅∇ (9)
The single equation (9) is not enough to specify completely the three components of the
electric field. Vector fields can be specified almost completely (up to the gradient of a
scalar function that satisfies the Laplace equation27) if the divergence and curl are given
elsewhere in space.
Starting with the generalized Coulomb’s law:
( ) '33'
'
)'()( xdxx
xxxx ∫−
−=Ε ρ (10)
where )( 'xρ is the charge density and dxdydzxd ='3 is a three dimensional volume
element. We can see that the vector factor in the integrand is the negative gradient of the
scalar1' −
− xx :
( ) ( )1'3'
'
|| −−−∇=−
− xxxx
xx (11)
Since the gradient operation involves x , but not the integration variable 'x , it can be
pulled outside the integral sign and written as:
83
'3'
)()( xdxx
xpx ∫ −−∇=Ε (12)
Given that the curl of the gradient of any well-behaved scalar function of position
vanishes ( 0=∇×∇ ψ , for allψ ),
0=Ε×∇ (13)
then follows immediately from equation (12). Equations (12) and (13) state that the
electric field is irrotational, dependent on the central nature of the force between charges
and on the fact that the force is a function of the relative distance. In equation (12) the
electric field is derived from a scalar by the gradient operation. This scalar can be defined
as the electrostatic potential Φ and computed from the distribution of point charges:
2220 )()()(
14
),,(iiii
i
zzyyxx
qzyx
−+−+−=Φ ∑ πε
(14)
where { }zyx ,, are points of interest and { }iii zyx ,, are locations of the charge. The
electric field strength is then simply stated as the negative gradient of the electrostatic
potential26:
Φ−∇=Ε (15)
Differential equations (9) and (15) describe the behaviour of an electrostatic field and can
be combined into one partial differential, the Poisson equation:
πρ42 −=Φ∇ (16)
which satisfies Laplace’s equation ( 02 =Φ∇ ) in regions where there is no charge
density.
84
5.4 Simulation Details
We have chosen conditions corresponding to that of high pressure turbines of
typical coal fired – supercritical water cooled generating stations. The conditions at the
inlet and outlet of the turbine are 450oC, 30MPa and 450oC, 5MPa, respectively. Earlier
studies by Nahtigal et al28 have shown that the NaCl nucleation process has high density
dependence. During the depressurization process (energy extraction process) the system
density rapidly decreases with turbulent regions forming within the heat transfer circuit.
These regions induce pressure fluctuations in the system leading to large density
fluctuations, which act to initiate salt nucleation in these low density pockets. The
simulations are performed in a cubic box containing 400 water molecules and 32 Na+
cations and 32 Cl- anions, resulting in a salt concentration of 20.5 wt%. The salt
concentrations in this study are well above the solute impurity limit of feed water, but our
choice of this concentration is twofold. Firstly; simulations at the impurity limit would be
large and would require large amount of computational power and time. Secondly;
stagnant regions within the high pressure turbine circuit have increased particulate build
up and can eventually give rise to such salt concentrations. We use the NPT ensemble in
order to mimic the density fluctuations that exist within the turbine region. Temperature
and pressure are controlled by a Gaussian thermostat and the Parrinello-Rahman barostat,
respectively, while maintaining a constant number of components. Initial systems were
equilibrated at ambient conditions for 0.5ns, which is sufficient at the temperatures
studied. Long range forces are computed by Ewald summation. We examine four isobars
at 30MPa to 5MPa. We use the SPC/E water model29 along with ion parameters from
Smith and Dang30 as they have proven to successfully model aqueous solutions at
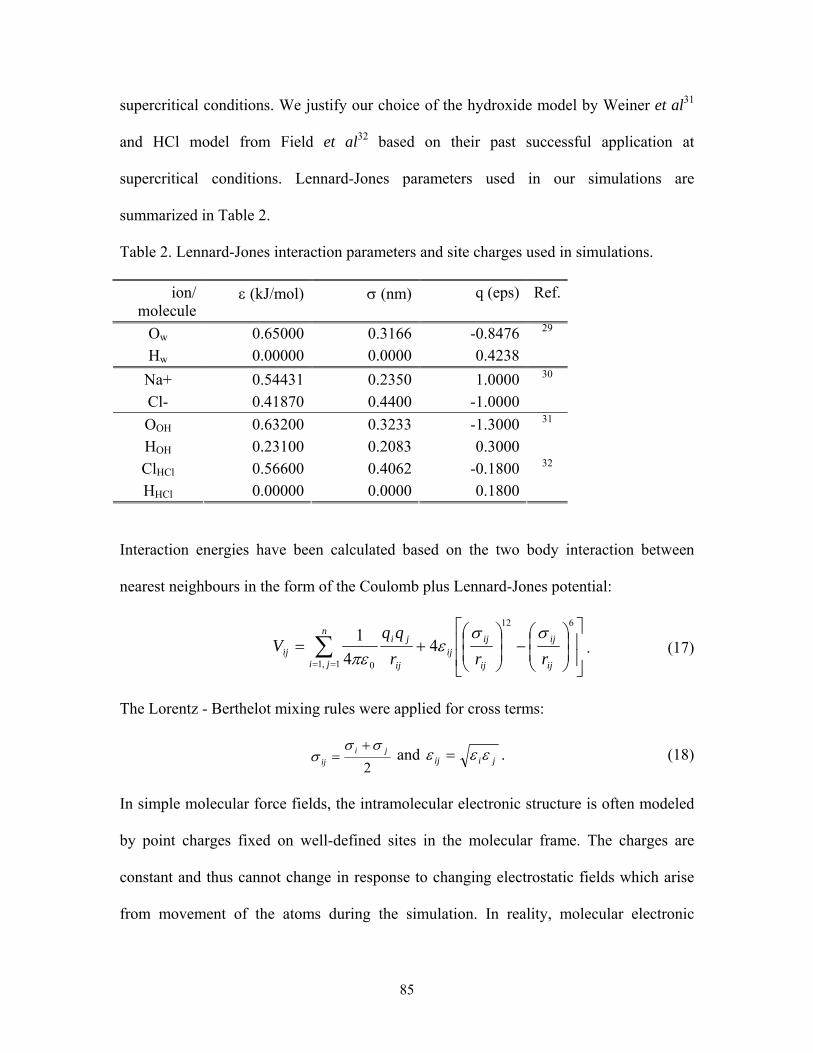
85
supercritical conditions. We justify our choice of the hydroxide model by Weiner et al31
and HCl model from Field et al32 based on their past successful application at
supercritical conditions. Lennard-Jones parameters used in our simulations are
summarized in Table 2.
Table 2. Lennard-Jones interaction parameters and site charges used in simulations.
ion/ molecule
ε (kJ/mol) σ (nm) q (eps) Ref.
Ow 0.65000 0.3166 -0.8476Hw 0.00000 0.0000 0.4238
29
Na+ 0.54431 0.2350 1.0000Cl- 0.41870 0.4400 -1.0000
30
OOH 0.63200 0.3233 -1.3000HOH 0.23100 0.2083 0.3000
31
ClHCl 0.56600 0.4062 -0.1800HHCl 0.00000 0.0000 0.1800
32
Interaction energies have been calculated based on the two body interaction between
nearest neighbours in the form of the Coulomb plus Lennard-Jones potential:
⎥⎥
⎦
⎤
⎢⎢
⎣
⎡
⎟⎟⎠
⎞⎜⎜⎝
⎛−⎟
⎟⎠
⎞⎜⎜⎝
⎛+= ∑
==
612
1,1 0
44
1
ij
ij
ij
ijij
n
ji ij
jiij rrr
qqV
σσε
πε. (17)
The Lorentz - Berthelot mixing rules were applied for cross terms:
2ji
ij
σσσ
+= and jiij εεε = . (18)
In simple molecular force fields, the intramolecular electronic structure is often modeled
by point charges fixed on well-defined sites in the molecular frame. The charges are
constant and thus cannot change in response to changing electrostatic fields which arise
from movement of the atoms during the simulation. In reality, molecular electronic
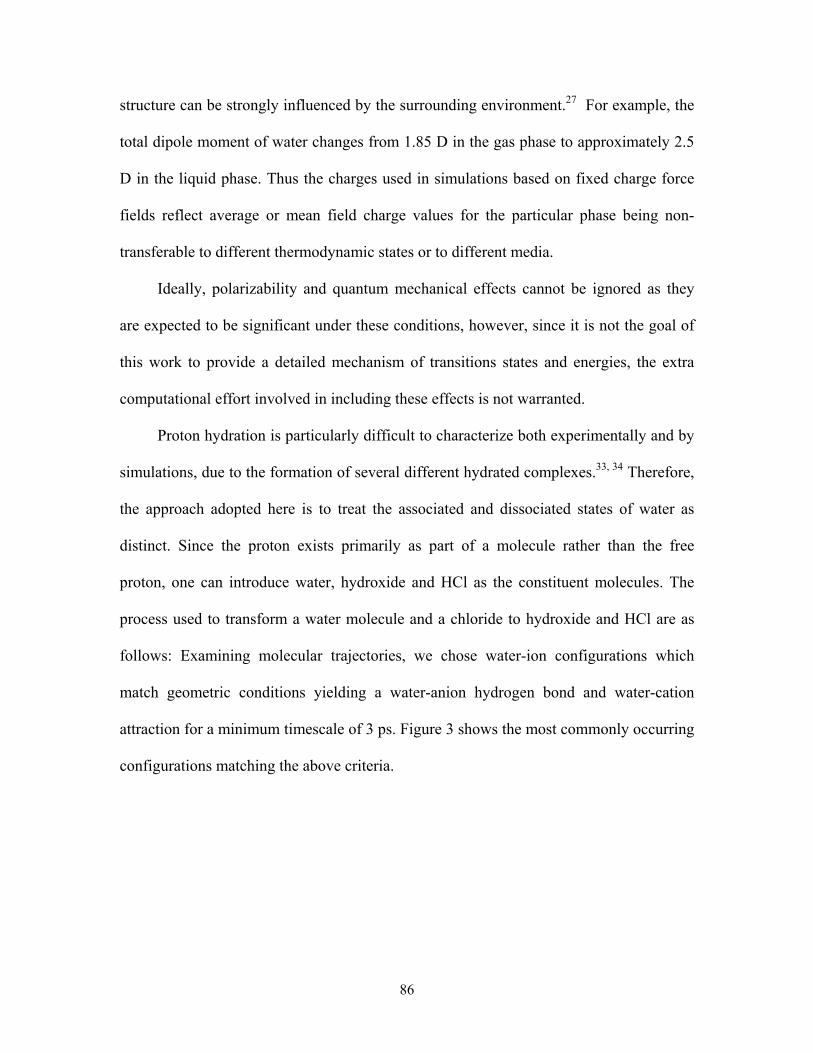
86
structure can be strongly influenced by the surrounding environment.27 For example, the
total dipole moment of water changes from 1.85 D in the gas phase to approximately 2.5
D in the liquid phase. Thus the charges used in simulations based on fixed charge force
fields reflect average or mean field charge values for the particular phase being non-
transferable to different thermodynamic states or to different media.
Ideally, polarizability and quantum mechanical effects cannot be ignored as they
are expected to be significant under these conditions, however, since it is not the goal of
this work to provide a detailed mechanism of transitions states and energies, the extra
computational effort involved in including these effects is not warranted.
Proton hydration is particularly difficult to characterize both experimentally and by
simulations, due to the formation of several different hydrated complexes.33, 34 Therefore,
the approach adopted here is to treat the associated and dissociated states of water as
distinct. Since the proton exists primarily as part of a molecule rather than the free
proton, one can introduce water, hydroxide and HCl as the constituent molecules. The
process used to transform a water molecule and a chloride to hydroxide and HCl are as
follows: Examining molecular trajectories, we chose water-ion configurations which
match geometric conditions yielding a water-anion hydrogen bond and water-cation
attraction for a minimum timescale of 3 ps. Figure 3 shows the most commonly occurring
configurations matching the above criteria.
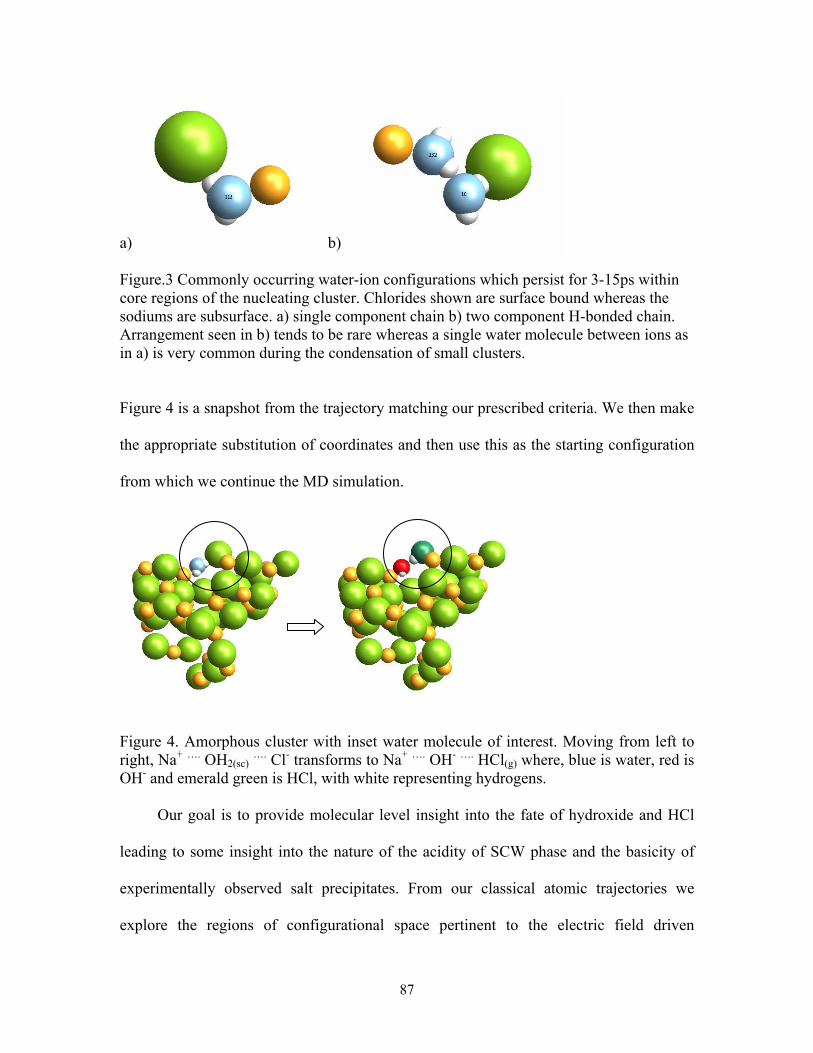
87
a) b) Figure.3 Commonly occurring water-ion configurations which persist for 3-15ps within core regions of the nucleating cluster. Chlorides shown are surface bound whereas the sodiums are subsurface. a) single component chain b) two component H-bonded chain. Arrangement seen in b) tends to be rare whereas a single water molecule between ions as in a) is very common during the condensation of small clusters.
Figure 4 is a snapshot from the trajectory matching our prescribed criteria. We then make
the appropriate substitution of coordinates and then use this as the starting configuration
from which we continue the MD simulation.
Figure 4. Amorphous cluster with inset water molecule of interest. Moving from left to right, Na+ …. OH2(sc) …. Cl- transforms to Na+ …. OH- …. HCl(g) where, blue is water, red is OH- and emerald green is HCl, with white representing hydrogens. Our goal is to provide molecular level insight into the fate of hydroxide and HCl
leading to some insight into the nature of the acidity of SCW phase and the basicity of
experimentally observed salt precipitates. From our classical atomic trajectories we
explore the regions of configurational space pertinent to the electric field driven
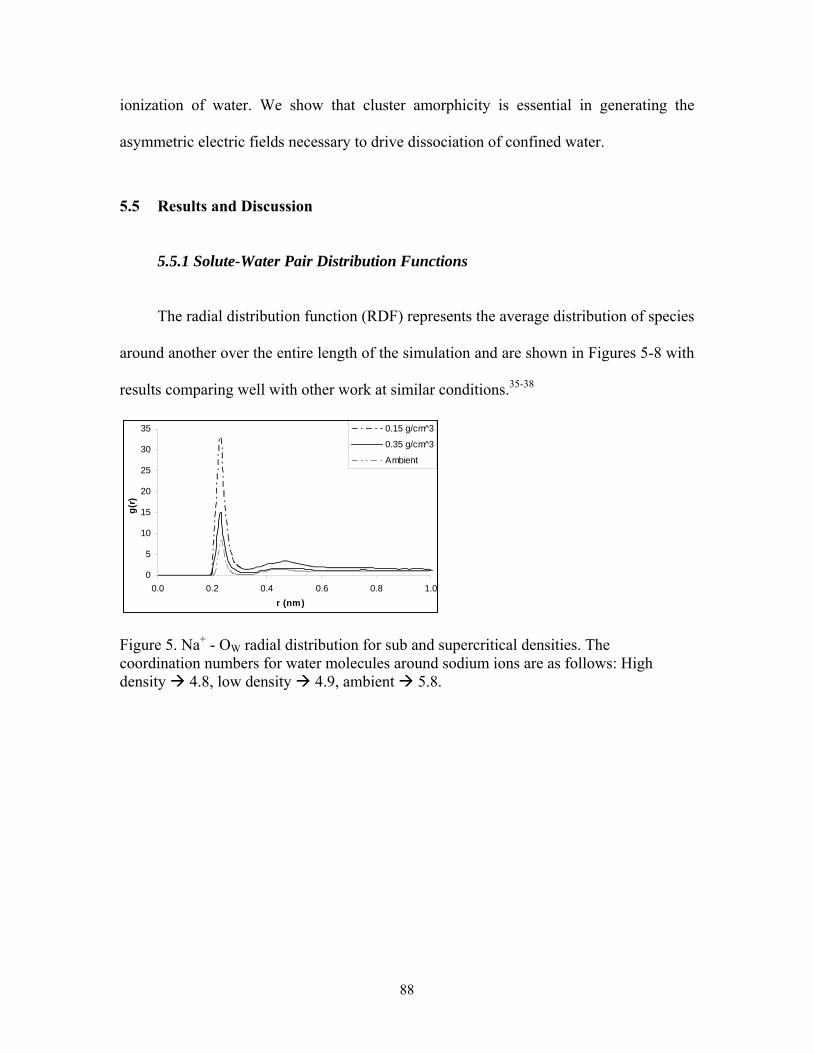
88
ionization of water. We show that cluster amorphicity is essential in generating the
asymmetric electric fields necessary to drive dissociation of confined water.
5.5 Results and Discussion
5.5.1 Solute-Water Pair Distribution Functions The radial distribution function (RDF) represents the average distribution of species
around another over the entire length of the simulation and are shown in Figures 5-8 with
results comparing well with other work at similar conditions.35-38
0
5
10
15
20
25
30
35
0.0 0.2 0.4 0.6 0.8 1.0r (nm)
g(r)
0.15 g/cm^3
0.35 g/cm^3
Ambient
Figure 5. Na+ - OW radial distribution for sub and supercritical densities. The coordination numbers for water molecules around sodium ions are as follows: High density 4.8, low density 4.9, ambient 5.8.
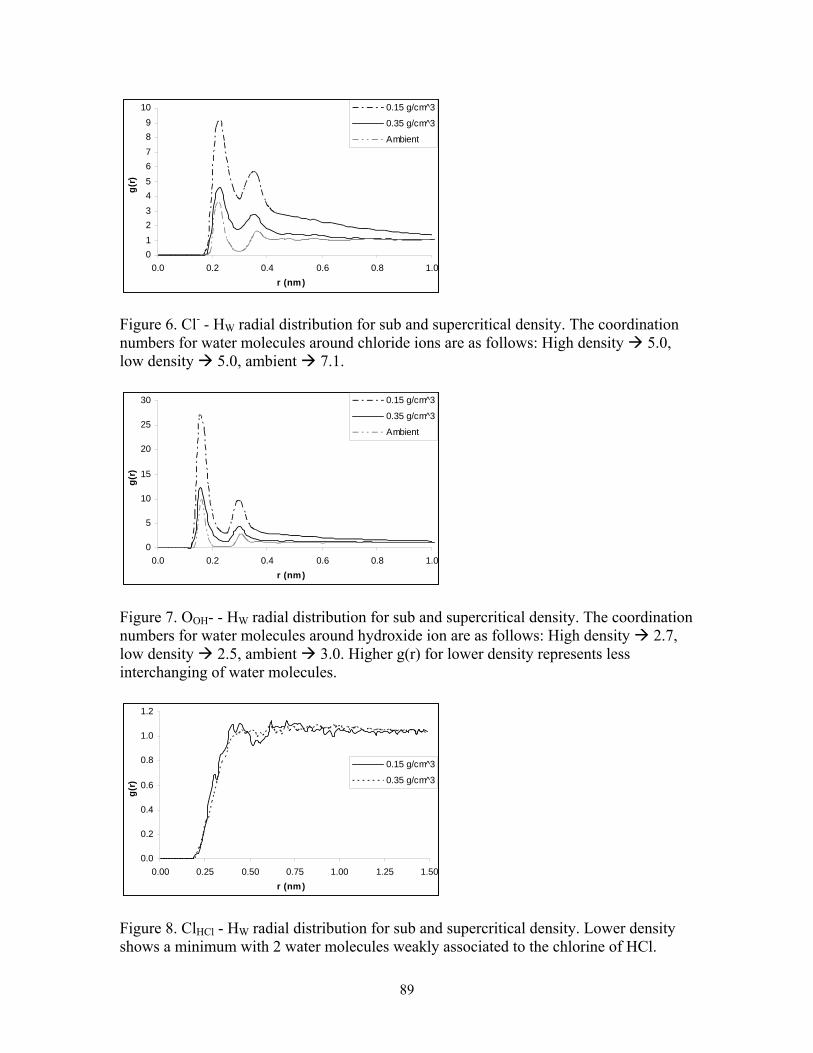
89
0123456789
10
0.0 0.2 0.4 0.6 0.8 1.0r (nm)
g(r)
0.15 g/cm^3
0.35 g/cm^3
Ambient
Figure 6. Cl- - HW radial distribution for sub and supercritical density. The coordination numbers for water molecules around chloride ions are as follows: High density 5.0, low density 5.0, ambient 7.1.
0
5
10
15
20
25
30
0.0 0.2 0.4 0.6 0.8 1.0r (nm)
g(r)
0.15 g/cm^3
0.35 g/cm^3
Ambient
Figure 7. OOH- - HW radial distribution for sub and supercritical density. The coordination numbers for water molecules around hydroxide ion are as follows: High density 2.7, low density 2.5, ambient 3.0. Higher g(r) for lower density represents less interchanging of water molecules.
0.0
0.2
0.4
0.6
0.8
1.0
1.2
0.00 0.25 0.50 0.75 1.00 1.25 1.50r (nm)
g(r)
0.15 g/cm^3
0.35 g/cm^3
Figure 8. ClHCl - HW radial distribution for sub and supercritical density. Lower density shows a minimum with 2 water molecules weakly associated to the chlorine of HCl.
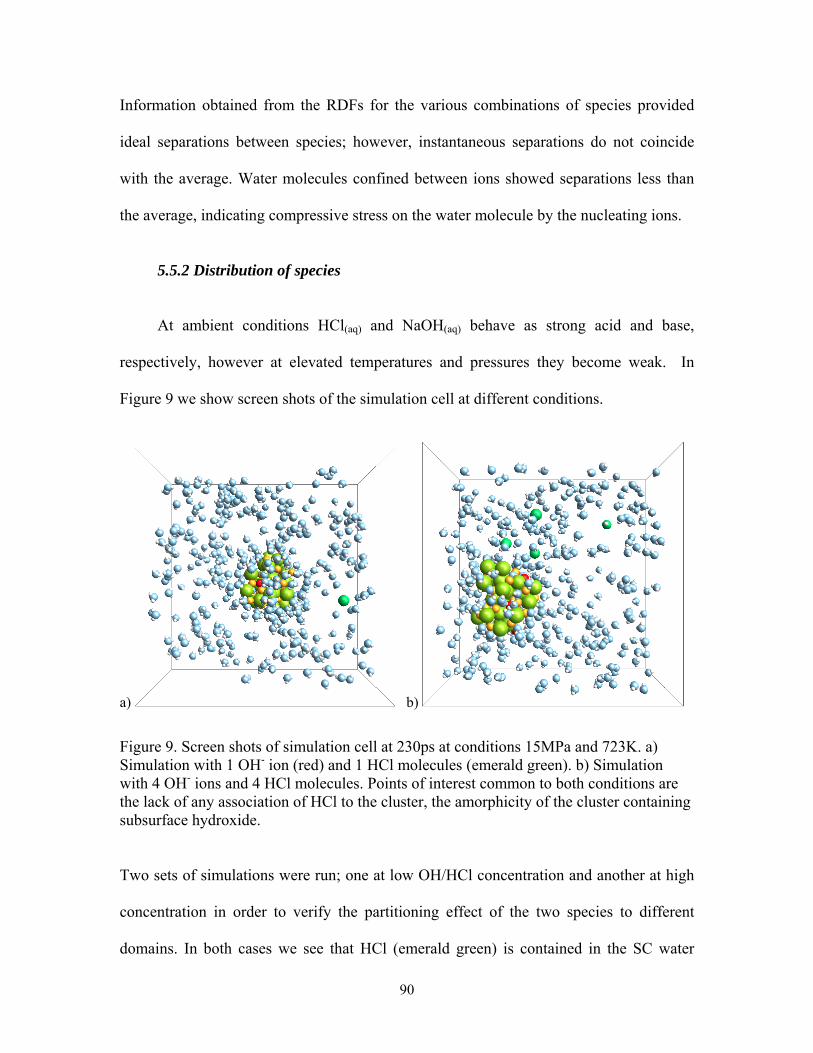
90
Information obtained from the RDFs for the various combinations of species provided
ideal separations between species; however, instantaneous separations do not coincide
with the average. Water molecules confined between ions showed separations less than
the average, indicating compressive stress on the water molecule by the nucleating ions.
5.5.2 Distribution of species At ambient conditions HCl(aq) and NaOH(aq) behave as strong acid and base,
respectively, however at elevated temperatures and pressures they become weak. In
Figure 9 we show screen shots of the simulation cell at different conditions.
a) b)
Figure 9. Screen shots of simulation cell at 230ps at conditions 15MPa and 723K. a) Simulation with 1 OH- ion (red) and 1 HCl molecules (emerald green). b) Simulation with 4 OH- ions and 4 HCl molecules. Points of interest common to both conditions are the lack of any association of HCl to the cluster, the amorphicity of the cluster containing subsurface hydroxide.
Two sets of simulations were run; one at low OH/HCl concentration and another at high
concentration in order to verify the partitioning effect of the two species to different
domains. In both cases we see that HCl (emerald green) is contained in the SC water
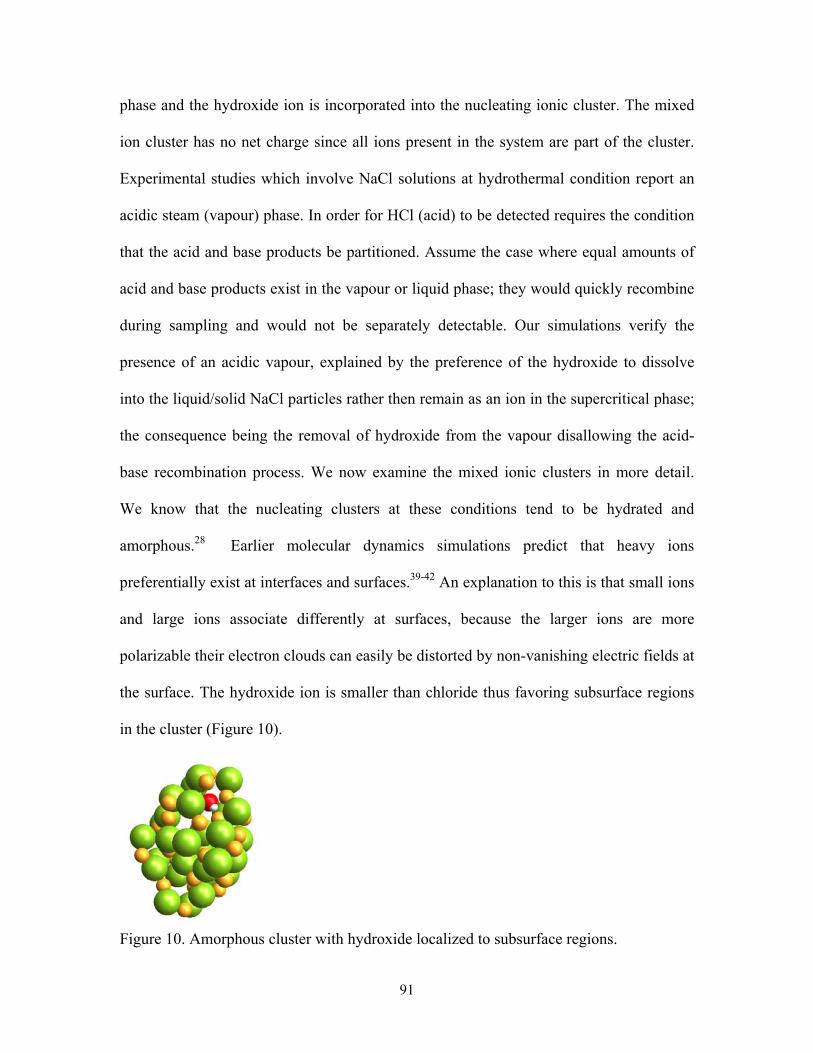
91
phase and the hydroxide ion is incorporated into the nucleating ionic cluster. The mixed
ion cluster has no net charge since all ions present in the system are part of the cluster.
Experimental studies which involve NaCl solutions at hydrothermal condition report an
acidic steam (vapour) phase. In order for HCl (acid) to be detected requires the condition
that the acid and base products be partitioned. Assume the case where equal amounts of
acid and base products exist in the vapour or liquid phase; they would quickly recombine
during sampling and would not be separately detectable. Our simulations verify the
presence of an acidic vapour, explained by the preference of the hydroxide to dissolve
into the liquid/solid NaCl particles rather then remain as an ion in the supercritical phase;
the consequence being the removal of hydroxide from the vapour disallowing the acid-
base recombination process. We now examine the mixed ionic clusters in more detail.
We know that the nucleating clusters at these conditions tend to be hydrated and
amorphous.28 Earlier molecular dynamics simulations predict that heavy ions
preferentially exist at interfaces and surfaces.39-42 An explanation to this is that small ions
and large ions associate differently at surfaces, because the larger ions are more
polarizable their electron clouds can easily be distorted by non-vanishing electric fields at
the surface. The hydroxide ion is smaller than chloride thus favoring subsurface regions
in the cluster (Figure 10).
Figure 10. Amorphous cluster with hydroxide localized to subsurface regions.
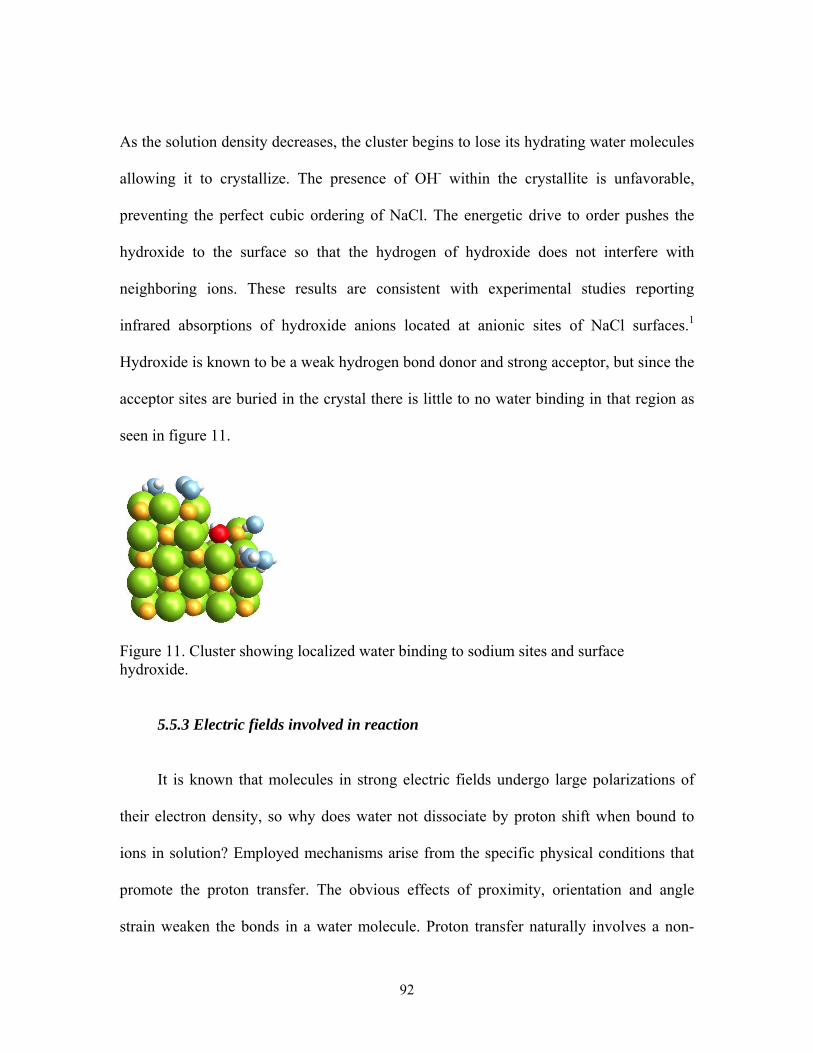
92
As the solution density decreases, the cluster begins to lose its hydrating water molecules
allowing it to crystallize. The presence of OH- within the crystallite is unfavorable,
preventing the perfect cubic ordering of NaCl. The energetic drive to order pushes the
hydroxide to the surface so that the hydrogen of hydroxide does not interfere with
neighboring ions. These results are consistent with experimental studies reporting
infrared absorptions of hydroxide anions located at anionic sites of NaCl surfaces.1
Hydroxide is known to be a weak hydrogen bond donor and strong acceptor, but since the
acceptor sites are buried in the crystal there is little to no water binding in that region as
seen in figure 11.
Figure 11. Cluster showing localized water binding to sodium sites and surface hydroxide. 5.5.3 Electric fields involved in reaction It is known that molecules in strong electric fields undergo large polarizations of
their electron density, so why does water not dissociate by proton shift when bound to
ions in solution? Employed mechanisms arise from the specific physical conditions that
promote the proton transfer. The obvious effects of proximity, orientation and angle
strain weaken the bonds in a water molecule. Proton transfer naturally involves a non-
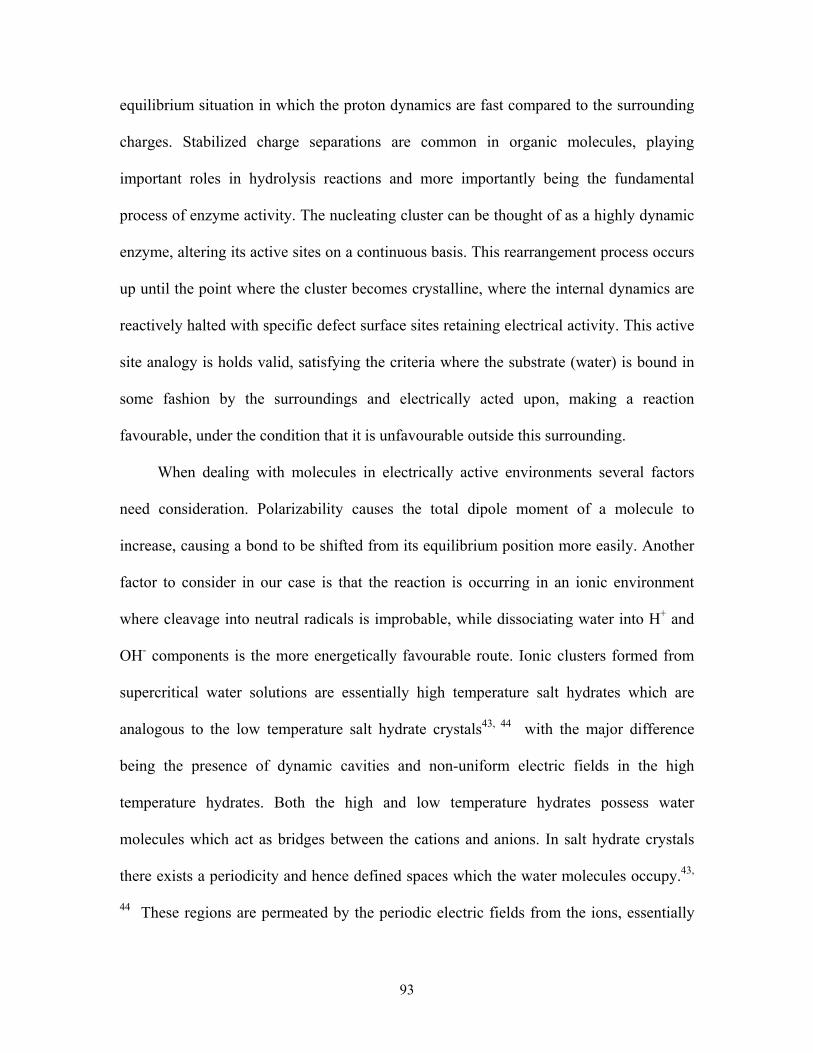
93
equilibrium situation in which the proton dynamics are fast compared to the surrounding
charges. Stabilized charge separations are common in organic molecules, playing
important roles in hydrolysis reactions and more importantly being the fundamental
process of enzyme activity. The nucleating cluster can be thought of as a highly dynamic
enzyme, altering its active sites on a continuous basis. This rearrangement process occurs
up until the point where the cluster becomes crystalline, where the internal dynamics are
reactively halted with specific defect surface sites retaining electrical activity. This active
site analogy is holds valid, satisfying the criteria where the substrate (water) is bound in
some fashion by the surroundings and electrically acted upon, making a reaction
favourable, under the condition that it is unfavourable outside this surrounding.
When dealing with molecules in electrically active environments several factors
need consideration. Polarizability causes the total dipole moment of a molecule to
increase, causing a bond to be shifted from its equilibrium position more easily. Another
factor to consider in our case is that the reaction is occurring in an ionic environment
where cleavage into neutral radicals is improbable, while dissociating water into H+ and
OH- components is the more energetically favourable route. Ionic clusters formed from
supercritical water solutions are essentially high temperature salt hydrates which are
analogous to the low temperature salt hydrate crystals43, 44 with the major difference
being the presence of dynamic cavities and non-uniform electric fields in the high
temperature hydrates. Both the high and low temperature hydrates possess water
molecules which act as bridges between the cations and anions. In salt hydrate crystals
there exists a periodicity and hence defined spaces which the water molecules occupy.43,
44 These regions are permeated by the periodic electric fields from the ions, essentially
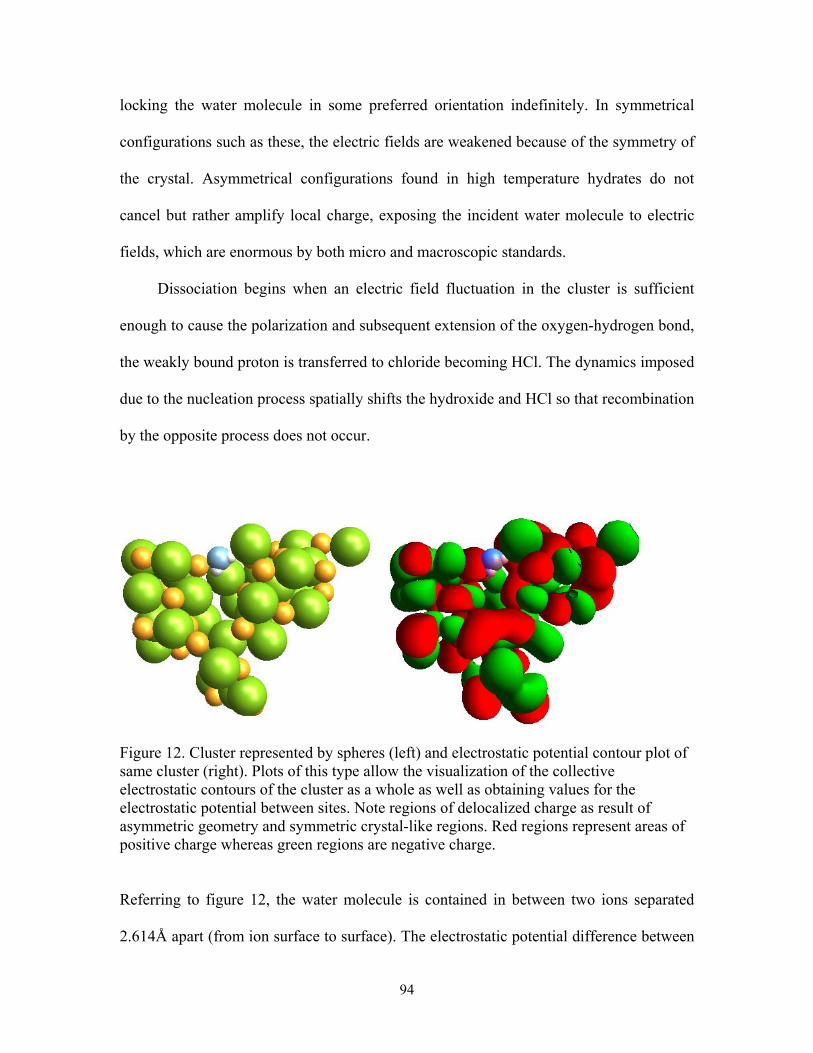
94
locking the water molecule in some preferred orientation indefinitely. In symmetrical
configurations such as these, the electric fields are weakened because of the symmetry of
the crystal. Asymmetrical configurations found in high temperature hydrates do not
cancel but rather amplify local charge, exposing the incident water molecule to electric
fields, which are enormous by both micro and macroscopic standards.
Dissociation begins when an electric field fluctuation in the cluster is sufficient
enough to cause the polarization and subsequent extension of the oxygen-hydrogen bond,
the weakly bound proton is transferred to chloride becoming HCl. The dynamics imposed
due to the nucleation process spatially shifts the hydroxide and HCl so that recombination
by the opposite process does not occur.
Figure 12. Cluster represented by spheres (left) and electrostatic potential contour plot of same cluster (right). Plots of this type allow the visualization of the collective electrostatic contours of the cluster as a whole as well as obtaining values for the electrostatic potential between sites. Note regions of delocalized charge as result of asymmetric geometry and symmetric crystal-like regions. Red regions represent areas of positive charge whereas green regions are negative charge.
Referring to figure 12, the water molecule is contained in between two ions separated
2.614Å apart (from ion surface to surface). The electrostatic potential difference between
95
the sodium and chloride is extracted form the potential surface as being 11.02V, resulting
in a field strength of 4.216x10¹⁰V/m. Since the separation between the point charges is
proportional to the dipole moment, we obtain that the bond length between oxygen and
hydrogen must stretched to 1.746Å. The fields and separations described are based on a
purely classical system where no explicit polarizabilty or charge modification occurs. The
values are expected to be an upper limit. Quantum mechanical calculations would be
necessary in order to obtain more accurate values.
For the sake of debate, assume that the inaccuracy is 50%, based on this the electric
fields are still on the order of GV/m and the oxygen and hydrogen separation is still large
enough so they can no longer be considered as covalently bonded but rather H-bonded.
The 50% inaccuracy is a gross over estimate and simply posed to prove the magnitude of
the electric field in such environments. In real situations the charge on chlorine would be
altered as the hydrogen is transferred, significantly altering the electric fields in that local
area which would effectively collapse the fields, preventing the reverse reaction.
We surmise that the configurations of the nucleating cluster hydrates have the
potential to generate electrostatic fields sufficient to dissociate the O-H bond of water.
Experimental surface-emitter tip studies on water dissociation between ice and Pt
electrodes report breakdown energies of 0.75eV,45 corresponding to an electric field of
0.781V/Å, and electric fields in zeolites are reported as being on the order of 0.5-0.8
V/Å.46 These values are on the same order as to what we have calculated, but considering
the much smaller separations between the ions in our studies, we are confident that these
fields are reasonable estimates. The size of the cluster required to stabilize these fields is
debatable. The essential requirement being that the cluster must provide some rigidity, so
96
that the water molecule is pulled apart rather than the ions being pulled closer to the
water, which is what occurs in aqueous solution. Experimental studies examining the
hydrolysis reaction by NaCl, report that smaller particles tended to promote hydrolysis.4
This relates to the structure of the particles, crystallites have non-fluctuating symmetric
surface fields, except perhaps at defect sites, where as smaller particles tend to be
amorphous, resulting in asymmetric time varying fields. Large particles tend to be
crystallites therefore diffusional limitations of hydroxide into the NaCl crystal also arise.
5.6 Conclusion
Strong electric fields on the order of V/Å affect the valence shell electrons of
atoms, thus new molecular species can be stabilized in these high potentials leading to
unique chemistry. This then provides new reaction pathways in heterogeneous catalysis,
making field induced chemistry an exciting field of study. Most work so far has been
concentrated on static electric fields; however, many new phenomena are to be expected
in asymmetric fluctuating fields such as ones generated during the salt nucleation
process. Salt water being the most abundant solution on Earth has relevant importance in
atmospheric, geologic and technologic fields of study. Sea salt aerosols in the earth’s
troposphere are known to react with NO2 in air to produce HCl and NaNO3, but this
reaction along does not account for the concentrations of HCl found in the atmosphere.
It is not difficult to speculate that the evaporation of water from salt water droplets
causes the formation of nano-clusters which drive the hydrolysis reaction with the
alkaline particulates falling back into the water leaving an acidic water vapour. In the
depths of the oceans near volcanic fissures supercritical water can exist forming high
97
local salt concentrations, forming caustic environments which in turn react with
surrounding rock transforming it to new forms. And in technological aspects, any system
that uses water at high temperatures and pressures will be plagued by this same reaction.
In this study I have provided evidence that nucleating salts generate fluctuating
electric fields of sufficient strength to cause the hydrolysis of water molecules. We also
show that the resulting acid and base partition between coexisting phases, resulting in
acidic condensates and basic deposits. Temperature and pressure play a synergistic role in
the process, driving the kinetics of ion dehydration and determining the extent of ionic
association.
98
5.7 References
(1) Dai DJ, Peters SJ, Ewing GE. Water adsorption and dissociation on NaCl surfaces. J. Phys. Chem. 1995; 99(25): 10299-304.
(2) Armellini FJ, Tester JW. Solubility of sodium chloride and sulfate in sub- and supercritical water vapor from 450–550°C and 100–250 bar. Fluid Phase Equilibria, 1993 4/1 ;84: 123-42.
(3) Pitzer KS. Aqueous electrolytes at near-critical and supercritical temperatures. Int. J. Thermophys. 1998 03/01; 19(2): 355-66.
(4) Hanf N.W., Sole M.J. High temperature hydrolysis of sodium chloride. Trans. Faraday Soc. 1970; 66: 3065.
(5) Barnett RN, Landman U. Water adsorption and reactions on small sodium chloride clusters. J. Phys. Chem. 1996; 100(33): 13950-8.
(6) Bischoff JL, Rosenbauer RJ, Fournier RO. The generation of HCl in the system CaCl2-H2O: Vapor-liquid relations from 380–500 °C. Geochimica Et Cosmochimica Acta, 1996 1; 60(1): 7-16.
(7) Teo ED, Brandon NP, Vos E, Kramer GJ. A critical pathway energy efficiency analysis of the thermochemical UT-3 cycle. International Journal of Hydrogen Energy, 2005 4; 30(5): 559-64.
(8) Ho PC, Palmer DA, Gruszkiewicz MS. Conductivity measurements of dilute aqueous HCl solutions to high temperatures and pressures using a flow-through cell. J. Phys. Chem. B 2001; 105(6): 1260-6.
(9) Ho PC, Palmer DA, Wood RH. Conductivity measurements of dilute aqueous LiOH, NaOH, and KOH solutions to high temperatures and pressures using a flow-through cell. J. Phys. Chem. B 2000; 104(50): 12084-9.
(10) EBARA R. Long-term corrosion fatigue behavior of structural materials. Fatigue Fract. Eng. Mater. Struct. 2002 09/24; 25(8-9): 855-9.
(11) Galobardes JF, Van Hare DR, Rogers LB. Solubility of sodium chloride in dry steam. J. Chem. Eng. Data 1981; 26(4): 363-6.
99
(12) Etzler FM. A statistical thermodynamic model for water near solid interfaces. Journal of Colloid and Interface Science, 1983 3; 92(1): 43-56.
(13) Bernal JD, Fowler RH. A theory of water and ionic solution, with particular reference to hydrogen and hydroxyl ions. J. Chem. Phys. 1933 August 1933; 1(8): 515-48.
(14) Miller IR. Zwitterionic water chains as H+/OH- transporters. Biophys. J. 1987 September 1; 52(3): 497-500.
(15) Danneel VH. Notiz über ionengeschwindigkeiten. Z Elektrochem 1905; 11: 249.
(16) Agmon N. The grotthuss mechanism. Chem. Phys. Lett., 1995 10/13; 244(5-6): 462.
(17) Onsager L. The motion of ions: Principles and concepts. Science 1969; 166: 1359.
(18) Bock CW, Kaufman A, Glusker JP. Coordination of water to magnesium cations. Inorg. Chem. 1994; 33(3): 419-27.
(19) Collins KD. Charge density-dependent strength of hydration and biological structure. Biophys J 1997 January 1; 72(1): 65-76.
(20) Mallik BS, Chandra A. Hydrogen bond and residence dynamics of ion--water and water--water pairs in supercritical aqueous ionic solutions: Dependence on ion size and density. J. Chem. Phys. 2006 21 December 2006; 125(23): 234502.
(21) Chowdhuri S, Chandra A. Dynamics of halide ion-water hydrogen bonds in aqueous solutions: Dependence on ion size and temperature. J. Phys. Chem. B 2006; 110(19):9674-80.
(22) Kropman MF, Bakker HJ. Dynamics of water molecules in aqueous solvation shells. Science 2001 March 16; 291(5511): 2118-20.
(23) Bakker HJ, Kropman MF, Omta AW, Woutersen S. Hydrogen-bond dynamics of water in ionic solutions. Phys. Scripta. 2004; 69(6): 14-24.
(24) Lemus R. Vibrational excitations in H2O in the framework of a local model. Journal of Molecular Spectroscopy, 2004 5; 225(1): 73-92.
(25) Armellini FJ, Tester JW. Experimental methods for studying salt nucleation and growth from supercritical water. J. Supercrit. Fluids, 1991 12; 4(4): 254-64.
100
(26) Berry RS, Rice SA, Ross J. Physical Chemistry. 2nd Ed. New York: Oxford University Press; 2000.
(27) Jackson JD. Classical Electrodynamics. Toronto: John Wiley & Sons, Inc.; 1975.
(28) Nahtigal IG, Zasetsky AY, Svishchev IM. Nucleation of NaCl nanoparticles in supercritical water: Molecular dynamics simulations. J. Phys. Chem. B 2008; 112(25): 7537-43.
(29) Berendsen HJC, Grigera JR, Straatsma TP. The missing term in effective pair potentials. J. Phys. Chem. 1987; 91(24): 6269-71.
(30) Smith DE, Dang LX. Computer simulations of NaCl association in polarizable water. J. Chem. Phys. 1994 March 1, 1994; 100(5): 3757-66.
(31) Weiner SJ, Kollman PA, Nguyen DT, Case DA. An all atom force field for simulations of proteins and nucleic acids. J. Comput. Chem. 1986; 7(2): 230-52.
(32) Field MJ, Bash PA, Karplus M. A combined quantum mechanical and molecular mechanical potential for molecular dynamics simulations. J. Comput. Chem. 1990; 11(6): 700-33.
(33) Tuckerman M, Laasonen K, Sprik M, Parrinello M. Ab-initio molecular dynamics simulation of the solvation and transport of H3O+ and OH- ions in water. J. Phys. Chem. 1995; 99(16): 5749-52.
(34) Juanos i Timoneda J, Hynes JT. Nonequilibrium free energy surfaces for hydrogen-bonded proton-transfer complexes in solution. J Phys Chem 1991; 95(25): 10431-42.
(35) Chialvo AA, Cummings PT, Simonson JM. H3O+/Cl- ion-pair formation in high-temperature aqueous solutions. J. Chem. Phys. 2000 November 8, 2000; 113(18): 8093-100.
(36) Balbuena PB, Johnston KP, Rossky PJ. Molecular dynamics simulation of electrolyte solutions in ambient and supercritical water. 1. Ion solvation. J. Phys. Chem. 1996; 100(7): 2706-15.
(37) Balbuena PB, Johnston KP, Rossky PJ. Molecular dynamics simulation of electrolyte solutions in ambient and supercritical water. 2. Relative acidity of HCl. J. Phys. Chem. 1996; 100(7): 2716-22.
101
(38) Mucha M, Jungwirth P. Salt crystallization from an evaporating aqueous solution by molecular dynamics simulations. J. Phys. Chem. B 2003; 107(33): 8271-4.
(39) Dang LX. Computational study of ion binding to the liquid interface of water. J. Phys. Chem. B 2002; 106(40): 10388-94.
(40) Dang LX, Chang T. Molecular mechanism of ion binding to the Liquid/Vapor interface of water. J. Phys. Chem. B 2002; 106(2): 235-8.
(41) Jungwirth P, Tobias DJ. Ions at the Air/Water interface. J. Phys. Chem. B 2002; 106(25): 6361-73.
(42) Jungwirth P, Tobias DJ. Molecular structure of salt solutions: A new view of the interface with implications for heterogeneous atmospheric chemistry. J. Phys. Chem. B 2001; 105(43): 10468-72.
(43) Ford TA, Falk M. IR study of hydrogen bonding in sodium chloride dihydrate. J. Molec. Struct., 1969, 7; 3(6): 445-52.
(44) Klewe B, Pedersen B. The crystal structure of sodium chloride dihydrate. Acta Crystallographica Section B 1974 Oct; 30(10): 2363-71.
(45) Pinkerton TD, Scovell DL, Johnson AL, Xia B, Medvedev V, Stuve EM. Electric field effects in ionization of water-ice layers on platinum. Langmuir 1999; 15(3): 851-6.
(46) Barrachin B, Cohen de Lara, E. Determination of the electric field in zeolites NaA, NaCaA and Ca6A. Calculation from the ionic charge distribution and infrared measurements of the induced band of N2. J. Chem. Soc. Faraday Trans. 2 1986; 82: 1953.
102
Chapter 6
Summary and Future Direction
6.0 Conclusions and future outlook
Water, a widely available substance is regularly used as a solvent, reactant and
heat/mass transfer medium in various technological processes. Under supercritical
conditions water offers a novel combination of liquid-like and gas-like physical and
chemical properties, as well as exhibiting uncharacteristic phase behavior of aqueous
mixtures. These make hydrothermal fluids a unique medium; be it, offering a specific
advantage over similar liquid based processes or providing the foundation for a process
that is not viable in other media.
The use of supercritical water in modern technologies requires the understanding of
the chemistry and physics which occurs under these conditions, specifically, the
immiscibility phenomena, which plays an important role in high temperature systems. Its
potential is just beginning to find use in modern industry and in interpretations of natural
geologic hydrothermal processes.
This work has addressed some of the areas of specific importance introduced in the
beginning. Nucleation rates, particle emergence times and density effects provide insight
into the behavior of salt solutions under the hydrothermal state points examined. The
topic of corrosion has been addressed in terms of the conditions by which corrosive
species evolve from inert starting materials. The improved understanding of hydrolysis
103
reactions under the state points examined indicates that small amorphous salt hydrates
account for increased concentration of reactive species in solution.
The NaCl-water system has been the focus of this work because of its prevalence
and persistence in technological processes; it represents the starting point for further
characterization of similar salts and solutions. As a future direction, binary salts (Type I)
like NaCl should be further studied, since they share the same phase behaviour and
reactions. Exploring effects such as nucleation, phase partitioning and reactivity within a
type class may give rise to additional insight into trends, allowing for further tailoring of
supercritical solutions. Catalysts, nanomaterials and hydrogen generation are but a few
fruitful products and methods which may be the result of continued studies.
104
Appendix A
Glossary of terms and abbreviations
MC Monte Carlo simulation
MD Molecular Dynamics simulation
SCW supercritical water
SCWO supercritical water oxidation
SCWCR supercritical water cooled reactor
HTS hydrothermal synthesis
CNT classical nucleation theory
DFT density functional theory
NVT constant volume simulation
NPT constant pressure simulation
SPC/E simple point charge - extended water model
SPC/FQ simple point charge - fluctuating charge water model
TIP4P transferable intermolecular potential with 4 points
TIP4P/2005 transferable intermolecular potential with 4 points, 2005 revision
TIP4P/FQ transferable intermolecular potential with 4 points, fluctuating charge
PPC polarizable point charge
RDF radial distribution function
EK kinetic energy
EP potential energy
A Helmholtz energy
U internal energy
H enthalpy
S entropy
G Gibbs free energy
T temperature
F force
V volume
105
I inertia
t time
Na+ sodium ion
Cl- chloride ion
OH- hydroxide ion
NaOH sodium hydroxide
NaCl sodium chloride
HCl hydrogen chloride
H2O water
e elementary charge
kB Boltzmann constant
R universal gas constant
εr dielectric constant of medium
ε0 permittivity of free space
µ dipole moment
σ Lennard-Jones length parameter
ε Lennard-Jones energy parameter
ρ density
Å Angstrom
τc induction period
J nucleation rate
N number of atoms/ions
NA Avogadro’s number
i species 1
j species 2
Rg radius of gyration
Rhyd hydrodynamic radius
p momentum
m mass
vLJ Lennard-Jones interaction energy
zi charge on species i
106
zj charge on species j
q4(i) normalized parameter
(g) gas phase
(sc) supercritical phase
(l) liquid phase
(aq) aqueous
(s,l) solid-liquid mixture
iµ chemical potential
F Faraday’s constant


![A Novel Aqueous Two Phase System Composed of Surfactant … · 2017. 3. 31. · Molecules 2015, 20 11186 using supercritical fluid extraction [18]. Microwave-assisted aqueous enzymatic](https://img.pdfslide.us/doc/110x75/5fcef4bffc525b7c6933753d/a-novel-aqueous-two-phase-system-composed-of-surfactant-2017-3-31-molecules.jpg)