Embed Size (px)
Citation preview
RESEARCH
Adsorption of methylene blue from aqueous solution usinguntreated and treated (Metroxylon spp.) waste adsorbent:equilibrium and kinetics studies
Jeminat O. Amode1 • Jose H. Santos1 • Zahangir Md. Alam2• Aminul H. Mirza1 •
Chan C. Mei1
Received: 5 October 2015 / Accepted: 17 May 2016 / Published online: 10 June 2016
� The Author(s) 2016. This article is published with open access at Springerlink.com
Abstract
Background (Metroxylon spp.) waste is an inexpensive
and abundantly available material with the characteristics
of a good adsorbent for treating dye from wastewater. We
studied the effectiveness of alkali and acid modification in
enhancing the adsorption capacity of sago waste. The
untreated and treated adsorbent was characterized by FTIR,
elemental analysis and BET surface area. The capacity of
each adsorbent to adsorb MB was evaluated at different pH
values, adsorbent dosage and initial dye concentrations and
contact time.
Results According to the results obtained, alkali treatment
more than doubled the sorption capacity of sago waste by
increasing the porosity, surface area and number of adsorp-
tion sites. The alkali-treated material also adsorbed signifi-
cantlymore thanmany known biosorbents. The effects of the
initial concentration of methylene blue, solution pH and
adsorbent dosage on methylene blue removal are reported.
Equilibrium data were best represented by the Langmuir
isothermmodelwith adsorption capacities of 83.5, 212.8 and
36.82 mg/g for untreated, potassium hydroxide-treated and
phosphoric acid-treated sago wastes, respectively. The
kinetics of adsorption were best described by a pseudo-sec-
ond-order model (R2 = 0.999).
Conclusions The alkali treatment of sago waste demon-
strates the use of a low-cost agricultural waste and a simple
modification process to produce an effective adsorbent for
removing cationic dye from wastewater.
Keywords (Metroxylon spp.) waste � Methylene blue �Low-cost adsorbent � Adsorption � Alkali modification �Water treatment
Introduction
Wastewater effluents frommany industries, including paper,
leather, textiles, rubber, plastics, printing, cosmetics, phar-
maceuticals and food, contain several kinds of synthetic
dyestuffs [1]. Dye-bearing wastewaters exhibit high chemi-
cal and biochemical oxygen demands [2]. The presence of
even very low concentrations in discharge effluents to the
environment is worrying for both toxicological and esthetic
reasons [3, 4]. To reduce the negative effects of dye-con-
taminated wastewater on humans and the environment, the
wastewater must be treated carefully before discharge into
main streams [5]. Various physical, chemical and biological
methods, including adsorption, biosorption coagulation and
flocculation, advanced oxidation, ozonation, membrane fil-
tration and liquid–liquid extraction, have been widely used
for the treatment of dye-bearing wastewater [2, 6–8].
Adsorption is a very effective separation technique and is
considered to be superior to other techniques for water
treatment in terms of initial cost, simplicity of design, ease of
operation and resilience to toxic substances [9, 10]. Although
adsorption technologies are well established, a significant
limitation is the cost of adsorbent materials. This has moti-
vated the search for low-cost and renewablematerials for use
as sorbents and has led to a growing interest in the use of
nonconventional and locally available materials such as
natural materials and agricultural wastes.
& Jose H. Santos
1 Faculty of Science, Universiti Brunei Darussalam, Jalan
Tungku Link, Gadong 1410, Negara Brunei Darussalam
2 Bioenvironmental Engineering Research Unit (BERU),
Faculty of Engineering, International Islamic University
Malaysia (IIUM), Kuala Lumpur, Malaysia
123
Int J Ind Chem (2016) 7:333–345
DOI 10.1007/s40090-016-0085-9
Recently, a large number of low-cost adsorbents have
been utilized to develop cheaper and effective adsorbents
to remove dyes from wastewater, including cucumber peels
[11], meranti sawdust [12], bagasse [13], durian leaf
powder [14], watermelon seed hulls [11], grape pulp [15],
chitosan [16, 17], kenaf core fibers [18], etc. The reported
results showed that most of these readily available bio-
adsorbents possess high efficiency in removing dyes from
aqueous solutions [16, 19]. These lignocellulosic by-
products possess various advantages, such as being eco-
friendly, renewable, less expensive and abundantly avail-
able, as compared to commercial adsorbents [18, 20].
Studies have also shown that chemical modification of
agricultural by-products significantly enhances their ion-
binding properties, thereby providing greater flexibility in
their applications to a wide range of dyes [21–24]. How-
ever, while agricultural by-products are often presented as
low-cost adsorbents, their availability is often region spe-
cific. With the majority of costs in using biosorbents being
associated with the transportation of materials [25], their
viability may be limited to the region of origin. Agricul-
tural waste is a low-cost and abundantly available material
in Brunei Darussalam among other areas in the Asia–
Pacific region. (Metroxylon spp.) waste also known as sago
hampas is a by-product of starch extraction from Metrox-
ylon sagu (sago palm). Sago palm is becoming an impor-
tant socioeconomic crop in countries such as Papua New
Guinea, Indonesia, Malaysia, Thailand and the Philippines
[26]. This biomass has good chemical stability, high
mechanical strength and a granular structure, making it a
good adsorbent material for treating dye from wastewater.
In the present study, agricultural sago waste was treated
with alkaline and acid for the removal of methylene blue
from aqueous solutions. The enhancement of unmodified
Metroxylon spp. waste by alkali and acid treatment has
been investigated here toward the development of a dye-
removing adsorbent that is high in adsorption capacity,
cost-effective and requires only simple processing. Batch
studies were performed to evaluate the effects of various
parameters such as pH, initial dye concentration and
adsorbent dosage on the removal of a basic dye from an
aqueous solution. The textural and physicochemical prop-
erties, adsorption isotherms and kinetic parameters have
also been determined and discussed.
Materials and methods
Reagents
The following chemical reagents were of analytical grade
(AR) and purchased from Merck and Sigma Aldrich
companies: orthophosphoric acid, potassium hydroxide,
sodium chloride, sodium hydroxide, hydrochloric acid and
methylene blue (MB). Methylene blue was chosen in this
study because of its known strong adsorption onto solids
and its recognized usefulness in characterizing adsorptive
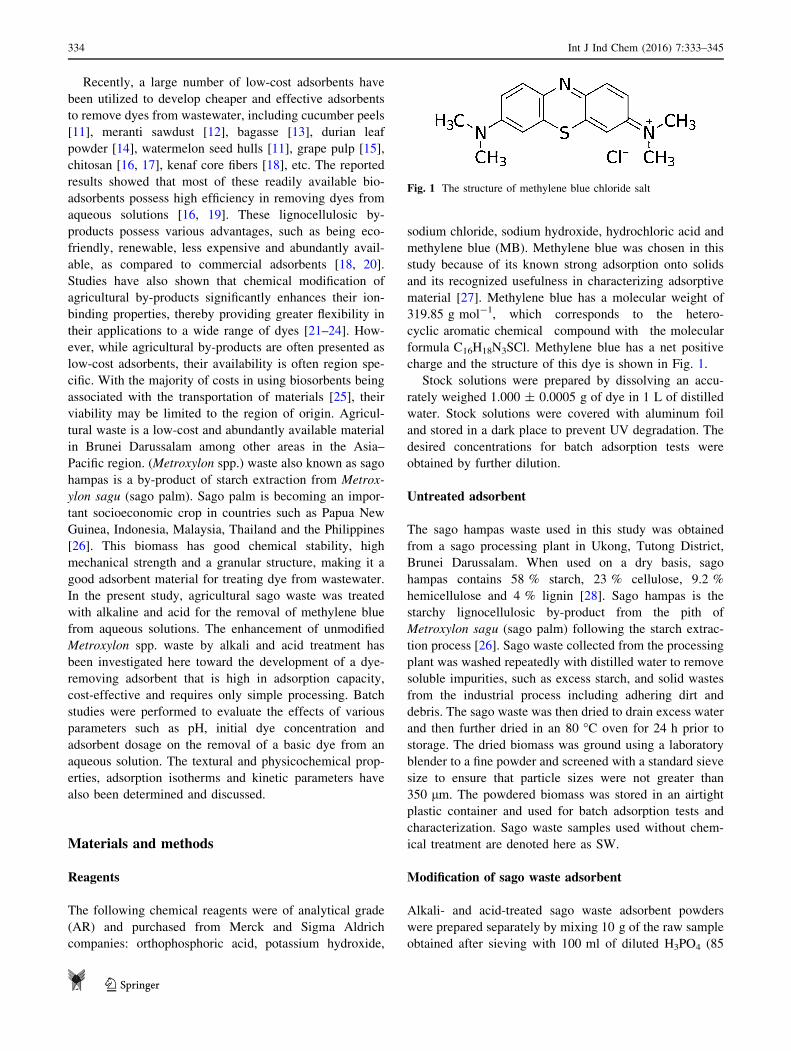
material [27]. Methylene blue has a molecular weight of
319.85 g mol-1, which corresponds to the hetero-
cyclic aromatic chemical compound with the molecular
formula C16H18N3SCl. Methylene blue has a net positive
charge and the structure of this dye is shown in Fig. 1.
Stock solutions were prepared by dissolving an accu-
rately weighed 1.000 ± 0.0005 g of dye in 1 L of distilled
water. Stock solutions were covered with aluminum foil
and stored in a dark place to prevent UV degradation. The
desired concentrations for batch adsorption tests were
obtained by further dilution.
Untreated adsorbent
The sago hampas waste used in this study was obtained
from a sago processing plant in Ukong, Tutong District,
Brunei Darussalam. When used on a dry basis, sago
hampas contains 58 % starch, 23 % cellulose, 9.2 %
hemicellulose and 4 % lignin [28]. Sago hampas is the
starchy lignocellulosic by-product from the pith of
Metroxylon sagu (sago palm) following the starch extrac-
tion process [26]. Sago waste collected from the processing
plant was washed repeatedly with distilled water to remove
soluble impurities, such as excess starch, and solid wastes
from the industrial process including adhering dirt and
debris. The sago waste was then dried to drain excess water
and then further dried in an 80 �C oven for 24 h prior to
storage. The dried biomass was ground using a laboratory
blender to a fine powder and screened with a standard sieve
size to ensure that particle sizes were not greater than
350 lm. The powdered biomass was stored in an airtight
plastic container and used for batch adsorption tests and
characterization. Sago waste samples used without chem-
ical treatment are denoted here as SW.
Modification of sago waste adsorbent
Alkali- and acid-treated sago waste adsorbent powders
were prepared separately by mixing 10 g of the raw sample
obtained after sieving with 100 ml of diluted H3PO4 (85
Fig. 1 The structure of methylene blue chloride salt
334 Int J Ind Chem (2016) 7:333–345
123
wt%) to a concentration of (20. 0 %) w/v in a beaker.
Similarly, 10 g of sieved sample was mixed with 100 ml
solution of dissolved KOH to a concentration of (1.0 M) in
a beaker. The reaction mixtures were stirred with a mag-
netic stirrer for a period of 24 h prior to filtration to achieve
good penetration of chemical into the interior of the
precursor.
After that, the chemically treated samples were sub-
jected to thorough washing with hot water (80 �C), mild
acid (0.1 M HCl) and base (0.1 M NaOH) till the effluent
water shows the neutral pH. The samples were dried at
70 �C overnight and used for batch adsorption tests and
characterization. The treated sago wastes are denoted as
SKOH and SHP for alkali- and acid-treated adsorbents,
respectively.
Characterization of adsorbent
The method for determining the point of zero charge, pHPZC,
for adsorbents is described elsewhere [29]. Briefly, 50 mL of
0.01 M KNO3 solutions were placed in various Erlenmeyer
flasks. The pH of the solutions was adjusted to values
between 2 and 10 by the addition of 0.1 M HCl and NaOH
solutions. For each solution, 0.2 g of adsorbent powder was
added and the final pH recorded after 48 h. The pHPZC is the
point where pHfinal and pHinitial values are equal.
The Boehm titration method was applied to determine
the amounts of acidic and basic surface functional groups.
The main principle of this method is that surface oxygen
groups are either acidic or basic moieties that are neutral-
ized by bases and acids, respectively [30]. Prior to analysis,
the adsorbent samples were dried in an oven at 110 �C for
3 h. For each adsorbent, 0.2 g amounts were placed in
stoppered glass flasks and 30 mL of either 0.1 M NaOH or
0.1 M HCl was added. The bottles were sealed and shaken
at 250 rpm for 48 h at 298 K to reach equilibrium. Sus-
pensions at equilibrium were filtered and 20 mL of each
filtrate was pipetted into 100 mL Erlenmeyer flasks. Fil-
trates containing excesses of NaOH and HCl were titrated
with 0.1 M HCl and 0.1 M NaOH, respectively. The
numbers of acidic and basic sites were calculated by
determining the amounts of NaOH and HCl that reacted
with the adsorbents [30]. The specific surface area was
calculated from the amount of adsorbed methylene blue at
maximum adsorption capacity according to:
Specific Surface Area ¼ MMBAvAMB
319:85� 1
MS
; ð1Þ
where MMB is the mass (g) of methylene blue adsorbed at
the point of maximum adsorption; Ms is the mass (g) of the
adsorbents; Av is Avogadro’s number, 6.02 9 1023; and
AMB is the area covered by one methylene blue molecule
(typically assumed to be 1.62 9 10-18 m2) [31]).
The physical properties such as specific surface area and
pore volume distribution were measured by the nitrogen gas
adsorption technique using a surface area analyzer (Quan-
tachrome Corporation, USA) with liquid nitrogen at 77 K.
The surface areawas calculated using the Brunauer–Emmett–
Teller (BET) method. Prior to the experiment, the samples
were out-gassed at 393 K for 5 h. Field emission scanning
electron microscopy (FESEM) images were obtained using a
Superscan SS-550 field emission scanning electron micro-
scope (Shimadzu Corporation; Kyoto, Japan) and used to
investigate the surface morphologies of adsorbents. The
effects of chemical treatment on the surface functionalization
of adsorbents were evaluated by Fourier transform infrared
spectroscopy (FTIR) with spectra recorded between 4000 and
400 cm-1 (resolution of 4 cm-1 and acquisition rate of
32 scan min-1) using an IR Prestige-21/FTIR-8400S spec-
trometer (Shimadzu Corporation; Kyoto, Japan).
Batch adsorption experiments
The effects of experimental parameters, such as MB con-
centration (75, 150 and 300 ppm), pH (2–12) and adsorbent
dosage (1–10 g/L) on dye adsorption by treated and
untreated sago wastes, were studied in batch adsorption
experiments. The pH of the experimental solutions was
adjusted by the addition of HCl and NaOH. All adsorption
experiments were conducted in 250 mL conical flasks with
50 mL of dye solution (with the desired concentration and
pH) for pH tests and 100 mL for adsorbent dosage tests
added to SW, SKOH and SHP adsorbents. The solutions
were mechanically agitated in a rotary shaker at 250 rpm
and at a constant temperature of 298 K. For studies of pH
and adsorbent dosage at initial dye concentrations of
300 mg/L, respectively, equilibrium was achieved within
2 h. The solutions were then filtered through Whatman No.
40 filter paper and the absorbance of filtrates was deter-
mined using a UV/visible spectrophotometer (PerkinElmer;
USA) at a maximum wavelength of 665 nm. The MB
concentrations were calculated from a calibration curve.
The amounts of adsorbed dye per gram of adsorbent at
equilibrium, qe (mg/g), and the percentage removal (RE)
were calculated by the following equations:
qe ¼ðC0 � CeÞV
W; ð2Þ
%RE ¼ ðC0 � CeÞ100C0
; ð3Þ
where C0 and Ce are the initial and equilibrium concen-
trations of MB, respectively (mg/L). V is the volume of dye
solution (L) and W is the mass of the adsorbent used (g).
Adsorption isotherm experiments were carried out by
agitating MB solutions of different concentrations
Int J Ind Chem (2016) 7:333–345 335
123
(10–1000 mg/L) with 0.1 g of adsorbent at a constant
temperature of 298 K. To ensure full equilibration, a
shaking time of 120 min was used for all concentrations of
MB. To study the kinetics of biosorption, 0.1 g of different
adsorbents was added to 50 mL of dye solutions at initial
concentrations of 75, 150 and 300 mg/L. Aqueous samples
were taken at different time intervals for the measurement
of MB concentration.
Results and discussion
Characterization of adsorbents
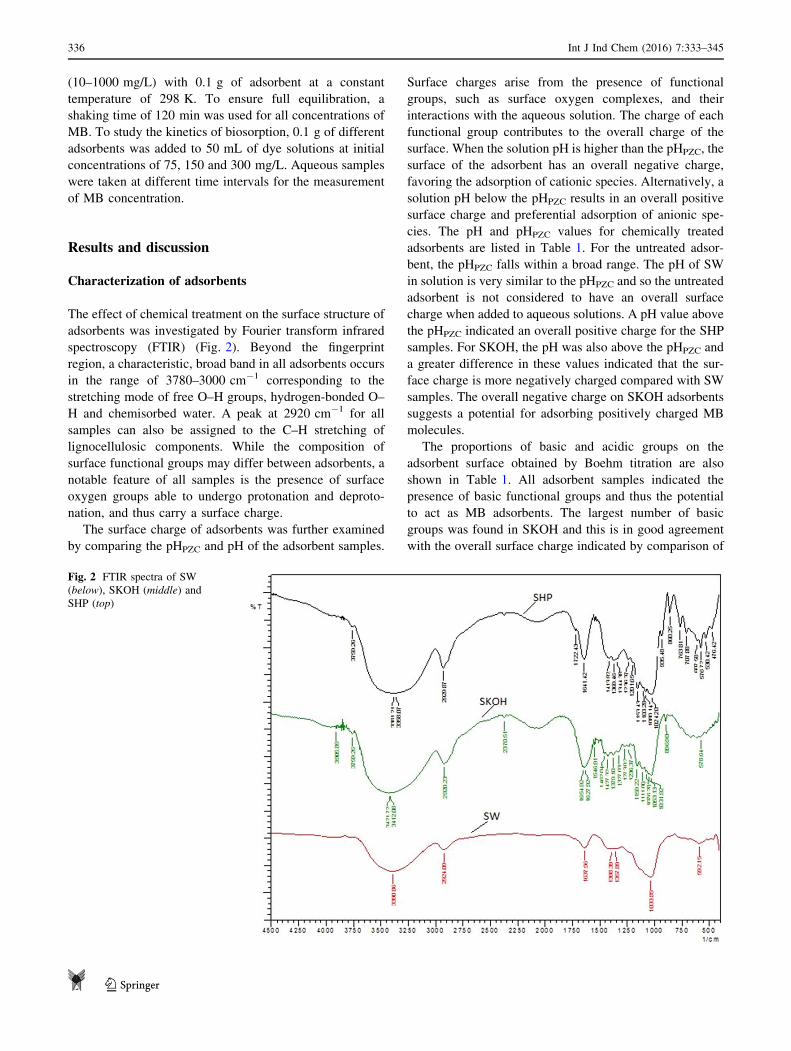
The effect of chemical treatment on the surface structure of
adsorbents was investigated by Fourier transform infrared
spectroscopy (FTIR) (Fig. 2). Beyond the fingerprint
region, a characteristic, broad band in all adsorbents occurs
in the range of 3780–3000 cm-1 corresponding to the
stretching mode of free O–H groups, hydrogen-bonded O–
H and chemisorbed water. A peak at 2920 cm-1 for all
samples can also be assigned to the C–H stretching of
lignocellulosic components. While the composition of
surface functional groups may differ between adsorbents, a
notable feature of all samples is the presence of surface
oxygen groups able to undergo protonation and deproto-
nation, and thus carry a surface charge.
The surface charge of adsorbents was further examined
by comparing the pHPZC and pH of the adsorbent samples.
Surface charges arise from the presence of functional
groups, such as surface oxygen complexes, and their
interactions with the aqueous solution. The charge of each
functional group contributes to the overall charge of the
surface. When the solution pH is higher than the pHPZC, the
surface of the adsorbent has an overall negative charge,
favoring the adsorption of cationic species. Alternatively, a
solution pH below the pHPZC results in an overall positive
surface charge and preferential adsorption of anionic spe-
cies. The pH and pHPZC values for chemically treated
adsorbents are listed in Table 1. For the untreated adsor-
bent, the pHPZC falls within a broad range. The pH of SW
in solution is very similar to the pHPZC and so the untreated
adsorbent is not considered to have an overall surface
charge when added to aqueous solutions. A pH value above
the pHPZC indicated an overall positive charge for the SHP
samples. For SKOH, the pH was also above the pHPZC and
a greater difference in these values indicated that the sur-
face charge is more negatively charged compared with SW
samples. The overall negative charge on SKOH adsorbents
suggests a potential for adsorbing positively charged MB
molecules.
The proportions of basic and acidic groups on the
adsorbent surface obtained by Boehm titration are also
shown in Table 1. All adsorbent samples indicated the
presence of basic functional groups and thus the potential
to act as MB adsorbents. The largest number of basic
groups was found in SKOH and this is in good agreement
with the overall surface charge indicated by comparison of
Fig. 2 FTIR spectra of SW
(below), SKOH (middle) and
SHP (top)
336 Int J Ind Chem (2016) 7:333–345
123
pH and pHPZC values. However, the number of basic
groups is lower for SHP than SW despite pH and pHPZC
values indicating that SHP is more likely to have an overall
positive charge than SW. The specific surface area was
increased from 246.4 to 549.4 m2/g for SW and SKOH and
a significant decrease to 75.6 m2/g for SHP is in agreement
with the number of negatively charged functional groups
available for adsorbing MB molecules.
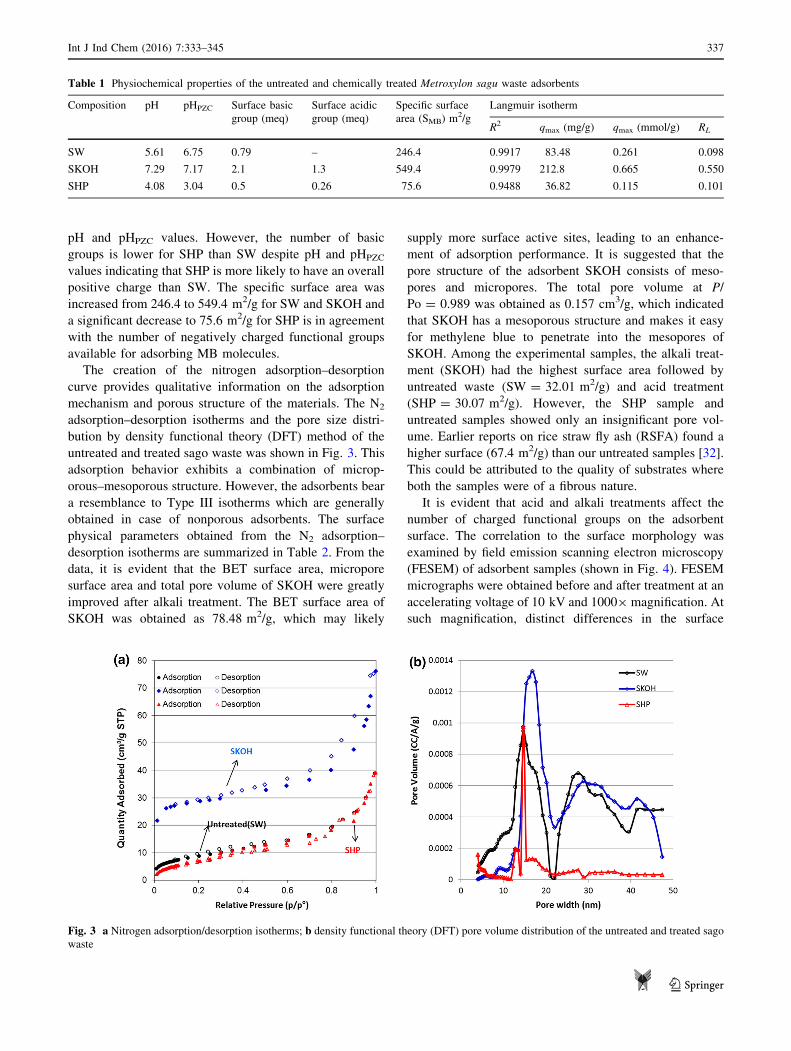
The creation of the nitrogen adsorption–desorption
curve provides qualitative information on the adsorption
mechanism and porous structure of the materials. The N2
adsorption–desorption isotherms and the pore size distri-
bution by density functional theory (DFT) method of the
untreated and treated sago waste was shown in Fig. 3. This
adsorption behavior exhibits a combination of microp-
orous–mesoporous structure. However, the adsorbents bear
a resemblance to Type III isotherms which are generally
obtained in case of nonporous adsorbents. The surface
physical parameters obtained from the N2 adsorption–
desorption isotherms are summarized in Table 2. From the
data, it is evident that the BET surface area, micropore
surface area and total pore volume of SKOH were greatly
improved after alkali treatment. The BET surface area of
SKOH was obtained as 78.48 m2/g, which may likely
supply more surface active sites, leading to an enhance-
ment of adsorption performance. It is suggested that the
pore structure of the adsorbent SKOH consists of meso-
pores and micropores. The total pore volume at P/
Po = 0.989 was obtained as 0.157 cm3/g, which indicated
that SKOH has a mesoporous structure and makes it easy
for methylene blue to penetrate into the mesopores of
SKOH. Among the experimental samples, the alkali treat-
ment (SKOH) had the highest surface area followed by
untreated waste (SW = 32.01 m2/g) and acid treatment
(SHP = 30.07 m2/g). However, the SHP sample and
untreated samples showed only an insignificant pore vol-
ume. Earlier reports on rice straw fly ash (RSFA) found a
higher surface (67.4 m2/g) than our untreated samples [32].
This could be attributed to the quality of substrates where
both the samples were of a fibrous nature.
It is evident that acid and alkali treatments affect the
number of charged functional groups on the adsorbent
surface. The correlation to the surface morphology was
examined by field emission scanning electron microscopy
(FESEM) of adsorbent samples (shown in Fig. 4). FESEM
micrographs were obtained before and after treatment at an
accelerating voltage of 10 kV and 10009 magnification. At
such magnification, distinct differences in the surface
Table 1 Physiochemical properties of the untreated and chemically treated Metroxylon sagu waste adsorbents
Composition pH pHPZC Surface basic
group (meq)
Surface acidic
group (meq)
Specific surface
area (SMB) m2/g
Langmuir isotherm
R2 qmax (mg/g) qmax (mmol/g) RL
SW 5.61 6.75 0.79 – 246.4 0.9917 83.48 0.261 0.098
SKOH 7.29 7.17 2.1 1.3 549.4 0.9979 212.8 0.665 0.550
SHP 4.08 3.04 0.5 0.26 75.6 0.9488 36.82 0.115 0.101
Fig. 3 a Nitrogen adsorption/desorption isotherms; b density functional theory (DFT) pore volume distribution of the untreated and treated sago
waste
Int J Ind Chem (2016) 7:333–345 337
123
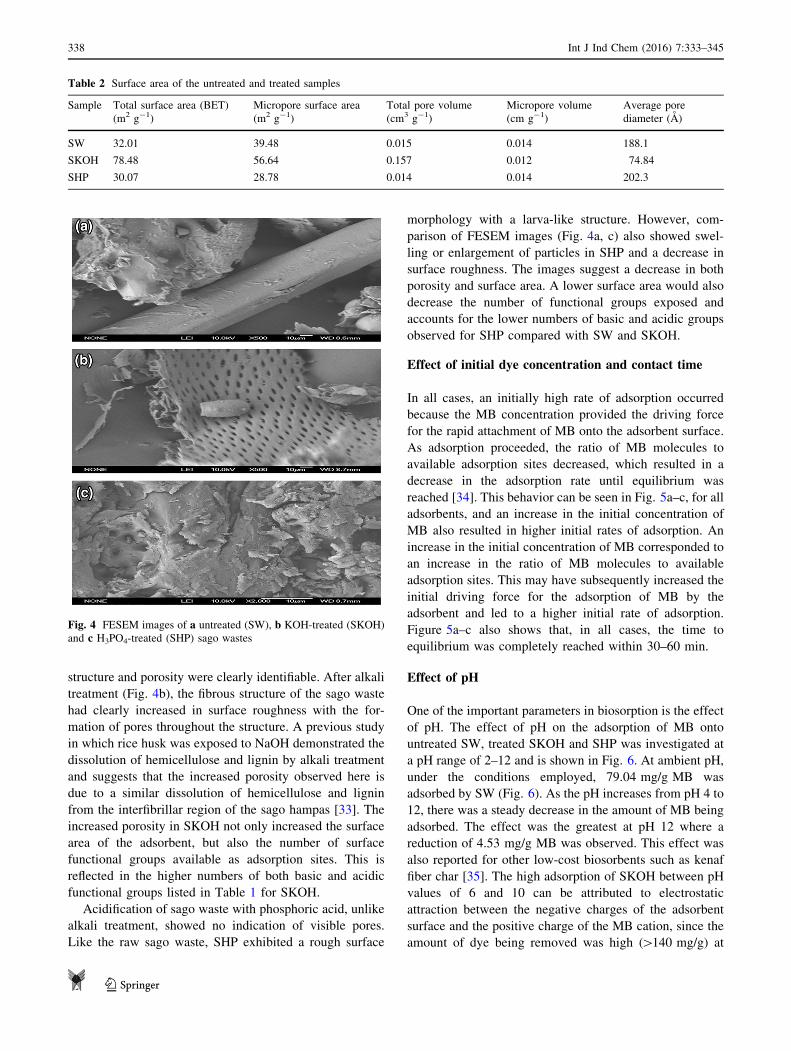
structure and porosity were clearly identifiable. After alkali
treatment (Fig. 4b), the fibrous structure of the sago waste
had clearly increased in surface roughness with the for-
mation of pores throughout the structure. A previous study
in which rice husk was exposed to NaOH demonstrated the
dissolution of hemicellulose and lignin by alkali treatment
and suggests that the increased porosity observed here is
due to a similar dissolution of hemicellulose and lignin
from the interfibrillar region of the sago hampas [33]. The
increased porosity in SKOH not only increased the surface
area of the adsorbent, but also the number of surface
functional groups available as adsorption sites. This is
reflected in the higher numbers of both basic and acidic
functional groups listed in Table 1 for SKOH.
Acidification of sago waste with phosphoric acid, unlike
alkali treatment, showed no indication of visible pores.
Like the raw sago waste, SHP exhibited a rough surface
morphology with a larva-like structure. However, com-
parison of FESEM images (Fig. 4a, c) also showed swel-
ling or enlargement of particles in SHP and a decrease in
surface roughness. The images suggest a decrease in both
porosity and surface area. A lower surface area would also
decrease the number of functional groups exposed and
accounts for the lower numbers of basic and acidic groups
observed for SHP compared with SW and SKOH.
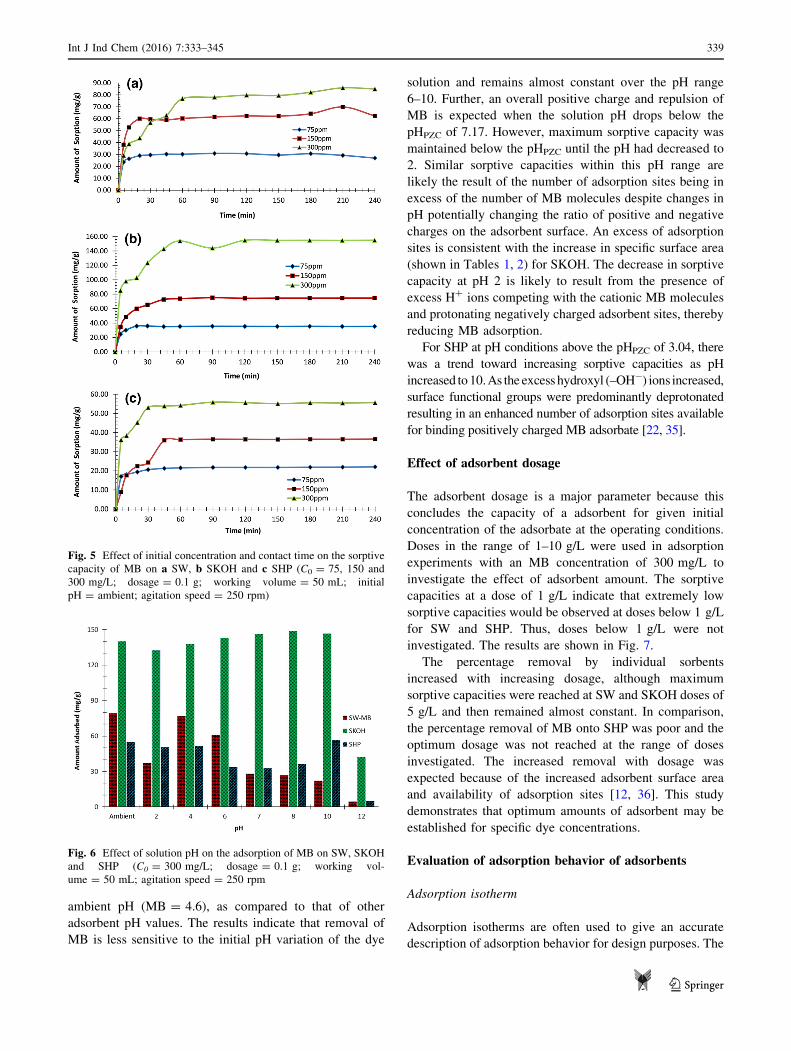
Effect of initial dye concentration and contact time
In all cases, an initially high rate of adsorption occurred
because the MB concentration provided the driving force
for the rapid attachment of MB onto the adsorbent surface.
As adsorption proceeded, the ratio of MB molecules to
available adsorption sites decreased, which resulted in a
decrease in the adsorption rate until equilibrium was
reached [34]. This behavior can be seen in Fig. 5a–c, for all
adsorbents, and an increase in the initial concentration of
MB also resulted in higher initial rates of adsorption. An
increase in the initial concentration of MB corresponded to
an increase in the ratio of MB molecules to available
adsorption sites. This may have subsequently increased the
initial driving force for the adsorption of MB by the
adsorbent and led to a higher initial rate of adsorption.
Figure 5a–c also shows that, in all cases, the time to
equilibrium was completely reached within 30–60 min.
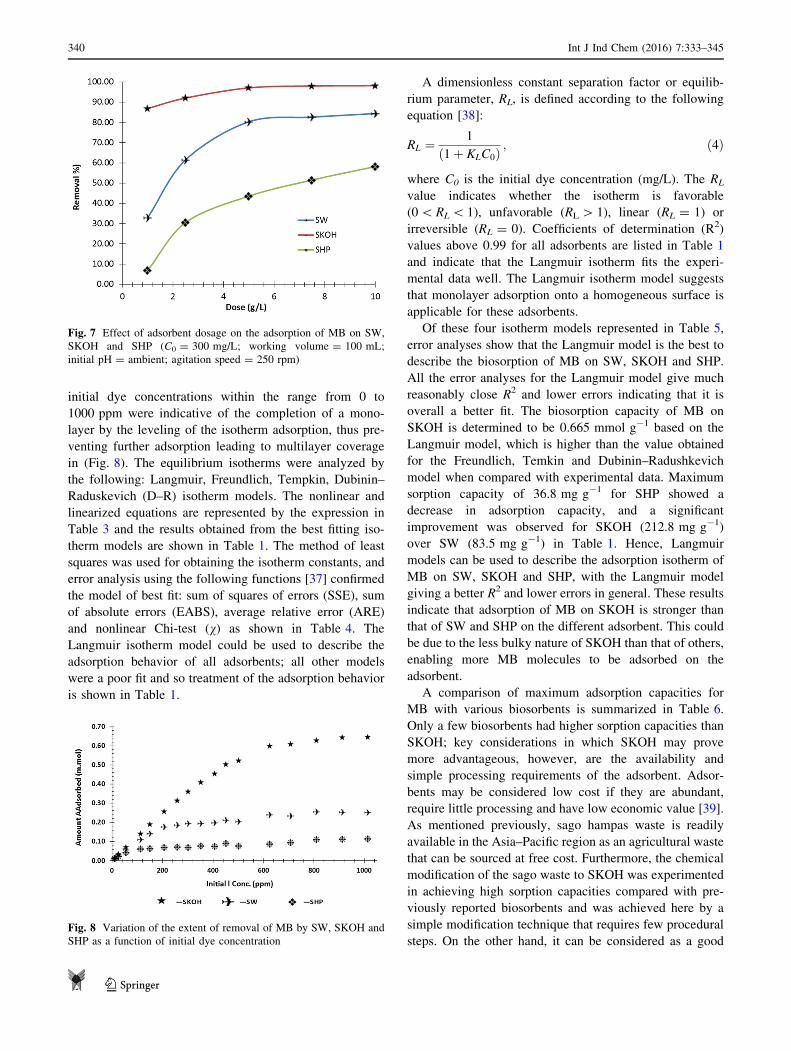
Effect of pH
One of the important parameters in biosorption is the effect
of pH. The effect of pH on the adsorption of MB onto
untreated SW, treated SKOH and SHP was investigated at
a pH range of 2–12 and is shown in Fig. 6. At ambient pH,
under the conditions employed, 79.04 mg/g MB was
adsorbed by SW (Fig. 6). As the pH increases from pH 4 to
12, there was a steady decrease in the amount of MB being
adsorbed. The effect was the greatest at pH 12 where a
reduction of 4.53 mg/g MB was observed. This effect was
also reported for other low-cost biosorbents such as kenaf
fiber char [35]. The high adsorption of SKOH between pH
values of 6 and 10 can be attributed to electrostatic
attraction between the negative charges of the adsorbent
surface and the positive charge of the MB cation, since the
amount of dye being removed was high ([140 mg/g) at
Table 2 Surface area of the untreated and treated samples
Sample Total surface area (BET)
(m2 g-1)
Micropore surface area
(m2 g-1)
Total pore volume
(cm3 g-1)
Micropore volume
(cm g-1)
Average pore
diameter (A)
SW 32.01 39.48 0.015 0.014 188.1
SKOH 78.48 56.64 0.157 0.012 74.84
SHP 30.07 28.78 0.014 0.014 202.3
Fig. 4 FESEM images of a untreated (SW), b KOH-treated (SKOH)
and c H3PO4-treated (SHP) sago wastes
338 Int J Ind Chem (2016) 7:333–345
123
ambient pH (MB = 4.6), as compared to that of other
adsorbent pH values. The results indicate that removal of
MB is less sensitive to the initial pH variation of the dye
solution and remains almost constant over the pH range
6–10. Further, an overall positive charge and repulsion of
MB is expected when the solution pH drops below the
pHPZC of 7.17. However, maximum sorptive capacity was
maintained below the pHPZC until the pH had decreased to
2. Similar sorptive capacities within this pH range are
likely the result of the number of adsorption sites being in
excess of the number of MB molecules despite changes in
pH potentially changing the ratio of positive and negative
charges on the adsorbent surface. An excess of adsorption
sites is consistent with the increase in specific surface area
(shown in Tables 1, 2) for SKOH. The decrease in sorptive
capacity at pH 2 is likely to result from the presence of
excess H? ions competing with the cationic MB molecules
and protonating negatively charged adsorbent sites, thereby
reducing MB adsorption.
For SHP at pH conditions above the pHPZC of 3.04, there
was a trend toward increasing sorptive capacities as pH
increased to10.As the excess hydroxyl (–OH-) ions increased,
surface functional groups were predominantly deprotonated
resulting in an enhanced number of adsorption sites available
for binding positively charged MB adsorbate [22, 35].
Effect of adsorbent dosage
The adsorbent dosage is a major parameter because this
concludes the capacity of a adsorbent for given initial
concentration of the adsorbate at the operating conditions.
Doses in the range of 1–10 g/L were used in adsorption
experiments with an MB concentration of 300 mg/L to
investigate the effect of adsorbent amount. The sorptive
capacities at a dose of 1 g/L indicate that extremely low
sorptive capacities would be observed at doses below 1 g/L
for SW and SHP. Thus, doses below 1 g/L were not
investigated. The results are shown in Fig. 7.
The percentage removal by individual sorbents
increased with increasing dosage, although maximum
sorptive capacities were reached at SW and SKOH doses of
5 g/L and then remained almost constant. In comparison,
the percentage removal of MB onto SHP was poor and the
optimum dosage was not reached at the range of doses
investigated. The increased removal with dosage was
expected because of the increased adsorbent surface area
and availability of adsorption sites [12, 36]. This study
demonstrates that optimum amounts of adsorbent may be
established for specific dye concentrations.
Evaluation of adsorption behavior of adsorbents
Adsorption isotherm
Adsorption isotherms are often used to give an accurate
description of adsorption behavior for design purposes. The
Fig. 5 Effect of initial concentration and contact time on the sorptive
capacity of MB on a SW, b SKOH and c SHP (C0 = 75, 150 and
300 mg/L; dosage = 0.1 g; working volume = 50 mL; initial
pH = ambient; agitation speed = 250 rpm)
Fig. 6 Effect of solution pH on the adsorption of MB on SW, SKOH
and SHP (C0 = 300 mg/L; dosage = 0.1 g; working vol-
ume = 50 mL; agitation speed = 250 rpm
Int J Ind Chem (2016) 7:333–345 339
123
initial dye concentrations within the range from 0 to
1000 ppm were indicative of the completion of a mono-
layer by the leveling of the isotherm adsorption, thus pre-
venting further adsorption leading to multilayer coverage
in (Fig. 8). The equilibrium isotherms were analyzed by
the following: Langmuir, Freundlich, Tempkin, Dubinin–
Raduskevich (D–R) isotherm models. The nonlinear and
linearized equations are represented by the expression in
Table 3 and the results obtained from the best fitting iso-
therm models are shown in Table 1. The method of least
squares was used for obtaining the isotherm constants, and
error analysis using the following functions [37] confirmed
the model of best fit: sum of squares of errors (SSE), sum
of absolute errors (EABS), average relative error (ARE)
and nonlinear Chi-test (v) as shown in Table 4. The
Langmuir isotherm model could be used to describe the
adsorption behavior of all adsorbents; all other models
were a poor fit and so treatment of the adsorption behavior
is shown in Table 1.
A dimensionless constant separation factor or equilib-
rium parameter, RL, is defined according to the following
equation [38]:
RL ¼ 1
ð1þ KLC0Þ; ð4Þ
where C0 is the initial dye concentration (mg/L). The RL
value indicates whether the isotherm is favorable
(0\RL\ 1), unfavorable (RL[ 1), linear (RL = 1) or
irreversible (RL = 0). Coefficients of determination (R2)
values above 0.99 for all adsorbents are listed in Table 1
and indicate that the Langmuir isotherm fits the experi-
mental data well. The Langmuir isotherm model suggests
that monolayer adsorption onto a homogeneous surface is
applicable for these adsorbents.
Of these four isotherm models represented in Table 5,
error analyses show that the Langmuir model is the best to
describe the biosorption of MB on SW, SKOH and SHP.
All the error analyses for the Langmuir model give much
reasonably close R2 and lower errors indicating that it is
overall a better fit. The biosorption capacity of MB on
SKOH is determined to be 0.665 mmol g-1 based on the
Langmuir model, which is higher than the value obtained
for the Freundlich, Temkin and Dubinin–Radushkevich
model when compared with experimental data. Maximum
sorption capacity of 36.8 mg g-1 for SHP showed a
decrease in adsorption capacity, and a significant
improvement was observed for SKOH (212.8 mg g-1)
over SW (83.5 mg g-1) in Table 1. Hence, Langmuir
models can be used to describe the adsorption isotherm of
MB on SW, SKOH and SHP, with the Langmuir model
giving a better R2 and lower errors in general. These results
indicate that adsorption of MB on SKOH is stronger than
that of SW and SHP on the different adsorbent. This could
be due to the less bulky nature of SKOH than that of others,
enabling more MB molecules to be adsorbed on the
adsorbent.
A comparison of maximum adsorption capacities for
MB with various biosorbents is summarized in Table 6.
Only a few biosorbents had higher sorption capacities than
SKOH; key considerations in which SKOH may prove
more advantageous, however, are the availability and
simple processing requirements of the adsorbent. Adsor-
bents may be considered low cost if they are abundant,
require little processing and have low economic value [39].
As mentioned previously, sago hampas waste is readily
available in the Asia–Pacific region as an agricultural waste
that can be sourced at free cost. Furthermore, the chemical
modification of the sago waste to SKOH was experimented
in achieving high sorption capacities compared with pre-
viously reported biosorbents and was achieved here by a
simple modification technique that requires few procedural
steps. On the other hand, it can be considered as a good
Fig. 7 Effect of adsorbent dosage on the adsorption of MB on SW,
SKOH and SHP (C0 = 300 mg/L; working volume = 100 mL;
initial pH = ambient; agitation speed = 250 rpm)
Fig. 8 Variation of the extent of removal of MB by SW, SKOH and
SHP as a function of initial dye concentration
340 Int J Ind Chem (2016) 7:333–345
123
biosorbent in the context of its higher qmax value as it is
able to remove MB better than many other treated
biosorbents, such as citric/EDTA-modified alkali rice
straw, citric acid-modified kenaf core fibers, sulfuric acid-
treated parthenium and EDTA-modified rice husk given in
Table 6.
Advantages over other biosorbents for SKOH may also
include a less energy-intensive treatment process. For
example, modification by the alkali treatment process is
less energy intensive than biosorbent treatments that
require high temperatures to produce activated carbon (e.g.,
activated carbon from apricot [40] and sago waste carbon
[41]. Less intensive processing requirements for SKOH
suggests potentially lower expenses in the use of this
biosorbent.
Adsorption kinetics
A kinetic study of adsorption is necessary as it provides the
information about the adsorption mechanism, which is
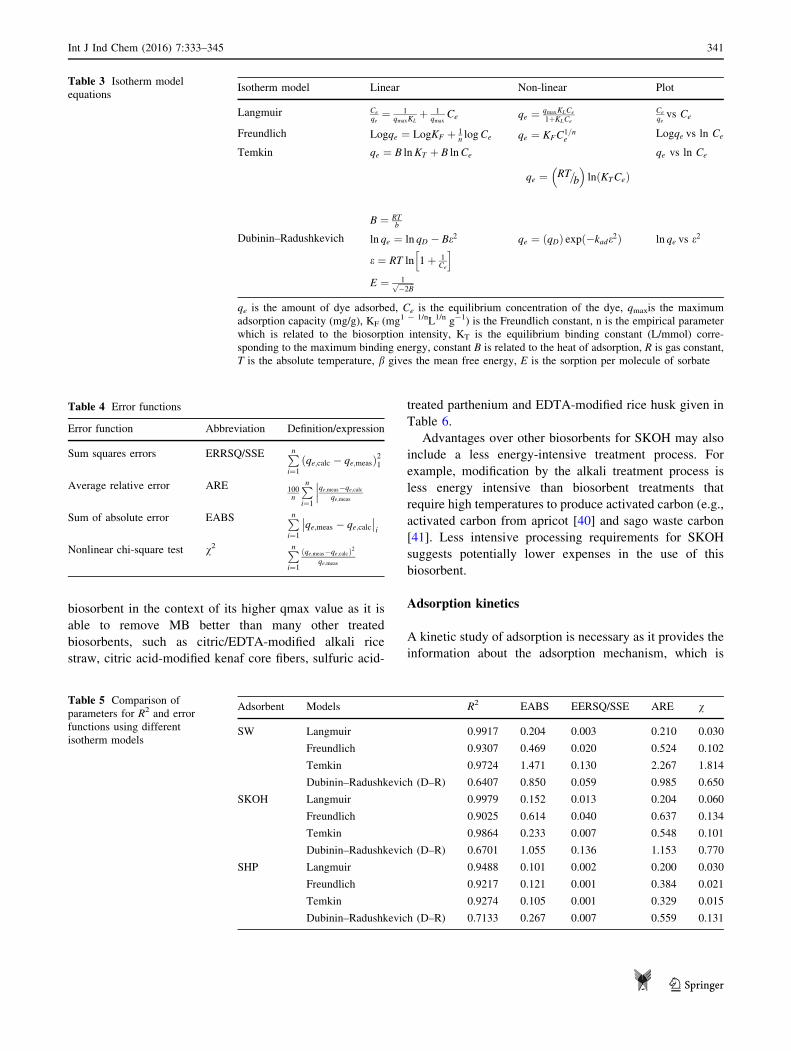
Table 3 Isotherm model
equationsIsotherm model Linear Non-linear Plot
Langmuir Ce
qe¼ 1
qmaxKLþ 1
qmaxCe qe ¼ qmaxKLCe
1þKLCe
Ce
qevs Ce
Freundlich Logqe ¼ LogKF þ 1nlogCe qe ¼ KFC
1=ne
Logqe vs ln Ce
Temkin qe ¼ B lnKT þ B lnCe
qe ¼ RT=b
� �lnðKTCeÞ
qe vs ln Ce
B ¼ RTb
Dubinin–Radushkevich ln qe ¼ ln qD � Be2 qe ¼ ðqDÞ expð�kade2Þ ln qe vs e2
e ¼ RT ln 1þ 1Ce
h i
E ¼ 1ffiffiffiffiffiffiffi�2B
p
qe is the amount of dye adsorbed, Ce is the equilibrium concentration of the dye, qmaxis the maximum
adsorption capacity (mg/g), KF (mg1 - 1/nL1/n g-1) is the Freundlich constant, n is the empirical parameter
which is related to the biosorption intensity, KT is the equilibrium binding constant (L/mmol) corre-
sponding to the maximum binding energy, constant B is related to the heat of adsorption, R is gas constant,
T is the absolute temperature, b gives the mean free energy, E is the sorption per molecule of sorbate
Table 4 Error functions
Error function Abbreviation Definition/expression
Sum squares errors ERRSQ/SSE Pni¼1
ðqe;calc � qe;measÞ21
Average relative error ARE 100n
Pni¼1
qe;meas�qe;calcqe;meas
���Sum of absolute error EABS Pn
i¼1
qe;meas � qe;calc�� ��
i
Nonlinear chi-square test v2 Pni¼1
ðqe;meas�qe;calcÞ2qe;meas
Table 5 Comparison of
parameters for R2 and error
functions using different
isotherm models
Adsorbent Models R2 EABS EERSQ/SSE ARE v
SW Langmuir 0.9917 0.204 0.003 0.210 0.030
Freundlich 0.9307 0.469 0.020 0.524 0.102
Temkin 0.9724 1.471 0.130 2.267 1.814
Dubinin–Radushkevich (D–R) 0.6407 0.850 0.059 0.985 0.650
SKOH Langmuir 0.9979 0.152 0.013 0.204 0.060
Freundlich 0.9025 0.614 0.040 0.637 0.134
Temkin 0.9864 0.233 0.007 0.548 0.101
Dubinin–Radushkevich (D–R) 0.6701 1.055 0.136 1.153 0.770
SHP Langmuir 0.9488 0.101 0.002 0.200 0.030
Freundlich 0.9217 0.121 0.001 0.384 0.021
Temkin 0.9274 0.105 0.001 0.329 0.015
Dubinin–Radushkevich (D–R) 0.7133 0.267 0.007 0.559 0.131
Int J Ind Chem (2016) 7:333–345 341
123
crucial for the practicality of the process. The pseudo-first-
order, pseudo-second-order, intraparticle diffusion and
Elovich models were implemented to evaluate the rate
constant of the adsorption process for SW, SHP and SKOH
samples onto MB at various initial concentrations. The
experimental data were fitted with the kinetic models lin-
earized equations in Table 7 and the linear regression
analyses and the constants were calculated by using
Microsoft Excel, Version 2010. The experimental and
calculated qe values from the related plots together with
the model constants and correlation coefficient R2 deter-
mined from the kinetic models for sorption of MB onto
SW, SHP and SKOH samples at 30 �C are summarized in
Table 8. The validity of the exploited models is verified by
the experimental qe exp and correlation coefficient R2.
In the case of the pseudo-first-order kinetic model values
proposed by Lagergren [42] in Table 8, low linear regres-
sion correlation coefficients (R2\ 0.9) indicated poor
agreement between the model and experimental data. The
experimental equilibrium uptakes, qe,exp (mg/g), do not
concur with the calculated qe,cal (mg/g) values from the
pseudo-first-order model which reflect that experimental
data obtained for sorption of the MB under investigation
fails to predict the sorption process for the entire region of
contact time. The rate constant, k1, obtained for the pseudo-
first-order model do not show a consistent trend with
increasing concentration range for MB studied as most R2
values are relatively small.
However, the linear form of pseudo-second-order
equation proposed by Ho and McKay [43] was found to be
Table 6 Comparison of the
maximum monolayer
adsorption capacities, qmax (mg/
g) of MB dye on various
biomass-based adsorbents
Adsorbent Adsorption capacity (mg/g) Reference
Untreated waste
Untreated (Metroxylon sagu) waste 83.48 This study
Pine cone biomass 109.89 [10]
Cucumber peels 111.11 [11]
Watermelon seed hulls 57.14 [11]
Grape pulp 153.85 [15]
Peanut husk 72.13 [46]
Spent rice biomass 8.3 [47]
Treated waste
Potassium hydroxide-treated (Metroxylon sagu) waste 212.8 This study
Phosphoric acid treated (Metroxylon sagu) waste 36.82 This study
Citric and/or EDTA-modified alkali rice straws 62.90–135.10 [22]
Activated carbon from apricot 136.98 [40]
Citric acid-modified rice straw 270.3 [48]
Citric acid-modified kenaf core fibers 131.6 [18]
Sulfuric acid-treated parthenium 88.29 [49]
EDTA-modified rice husk 46.30 [23]
Sago waste carbon 4.51 [41]
HCL-treated meranti sawdust 120.48 [12]
TA-modified bagasse 69.93 [13]
NaOH-modified durian leaf powder 125 [14]
Table 7 Kinetic model
equationsKinetic models Equation Plot
Pseudo-first-order model Logðqe � qtÞ ¼ Logqe � K1
2:303 t Logðqe � qtÞ vs tPseudo-second-order model t
qt¼ 1
k2q2eþ 1
qet t
qtvs t
Elovich model qt ¼ 1b
� �lnðabÞ þ 1
bln t qt vs ln t
Intra-particle diffusion model qt ¼ kidt1=2 þ C qt vs t
1=2
qe and qt are the amounts of MB adsorbed (mg g-1) at equilibrium and at time t (min), respectively; k1(min-1) is the adsorption rate constant; k2 (g mg
-1 min-1) is the rate constant of second-order adsorption;
k1 d (mg/g h) is the intraparticle diffusion rate constant and C gives an idea about the thickness of the
boundary layer; a (mg/g h) is the initial sorption rate and b (g/mg) is related to the extent of surface
coverage and activation energy for chemisorption
342 Int J Ind Chem (2016) 7:333–345
123
able to predict the behavior of the sorption process for all
the range of concentrations studied here. The linear plots of
t/qt against t (min) gives 1/qe(cal) as the slope and 1/k2qe2 as
the intercept, where k2 (g/mg-min) is the rate constant of
the second-order adsorption as shown in Table 8 and
Fig. 9. It is observed that the regression lines are almost
superimposed by the experimental data. R2 values between
0.9990 and 0.9999 and calculated qe values similar to those
determined experimentally indicated that MB adsorption
obeyed pseudo-second-order kinetics for all adsorbents,
whereby an assumption of the model is that the rate of
chemisorption is a significant factor in determining
adsorption rates.
The values of the intraparticle diffusion model by
Weber and Morris [43] constants (kid and C) obtained for
all adsorbent system together with the R2 values obtained
are presented in Table 8. Positive C values indicated that
intraparticle diffusion was not solely the rate-determining
step and that other factors contribute to the rate of
adsorption. This is particularly the case at higher MB
concentrations where larger C values indicate a greater
degree of boundary layer control and deviation from the
intraparticle diffusion model. R2 values also indicated aTable
8Kinetic
model
constants
andcorrelationcoefficients
foradsorptionofMBdyeusingvariousadsorbents
atdifferentinitialconcentrations
Concentration
(ppm)
Adsorbent
Exp.uptake
capacity
Pseudo-first-order
model
Pseudo-second-order
model
Intraparticlediffusion
model
Elovichmodel
qe,Exp(m
g/g)
R2
qe,calc(m
g/
g)
K1
(min
-1)
R2
qe,calc(m
g/
g)
K2
g/m
g(m
in)
R2
CKid
R2
a(m
g/
gmin)
b(g/
mg)
300
SW
85.90
0.9447
7.46
0.031
0.9993
96.15
8.789
10-6
0.9373
21.11
9.155
0.9059
19.19
0.062
SKOH
146.07
0.6876
5.90
0.014
0.9999
144.93
4.289
10-8
0.7738
135.82
1.388
0.8919
135.37
0.390
SHP
55.88
0.8619
14.07
0.033
0.9990
57.14
7.999
10-6
0.7827
36.43
2.952
0.8819
34.56
0.178
150
SW
64.16
0.5879
16.73
0.008
0.9993
64.52
3.489
10-6
0.6768
44.42
2.952
0.8553
41.55
0.168
SKOH
75.10
0.8582
5.93
0.021
0.9999
74.63
6.649
10-7
0.7938
65.65
1.368
0.9318
65.11
0.392
SHP
26.61
0.6859
7.03
0.038
0.9994
27.70
9.309
10-5
0.7067
13.21
2.101
0.9184
10.99
0.233
75
SW
30.89
0.7467
2.01
0.019
0.9999
30.77
9.519
10-6
0.7039
28.77
0.304
0.9028
26.27
0.833
SKOH
35.64
0.4407
0.92
0.015
0.9999
35.46
1.999
10-6
0.5817
32.88
0.406
0.7657
32.61
1.246
SHP
22.09
0.6290
2.83
0.027
0.9998
22.42
9.479
10-5
0.8839
16.89
0.791
0.9449
16.67
0.720
Fig. 9 Pseudo-second-order kinetics model for adsorption of MB on
a SW, b SKOH and c SHP
Int J Ind Chem (2016) 7:333–345 343
123
poor agreement of experimental data with the pseudo-
second-order kinetic model. Contributors to adsorption
rates that lead to positive C values may include other dif-
fusion mechanisms (e.g., film diffusion) or chemisorption,
as found earlier by the agreement with pseudo-second-
order kinetics. However, their contributions to the
adsorption rate cannot be deduced from this model. Linear
plots with reasonable R2 values indicate agreement with
chemisorption processes contributing significantly to
adsorption rates.
Elovich equation, described by Chien and Clayton [45],
is another most frequently used model for depicting
chemisorption process and is expressed by Equation in
Table 7. It is observed that the values of a (mg g-1 min-1)
increase with the increase of initial concentration range
studied. The values of the regression coefficient
(R2 = 0.79–0.98) of the Elovich kinetic model suggest that
kinetic data did not follow the Elovich model. However,
the higher values of the Elovich constants, a (mg g-1 -
min-1) and b (g mg -1), as shown in Table 8 are sugges-
tive of an increased rate of chemisorption. However,
experimental data again showed better agreement with the
pseudo-second-order kinetic model where the R2 values
obtained for other three kinetics models are less than 0.9,
and the majority of the data do not fall on a straight line,
indicating that these models are inappropriate.
Conclusions
The chemical treatment of adsorbents has been shown here
to have significant effects on the adsorption capacity of
sago waste powder on basic dyes such as methylene blue.
Acid treatment resulted in a lower adsorbent surface area
that subsequently reduced the adsorption capacity. How-
ever, alkaline treatment demonstrated the effectiveness of
using chemical treatment to enhance the adsorption
capacity of biosorbents. The treatment process increased
the porosity and surface area of the sago waste powder,
thereby increasing the number of adsorption sites. The
adsorption capacity and kinetics for the adsorbents inves-
tigated were well described by the monolayer adsorption
model of the Langmuir isotherm and the chemisorption
model of pseudo-second-order kinetics. An improvement
in the maximum adsorption capacity was observed for the
alkali-treated sago waste with an adsorption capacity more
than double that exhibited by the untreated sago waste.
Maximum adsorption capacities of 83.5, 212.8 and
36.8 mg/g were found for untreated, alkali-treated and
acid-treated sago wastes, respectively. The alkali-treated
sago waste also showed significant improvement over a
wide range of biosorbents previously reported. The sago
waste used in this investigation is a low-cost agricultural
waste found abundantly in the Asia–Pacific region. The
alkali treatment was a simple process that requires few
procedural steps, avoids energy-intensive heat treatment
and shows potential for implementation on wastewater
treatment. We propose that alkali-treated sago waste rep-
resents an effective and economically feasible material for
the treatment of dye-containing effluents.
Acknowledgments The authors thank the Government of Brunei
Darussalam and the Universiti Brunei Darussalam (UBD) for their
financial support and the award of a PhD scholarship to JOA. The
authors are grateful to the Bioenvironmental Engineering Research
Unit (BERU), Faculty of Engineering, International Islamic Univer-
sity Malaysia for providing the laboratory support and facilities.
Compliance with ethical standards
Conflict of interest The authors have no conflicts of interest to
declare.
Open Access This article is distributed under the terms of the
Creative Commons Attribution 4.0 International License (http://crea
tivecommons.org/licenses/by/4.0/), which permits unrestricted use,
distribution, and reproduction in any medium, provided you give
appropriate credit to the original author(s) and the source, provide a
link to the Creative Commons license, and indicate if changes were
made.
References
1. Chatterjee S, Lee DS, Lee MW, Woo SH (2009) Enhanced
adsorption of congo red from aqueous solutions by chitosan
hydrogel beads impregnated with cetyl trimethyl ammonium
bromide. Bioresour Technol 100(11):2803–2809
2. Yao Z, Wang L, Qi J (2009) Biosorption of methylene blue from
aqueous solution using a bioenergy forest waste: Xanthoceras
sorbifolia seed coat. Clean Soil Air Water 37(8):642–648
3. Nigam P, Armour G, Banat IM, Singh D, Marchant R (2000)
Physical removal of textile dyes from effluents and solid-state
fermentation of dye-adsorbed agricultural residues. Bioresour
Technol 72(3):219–226
4. Tan IAW, Hameed BH, Ahmad AL (2007) Equilibrium and
kinetic studies on basic dye adsorption by oil palm fibre activated
carbon. Chem Eng J 127:111–119
5. Ahmad A, Mohd-Setapar SH, Chuong CS, Khatoon A, Wani
WA, Kumar R, Rafatullah M (2015) Recent advances in new
generation dye removal technologies: novel search for approa-
ches to reprocess wastewater. RSC Adv 5(39):30801–30818
6. El-Latif MA, Ibrahim AM, El-Kady M (2010) Adsorption equi-
librium, kinetics and thermodynamics of methylene blue from
aqueous solutions using biopolymer oak sawdust composite.
J Am Sci 6(6):267–283
7. Ghaedi M, Hassanzadeh A, Kokhdan SN (2011) Multiwalled
carbon nanotubes as adsorbents for the kinetic and equilibrium
study of the removal of alizarin red S and morin. J Chem Eng
Data 56(5):2511–2520
8. Vimonses V, Lei S, Jin B, Chow CWK, Saint C (2009) Kinetic
study and equilibrium isotherm analysis of Congo Red adsorption
by clay materials. Chem Eng J 148:354–364
9. Mohammad M, Maitra S, Ahmad N, Bustam A, Sen T, Dutta BK
(2010) Metal ion removal from aqueous solution using physic
seed hull. J Hazard Mater 179(1):363–372
344 Int J Ind Chem (2016) 7:333–345
123
10. Sen TK, Afroze S, Ang H (2011) Equilibrium, kinetics and
mechanism of removal of methylene blue from aqueous solution
by adsorption onto pine cone biomass of Pinus radiata. Water Air
Soil Pollut 218(1–4):499–515
11. Akkaya G, Guzel F (2014) Application of some domestic wastes
as new low-cost biosorbents for removal of methylene blue:
kinetic and equilibrium studies. Chem Eng Commun
201(4):557–578
12. Ahmad A, Rafatullah M, Sulaiman O, Ibrahim M, Hashim R
(2009) Scavenging behaviour of meranti sawdust in the removal
of methylene blue from aqueous solution. J Hazard Mater
170(1):357–365
13. Low LW, Teng TT, Rafatullah M, Morad N, Azahari B (2013)
Adsorption studies of methylene blue and malachite green from
aqueous solutions by pretreated lignocellulosic materials. Sep Sci
Technol 48(11):1688–1698
14. Hussin ZM, Talib N, Hussin NM, Hanafiah MA, Khalir WK
(2015) Methylene blue adsorption onto NaOH modified durian
leaf powder: isotherm and kinetic studies. Am J Environ Eng
5(3A):38–43
15. Saygili H, Akkaya Saygili G, Guzel F (2014) Using grape pulp as
a new alternative biosorbent for removal of a model basic dye.
Asia Pac J Chem Eng 9(2):214–225
16. Vakili M, Rafatullah M, Salamatinia B, Abdullah AZ, Ibrahim
MH, Tan KB, Gholami Z, Amouzgar P (2014) Application of
chitosan and its derivatives as adsorbents for dye removal from
water and wastewater: a review. Carbohydr Polym 113:115–130
17. Thakur VK, Thakur MK (2014) Recent advances in graft
copolymerization and applications of chitosan: a review. ACS
Sustain Chem Eng 2(12):2637–2652
18. Sajab MS, Chia CH, Zakaria S, Jani SM, Ayob MK, Chee KL,
Khiew PS, Chiu WS (2011) Citric acid modified kenaf core fibres
for removal of methylene blue from aqueous solution. Bioresour
Technol 102(15):7237–7243
19. Rafatullah M, Sulaiman O, Hashim R, Ahmad A (2010)
Adsorption of methylene blue on low-cost adsorbents: a review.
J Hazard Mater 177(1):70–80
20. Han R, Zhang L, Song C, Zhang M, Zhu H, Zhang L (2010)
Characterization of modified wheat straw, kinetic and equilibrium
study about copper ion and methylene blue adsorption in batch
mode. Carbohydr Polym 79(4):1140–1149
21. Azlan K, Wan Saime WN, Lai Ken L (2009) Chitosan and
chemically modified chitosan beads for acid dyes sorption. J En-
viron Sci 21(3):296–302
22. Fathy NA, El-Shafey OI, Khalil LB (2013) Effectiveness of
alkali-acid treatment in enhancement the adsorption capacity for
rice straw: the removal of methylene blue dye. ISRN Phys Chem
2013:15. doi:10.1155/2013/208087
23. Ong S-T, Keng P-S, Lee C-K (2010) Basic and reactive dyes
sorption enhancement of rice hull through chemical modification.
Am J Appl Sci 7(4):447–452
24. Prasad RN, Viswanathan S, Devi JR, Rajkumar J, Parthasarathy
N (2008) Kinetics and equilibrium studies on biosorption of CBB
by coir pith. Am Eurasian J Sci Res 3(2):123–127
25. Vijayaraghavan K, Yun Y-S (2008) Bacterial biosorbents and
biosorption. Biotechnol Adv 26(3):266–291
26. Awg-Adeni D, Abd-Aziz S, Bujang K, Hassan MA (2010) Bio-
conversion of sago residue into value added products. Afr J
Biotechnol 9(14):2016–2021
27. Kaewprasit C, Hequet E, Abidi N, Gourlot JP (1998) Quality
measurements. J Cotton Sci 2:164–173
28. Linggang S, Phang L, Wasoh M, Abd-Aziz S (2012) Sago pith
residue as an alternative cheap substrate for fermentable sugars
production. Appl Biochem Biotechnol 167(1):122–131
29. Tan W-f, Lu S-j, Liu F, Feng X-h, J-z He, Koopal LK (2008)
Determination of the point-of-zero charge of manganese oxides
with different methods including an improved salt titration
method. Soil Sci 173(4):277–286
30. Goertzen SL, Theriault KD, Oickle AM, Tarasuk AC, Andreas
HA (2010) Standardization of the Boehm titration. Part I. CO2
expulsion and endpoint determination. Carbon 48(4):1252–1261
31. Ozsgn G (2011) Production and Characterization of Activated
Carbon from Pistachio-Nut Shell. Middle East Technical
University. Master Thesis
32. El-Sonbati AZ, El-Deen IM, El-Bindary MA (2016) Adsorption
of Hazardous Azorhodanine Dye from an Aqueous Solution
Using Rice Straw Fly Ash. J Disper Sci Technol 37(5):715–722
33. Chakraborty S, Chowdhury S, Das Saha P (2011) Adsorption of
crystal violet from aqueous solution onto NaOH-modified rice
husk. Carbohydr Polym 86(4):1533–1541
34. Shahryari Z, Goharrizi AS, Azadi M (2010) Experimental study
of methylene blue adsorption from aqueous solutions onto carbon
nano tubes. Int J Water Res Environ Eng 2(2):16–28
35. Mahmoud DK, Salleh MAM, Karim WAWA, Idris A, Abidin ZZ
(2012) Batch adsorption of basic dye using acid treated kenaf
fibre char: equilibrium, kinetic and thermodynamic studies. Chem
Eng J 181–182:449–457
36. Garg V, Kumar R, Gupta R (2004) Removal of malachite green
dye from aqueous solution by adsorption using agro-industry
waste: a case study of Prosopis cineraria. Dyes Pigm 62(1):1–10
37. Gimbert F, Morin-Crini N, Renault F, Badot P-M, Crini G (2008)
Adsorption isotherm models for dye removal by cationized
starch-based material in a single component system: error anal-
ysis. J Hazard Mater 157(1):34–46
38. Chien SH, Clayton WR (1980) Application of Elovich equation
to the kinetics of phosphate release and sorption in soils. Soil Sci
Soc Am J 44:265
39. Zwain HM, Vakili M, Dahlan I (2014) Waste material adsorbents
for zinc removal from wastewater: a comprehensive review. Int J
Chem Eng 2014:13. doi:10.1155/2014/347912
40. Basar CA (2006) Applicability of the various adsorption models
of three dyes adsorption onto activated carbon prepared waste
apricot. J Hazard Mater 135:232–241
41. Kadirvelu K, Kavipriya M, Karthika C, Radhika M, Vennilamani
N, Pattabhi S (2003) Utilization of various agricultural wastes for
activated carbon preparation and application for the removal of
dyes and metal ions from aqueous solutions. Bioresour Technol
87(1):129–132
42. Lagergren S (1898) About the theory of so-called adsorption of
soluble substances. Kungliga Sven Vetensk Handl 24(4):1–39
43. Ho Y-S, McKay G (1998) Kinetic models for the sorption of dye
from aqueous solution by wood. Process Saf Environ Prot
76(2):183–191
44. Weber WJ, Morriss JC (1963) Kinetics of adsorption on carbon
from solution. J Sanit Eng Div Am Soc Civil Eng 89:31–60
45. Chien S, Clayton W (1980) Application of Elovich equation to
the kinetics of phosphate release and sorption in soils. Soil Sci
Soc Am J 44(2):265–268
46. Song J, Zou W, Bian Y, Su F, Han R (2011) Adsorption char-
acteristics of methylene blue by peanut husk in batch and column
modes. Desalination 265(1):119–125
47. Rehman MSU, Kim I, Han J-I (2012) Adsorption of methylene
blue dye from aqueous solution by sugar extracted spent rice
biomass. Carbohydr Polym 90(3):1314–1322
48. Gong R, Zhong K, Hu Y, Chen J, Zhu G (2008) Thermochemical
esterifying citric acid onto lignocellulose for enhancing methy-
lene blue sorption capacity of rice straw. J Environ Manage
88(4):875–880
49. Lata H, Garg V, Gupta R (2007) Removal of a basic dye from
aqueous solution by adsorption using Parthenium hysterophorus:
an agricultural waste. Dyes Pigm 74(3):653–658
Int J Ind Chem (2016) 7:333–345 345
123


![Adsorption of methylene blue by hydroxyl-aluminum pillared ......removal of Methylene Blue from aqueous solutions [74, 75]. The main objective of this work was to prepare hydroxy-aluminium](https://img.pdfslide.us/doc/110x75/60e2fd6ab27c6c2b46736d92/adsorption-of-methylene-blue-by-hydroxyl-aluminum-pillared-removal-of-methylene.jpg)