Embed Size (px)
Citation preview
1
Abstract— Magnetic Resonance Imaging (MRI)
involves very short pulses of very high current. Substantial savings in the high cost of MRI installations may be realised by employing suitable electrical energy storage, for which supercapacitors are strong candidates in view of high specific power and long cycle life. A key question is whether the well-known capacitance degradation with increased frequency is compatible with the complex and highly variable duty cycles of various MRI sequences. Compatibility of the supercapacitor voltage range with the MRI system must also be considered. We present a detailed analysis of power duty profiles in MRI, using actual imaging sequences, that has not been reported previously. We also propose and validate a simplified supercapacitor model that can accurately simulate its performance in the MRI system, involving pulses several orders of magnitude shorter than those considered previously. Results of equivalent experiments involving Lithium-Ion Iron Phosphate (LiFePO4) batteries are also reported. Finally, we present a detailed analysis of the overall energy storage performance in a realistic neurological examination. The study is based on a specific system of our own design and we fully disclose its relevant parameters, so that the results would be of direct practical value to the wider community, including developers of MRI.
Index Terms—magnetic resonance imaging (MRI), energy storage, supercapacitors
I. INTRODUCTION
Magnetic Resonance Imaging (MRI) is one of the most important medical imaging modalities owing to its unparalleled soft tissue contrast and the absence of harmful
Manuscript received January 29, 2013. Accepted for publication August
18, 2013 This work was supported in part by the Technology Programme Project
No: TP/7/SEN/6/I/M1575C. Copyright © 2009 IEEE. Personal use of this material is permitted.
However, permission to use this material for any other purposes must be obtained from the IEEE by sending a request to [email protected]
M. Ristic is with Imperial College London, Mechanical Engineering Department, South Kensington Campus, London SW7 2AZ, UK (phone: +44-20-7594-7048; e-mail: [email protected]).
Y.Grisca was with Imperial College London, Mechanical Engineering Department, South Kensington Campus, London SW7 2AZ, UK (e-mail: [email protected]).
J. V. M. McGinley is with Imperial College London, Mechanical Engineering Department, South Kensington Campus, London SW7 2AZ, UK (e-mail: [email protected]).
V. Yufit is with Imperial College London, Department of Earth Science & Engineering, South Kensington Campus, London SW7 2AZ, UK (e-mail: [email protected])..
ionising radiation. It is the gold standard in many diagnostic procedures, such as stroke examination where it can help determine both the type (haemorrhagic or ischaemic) and how long ago it occurred, thus providing good indication for the correct treatment [1]. Although the number of installed MRI systems continues to increase, this growth is limited by their affordability. Typical scanner cost is around $1 million, but this is often at least doubled when installation costs are included, where the provision of electrical power can be one of the highest cost elements. The power supply rating for MRI is typically several hundred kVA. This is predominantly set by the peak power used by the gradient system (Sec II), which uses very high currents during imaging. However, the currents are applied only in very short pulses and there is a significant potential for employing energy storage in order to level the load posed by the gradients. This would also be directly applicable to various mobile and semi-permanent installations, such as the mobile MRI units installed on large trucks, where on-site power supply capacity is often limited or power needs to be generated locally. Furthermore, in accident emergency services and in the military, a truly mobile MRI system for on-site examination of head injuries, for example, would be of immense value. All such system needs to be powered by a mobile generating set for which the load and the power rating need to be acceptably low, typically of the order of 10kVA.
Energy storage is not employed in today’s MRI installations and to the best of our knowledge it has not been adequately considered. In the case of batteries, the cycle life offered even by the best of today’s battery technology is limited to about 2000 cycles, unless extremely shallow (10-20%) depth-of-discharge is employed [2]. Assuming that one cycle corresponds to an examination of one patient and machine throughput of 30 min/patient, simple calculation will show unacceptably low battery life of under 6 months. In comparison, supercapacitors offer much higher power densities and sufficiently long cycle life (106 cycles readily achievable) [3-5], but their energy density is lower and the voltage varies linearly with the stored charge. Furthermore, supercapacitors are well known to experience a dramatic drop in capacitance with increasing frequency [6-9], making them potentially unsuitable for applications involving frequencies higher than just a few hertz.
Supercapacitor energy storage has been proposed for applications including Hybrid Electric Vehicles (HEV), power generation and industrial applications [4, 5, 10-12]. The use of supercapacitors in combination with batteries has also been considered [3]. However, these analyses do not apply to the conditions encountered in MRI for two reasons. First, MRI sequences involve very short pulses, of the order of milliseconds, whereas in HEV and similar applications pulse durations are 1 second or more. In MRI pulses are
Supercapacitor Energy Storage for Magnetic Resonance Imaging Systems
Mihailo Ristic, Member, IEEE, Yann Gryska, John V. M. McGinley, and Vladimir Yufit

2
TABLE I GRADIENT COILS SPECIFICATIONS
Gradient Coil Current
(A) Voltage
(V) L
(μH) R
(mΩ) Rise time
(μs)
Slice select (Z) 220 150 160 22 120
Reading (X) 220 150 129 26.2 200
Phase encode (Y) 220 150 129 26.2 200
necessarily trapezoid, with typical rise time of about 200 , implying frequencies up to about 5kHz at which the supercapacitor capacitance may be expected to degrade significantly. Second, MRI duty cycle is complex and highly variable because it depends on the details of the particular imaging sequence being executed. The pulses are highly irregular and relatively widely spaced making it hard to draw adequate conclusions from frequency response tests, while the overall energy requirements are also hard to predict with confidence.
The contribution of this paper involves several aspects. First, we present a detailed analysis of power duty profiles in MRI using actual imaging sequences that has not been reported previously to the best of our knowledge. Second, we propose and validate a simplified supercapacitor model that can accurately predict its performance in the MRI system, involving pulses several orders of magnitude shorter than those considered previously. The number of parameters that need to be estimated is kept manageably low to allow further tuning following an experimental estimation procedure. Finally, we present a detailed analysis of the overall energy storage performance in a realistic neurological examination. Because there are a large number of detailed MRI system parameters that influence the overall result, we based our study on a specific system of our own design and we fully disclose its relevant parameters, so that the results would be of direct practical value to the wider
community, including those involved in MRI development. For comparison purposes, results of equivalent performance experiments conducted using Lithium-Ion Iron Phosphate (LiFePO4) battery cells are also presented.
In the next section the basic principles of MRI and some more detailed aspects of the proposed MRI system are introduced. Section III presents supercapacitor models and their experimental validation. Section IV presents the full duty cycle analysis based on simulations and a brief comparison with battery performance.
II. MRI SYSTEM
A. Basic Principles of MRI and Equipment
MRI relies on the principles of nuclear magnetic resonance. Various aspects of MRI theory and practice, including recent advances, are explained in [13], while detailed electromagnetic design considerations can be found in [14]. MRI employs a strong magnetic field to align the magnetisation of hydrogen nuclei (protons), which precess about the main magnetisation axis at the Larmor frequency, proportional to the magnetic field strength. When excited with a suitable transmitted radio frequency (RF) pulse tuned to the Larmor frequency the magnetisation of the protons is flipped into a plane transverse to the main field. The resulting transverse magnetisation is detected by a receiver coil in the form of an RF signal which decays according to two magnetisation relaxation mechanisms. The dominant mechanism are spin-lattice relaxation (characterized by a time constant T1) and spin-spin relaxation (time constant T2). The former relates to the return of proton magnetisation to alignment with the main field, while the latter relates to the dephasing of spins, which also results in the diminishing received signal. Relaxation times are affected by the tissue type and by other more detailed effects including magnetic susceptibility and diffusion. Scans designed to emphasize T1 or T2 may be adopted to highlight tissue contrast that reflects numerous specific anatomies or pathologies.
To produce anatomical images MRI employs spatial encoding, which is achieved by superposing linear gradients onto the, otherwise highly uniform, main field. The slice-selection gradient, as the name suggests, is applied typically in the z-direction during the RF pulse to excite only the protons in a few millimeter thick slice of the imaging
Fig. 2. Gradient amplifier system incorporating supercapacitor bank.
a)
b) Fig. 1. a) Open C-magnet design (field 0.5 T, 40 cm gap) as in [21]. b) Simplified exploded layout of x, y and z gradient coils incorporated in the pole pieces. In each pole the set of three coils is stacked axially
3
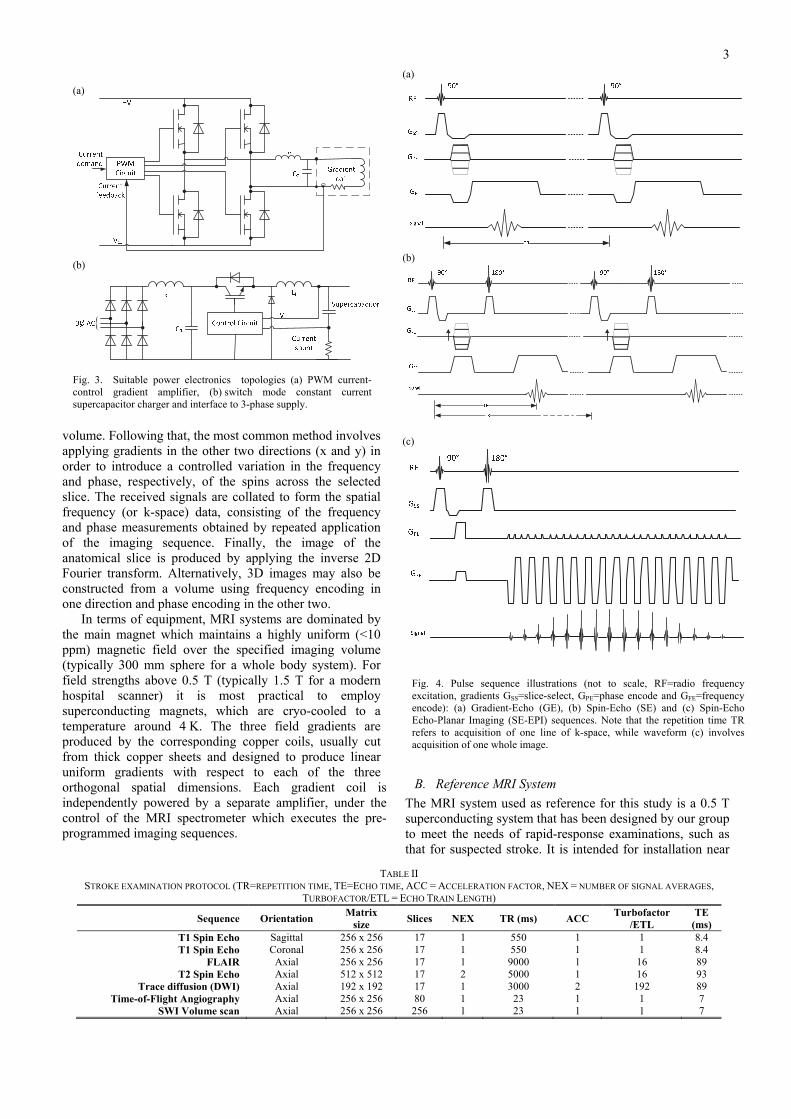
volume. Following that, the most common method involves applying gradients in the other two directions (x and y) in order to introduce a controlled variation in the frequency and phase, respectively, of the spins across the selected slice. The received signals are collated to form the spatial frequency (or k-space) data, consisting of the frequency and phase measurements obtained by repeated application of the imaging sequence. Finally, the image of the anatomical slice is produced by applying the inverse 2D Fourier transform. Alternatively, 3D images may also be constructed from a volume using frequency encoding in one direction and phase encoding in the other two.
In terms of equipment, MRI systems are dominated by the main magnet which maintains a highly uniform (<10 ppm) magnetic field over the specified imaging volume (typically 300 mm sphere for a whole body system). For field strengths above 0.5 T (typically 1.5 T for a modern hospital scanner) it is most practical to employ superconducting magnets, which are cryo-cooled to a temperature around 4 K. The three field gradients are produced by the corresponding copper coils, usually cut from thick copper sheets and designed to produce linear uniform gradients with respect to each of the three orthogonal spatial dimensions. Each gradient coil is independently powered by a separate amplifier, under the control of the MRI spectrometer which executes the pre-programmed imaging sequences.
B. Reference MRI System
The MRI system used as reference for this study is a 0.5 T superconducting system that has been designed by our group to meet the needs of rapid-response examinations, such as that for suspected stroke. It is intended for installation near
TABLE II STROKE EXAMINATION PROTOCOL (TR=REPETITION TIME, TE=ECHO TIME, ACC = ACCELERATION FACTOR, NEX = NUMBER OF SIGNAL AVERAGES,
TURBOFACTOR/ETL = ECHO TRAIN LENGTH)
Sequence Orientation Matrix
size Slices NEX TR (ms) ACC
Turbofactor /ETL
TE (ms)
T1 Spin Echo Sagittal 256 x 256 17 1 550 1 1 8.4 T1 Spin Echo Coronal 256 x 256 17 1 550 1 1 8.4
FLAIR Axial 256 x 256 17 1 9000 1 16 89 T2 Spin Echo Axial 512 x 512 17 2 5000 1 16 93
Trace diffusion (DWI) Axial 192 x 192 17 1 3000 2 192 89 Time-of-Flight Angiography Axial 256 x 256 80 1 23 1 1 7
SWI Volume scan Axial 256 x 256 256 1 23 1 1 7
(a)
(b)
(c)
Fig. 4. Pulse sequence illustrations (not to scale, RF=radio frequency excitation, gradients GSS=slice-select, GPE=phase encode and GFE=frequency encode): (a) Gradient-Echo (GE), (b) Spin-Echo (SE) and (c) Spin-Echo Echo-Planar Imaging (SE-EPI) sequences. Note that the repetition time TR refers to acquisition of one line of k-space, while waveform (c) involves acquisition of one whole image.
(a)
(b)
Fig. 3. Suitable power electronics topologies (a) PWM current-control gradient amplifier, (b) switch mode constant current supercapacitor charger and interface to 3-phase supply.

4
Fig. 5. Gradient-echo sequence: profile of power supplied to the gradient system without the use of energy storage compared to the target 2 kVA constant-power supply enabled by energy storage.
‐30.0
‐20.0
‐10.0
0.0
10.0
20.0
30.0
0 5 10 15 20 25 30 35 40 45 50
Power (kVA)
Time (milliseconds)
Without energy storageWith energy storage (target value 2 kVA)
the Emergency Room of a typical hospital and also for use in various semi-permanent and mobile installations. The design of the magnet (Fig. 1a) is unusual because it employs a single driver coil incorporated in the bottom pole, rather than the more conventional symmetrical arrangement with coils incorporated in both poles. Thus the magnet uses a single cryostat, instead of one for each pole, effectively halving the overall complexity and cost. The design is further simplified by employing Magnesium Diboride (MgB2), a relatively high temperature superconductor, resulting in a cryogen free-magnet, eliminating concerns about helium boil-off, expansion and venting in case of quench [15]. These aspects, together with the passive magnetic shielding provided by the iron yoke, significantly reduce the installation requirements and costs in comparison with more conventional alternatives.
For this paper however, the most relevant aspect are the gradient coils, which adopt a conventional planar design and are incorporated in the pole faces [14]. Fig. 1b indicates the layout of the x, y and z gradients, where each coil loop represents a flat spiral pattern comprising 8-10 turns. In common with other open magnets that have a yoke [14, 16], the gradient coils are not actively shielded and eddy currents in the pole pieces are instead minimised by the materials used for pole construction. Table I presents their relevant gradient parameters. With each gradient rated at 220 A and 150 V peak, a conservative power supply rating for the gradient system alone would be about 100 kVA.
In common with other superconducting MRI magnets, the main magnet is intended to operate in ‘persistent mode’, meaning that once energised, it is disconnected from the power supply and remains so during normal operation. However, the magnet cryocooler must be operated continuously, requiring estimated 7.5 kVA. This normally utilises a separate 3-phase power supply, not integrated with the gradient system shown in Figs. 2 and 3. Auxiliaries, including the host processor, also utilise a separate power supply, consuming estimated 0.5 kVA. Thus a conservative power supply rating for the overall MRI system is about 110 kVA.
Fig. 2 shows the schematics of the gradient amplifiers, capacitor bank and the power supply. Modern gradient amplifiers employ switch mode design based on PWM control, operating in current or voltage mode, while high linearity and response bandwidth of around 10 kHz are
required, such as in the design proposed in [17]. A suitable full-bridge topology for a current mode gradient amplifier is shown in Fig. 3a. The specific amplifier selected for this study was commercially available Copley 266P (Analogic Corp. Peabody, MA) [18], capable of operating from DC supply in the range 150 – 300 V. Since the maximum gradient coil voltage is 150 V (Table I), an acceptable range supercapacitor of voltages may be also assumed to be 150 – 300 V.
Interface converters for supercapacitors applications are discussed in [19]. Assuming connection to 3-phase external power source, Fig. 3b shows a suitable switch mode constant current charger with preset voltage and current limits. More advanced methods, such as that proposed in [20] may also be employed.
C. Stroke Examination Protocol Pulse Sequences, Current and Power Profiles
Table II summarises the set of imaging sequences undertaken under the stroke examination protocol adopted at the Charing Cross Hospital (London, United Kingdom) and it is similar to other such protocols adopted by specialist units elsewhere. Detailed analysis of various imaging sequences is outside the scope of this paper and comprehensive treatment of this large subject can be found in [21]. However, in order to illustrate the system duty cycles, Fig. 4 summarises some of the most representative imaging sequences used in this study: Gradient-Echo (GE), Spin-Echo (SE), and Spin-Echo Echo-Planar Imaging (SE-EPI). It should be noted that sequences such as Gradient
Fig. 6. Supercapacitor circuit model (a) general model from Lajnef et al.,[9] and (b) model used for the study.

5
Fig. 7. Supercapacitor scaling and the equivalent 50 F constituent cell.
Echo may involve relative short gradient current pulses and relatively long repeat times (TR). In contrast, GE-EPI is a very fast imaging sequence and it involves gradients operating almost continuously, but the overall imaging time is very much reduced.
For the analysis of the power usage by the MRI system, we focus on the portion of the pulse sequence relating to the three gradient coils, which define their current profiles . For a gradient coil of inductance L and resistance R, the corresponding voltage is given by:
(1)
Assuming is the internal resistance of the gradient amplifier, the power supplied to the gradient axis is:
. (2)
and the total gradient power supplied to the MRI system is:
(3)
where subscripts , and refer to the slice-select, phase-encode and frequency-encode gradients respectively. As an example, Fig. 5 shows the calculated profile of power supplied to the gradients during the GE sequence, together with a target constant-power supply of 2 kVA that is discussed further in Section IV.
III. SUPERCAPACITOR MODEL AND VALIDATION
A. Equivalent Circuit Model
Supercapacitors are double-layer capacitor devices based on highly porous electrodes immersed into highly conductive electrolyte. High capacitance values are achieved owing to the electrolyte penetrating the deep pores, realising an extremely large surface area while maintaining a small effective dielectric thickness. At DC and low frequencies the supercapacitor characteristics may be assumed to correspond to that of a conventional capacitor. However at increased frequencies, the relatively slow ion diffusion into the deep pores of the electrodes results in an equivalent RC transmission line behaviour, causing the capacitance to drop off rapidly and approach a much lower value, known as the access capacitance, C . In the typical, commercially available supercapacitors the corresponding “knee frequency” is just a few Hertz and this effect has been one of the main concerns in this application. Other detailed effects have also been observed, such as charge redistribution at very low frequencies (<20 mHz), high frequency resonance due to small inductance present and the parameter dependence on voltage and temperature [7, 22]. Consequently various supercapacitor equivalent circuit models have been proposed in order to represent the observed phenomena and match the operating conditions [7, 9, 22-24].
Lajnef et al [9] proposed a general supercapacitor circuit model which they considered in the context of HEV applications, involving pulses of duration about 1 s and rise
Fig. 9. Nyquist plot of complex impedance Z (Ohms) for EIS test at 2.2 V and 2.7 V.
‐0.3
‐0.25
‐0.2
‐0.15
‐0.1
‐0.05
0
0 0.01 0.02 0.03
Z_im
aginary (Ohm)
Z_real (Ohm)
E = 2.2 V
E = 2.7 V
Fig. 10. Capacitance as a function of frequency (50 F cell BCAP-0050 Maxwell Technologies).
0
10
20
30
40
50
60
0.01 1 100 10000
Capacitance (F)
Frequency (Hz)
Fig. 8. Experimental setup involving Bio-logic VSP potentiostat for testing supercapacitor and battery cells.

6
(a) Spin Echo sequence charging current waveforms
(b) Spin Echo sequence voltage
(c) FLAIR sequence voltage
Fig. 12. Comparison of the simulated and measured supercapacitor cell charging currents and voltages indicating model accuracy.
0 0.005 0.01 0.015 0.02 0.025 0.03 0.035 0.04-2.5
-2
-1.5
-1
-0.5
0
0.5
1
1.5
2
Time ( Seconds)
Cu
rre
nt (
Am
ps)
Spin Echo Current
SimulatedMeasured
0 0.005 0.01 0.015 0.02 0.02.66
2.67
2.68
2.69
2.7
2.71
2.72
2.73
Spin Echo Voltage
Time (Seconds)
Vo
ltag
e(V
olts
)
SimulatedMeasured
1.07 1.075 1.08 1.085 1.09 1.02.11
2.12
2.13
2.14
2.15
2.16
2.17
Time (seconds)
Vo
ltag
e (
Vo
lts )
FLAIR Voltage
SimulatedMeasured
times corresponding to frequencies < 1 kHz. Recently, Musolino et al [6] suggested model simplification and proposed an identification approach based on exponentially weighted time constants of the RC branches in the transmission model. Testing involved applying voltages for different durations, designed to excite single response modes of the transmission line model. While this approach seems suited to the conditions encountered in HEV applications, it does not appear to suit models incorporating inductance, which had been assumed negligible.
In this study, the adopted model is based on the general equivalent circuit proposed by Lajnef [9] (Fig. 6), but it was simplified by neglecting the very low frequency effects (charge redistribution). Our experiments have indicated that supercapacitor resonant frequency may be as low as 35 Hz, while the frequencies arising in MRI are of the order of few kilohertz, therefore transmission line inductance cannot be neglected (unlike in [6, 24]). However, the very small values
and , which aim to account for small changes in and with frequency, were neglected. Their inclusion was
judged to improve model accuracy marginally, while the identification method would become much more complex. The remaining model parameters were obtained experimentally. Experiments (Sec. II.D) have also confirmed that the use of the 3 branch model for the transmission line part represents an adequate compromise in terms of complexity and accuracy.
We employed Electrochemical Impedance Spectroscopy (EIS) for model parameter estimation, being an established technique, suitable for frequency dependent characterisation. Other standards methods involve constant power [6, 7] and constant current [9] testing at various rates but they cannot adequately model high frequency phenomena.
B. Preliminary Supercapacitor Selection
Preliminary sizing was necessary in order to establish a sufficient focus for the subsequent detailed analysis. The prescribed set of imaging sequences (Table II), which define the current profiles for the three gradient coils, was generated using an available MRI spectrometer (Innervision, United Kingdom). Neglecting, for now, any energy losses during short term charging and discharging of the
supercapacitors, the total energy used for the whole protocol is determined by the resistive losses in the gradient coil windings and it was estimated to be 449 .
From this it was concluded that using a series combination of two standard supercapacitor modules BMOD0063-P-125 from Maxwell Technologies would meet the requirements. These modules have been designed primarily for transport applications and incorporate the relevant overvoltage protection circuits. Each module consists of a series combination of 48 cells of 3000 F each, with the overall peak voltage 125 V, nominal capacitance 63 F and stored energy 492 kJ.
Based on this, the series combination of two such supercapacitor modules has the maximum voltage of 250 and the overall capacitance of 31 . As the lower limit on the supercapacitor voltage is set by the gradient amplifiers and the coils at 150 V, the available stored energy corresponding to this voltage range was estimated to be 1/2 620 .
C. Experimental setup
Since testing of the full capacitor bank at its large currents and voltages (up to 250 V, 660 A) is not practical,
Fig. 11. Measured capacitance as a function of voltage at selected frequencies (50 F cell BCAP-0050, Maxwell Technologies).
0
10
20
30
40
50
60
0.3 0.8 1.3 1.8 2.3 2.8
Capacitance (F)
Voltage ( V)
0.01 Hz0.09 Hz1 Hz10 Hz120 Hz1097 Hz

7
experiments involved scaled-down tests using a single 50 F cell BCAP-0050 (Maxwell Technologies), which use the same technology as the above mentioned modules. Fig. 7 illustrates the scaling, showing how the 50 F cell may be taken to represent one of the 60 equivalent parallel capacitors making up each 3000 F cell in the module. Thus the scaled-down cell current was 1/60 of the total current and the cell voltage represented 1/96 of the total supercapacitor bank voltage.
Testing was performed using an electrochemical workstation shown in Fig. 8 (Bio-logic VSP potentiostat with a 5 Ampere booster, running EC-Lab software), output current and voltage ranges 5 and 10 respectively. The specific system uses control loop sample time of 5 , while the recorded voltage and current measurements are stored at variable intervals of 200 μs or more, which proved sufficient for our experiments (Fig. 12) and the gradient coil rise time of 200 μs. The overall accuracy can be considered as 100 μV for voltage and 100 μA for current measurement. This setup was also used for comparative performance examination of LiFePO4 battery cells (A26650M1A, A123 Systems, Inc.).
D. Experimental supercapacitor parameter estimation
The leakage resistance was determined from the leakage current of 0.075 mA at 2.7 V specified by the manufacturer. Therefore 36 was chosen.
Parameters , , , and (Fig.6b) were estimated using Electrochemical Impedance Spectroscopy (EIS). This is a non-destructive method that imposes a sinusoidal voltage, measures the corresponding current and computes the complex impedance of the supercapacitor over a range of frequencies. EIS characterizes the electrochemical behaviour and it is commonly used for testing batteries and fuel cells [22]. The access resistance and the transmission line resistance can be estimated from the Nyquist plot of the complex impedance.
EIS was conducted using a controlled voltage for the frequencies in the range 0.01 10 at 25 °C ambient temperature. The voltage signal of the form
2 was applied in two tests, using open circuit voltages of E=2.2 V and E=2.7 V with 10 .
The Nyquist plot is given in Fig. 9, showing that the complex impedances may be considered equal at 2.2 V and 2.7 V. For the low-frequency region of the plot (<1 Hz) it can be observed that the capacitive behaviour is dominant, while at mid-range frequencies (1-100 Hz) the transmission line behaviour becomes dominant, corresponding to the porous structure effects [22]. The access resistance can be determined from the high frequency region as the lowest value of resistive impedance, where the reactance tends to zero. The estimated value was 0.0129 .
Transmission line resistance may be estimated from the Nyquist diagram as 3 where is the high-frequency resistance and is the low-frequency resistance where the reactance approaches infinity [22]. From the EIS data obtained, the transmission line resistance was estimated to be 0.03 .
The small inductance may be estimated from the high
TABLE III SUPERCAPACITOR PARAMETERS VALUES ESTIMATED FROM EIS
EXPERIMENTS AND SUBSEQUENTLY ADJUSTED
EIS estimates 0.0129 0.03 36 0.91 55 2.7 Adjusted 0.0109 0.0825 36 0.06 55 2.7
TABLE IV: SUPERCAPACITOR VOLTAGE DROP AND ENERGY USAGE FOR VARIOUS IMAGE ACQUISITIONS DURING THE STROKE EXAMINATION
Cell
(50 F, 2.8 V)
Supercapacitor bank (31 F, 250 V)
Imaging Sequence Initial voltage (V)
Final voltage (V)
Energy used (J)
Corrected Final voltage
(V)
Final Voltage (V)
Energy used (kJ)
T1 Spin Echo 2.6 2.4472 14.13 2.5067 240.6 71.5 T1 Spin Echo 2.4472 2.2841 14.13 2.4051 230.9 70.9
FLAIR 2.2841 2.1739 8.98 2.3340 224.1 48.0 T2 Spin Echo 2.1739 2.0418 10.18 2.2462 215.6 57.9
Trace diffusion (DWI) 2.0418 2.0234 1.24 2.2332 214.4 8.0 Time-of-Flight angiography 2.0234 1.8160 14.61 2.0894 200.6 88.8
SWI Volume scan 1.8160 1.2258 32.9 1.6424 157.7 238.3
TOTAL 583.4
Fig. 14. Battery testing results (A26650M1A, A123 Systems, Inc.)showing cell voltage and current variation during Spin Echo sequence.
3.44
3.46
3.48
3.5
3.52
3.54
3.56
‐5
‐4
‐3
‐2
‐1
0
1
2
3
4
0 0.005 0.01 0.015 0.02
Cell Voltage (V)
Cell Curren
t (A)
Time (ms)
Cell Current (A)
Cell Voltage (V)
Fig. 13. Supercapacitor pack voltage vs. remaining energy for a 31 F supercapacitor bank during the stroke examination.
0
50
100
150
200
250
300
0%20%40%60%80%100%
Supercap
acitor Ban
k Voltage (V)
Energy remaining in the supercapacitor banks (%)
SWI‐3D
TOF Angio
DWI
SE T1SE T1
FLAIR SE T2
Gradient Amp power supply voltage range

8
frequency portion of the Nyquist plot where the reactance component changes sign. This was estimated to be 2.7nH, although the uncertainty was considered to be relatively high.
In order to estimate the access capacitance , the EIS data in Fig.9 was used to evaluate the overall capacitance at various frequencies according to the relationship 1/2 where is the reactance in Ohms. The variation of the capacitance with frequency is shown in Fig. 10. It can be seen that below 1 the characteristic is predominantly that of a conventional capacitor, while the transmission line characteristic becomes increasingly dominant from about 1 . At high frequencies the capacitance approaches the value of access capacitance, which was estimated to be
0.91 . Note that this means that the corresponding high-frequency capacitance of the overall supercapacitor bank is 0.569 F.
Finally, the transmission line capacitance may be estimated using a constant-current charge/discharge test, by recording voltage against time and finding
/ / . In doing this, a slight variation of the gradient / was observed. This was in line with the expectation that also varies with the voltage [9, 22]. This dependence of the capacitance on voltage was found to be linear and the following relationship was established:
7.77 42.7 (4)
However, as this relationship may be considered to be valid strictly at zero frequency, further EIS experiments were subsequently conducted to investigate the capacitance dependence on both voltage and frequency. This involved measuring the complex impedance for frequencies from 0.01 Hz to 10 kHz and cell voltages from 0.4 V to 2.7 V. Fig. 11 shows the results, which indicate that voltage dependence effect may diminish at all but the smallest frequencies. With this in mind and considering the design range of capacitor voltages during operation, it was considered more appropriate to use a constant capacitance C 55F, corresponding to an estimated average low frequency value.
E. Model verification and parameter tuning
The estimated equivalent circuit parameters were subsequently used to construct a simulation model in Simulink (Mathworks Inc.) which was compared against experiments. The input for both the simulation and the experiment was provided by the power profiles corresponding to the imaging sequence. Care was taken to ensure that the simulation matches the operation of the potentiostat. This was operated in power control mode, whereby the potentiostat operates as a current source and at each sample the system measures the voltage of the cell under test, reads the demanded instantaneous power and sets the source current p/v.
Following the experiments, noticeable discrepancies were found between the simulated and the experimental voltage waveforms. This was not entirely unexpected, considering the impact of the finite measuring accuracy on the accuracy of parameter estimation and the sensitivity of the model. In addition, EIS based measurements are usually performed around the open-circuit voltage (OCV), while the equivalent circuit model here corresponds to a dynamic behavior which differs from OCV, especially when the
system subjected to very short irregular pulses, i.e. very non-linear behaviour. The most significant was found to be the estimate of , calculated by division by a very small high-frequency reactance, with a potentially significant relative error. Further sensitivity analysis confirmed a strong influence of this estimate on the overall model accuracy. The value of was iteratively optimized until the error between the predicted and measured voltage waveforms could not be further improved. Following this, the estimate for , which influences the knee frequency, was iteratively optimized. Finally the value of was iteratively optimized and its difference from the original estimate might be attributed to the omission of and in the simplified model. Table III summarizes the model parameters, while the waveforms in Fig. 12 show the achieved correspondence between simulated and measured voltage and current wave forms.
IV. PERFORMANCE ANALYSIS
The equivalent circuit model developed above was used to simulate the energy usage throughout the stroke examination and to analyse the supercapacitor performance within the target system. The gradient current profiles (pulse sequences) for the complete examination were generated using the available MRI spectrometer and recorded. Using the electrical parameters of the gradient coils and the amplifiers, these were used to generate the corresponding power profiles experienced by the power supply throughout the examination. The magnitude was scaled down to correspond to the power supplied by a single 50 F cell, as described above, providing the input for the simulation. The output of the simulation were the cell voltages and energy used.
A. Energy used
The results are summarised in Table IV, which shows voltages and energy used in each of the image acquisitions detailed in Table II. Fig. 13 additionally shows the results as a plot of voltage vs. energy remaining at various stages of the examination. It can be seen that the supercapacitor banks do meet the requirement of this application in terms of the overall energy used and the voltage range, which remains above the bottom limit of 150 V. It should be noted that these figures conservatively assume that the supercapacitor is charged only before and not during the examination.
For comparison, experiments were conducted by subjecting a LiFePO4 battery cell to the same duty cycles and representative results are shown in Fig. 14. These indicate that such battery would meet the pulse power demands, but the cycle life issues, of course, will remain.
B. Charging Time and Power Supply Requirements
In practice the supercapacitors will be replenished at a constant rate by the charger. The time available to replenish the stored energy may be assumed to be 30 min, on the basis that this is the duration of an examination appointment for one patient. Half of that time may be taken by the patient setup in the scanner. Clearly, charge current may be traded against charging time. By limiting the charge current to, say, 8 A the overall charging time will be under 7 minutes and the corresponding peak power is 2 kVA. This is within the time anticipated for imaging alone for one patient.

9
In addition, the MRI system also requires a continuous power of 7.5 kVA for the cryocooler and an estimated 0.5 kVA for auxiliaries. Thus a power supply of about 10 kVA would meet the overall MRI system needs.
C. Overall System Impact
A conservatively chosen overall power supply rating for the MRI system without the use of energy storage would be 110 kVA, largely based on the peak currents and voltages of the three gradient coils. With the use of energy storage this can be reduced by a factor of about 10. For mobile installation the power can then be provided by a modest generating set. The proposed supercapacitor modules have a combined weight of around 120 kg and occupy 1.0 0.70.6m , considered suitable for both mobile or stationary use.
In the proposed system, the gradient amplifiers needed a higher voltage rating than 150V required by the gradient coils alone. This may be avoided by incorporating solutions with a DC/DC converter between the supercapacitors and the load [19], although the cost of the additional hardware can outweigh the savings. The proposed gradient system interface with the local power source replaces the usual switch mode power supply. As the power rating of this module would be also reduced by a factor of 10, it would bring further cost savings for the installation.
V. CONCLUSIONS
The study has analysed the suitability of supercapacitors as energy storage for use with MRI systems, as the means of reducing the power supply rating, to meet needs of mobile units and to reduce the capital costs of permanent installations. The key questions concerned the supercapacitor frequency response, required energy capacity and system compatibility with the supercapacitor voltage range. The adoption of a suitable analytical model and parameter estimation were key enablers for the study. It was found that Electrochemical Impedance Spectroscopy can be used in combination with a relatively undemanding iterative parameter optimisation, in order to accurately account for the high frequency characteristic of the supercapacitor response. It was found that in spite of the marked capacitance degradation with frequency, supercapacitors do meet the requirements of the relevant duty cycles with encouragingly good results. The commercially available modules, suggested initially, were shown to meet the energy capacity requirements. Overall, the power supply requirements were reduced by a factor of 10, while the added bulk posed by the energy storage is small. The additional costs associated with supercapacitors are well exceeded by the savings achieved on other aspects of the proposed system. This analysis is also applicable to other MRI scanners, as the pulse sequences and the timing will not be different. In the case of the less efficient shielded gradients the increased power consumption can be readily met with a larger supercapacitor bank.
REFERENCES [1] S. Lee, A. C. E. Shafe, and M. R. Cowie, "UK stroke incidence,
mortality and cardiovascular risk management 1999–2008: time-trend analysis from the General Practice Research Database," BMJ open, vol. 1, 2011.
[2] J. H. Kim, S. C. Woo, M. S. Park, K. J. Kim, T. Yim, J. S. Kim, et al., "Capacity fading mechanism of LiFePO4-based lithium secondary batteries for stationary energy storage," Journal of Power Sources, pp. 190-197, 2012.
[3] M. B. Camara, H. Gualous, F. Gustin, A. Berthon, and B. Dakyo, "DC/DC converter design for supercapacitor and battery power management in hybrid vehicle applications—Polynomial control strategy," IEEE Transactions on Industrial Electronics, vol. 57, pp. 587-597, 2010.
[4] J. Leuchter, P. Bauer, V. Rerucha, and V. Hajek, "Dynamic behavior modeling and verification of advanced electrical-generator set concept," IEEE Transactions on Industrial Electronics, vol. 56, pp. 266-279, 2009.
[5] S. Vazquez, S. M. Lukic, E. Galvan, L. G. Franquelo, and J. M. Carrasco, "Energy storage systems for transport and grid applications," IEEE Transactions on Industrial Electronics, vol. 57, pp. 3881-3895, 2010.
[6] V. Musolino, L. Piegari, and E. Tironi, "New full frequency range supercapacitor model with easy identification procedure," IEEE Transactions on Industrial Electronics, vol. 60, pp. 112-120, 2013.
[7] F. Rafik, H. Gualous, R. Gallay, A. Crausaz, and A. Berthon, "Frequency, thermal and voltage supercapacitor characterization and modeling," Journal of Power Sources, vol. 165, pp. 928-934, 2007.
[8] N. Rizoug, P. Bartholomeus, and P. Le Moigne, "Modeling and characterizing supercapacitors using an online method," IEEE Transactions on Industrial Electronics, vol. 57, pp. 3980-3990, 2010.
[9] W. Lajnef, J. M. Vinassa, O. Briat, S. Azzopardi, and E. Woirgard, "Characterization methods and modelling of ultracapacitors for use as peak power sources," Journal of Power Sources, vol. 168, pp. 553-560, 2007.
[10] R. T. Doucette and M. D. McCulloch, "A comparison of high-speed flywheels, batteries, and ultracapacitors on the bases of cost and fuel economy as the energy storage system in a fuel cell based hybrid electric vehicle," Journal of Power Sources, vol. 196, pp. 1163-1170, 2011.
[11] K. Habakkala Kankanamge and N. Kularatna, "Improving the end-to-end efficiency of DC-DC converters based on a supercapacitor assisted low dropout regulator (SCALDO) technique," IEEE Transactions on Industrial Electronics, vol. 61, pp. 223-230, 2014.
[12] P. Thounthong, S. Raël, and B. Davat, "Control strategy of fuel cell and supercapacitors association for a distributed generation system," IEEE Transactions on Industrial Electronics, vol. 54, pp. 3225-3233, 2007.
[13] E. M. Haacke, R. W. Brown, M. R. Thompson, and R. Venkatesan, Magnetic resonance imaging: physical principles and sequence design: Wiley-Liss New York:, 1999.
[14] J. Jin, Electromagnetic analysis and design in magnetic resonance imaging: CRC press, 1999.
[15] M. Ristic, J. V. M. McGinley, and F. Lorenzoni, "Numerical Study of Quench Protection Schemes for a MgB2 Superconducting Magnet," IEEE transactions on applied superconductivity, vol. 21, pp. 3501-3508, 2011.
[16] D. W. McRobbie, E. A. Moore, M. J. Graves, and M. R. Prince, MRI from Picture to Proton: Cambridge university press, 2006.
[17] N. Suzuki, K. Higuchi, and T. Kajikawa, "Robust digital control of a broadband PWM power amplifier," in Control, Automation and Systems (ICCAS), 2012 12th International Conference on, 2012, pp. 1518-1521.
[18] C. C. Corp. Power Amplifiers Power with Precision [Online]. Available: http://www.servovision.com/copley/download/High%20Power%20Amplifier%20Product%20Brochure.pdf
[19] P. J. Grbovic, P. Delarue, and P. Le Moigne, "Interface converters for ultra-capacitor applications in power conversion systems," in Power Electronics and Motion Control Conference (EPE/PEMC), 2012 15th International, 2012, pp. LS7d. 1-1-LS7d. 1-7.
[20] B.-Y. Chen and Y.-S. Lai, "New digital-controlled technique for battery charger with constant current and voltage control without current feedback," IEEE Transactions on Industrial Electronics, vol. 59, pp. 1545-1553, 2012.
[21] M. A. Bernstein, K. F. King, and X. J. Zhou, Handbook of MRI pulse sequences: Elsevier, 2004.
[22] R. Kötz, M. Hahn, and R. Gallay, "Temperature behavior and impedance fundamentals of supercapacitors," Journal of Power Sources, vol. 154, pp. 550-555, 2006.
[23] M. Kaus, J. Kowal, and D. U. Sauer, "Modelling the effects of charge redistribution during self-discharge of supercapacitors," Electrochimica Acta, vol. 55, pp. 7516-7523, 2010.

10
[24] D. Torregrossa, M. Bahramipanah, E. Namor, R. Cherkaoui, and M. Paolone, "Improvement of Dynamic Modeling of Supercapacitor by Residual Charge Effects Estimation," IEEE Transactions on Industrial Electronics, [Available on line] 2013.
Mihailo Ristic graduated from University College London in 1981 in Mechanical Engineering. He recieved M.Sc. in Control Systems in 1982 and Ph.D. in Robotics in 1986, both from Imperial College London. He is currently Senior Lecturer in the Mechanical Engineering Department at Imperial College. His research interests include a wide range of topics in Control systems, Computer Aided Design,
electrical machines, as well as Magnetic Resonance Imaging. He is a co-founder of Turbo Power Systems who specialize in high-speed electric machines and power electronics. He is a Chartered Engineer, Fellow of the Institution of Mechanical Engineers and a member of IEEE since 1994.
John McGinley received B.A. degree in physics from University of York in 1976 and was awarded the D.Phil. degree from University of Oxford in 1980. He has worked on the design and development of many aspects of MRI technology with Picker International, Marconi and Philips. He co-founded InnerVision MRI in 1994 He is currently at the Department of Mechanical Engineering, Imperial
College, London. Dr McGinley is a chartered physicist and a member of the Institute of Physics.
Yann Gryska was born in Aix-en-Provence (France) in 1989. He has obtained a French Engineer’s degree from the Ecole Nationale Superieure d’Ingenieurs Sud Alsace (ENSISA) in Mechanical Engineering in 2012 and a Master of Sciences from Imperial College London in Advanced Mechanical Engineering the same year. He is currently
employed as R&D consultant at Chantrey Vellacott DFK, London, UK.
Vladimir Yufit is a Postdoctoral Research Associate in the Department of Earth Science and engineering at Imperial College. He obtained his PhD degree from Tel Aviv University (Israel) leading a pioneering work on development of three-dimensional thin film lithium-ion microbatteries. His broad research interests include rechargeable non-aqueous batteries; PEM, alkaline and solid
oxide fuel cells; redox flow batteries and regenerative fuel cells; supercapacitors and hybrid systems; and advanced characterisation techniques.