Embed Size (px)
Citation preview
Super-Resolution Imaging Through Stochastic
Switching and Localization of Single Molecules:
An Overview
Ke Xu, Sang-Hee Shim, and Xiaowei Zhuang
Abstract The resolution of fluorescence microscopy had traditionally been lim-
ited to ~200–300 nm due to the diffraction of light. Recently, this resolution limit
has been broken using mainly two classes of methods, one of which utilizes
photoswitching of fluorophores to temporally separate the spatially overlapping
images of individual molecules such that the positions of these molecules can be
precisely determined. A sub-diffraction-limit image can then be reconstructed
from these molecular coordinates. With relatively simple optical instrumentation
and sample preparation, this class of methods has improved the spatial resolution
of far-field optical microscopy by more than an order of magnitude, achieving
resolutions down to sub-10 nm range for biological specimens. Three-dimen-
sional, multicolor, and live-cell super-resolution imaging has been demonstrated.
In this chapter, we provide an overview of this class of optical nanoscopy,
primarily in terms of the imaging principle, the spatial/temporal resolution, the
different imaging schemes, the photoswitchable probes, the applications, and
future directions.
Keywords (F)PALM � diffraction limit � photoswitching � single molecule �STORM � super-resolution microscopy
K. Xu and S.-H. Shim
Department of Chemistry and Chemical Biology, Harvard University, Cambridge,
MA 02138, USA
X. Zhuang (*)
Department of Chemistry and Chemical Biology, Howard Hughes Medical Institute, Harvard
University, Cambridge, MA 02138, USA
Department of Physics, Harvard University, Cambridge, MA 02138, USA
e-mail: [email protected]
Authors Ke Xu and Sang-Hee Shim contributed equally to this chapter
P. Tinnefeld et al. (eds.), Far-Field Optical Nanoscopy, Springer Ser Fluoresc,DOI 10.1007/4243_2013_61, © Springer-Verlag Berlin Heidelberg 2013
Contents
1 Background
1.1 Optical Microscopy and the Diffraction Limit
1.2 Single, Isolated Fluorophores Can Be Localized with Nanometer Precision
2 Super-Resolution Imaging Through Stochastic Switching and Localization of Single
Molecules
3 Image Resolution
3.1 Localization Precision and the Optical Resolution
3.2 Localization Density and the Nyquist Resolution Limit
4 Three-Dimensional Imaging
4.1 PSF Shape-Based Methods: Astigmatism and Multifocal Plane Detection
4.2 PSF Engineering Through Fourier Optics
4.3 Single-Molecule Interferometry
4.4 Tilted Mirrors
4.5 Thick Sample Imaging
5 Multicolor Imaging
5.1 Activation-Based Multicolor Imaging
5.2 Emission-Based Multicolor Imaging
6 Live-Cell Imaging
6.1 Labeling Live Cells with Photoswitchable Probes
6.2 Spatial and Temporal Resolutions
6.3 Single-Molecule Tracking
6.4 Motion Blur
6.5 Photo- and Chemical Toxicity
7 Choice of Fluorescent Probes
7.1 Fluorescent Dyes vs. Fluorescent Proteins
7.2 Dye Pairs vs. Single Dyes
7.3 Reversible Photoswitchable vs. Irreversible Photoactivatable Probes
7.4 Other Probes
8 Applications
8.1 Applications in Cell Biology
8.2 Applications in Microbiology
8.3 Applications in Neurobiology
9 Concluding Remarks and Future Developments
References
1 Background
1.1 Optical Microscopy and the Diffraction Limit
Optical microscopy is a widely used and indispensable imaging modality in
biological studies. When compared to other microscopy techniques, optical micros-
copy, in particular fluorescence microscopy, provides the distinct advantages of being
relatively noninvasive and molecularly specific. The former advantage permits the
observation of live cells, tissues, and organisms. The latter, accomplished through
fluorescent labels, allows for the specific observation of molecular targets with high
contrast.
K. Xu et al.
However, conventional optical microscopy has a resolution limit, typically on
the order of several hundred nanometers, below which the structural details of the
specimen can no longer be resolved. This limit is due to the wave-like nature of
light. The far-field optical image of even an idealized point object will be blurred
into a finite-sized spot due to diffraction, and the size of the spot is comparable to
the wavelength of the light. The intensity distribution of this spot is called the point
spread function (PSF). Under optimal imaging conditions with a high numerical
aperture objective, the full width at half maximum (FWHM) of PSF for visible light
is 200–300 nm in the lateral dimensions and 500–800 nm in the axial dimension.
Hence, objects separated by a distance smaller than the width of the PSF will have
overlapping images that cannot be resolved � in other words, the width of the PSF
defines the resolution limit of conventional optical microscopy.
In recent years, several methods have been developed to break this conventional
resolution limit imposed by diffraction. These methods are collectively called
super-resolution fluorescence microscopy. One class of methods overcomes the
diffraction limit by effectively reducing the size of the PSF using specially
engineered illumination patterns. Examples in this category include stimulated
emission depletion (STED) microscopy, microscopy taking advantage of reversible
saturable optically linear fluorescence transitions (RESOLFT), and [saturated/non-
linear] structured-illumination microscopy ([S/NL]SIM), which are covered in
other chapters of this book.
In this chapter, we will focus on a different approach to super-resolution
imaging, which resolves overlapping PSFs by the stochastic switching and locali-
zation of individual fluorophores.
1.2 Single, Isolated Fluorophores Can Be Localizedwith Nanometer Precision
Although diffraction inevitably results in a PSF several hundred nanometers in size
for a point source of light, the position of the point source can nonetheless be
localized with nanometer precision by determining the centroid of the PSF.
The shape of the PSF can be determined either theoretically or experimentally.
Therefore, the centroid positions of the PSFs can be readily obtained by fitting to
known functions.
The theoretical PSF of a single point source of light is an Airy disk, but a simple
two-dimensional (2D) Gaussian function provides a good approximation for ease of
fitting [1, 2]. The fitting can be done with a precision that depends on the number of
photons collected [2]. Experimentally, localization precisions as high as ~1 nm
were first demonstrated for individual beads [3]. With the advent of single-molecule
imaging [4], similar localization precisions were also achieved for individual
fluorescent molecules [5, 6].
Super-Resolution Imaging Through Stochastic Switching and Localization of. . .
However, the nanometer-scale precision achieved in the localization of individual
molecules does not directly translate into a high imaging resolution for densely
labeled samples. This is because when the separation between adjacent fluorescent
molecules is smaller than the diffraction limit, the PSFs of these molecules will
overlap substantially, preventing the precise localization of the individual molecules.
Early strategies to circumvent this problem include separation by orthogonal
properties [7], such as color [8–10], sequential photobleaching of individual
fluorophores [11, 12], and the blinking of individual quantum dots [13, 14]. These
methods were able to resolve a few fluorophores per diffraction-limited area. On the
other hand, for general super-resolution imaging with resolution substantially beyond
the diffraction limit, many more fluorophores (hundreds to thousands) have to be
resolved within a diffraction-limited area (see also Sect. 3.2), and new strategies are
required.
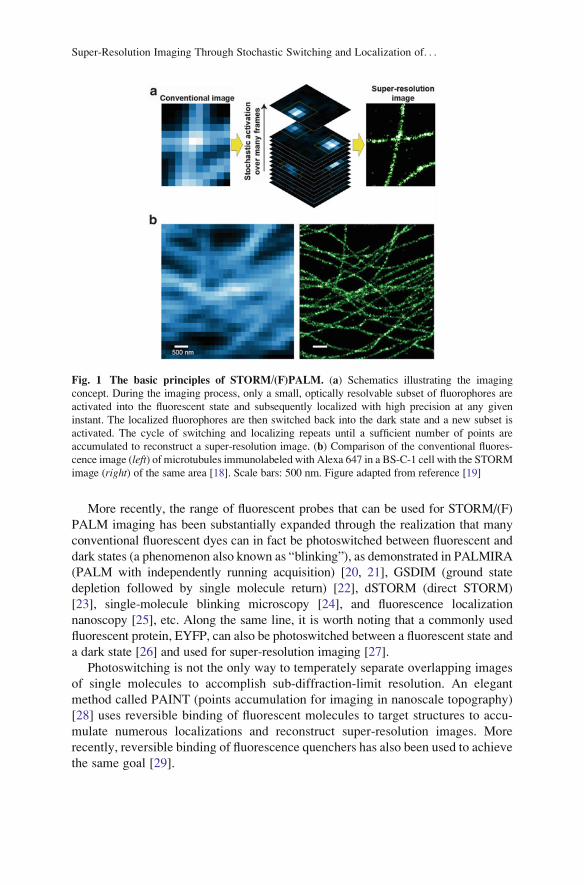
2 Super-Resolution Imaging Through Stochastic Switching
and Localization of Single Molecules
Recently, it was realized that the otherwise overlapping PSFs from densely labeled
fluorophores can be separated in the time domain by employing fluorophores that
can be switched between a non-emitting (dark) state and an emitting (fluorescent)
state [15–17]. In this approach, at any given instant during imaging, the majority of
the labeled fluorophores in the sample are maintained in the dark state, and only a
small, random subset of the fluorophores are switched to the fluorescent state,
typically using a weak activation laser (Fig. 1a). The number of simultaneously
emitting fluorophores is kept sufficiently low that the PSFs of individual emitting
fluorophores are isolated from each other; the location of each fluorophore can then
be determined with nanometer precision using centroid fitting. The emitting
fluorophores are then either optically switched back into the dark state or
photobleached. Subsequently, another small, random subset of the labeled
fluorophores is activated into the fluorescent state, and the locations of the newly
activated molecules are again recorded. Iterating this procedure over time will
eventually allow the locations of all (or a sufficiently large number of) the labeled
fluorophores to be mapped, from which a super-resolution image can be constructed
(Fig. 1).
This general strategy of super-resolution microscopy by stochastic switching and
localization of single molecules has been originally introduced as stochastic optical
reconstruction microscopy (STORM) [15], photoactivated localization microscopy
(PALM) [16], and fluorescence photoactivation localization microscopy (FPALM)
[17]. Both photoswitchable fluorescent dyes and photoactivatable fluorescent
proteins can be used for sub-diffraction-limit imaging using this strategy.
K. Xu et al.
More recently, the range of fluorescent probes that can be used for STORM/(F)
PALM imaging has been substantially expanded through the realization that many
conventional fluorescent dyes can in fact be photoswitched between fluorescent and
dark states (a phenomenon also known as “blinking”), as demonstrated in PALMIRA
(PALM with independently running acquisition) [20, 21], GSDIM (ground state
depletion followed by single molecule return) [22], dSTORM (direct STORM)
[23], single-molecule blinking microscopy [24], and fluorescence localization
nanoscopy [25], etc. Along the same line, it is worth noting that a commonly used
fluorescent protein, EYFP, can also be photoswitched between a fluorescent state and
a dark state [26] and used for super-resolution imaging [27].
Photoswitching is not the only way to temperately separate overlapping images
of single molecules to accomplish sub-diffraction-limit resolution. An elegant
method called PAINT (points accumulation for imaging in nanoscale topography)
[28] uses reversible binding of fluorescent molecules to target structures to accu-
mulate numerous localizations and reconstruct super-resolution images. More
recently, reversible binding of fluorescence quenchers has also been used to achieve
the same goal [29].
Fig. 1 The basic principles of STORM/(F)PALM. (a) Schematics illustrating the imaging
concept. During the imaging process, only a small, optically resolvable subset of fluorophores are
activated into the fluorescent state and subsequently localized with high precision at any given
instant. The localized fluorophores are then switched back into the dark state and a new subset is
activated. The cycle of switching and localizing repeats until a sufficient number of points are
accumulated to reconstruct a super-resolution image. (b) Comparison of the conventional fluores-
cence image (left) of microtubules immunolabeled with Alexa 647 in a BS-C-1 cell with the STORM
image (right) of the same area [18]. Scale bars: 500 nm. Figure adapted from reference [19]
Super-Resolution Imaging Through Stochastic Switching and Localization of. . .
Finally, due to the recent development on image analysis, the condition of well-
isolated images of single molecules does not need to be rigorously satisfied for high-
precision localization of individual molecules. Fluorophores with partially
overlapping images can be localized using simultaneous multi-emitter fitting
[30–32] and global optimization using compressed sensing [33]. Super-resolution
imaging can also be accomplished by taking conventional movies and subtracting
subsequent frames to reveal the transient blinking or bleaching of isolated single
fluorophores using approaches called BALM (bleaching/blinking assisted localization
microscopy) [34] and gSHRIMP (generalized single molecule high-resolution imag-
ing with photobleaching) [35]). A Bayesian analysis of blinking and bleaching
fluorophores (3B) [36] has been developed to model the entire fluorescence movie
with an ensemble of most likely fluorophore locations. Super-resolution images can
even be derived without localizing individual molecules but through correlation
analysis (super-resolution optical fluctuation imaging (SOFI) [37] or nonlinear
image deconvolution (decon-STORM) [38] of movie frames comprised of partially
overlapping emitters. Many of these methods increase the number of molecules that
can be imaged per camera frame and thereby substantially improve the imaging speed.
3 Image Resolution
3.1 Localization Precision and the Optical Resolution
The optical resolution of these molecular-localization-based super-resolution
methods is ultimately determined by the precision with which each fluorophore can
be localized. The theoretical limits of the localization precision are well established
[2]. For a single point source, each detected photon can be viewed as an independent
report of its location. As each photon is randomly distributed according to the PSF
(with width Δ), a localization precision of ~ Δ/N1/2 can be expected when N photons
are collected from the same point source. More sophisticated models also include the
effects of background noise and the pixel size of the camera [2].
Experimentally, the localization precision can be determined by repeatedly mea-
suring the position of a single fluorophore and determining the standard deviation
(SD) of the localization distribution. For example, localization precisions of ~8 nm
(SD) per switching cycle have been demonstrated for bright, photoswitchable dyes
Cy5 and Alexa 647 [15, 18, 39]. Approximately 2x worse localization precision has
been achieved with some of the dimmer dyes (e.g., Atto 488 and DyLight 750) and
fluorescent proteins (e.g., tdEos and mEos2) [40, 41].
In the literature, both standard deviation (SD) and full width at half maximum
(FWHM) have been used to characterize the optical resolution for localization-
based super-resolution imaging methods, which potentially creates confusion in the
comparison of different measurements. For Gaussian distributions, FWHM ¼ 2.35
SD. FWHM is a better representation of the imaging resolution as it corresponds to
K. Xu et al.
the smallest separation between two probes that can be resolved. In this chapter, we
will use the FWHM value when discussing resolution.
It is also worth noting that the experimentally determined localization precision
values are substantially worse (typically by twofold) than the theoretically predicted
values. This indicates that the theoretical values do not faithfully represent the actual
localization precision. Factors limiting the actual localization precision include
camera noise, background noise, nonuniformity of the camera pixels [6], mechanical
instability of the instrument, errors in data analysis, and any other imperfections of
the imaging and analysis systems.
Besides the localization precision of single fluorophores, the resolvability for
actual biological structures is also affected by how faithfully the labels represent the
structures of interest. Any sizable label, such as antibodies (~10 nm in size) and
fluorescent proteins (~4 nm in size), will substantially affect the image resolution
when the resolution becomes comparable to the label size.
3.2 Localization Density and the Nyquist Resolution Limit
Super-resolution methods provide an optical resolution that sometimes approaches
the distance between adjacent labels in a sample. At this level, not only does the
localization precision of each label but also the label density and efficiency affect
the final image resolution.
For continuous structures, the effects of labeling density can be quantified using
the Nyquist-Shannon sampling criterion, which states that structural details smaller
than twice that of the average label-to-label distance cannot be reliably resolved
[42]. Formally, this Nyquist resolution limit can be expressed as 2/N1/D, where N is
the number density of labels and D is the dimensionality of the image. To achieve
Nyquist resolutions that are comparable to the optical resolution (i.e., the localiza-
tion precision) of ~20 nm, a labeling density of ~104/μm2 is required for 2D
imaging. It should be noted, however, that due to the spatial inhomogeneity of
biological structures, the same Nyquist resolution can often be achieved at lower
overall localization densities, as long as the local localization density of the
structure of interest is sufficiently high. The final image quality is affected by
both the optical resolution based on localization precision and the Nyquist resolu-
tion limit determined by the label or localization density: Whichever is worse
(larger in value) dominates the effective image resolution. When the two
resolutions are comparable, the convolution of the two may be employed to
represent the final resolution [41]. It is also worth noting that the localization
density is not only limited by the label density but also by the on-off duty cycle
of the photoswitchable probes, namely, the fraction of time each probe spends in the
on state [40]. Because multiple probes emitting at the same time within a diffrac-
tion-limited area generate overlapping images that reduce the localization preci-
sion, fluorophores with a duty cycle of 1/N typically allow less than N molecules to
be localized within a diffraction-limited area.
Super-Resolution Imaging Through Stochastic Switching and Localization of. . .
For super-resolution studies on the distributions of sparsely distributed molecules,
the Nyquist resolution is less relevant, because the molecular structure itself does not
allow a high labeling density. Nonetheless, high labeling efficiency (fraction of
molecules being labeled) is still required for faithfully mapping out the underlying
distribution.
4 Three-Dimensional Imaging
Most biological samples are three-dimensional (3D), and thus defining their structural
details requires 3D super-resolution imaging. STORM, (F)PALM, and related
methods achieve super-resolution through the localization of individual molecules;
hence, to acquire 3D imaging capability entails the determination of the 3D locations
of single emitting molecules. While the lateral position (x- and y-coordinates) of afluorophore can be readily determined from the centroid of the PSF, the determina-
tion of the axial position (z-coordinate) requires additional manipulation and analysis
of the PSF. Nonetheless, it can be done with a variety of methods, many of which
were first developed in earlier studies for single-particle tracking and spectrally
selective imaging, including fitting the shape of the PSF [43–49], interferometry
[50, 51], and tilted mirrors [52].
4.1 PSF Shape-Based Methods: Astigmatism and MultifocalPlane Detection
An obvious difference between the PSFs of fluorophores with different axial positions
is their apparent width. When projected onto the image plane (the camera),
fluorophores right at the focal plane of the microscope produce the smallest images,
whereas defocused fluorophores produce larger PSF. One could thus derive the
z-information of individual molecules from the measured PSF width. The problem
with directly applying this defocusing approach is that molecules above and below the
focal plane have similarly broadened PSF.
To break this symmetry, 3D super-resolution imaging was first realized by the
introduction of astigmatism into the imaging system [39]. Specifically, a cylindrical
lens is introduced into the imaging path (Fig. 2a). As a result, the images of individual
molecules become elliptical, and elongated in two orthogonal directions for
molecules above and below the focal plane (Fig. 2a). The axial position of
each molecule can thus be obtained from the ellipticity of the observed PSF, which
in combination with the lateral positions obtained from the centroids of the PSF,
leads to the 3D reconstruction of super-resolution images (Fig. 2b). The astigmatism
method provides a resolution ~25 nm in xy and ~50 nm in z when imaging a bright
photoswitchable fluorophore Cy5 (or its structural analog Alexa 647). Here, we
K. Xu et al.
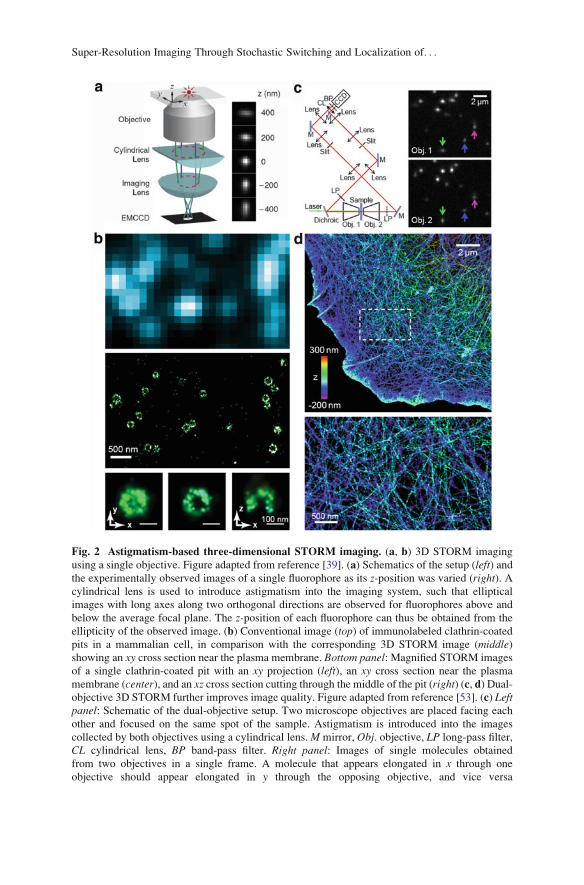
Fig. 2 Astigmatism-based three-dimensional STORM imaging. (a, b) 3D STORM imaging
using a single objective. Figure adapted from reference [39]. (a) Schematics of the setup (left) andthe experimentally observed images of a single fluorophore as its z-position was varied (right). Acylindrical lens is used to introduce astigmatism into the imaging system, such that elliptical
images with long axes along two orthogonal directions are observed for fluorophores above and
below the average focal plane. The z-position of each fluorophore can thus be obtained from the
ellipticity of the observed image. (b) Conventional image (top) of immunolabeled clathrin-coated
pits in a mammalian cell, in comparison with the corresponding 3D STORM image (middle)showing an xy cross section near the plasma membrane. Bottom panel: Magnified STORM images
of a single clathrin-coated pit with an xy projection (left), an xy cross section near the plasma
membrane (center), and an xz cross section cutting through the middle of the pit (right) (c, d) Dual-objective 3D STORM further improves image quality. Figure adapted from reference [53]. (c) Leftpanel: Schematic of the dual-objective setup. Two microscope objectives are placed facing each
other and focused on the same spot of the sample. Astigmatism is introduced into the images
collected by both objectives using a cylindrical lens.M mirror, Obj. objective, LP long-pass filter,
CL cylindrical lens, BP band-pass filter. Right panel: Images of single molecules obtained
from two objectives in a single frame. A molecule that appears elongated in x through one
objective should appear elongated in y through the opposing objective, and vice versa
Super-Resolution Imaging Through Stochastic Switching and Localization of. . .
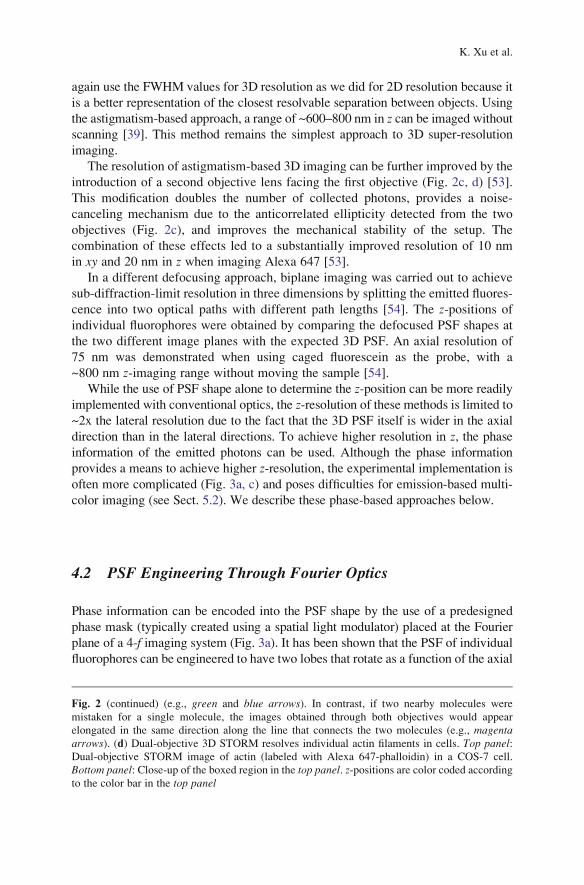
again use the FWHM values for 3D resolution as we did for 2D resolution because it
is a better representation of the closest resolvable separation between objects. Using
the astigmatism-based approach, a range of ~600–800 nm in z can be imaged without
scanning [39]. This method remains the simplest approach to 3D super-resolution
imaging.
The resolution of astigmatism-based 3D imaging can be further improved by the
introduction of a second objective lens facing the first objective (Fig. 2c, d) [53].
This modification doubles the number of collected photons, provides a noise-
canceling mechanism due to the anticorrelated ellipticity detected from the two
objectives (Fig. 2c), and improves the mechanical stability of the setup. The
combination of these effects led to a substantially improved resolution of 10 nm
in xy and 20 nm in z when imaging Alexa 647 [53].
In a different defocusing approach, biplane imaging was carried out to achieve
sub-diffraction-limit resolution in three dimensions by splitting the emitted fluores-
cence into two optical paths with different path lengths [54]. The z-positions of
individual fluorophores were obtained by comparing the defocused PSF shapes at
the two different image planes with the expected 3D PSF. An axial resolution of
75 nm was demonstrated when using caged fluorescein as the probe, with a
~800 nm z-imaging range without moving the sample [54].
While the use of PSF shape alone to determine the z-position can be more readily
implemented with conventional optics, the z-resolution of these methods is limited to
~2x the lateral resolution due to the fact that the 3D PSF itself is wider in the axial
direction than in the lateral directions. To achieve higher resolution in z, the phase
information of the emitted photons can be used. Although the phase information
provides a means to achieve higher z-resolution, the experimental implementation is
often more complicated (Fig. 3a, c) and poses difficulties for emission-based multi-
color imaging (see Sect. 5.2). We describe these phase-based approaches below.
4.2 PSF Engineering Through Fourier Optics
Phase information can be encoded into the PSF shape by the use of a predesigned
phase mask (typically created using a spatial light modulator) placed at the Fourier
plane of a 4-f imaging system (Fig. 3a). It has been shown that the PSF of individual
fluorophores can be engineered to have two lobes that rotate as a function of the axial
Fig. 2 (continued) (e.g., green and blue arrows). In contrast, if two nearby molecules were
mistaken for a single molecule, the images obtained through both objectives would appear
elongated in the same direction along the line that connects the two molecules (e.g., magentaarrows). (d) Dual-objective 3D STORM resolves individual actin filaments in cells. Top panel:Dual-objective STORM image of actin (labeled with Alexa 647-phalloidin) in a COS-7 cell.
Bottom panel: Close-up of the boxed region in the top panel. z-positions are color coded accordingto the color bar in the top panel
K. Xu et al.
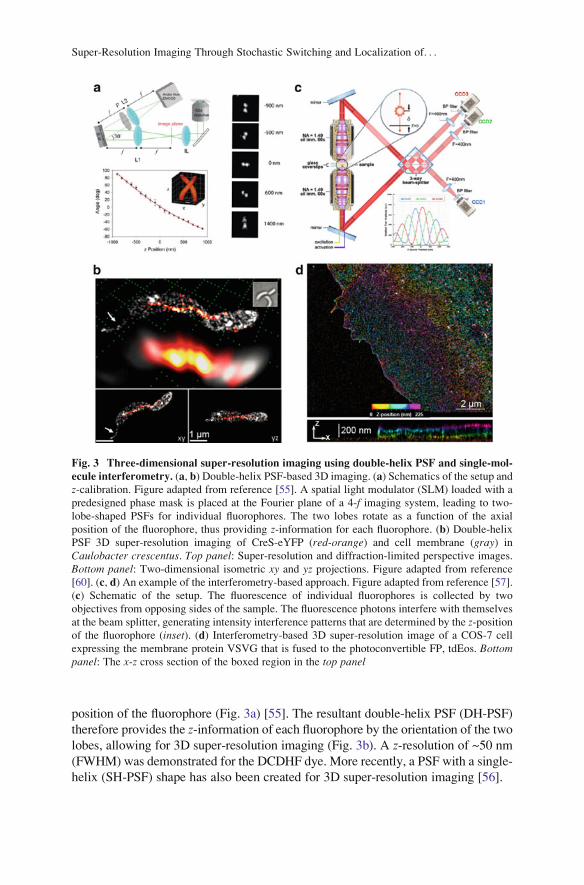
position of the fluorophore (Fig. 3a) [55]. The resultant double-helix PSF (DH-PSF)
therefore provides the z-information of each fluorophore by the orientation of the two
lobes, allowing for 3D super-resolution imaging (Fig. 3b). A z-resolution of ~50 nm
(FWHM) was demonstrated for the DCDHF dye. More recently, a PSF with a single-
helix (SH-PSF) shape has also been created for 3D super-resolution imaging [56].
Fig. 3 Three-dimensional super-resolution imaging using double-helix PSF and single-mol-
ecule interferometry. (a, b) Double-helix PSF-based 3D imaging. (a) Schematics of the setup and
z-calibration. Figure adapted from reference [55]. A spatial light modulator (SLM) loaded with a
predesigned phase mask is placed at the Fourier plane of a 4-f imaging system, leading to two-
lobe-shaped PSFs for individual fluorophores. The two lobes rotate as a function of the axial
position of the fluorophore, thus providing z-information for each fluorophore. (b) Double-helix
PSF 3D super-resolution imaging of CreS-eYFP (red-orange) and cell membrane (gray) in
Caulobacter crescentus. Top panel: Super-resolution and diffraction-limited perspective images.
Bottom panel: Two-dimensional isometric xy and yz projections. Figure adapted from reference
[60]. (c, d) An example of the interferometry-based approach. Figure adapted from reference [57].
(c) Schematic of the setup. The fluorescence of individual fluorophores is collected by two
objectives from opposing sides of the sample. The fluorescence photons interfere with themselves
at the beam splitter, generating intensity interference patterns that are determined by the z-positionof the fluorophore (inset). (d) Interferometry-based 3D super-resolution image of a COS-7 cell
expressing the membrane protein VSVG that is fused to the photoconvertible FP, tdEos. Bottompanel: The x-z cross section of the boxed region in the top panel
Super-Resolution Imaging Through Stochastic Switching and Localization of. . .
Compared to the defocusing approaches described above, an advantage of these
helical PSF approaches is the longer z-range (~2 μm) that can be imaged without
scanning the focal plane (Fig. 3a, b) [55]. A potential disadvantage of these
approaches is that the PSF in these cases takes up a larger imaging area, which
could limit the number of fluorophores that can be simultaneously imaged in each
frame and thus lead to slower data acquisition. The use of a polarization-dependent
spatial light modulator can also lead to a reduction in the number of photons
collected at the camera.
4.3 Single-Molecule Interferometry
Interferometry-based single-molecule localization provides a direct way to
extract phase information [57–59]. A single photon is coherent with itself;
therefore, self-interference of individual photons will lead to intensity modulation
of the signal from a single fluorophore. In this approach, photons emitted from
individual fluorophores are collected by two objectives from opposing sides of the
sample and self-interfered at a beam splitter, generating intensity modulations due
to path-length differences determined by the axial position of the fluorophore
(Fig. 3c). Using this approach, z-resolutions as high as ~10 nm have been
demonstrated when using fluorescent proteins (Fig. 3d) [57] and organic dyes
[59].
A major drawback of the interferometry-based method is the complexity in
instrumentation, partly due to the short coherence length of fluorophores (a few
micrometers). In its first implementation, the interferometry-based method was
limited to samples thinner than ~200 nm because the interference pattern repeats
itself every one-half of the emission wavelength [57]. In a subsequent work, this
limitation was overcome by considering the spherical shape of the wavefront and
examining the higher moments of the PSF, extending the working z-range to
~600 nm [59].
4.4 Tilted Mirrors
By projecting the axial dimension onto a lateral dimension using a tilted mirror,
virtual volume super-resolution microscopy (VVSRM) determines the 3D position
of single fluorescent emitters through observing the side-view mirror reflection
(virtual image) alongside with the front-view real image [61]. VVSRM is capable
of providing near-isotropic 3D resolution, but the requirement of sample being
positioned close to (or attached to) a specialized, tilted micro-mirror potentially
limits broader application of the method.
K. Xu et al.
4.5 Thick Sample Imaging
Due to the relatively small depth of focus for high NA objectives (~600 nm,
which essentially defines the axial resolution of conventional optical micros-
copy), most 3D localization techniques have a similar, limited working z-rangeof ~600–800 nm (except for the helical PSF methods). A natural way to extend
the z-range is to scan the focal plane in steps smaller than ~600 nm and stack up
the 3D super-resolution images acquired at each step [54, 62]. For example, by
combining astigmatism-based imaging and z-scanning, whole-cell 3D super-
resolution images were demonstrated with z-ranges of ~3 μm [62]
Although relatively easy to implement, a drawback to the direct application of
z-scanning is that during imaging, illumination is not restricted to the volume being
imaged. This leads to undesired activation and excitation of fluorophores outside
the focal volume, causing increased fluorescence background and unnecessary
photobleaching.
The illumination problem can be alleviated by the use of two-photon absorption,
which, through nonlinear optical processes, is capable of confining the activation of
fluorophores to a thin layer near the focal plane. This technique was first combined
with 2D super-resolution imaging to generate 3D image stacks that only achieve
super-resolution in the lateral directions [63, 64]. More recently, optical sectioning
with two-photon activation was combined with astigmatism-based 3D super-reso-
lution imaging, allowing a total imaging depth of up to ~7 μm [65].
Another way to confine the illumination axially is to use thin light sheets. In
selective plane illumination microscopy (SPIM), the excitation light is shaped into
a thin sheet that illuminates the sample through a separate objective placed perpen-
dicular to the detection objective. Sheet illumination allows optical sectioning and
prevents photobleaching and photoactivation outside the focal region [66]. Individ-
ual molecule localization-SPIM (IML-SPIM) was demonstrated by shaping the
activation and excitation beams into collinear light sheets [67]. In combination
with astigmatism for 3D localization, IML-SPIM achieved 63-nm lateral resolution
and 140-nm axial resolution for thick specimens at a depth of 50–100 μm.
5 Multicolor Imaging
Multicolor imaging is one of the key advantages of fluorescence microscopy. With
proper labeling, multicolor imaging allows for the visualization of different target
molecules in a sample, from which the spatial relations and interactions between
different molecules can be inferred. Multicolor super-resolution imaging has been
accomplished using STORM, (F)PALM, and related methods by using fluorescent
probes with different wavelengths of activation or emission.
Super-Resolution Imaging Through Stochastic Switching and Localization of. . .
5.1 Activation-Based Multicolor Imaging
While photoswitchable dyes are typically activated to fluorescent states by illu-
mination with ultraviolet (UV) light, the activation wavelength can be shifted into
the visible range for some photoswitchable dyes by pairing them with another dye
molecule that absorbs visible light. Upon absorbing light, the latter dye molecule
(called an activator) can facilitate the activation of the photoswitchable dye
(called a reporter). For example, by pairing the same reporter dye, Cy5, with
three different activator dyes, Alexa Fluor 405, Cy2, and Cy3, the Cy5 dye can be
activated into the fluorescent state when illuminated by violet, blue, or green light,
respectively [18]. Multicolor imaging can thus be performed using these
photoswitchable dye pairs, in which case the same reporter dye is imaged and
localized in all color channels, but the different dye pairs are distinguished by the
different wavelengths of light used for activation (Fig. 4) [18]. As a result, the
images in different color channels are always perfectly aligned since the same
optical path was used to collect the fluorescence emitted by the reporter in
different dye pairs. In addition, the activation-based multicolor approach allows
one to pick the best reporter dye to achieve the highest image resolution in all
different color channels.
It should be noted that the light used to image the reporter dye can also directly
activate the dye, albeit with a low activation rate. On the plus side, this property
allows a very simple-imaging scheme for single-color super-resolution imaging with
a single-color laser source and single photoswitchable reporter [68]. On the flip side,
for multicolor imaging, this property leads to a drawback of relatively high color
crosstalk. During imaging, activation by the imaging light results in nonspecific
localizations independent of the activation light. This effect can lead to substantial
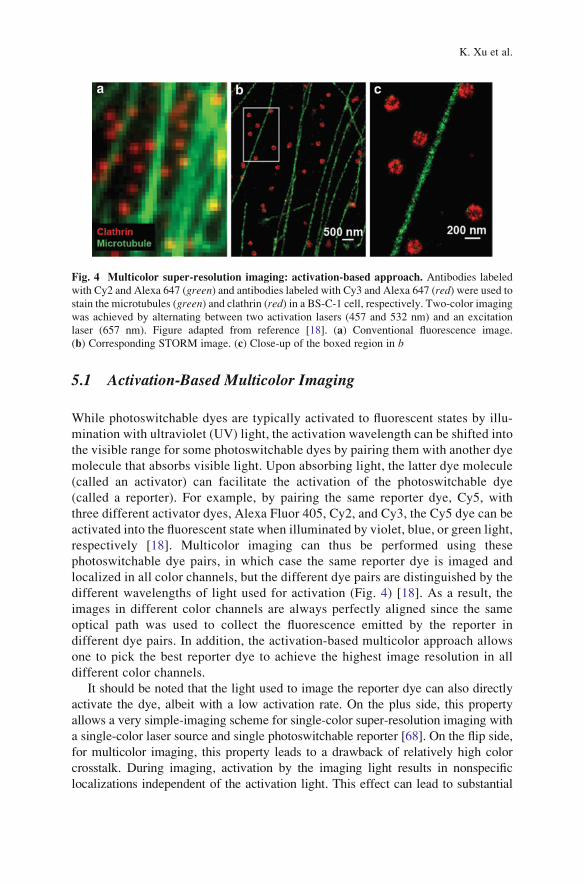
Fig. 4 Multicolor super-resolution imaging: activation-based approach. Antibodies labeled
with Cy2 and Alexa 647 (green) and antibodies labeled with Cy3 and Alexa 647 (red) were used tostain the microtubules (green) and clathrin (red) in a BS-C-1 cell, respectively. Two-color imaging
was achieved by alternating between two activation lasers (457 and 532 nm) and an excitation
laser (657 nm). Figure adapted from reference [18]. (a) Conventional fluorescence image.
(b) Corresponding STORM image. (c) Close-up of the boxed region in b
K. Xu et al.
crosstalk (10–20 %) between different color channels [69]. Although crosstalk
subtraction [70] can reduce the crosstalk to below 10 %, when imaging molecules
with very different abundance, crosstalk from the high-abundance species could
overwhelm the signal from the low-abundance species.
5.2 Emission-Based Multicolor Imaging
Multicolor imaging can also be achieved by employing photoswitchable
probes (emitters) with different emission colors (Fig. 5). Emission-based multicolor
super-resolution imaging has been achieved using different-colored fluorescent
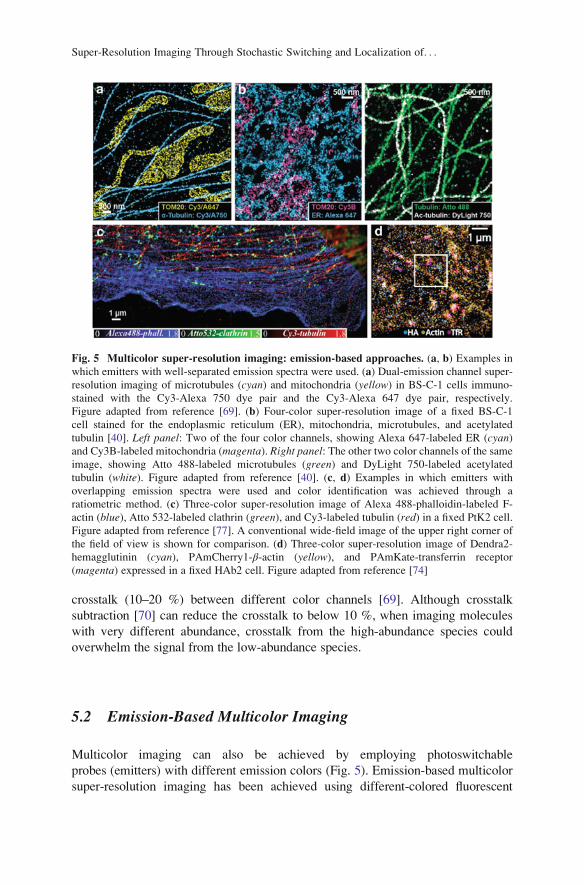
Fig. 5 Multicolor super-resolution imaging: emission-based approaches. (a, b) Examples in
which emitters with well-separated emission spectra were used. (a) Dual-emission channel super-
resolution imaging of microtubules (cyan) and mitochondria (yellow) in BS-C-1 cells immuno-
stained with the Cy3-Alexa 750 dye pair and the Cy3-Alexa 647 dye pair, respectively.
Figure adapted from reference [69]. (b) Four-color super-resolution image of a fixed BS-C-1
cell stained for the endoplasmic reticulum (ER), mitochondria, microtubules, and acetylated
tubulin [40]. Left panel: Two of the four color channels, showing Alexa 647-labeled ER (cyan)and Cy3B-labeled mitochondria (magenta). Right panel: The other two color channels of the same
image, showing Atto 488-labeled microtubules (green) and DyLight 750-labeled acetylated
tubulin (white). Figure adapted from reference [40]. (c, d) Examples in which emitters with
overlapping emission spectra were used and color identification was achieved through a
ratiometric method. (c) Three-color super-resolution image of Alexa 488-phalloidin-labeled F-
actin (blue), Atto 532-labeled clathrin (green), and Cy3-labeled tubulin (red) in a fixed PtK2 cell.
Figure adapted from reference [77]. A conventional wide-field image of the upper right corner of
the field of view is shown for comparison. (d) Three-color super-resolution image of Dendra2-
hemagglutinin (cyan), PAmCherry1-β-actin (yellow), and PAmKate-transferrin receptor
(magenta) expressed in a fixed HAb2 cell. Figure adapted from reference [74]
Super-Resolution Imaging Through Stochastic Switching and Localization of. . .
proteins [71–74], different-colored organic dyes [40, 41, 75–77], or a combination of
fluorescent proteins and dyes [21]. A recent comprehensive dye screen led to
the identification of high-quality photoswitchable dyes in four separate spectral
regions and thus four-color super-resolution imaging (Fig. 5b) [40]. Three-color
super-resolution imaging has also been accomplished with fluorescent proteins
(Fig. 5d) [74].
Compared to the activation-based approach, the emission-based approach
provides substantially lower color crosstalk (as low as a few percent) when the
probes used have well-separated emission spectra (Fig. 5a, b). In the event that the
emission spectra of the different probes overlap considerably, they can still be
separately identified using ratiometric methods (Fig. 5c, d), though the crosstalk in
this case tends to be higher (5–20 %) [74, 75, 77].
A drawback of the emission-based multicolor approach is that multiple filter sets
and/or optical paths have to be employed. Aligning the images obtained from
different color channels with nanometer-scale accuracy is nontrivial, especially
since chromatic aberrations (and other imperfections) are hard to eliminate
completely in the imaging system. Alignment of different color channels is typically
performed using fiducial markers such as fluorescent beads with a broad emission
spectrum [41]. In addition, not all photoswtichable probes have the same brightness
(number of photons detected per switching event). The brightest photoswitchable
probes (i.e., Cy5, Alexa 647) all tend to have the same (far-red) emission wavelength
[40]. As a result, one or more channels will have compromised image resolution
using emission-based multicolor imaging as compared to activation-based multicolor
imaging. The use of probes with different emission spectra also creates problems for
interferometry-based 3D imaging, though it is possible to solve these problems with
probes of overlapping spectra using a ratiometric method [59].
Finally, when activator-reporter dye pairs are used, combination of the activa-
tion-based and emission-based approaches allows imaging with a large number of
colors. For example, when three reporter dyes and three activator dyes are com-
bined, as many as nine distinct dye pairs can be constructed. Six- and seven-color
super-resolution imaging has recently been demonstrated using this combinatorial
approach [69, 78].
6 Live-Cell Imaging
Live-cell imaging capability is another key advantage of optical microscopy, which
allows direct visualization of molecular processes in cells in real time. The substan-
tially improved spatial resolution of optical nanoscopy opens a new window for
capturing ultrastructural dynamics in vivo. A number of important factors should be
considered for live-cell imaging, including labeling living cells with photoswitchable
probes, the trade-off between spatial and temporal resolutions, motion blurring effect,
and potential phototoxicity to live samples. We discuss these points below.
K. Xu et al.
6.1 Labeling Live Cells with Photoswitchable Probes
The most straightforward method for labeling proteins in live cells with fluorescent
probes is to use fluorescent proteins, which can be genetically fused to the target
proteins of interest. Indeed, live-cell sub-diffraction-limit imaging using the sto-
chastic switching was initially demonstrated with photoactivatable fluorescent
proteins: PA-GFP, tdEos, or mEos2 in mammalian cells [42, 79] (Fig. 6a) and
EYFP in bacteria [27]. To achieve relatively high resolution and avoid potential
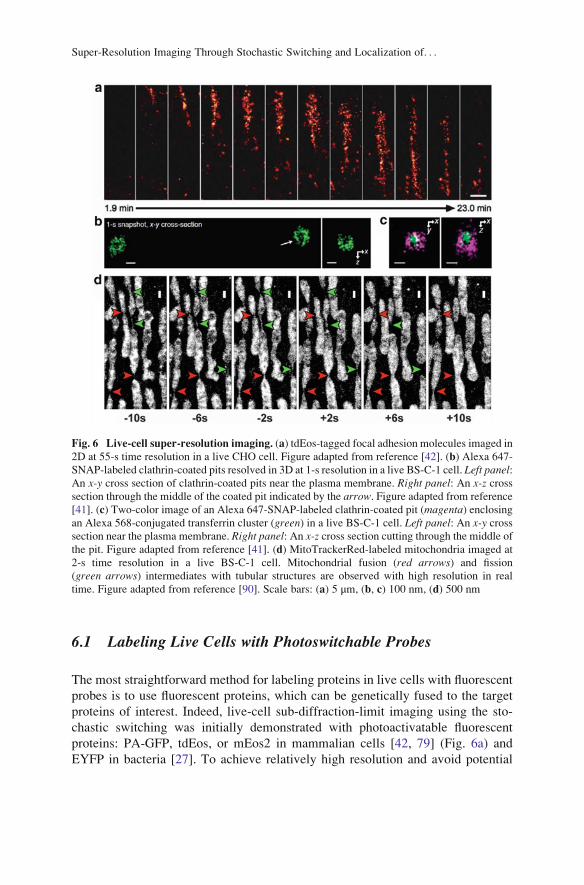
Fig. 6 Live-cell super-resolution imaging. (a) tdEos-tagged focal adhesion molecules imaged in
2D at 55-s time resolution in a live CHO cell. Figure adapted from reference [42]. (b) Alexa 647-
SNAP-labeled clathrin-coated pits resolved in 3D at 1-s resolution in a live BS-C-1 cell. Left panel:An x-y cross section of clathrin-coated pits near the plasma membrane. Right panel: An x-z crosssection through the middle of the coated pit indicated by the arrow. Figure adapted from reference
[41]. (c) Two-color image of an Alexa 647-SNAP-labeled clathrin-coated pit (magenta) enclosingan Alexa 568-conjugated transferrin cluster (green) in a live BS-C-1 cell. Left panel: An x-y crosssection near the plasma membrane. Right panel: An x-z cross section cutting through the middle of
the pit. Figure adapted from reference [41]. (d) MitoTrackerRed-labeled mitochondria imaged at
2-s time resolution in a live BS-C-1 cell. Mitochondrial fusion (red arrows) and fission
(green arrows) intermediates with tubular structures are observed with high resolution in real
time. Figure adapted from reference [90]. Scale bars: (a) 5 μm, (b, c) 100 nm, (d) 500 nm
Super-Resolution Imaging Through Stochastic Switching and Localization of. . .
artifacts due to the oligomerization tendency of fluorescent proteins, bright, mono-
meric proteins such as Dendra, mEos2, mEos3, PAmCherry, and PAtagRFP
[73, 80–83] are preferred. On the other hand, these proteins can switch on only
one to two times before photobleaching. For applications where many snapshots are
required to follow the entire time course of a process, proteins with many switching
cycles are required. The newly developed rsEGFP and Dreiklang, which can switch
hundreds to thousands of cycles [84, 85], may be promising candidates.
Compared to fluorescent proteins, organic dyes tend to have superior brightness
and faster switching rates, and thus offer higher spatial and temporal resolutions.
Live-cell labeling of proteins with organic dyes, however, requires more steps than
with fluorescent proteins: (1) the target protein needs to be genetically encoded with
specific peptide or protein tags that can bind to or react with dyes; (2) dyes have to
be delivered into live cells such that they can be attached to the specific tag. Live-
cell super-resolution imaging has been demonstrated with various tags including
SNAP, Halo, and trimethoprim [41, 77, 86–88]. For live-cell delivery,
cell-permeable dyes are most convenient and these dyes, such as Atto 655, TMR,
and OregonGreen, have been used for super-resolution imaging of living cells
[77, 86, 88]. However, these dyes are not brighter (i.e., does not give more photons
per switching cycle) than the above-mentioned fluorescent proteins and, hence, do
not provide higher image resolution. The bright and fast switching dyes, such as
Cy5 and Alexa 647, which yield ~4 times more photons than the cell-permeable
dyes and fluorescent proteins in living cells, cannot spontaneously penetrate cell
membrane. Nonetheless, they can be delivered into live cells by methods that
temporally disrupt the cell membrane, such as electroporation, bead loading, and
microinjection, providing substantially higher spatial and temporal resolution than
affordable by fluorescent proteins [41] (Fig. 6b). One thing to note, however, is that
switching characteristics of these cyanine dyes tend to be sensitive to their environ-
ment and the best performance often requires chemical additives such as thiols and
oxygen scavengers; at low concentrations, these additives do not affect cell
viability.
Small-molecule probes that directly bind to DNA or membrane can also be
used for live-cell super-resolution imaging. These probes are often commercially
available and easy to use. Also, the high labeling density, stemming from the
small size and high affinity of these probes, improves the resolution and extends
the length of time-lapse imaging. Nuclear and mitochondrial DNA were imaged
in live cells with Picogreen [89]. Eight conventional membrane probes enabled
live-cell imaging of the plasma membrane, mitochondria, ER, and lysosomes
(Fig. 6d) [90].
Multicolor live-cell imaging has also been achieved using spectrally distinct
fluorophores, either with fluorescent proteins [73] or fluorescent dyes (Fig. 6c) [41].
For fluorophores with partially overlapping spectra, ratiometric methods can be
used for live-cell super-resolution imaging, again either using dyes, fluorescent
proteins, or a combination between the two [74, 77, 90].
K. Xu et al.
6.2 Spatial and Temporal Resolutions
In time-resolved super-resolution imaging, spatial and temporal resolutions intrin-
sically trade off with each other. For example, in the point scanning approaches,
such as STED [91], the higher the resolution, the smaller the pixel size used on
scanning and hence the slower the imaging speed. In the wide-field single-mole-
cule-based approach, such as STORM and (F)PALM, the trade-off between spatial
and temporal resolutions arises from the fact that a sufficiently large number of
localizations need to be accumulated to resolve a structure at a desired Nyquist
resolution (see Sect. 3.2 for definition of Nyquist resolution) [42]. Increasing the
time window will result in more localizations, thereby improving the spatial
resolution defined by the Nyquist criterion. Conversely, decreasing the time win-
dow for each STORM snapshot will improve the time resolution at the expense of
the spatial resolution.
In live-cell studies using photoswitchable/photoactivatable fluorescent proteins,
spatial resolutions of 40–70 nm have been achieved with 30–60 s time resolutions
[27, 42] (Fig. 6a). Improving the time resolution may be difficult with the currently
available fluorescent proteins as the number of photons detected per switching
cycle tends to decrease when the excitation laser intensity was increased to accel-
erate the switching rate [41]. Hence, the camera frame rate used for imaging
photoswitchable/photoactivatable fluorescent proteins is typically not higher than
100 Hz, beyond which the image quality deteriorates rapidly. This difficulty can be
overcome with bright, fast switching fluorescent dyes, such as Alexa 647, which
give a constant number of photons per switching cycle even when the off-switching
rate is as fast as ~1 ms. Hence, STORM images using Alexa 647 could be recorded
at the camera frame rate of 500–1,000 Hz, and cellular structures have been imaged
in two dimensions with a Nyquist resolution of ~20 nm at time resolutions as high
as 0.5 s [41].
For 3D imaging, substantially more localizations are required to define a struc-
ture with the same Nyquist resolution than in 2D given that the localizations are now
spread across a 3D volume instead of a 2D projected area. For instance, a sphere
with a 100-nm diameter would require only 80 localizations in 2D but 520
localizations in 3D to achieve a 20-nm Nyquist resolution. Hence, the temporal
resolution of 3D super-resolution is typically lower than the 2D counterpart. Using
Alexa 647 and astigmatism imaging, 3D super-resolution imaging has been
achieved with a Nyquist resolution of 25–30 nm at 1–2-s temporal resolution
(Fig. 6b) [41]. Another factor that reduces the 3D imaging speed is that the modified
PSF for axial localization will cover a larger area, reducing the number of molecules
that can be localized per frame, and hence the overall imaging speed. For example,
the elliptically shaped PSF in astigmatism imaging [39], the isotropically expanded
PSF in biplane imaging [54], and the rotating dumbbell PSF in DH-PSF imaging
[55], all cover substantially larger area than the focused, circularly symmetric PSF
used in 2D imaging. While the interferometry-based method [57] does not increase
Super-Resolution Imaging Through Stochastic Switching and Localization of. . .
the PSF size, the need to sandwich the sample between two objectives in this case
considerably limits the applicability of such methods to live-cell imaging.
One way of improving the time resolution of live-cell imaging is to develop
analysis methods that can fit multiple, partially overlapping PSFs simultaneously.
Several analysis methods have been developed for these purposes, such as
DAOSTORM [30, 32], multiple emitter fitting [31], 3B analysis [36], decon-
STORM [38], and compressed sensing [33]. Such analysis methods allow for the
activation of more molecules per frame, so the desired number of localizations can
be collected in a smaller number of camera frames (and shorter time). SOFI [37], a
super-resolution imaging method based on single-molecule fluctuation, also allows
for fast live-cell super-resolution and will be described in detail in another chapter
of this book.
6.3 Single-Molecule Tracking
The use of photoactivation also offers a unique opportunity to capture the dynamics
of individual molecules in living cells. For example, single-particle tracking has
been widely used to probe the motion (diffusion) of lipids and proteins on
membranes in live cells [92]. However, to track individual molecules, the density
of molecular images must be kept low enough that the images do not overlap. The
low-density molecular traces make it difficult to provide both spatially and tempo-
rally resolved information about membrane diffusivity. Photoactivatable probes
allow high-density single-molecule tracking in live cells by switching on an
optically resolvable subset of photoactivatable probes at any time, tracking individ-
ual probes until photobleaching, and then repeating cycles of switching and tracking
to accumulate a large number of trajectories [93]. Besides using photoactivation,
binding/unbinding events can also be used to collect a high density of molecular
trajectories on the cell surface as shown in PAINT [28, 94]. The time resolution of
tracing individual molecules is limited by the camera frame rate, typically in the
range of 30–1,000 Hz. The high-density map of molecular trajectories can be used
to probe distinct subsets of molecules and can provide insight into spatial and
temporal heterogeneities in the membrane [82, 93, 95], as well as in other systems.
6.4 Motion Blur
Unlike in fixed specimens, molecules and subcellular structures move in live
cells. Their motion can effectively deteriorate spatial resolution and distort the
observed structures. Two types of motions are important to consider for live-cell
super-resolution imaging. The first type is the motion of probe molecules within
K. Xu et al.
a camera frame (e.g., diffusion). A general rule of thumb is that, to maintain the
localization precision, the probe molecule should not move by a distance larger
than the localization error during a camera frame. For example, a molecule
diffusing at 0.1 μm2 s–1 on a membrane moves by 200 nm on average within
0.1 s and by 30 nm in 2 ms. Thus, a fast camera is essential for localizing fast-
diffusing molecules with high precision. Additionally, the image shape of the
molecule is blurred by diffusion within a camera frame, and therefore 3D imaging
methods that rely on PSF shapes to obtain the axial position potentially require
even faster frame rate. The plus side of molecular diffusion is that as the
molecules diffuse within and map out the underlying structure, each probe
molecule could contribute more than one independent localizations, which in
turn improves the Nyquist resolution.
The second type of motion to consider is the motion/change of the structure itself
during each super-resolution snapshot. To avoid artifacts due to this motion, the
displacement/deformation of the structure during the time acquiring each snapshot
should be less than the spatial resolution. Given that super-resolution methods
provide higher image resolution than conventional fluorescence microscopy, and
in the meantime acquires each snapshot more slowly, this paradox puts a more
stringent constraint on the motion of the cellular structure.
6.5 Photo- and Chemical Toxicity
Live-cell super-resolution imaging typically requires stronger excitation light inten-
sity than conventional microscopy. In some cases, chemical additives are also added
in the imaging buffer to facilitate photoswitching of fluorophores. These conditions
can affect cell viability. Red or near-infrared light is less phototoxic than blue or UV
light and is thus preferred for live-cell imaging. Some photoswitchable organic
dyes, including Cy5, Alexa 647, Cy7, and Alexa 750 can be imaged at far-red and
near-infrared wavelengths [18, 40]. Recently, an orange-to-far-red photoswitchable
fluorescent protein was also developed [96]. In addition to the imaging laser, UV or
violet light is often used for activating photoswitchable dyes and fluorescent
proteins. Coupling activator dyes with photoswitchable reporter dyes can help to
reduce the activation intensity or to change the activation color to a less phototoxic
wavelength. To prolong the lifetime of fluorophores, the imaging medium is often
supplemented with oxygen and/or radical scavengers, which are also widely used
for conventional live-cell imaging [97]. In addition, some organic dyes perform
better in the presence of thiols or reducing/oxidizing agents. Although when added
at low concentrations, these additives do not affect cell health, they have the
potential to perturb the dynamics of interest and the viability of live cells at high
concentrations. Hence, control experiments to test whether the imaging conditions
perturb the cell viability and the dynamics under investigation are necessary.
Super-Resolution Imaging Through Stochastic Switching and Localization of. . .
7 Choice of Fluorescent Probes
As discussed above, the implementation of STORM, (F)PALM, and related methods
depends on the stochastic switching of the fluorescent probes between the dark and
emitting states. In an effort to provide general guidelines for the characterization of
super-resolution probes, a recent study systematically investigated the properties of
26 organic dyes and identified several parameters as being crucial in determining the
quality of the final super-resolution images: (1) photons per switching event, (2) on-
off contrast ratio, (3) on-off duty cycle, and (4) number of switching cycles [40]. An
ideal probe should emit a large number of photons per switching cycle and should
provide high contrast between the on and off states, i.e., give bright emission in the
emitting state (to maximize signal) and negligible emission in the dark state
(to minimize background), so as to maximize the localization precision. It should
also have a low on-off duty cycle, defined as the fraction of time that the probe spends
in the on state, to maximize the number of probe molecules that can be localized per
diffraction-limited volume. Together, these factors ensure a high overall image
resolution when both localization precision and localization densities are considered.
In addition, probes with a large number of switching cycles allow many super-
resolution snapshots to be taken, which greatly benefit imaging of dynamic processes.
Finally, other factors, including physical size of the probe and how the sample will be
labeled with the probe, should also be taken into consideration when designing
experiments.
Several subsequent chapters in this book are dedicated to probe development for
nanoscopy. Here we only provide a general overview and briefly discuss the
advantages and disadvantages of different types of probes for super-resolution
applications.
7.1 Fluorescent Dyes vs. Fluorescent Proteins
Some photoswitchable dyes have excellent brightness (defined here as the number
of photons detected per switching cycle), high contrast ratio, and low on-off duty
ratio. Among the tens of synthesized dyes that have been tested, the red-absorbing
(640–700 nm) dyes, Cy5, Alexa 647, and Dyomics 654 are among the best probes,
each providing ~5,000 detected photons per switching cycle, exhibiting undetect-
able dark state fluorescence, and have an on-off duty ratio of ~0.001 or lower [40].
They consistently give higher-quality images than other probes. For multicolor
imaging (see Sect. 5.2), dyes with reasonably good performance have also been
identified for other spectral ranges; i.e., blue dyes Atto488 and Alexa 488; yellow
dye Cy3B; and near-infrared dyes (740–805 nm) DyLight 750, Cy7, and Alexa
Fluor 750 [40].
A popular way to label cellular structures with dyes is through immunofluores-
cence, either directly with dye-labeled primary antibodies or indirectly with labeled
secondary antibodies. An advantage of the immunofluorescence scheme is that it
K. Xu et al.
allows endogenous proteins to be labeled without introducing fusion proteins,
which could potentially perturb the localization, function, and expression level of
the target proteins. The drawbacks are that antibodies are relatively bulky (~10 nm
in size) and it is difficult to label proteins in live cells with antibodies. These
problems can be at least partially overcome through alternative dye-labeling
methods. In hybrid fusion approaches, a specific enzyme or peptide tag is geneti-
cally fused to the protein of interest and the dye molecules are specifically attached
to the tags [41, 77, 86–88, 98, 99]. In particular, short-peptide tagging methods like
sortagging [100] and LplA labeling [101, 102] could be especially beneficial due to
their small sizes (~1–2 nm). Target-specific small molecules can also be used to
label cellular structures in some cases, e.g., phalloidin specifically labels filamen-
tous actin [53].
Another popular type of fluorescent probes is fluorescent proteins. Compared to
organic dyes, the advantage of fluorescent proteins is that they can be genetically
fused to target protein of interest, offering a convenient and powerful way to label
proteins in live cells. One should, however, be cautious about the potential artifacts
on protein localization and function induced by fluorescent protein tags, which are
~4 nm in size and tend to oligomerize. Overexpression of the fusion proteins may
also cause artifacts. The main disadvantage of fluorescent proteins is their inferior
photophysical properties as compared to dyes. Fluorescent proteins are generally
dimmer than organic dyes. The bright photoswitchable/photoactivable fluorescent
proteins, such as Dendra2 [80], mEos2 [81], PAmCherry [73], and PAtagRFP [82]
provide ~1,000 detected photons per switching cycles. The dark states of fluores-
cent proteins also tend to have non-negligible fluorescence, providing lower con-
trast ratio than switchable dyes. The on-off duty cycle of these fluorescent proteins,
however, can be as low as 10–4–10–5, which is better than that of most organic dyes.
In addition to dyes and fluorescent proteins, quantum dots have also been used
for super-resolution imaging [103].
7.2 Dye Pairs vs. Single Dyes
It has been shown that highly controllable photoswitches can be constructed when a
photoswitchable reporter dye molecule (e.g., Cy5) is brought into the proximity of
another activator dye molecule (e.g., Cy3) [104]. In this scheme, the reporter dye is
imaged and switched off by the excitation light, while the activator dye is capable of
activating the reporter when illuminated by light that matches the activator’s
absorption spectrum. The presence of the activator dye greatly facilitates the
activation process and uniquely enables activation-based multicolor imaging,
where activator dyes with different absorption spectra are used (more details of
this multicolor imaging scheme are described in Sect. 5.1) [18]. For immunofluo-
rescence imaging, antibodies can be nonspecifically labeled with both activator and
reporter dyes in a single reaction step, in ways similar to labeling antibodies with a
single type of dye. However, when labeling with the hybrid fusion approaches using
Super-Resolution Imaging Through Stochastic Switching and Localization of. . .
protein or peptide tags, covalently linked activator-reporter dye pairs are required.
Such pre-linked dye pairs have been synthesized [62, 105].
The photoswitchable reporter dyes can also be directly activated through either
the excitation light or an additional short-wavelength (e.g., UV to green) light
[23, 68]. The major advantage of using the reporter dye alone (as opposed to dye
pairs) is that a single dye can be more easily used to directly label target proteins
(such as through the hybrid fusion approach) or to label small molecules. However,
in the absence of an activator dye, the light intensity used to activate the reporter
dye is often several orders of magnitude higher than when the activator dye is
present. Strong short-wavelength illuminations, particularly UV and violet, could
induce phototoxicity. Multicolor imaging with single dyes can be accomplished
through the emission-based multicolor scheme. The advantages and disadvantages
of the activation- and emission-based multicolor schemes are described in Sect. 5.
7.3 Reversible Photoswitchable vs. IrreversiblePhotoactivatable Probes
The switchable probes used for super-resolution imaging can also be categorized
according to their switching properties. The reversible, photoswitchable probes canbe switched between the emitting and dark states multiple times. An advantage of
using reversible, photoswitchable probes is that each probe can be localized multi-
ple times. This is particularly useful for live-cell studies, in which the morphologi-
cal changes of structures often need to be tracked over a substantially long period.
In addition, most photoswitchable probes start in an emitting state before being
switched off prior to super-resolution imaging. Conventional fluorescence images
can thus be obtained before super-resolution imaging is performed, which in
practice is useful for locating regions of interest.
In comparison, the irreversible, photoactivatable probes can only be brought intothe emission state once. During imaging, individual probes are activated, imaged,
and permanently photobleached. As each probe can only be imaged once, these
probes are less suitable for monitoring live-cell dynamics that requires many
snapshots. On the other hand, the fact that each molecule only appears once
makes it easier to quantify the number of molecules in a target structure. It is
worth noting though, many photoactivatable fluorescent proteins that are thought to
be irreversibly activated can in fact be switched on and off a few times [106, 107],
and methods to account for this reversible blinking effect in protein quantification
have been recently developed [95, 108, 109]. For stoichiometric quantification,
one also needs to know the fraction of target molecules that are labeled and the
fraction of the fluorescent labels that have matured (for fluorescent proteins) and
can be photoactivated (for both fluorescent proteins and dyes).
Rather than switching between a dark state and an emitting state, photochromicprobes switch from one emitting color to a different color (e.g., from green to red)
K. Xu et al.
upon being activated by light. For example, EosFP switches from a green, pre-
activation state to an orange/red, post-activation state [110]. Photochromic probes
can either irreversibly or reversibly switch between two emitting states. Photochromic
probes, in general, also allow for the recording of conventional fluorescence images
before super-resolution imaging, e.g., in the color channel before photoswitching.
7.4 Other Probes
Beyond using photoswitchable fluorescent probes as discussed above, it is also
worth mentioning that alternative strategies have also been developed. These
strategies include the use of the PAINT approach [28], in which the emission of
the probes is recorded when they stochastically bind to the target, and the reversible
chemical quenchers [29], in which the stochastic switching of probes is realized
through the reversible binding of fluorescence quenchers (Sect. 2).
8 Applications
Due to their superb resolving power and relatively simple implementation, STORM,
(F)PALM, and related methods have been rapidly adopted by many labs and applied
to a variety of biological systems. Here wewill focus on applications in our laboratory
and related studies. Interested readers can also find numerous applications in other
chapters of this book.
8.1 Applications in Cell Biology
In eukaryotic cells, many well-characterized structures such as the cytoskeleton and
other protein scaffolds have been reexamined with super-resolution fluorescence
microscopy. These proof-of-principle systems not only demonstrated the resolving
power of the technique but also gave a glimpse of its potential for novel discoveries.
One application where this potential has been demonstrated is the study of
clathrin-coated pits, an essential cellular structure used for receptor-mediated
endocytosis. A clathrin-coated pit on the plasma membrane contains layers of
receptor and adaptor proteins under the clathrin coat, forming a spherical shell
with a diameter of ~100 nm. The sub-diffraction-limit morphology of clathrin-
coated pits was used to demonstrate the multicolor [18], 3D [39], and live-cell
[41] capabilities of STORM imaging in cells. In an in vitro model system, two
membrane-curvature generating/sensing proteins, dynamin and FBP17, were
found to distribute differentially on membrane tubules connecting clathrin-coated
Super-Resolution Imaging Through Stochastic Switching and Localization of. . .
pits: While FBP17 coats the entire tubule below the clathrin-coated pit, dynamin
is only located at the narrow neck region between the clathrin-coated pit and the
FBP-17-coated tubule [111]. In conjunction with confocal fluorescence imaging
and electron microscopy, STORM revealed an unexpected role of FBP17 in
creating endocytic vesicles [111].
Actin cytoskeleton is another representative example. Dual-objective STORM
resolved individual actin filaments in cells and revealed 3D ultrastructure of the
actin cytoskeleton [53]. In particular, two vertically separated layers of actin
networks were revealed in sheet-like cell protrusions (Fig. 7a). The two actin layers
exhibited highly distinct structural organizations: The dorsal layer appeared as a
consistently dense and homogeneous meshwork; the ventral layer typically formed
Fig. 7 STORM images of actin in sheet-like protrusions. (a) Dorsal (top) and ventral (middle)actin layers of a BS-C-1 cell. Bottom panel: Vertical cross section (500 nm wide in y) along the
dotted lines in the top and middle panels. (b) Dorsal (top) and ventral (middle) actin layers of a
COS-7 cell treated with blebbistatin, an inhibitor for myosin II. Bottom panel: Vertical crosssection (500 nm wide in y) along the dashed lines in the top and middle panels. Scale bars: 2 μm(horizontal), 100 nm (vertical). Figure adapted from reference [53]
K. Xu et al.
a web-like structure with a lower filament density and highly variable organization
(Fig. 7a). This striking structural difference between the ventral and dorsal actin
networks could be completely removed by inhibiting myosin II activity (Fig. 7b),
suggesting an important role of myosin II in maintaining the distinct structural
organization of the two actin networks.
8.2 Applications in Microbiology
In addition to eukaryotic cells, super-resolution fluorescence microscopy is also
becoming an important imaging tool for investigating bacteria. Due to the very
small volumes (~1 μm3) of prokaryotic cells, it is difficult to resolve the subcellu-
lar organization of bacteria using conventional fluorescence microscopy. Ultra-
structural studies have thus mostly relied on electron microscopy (EM). However,
it is often difficult to resolve molecule-specific structures in EM images due to
poor molecular contrast. Moreover, EM cannot be used to image live specimens
and monitor dynamics. Fluorescence imaging methods with molecule-specific
contrast and nanometer-scale resolution promise to change our view of bacterial
cell biology by revealing how proteins are organized in bacterial cells. For
example, clustered distribution of chemotaxis proteins, Tar receptor, CheY, and
CheW has been observed in fixed E. coli cells [112]. A helical organization of
MreB, an actin analog, has been observed in live Caulobacter crescentus [27].The DNA-partitioning proteins, ParA and ParB, form narrow, linear polymer
structures in Caulobacter crescentus, resembling mitotic spindles in eukaryotic
cells [113]. A major nucleoid-associated protein (NAP), H-NS, forms tight
clusters in the nucleoid in live E. coli cells, ~ 2 clusters per chromosome
(Fig. 8a) [114]. This clustered distribution, highly distinct from other major
NAPs (Fig. 8b), is formed due to the self-interactions between the N-terminal
domain of H-NS. As a global transcriptional silencer, H-NS sequester numerous
H-NS–regulated genes into these compact clusters (Fig. 8c), which serve as
organization centers to organize bacterial chromosome. Other bacterial proteins,
such as HU, IHF, FIS, StpA [114, 115], FtsZ [116], and SpoIIIE [117], have also
been investigated using super-resolution imaging.
8.3 Applications in Neurobiology
Another exciting area into which super-resolution imaging will likely bring new
breakthroughs is neurobiology. Neurons have complex, multi-scale morphologies.
Many important neuronal structures have dimensions on submicron or nanometer
scales. For example, axons in the neuropil can be as thin as 100 nm. Dendritic spine
necks are often narrower than 100 nm. Chemical synapses, the basic functional
units in the brain that mediate neurotransmitter-based communications between
Super-Resolution Imaging Through Stochastic Switching and Localization of. . .
neurons and their target cells, are typically several hundred nanometers in size.
Hence, both the investigations of sub-neuronal structures and the mapping of neural
connectivity in the brain require imaging tools with nanometer resolution. Indeed,
super-resolution fluorescence imaging has begun to provide new insights into
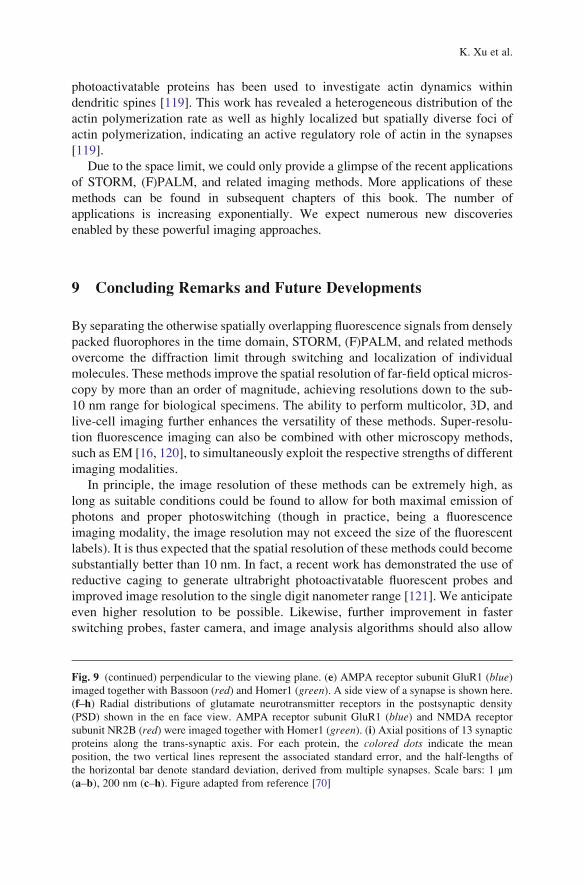
neuronal and sub-neuronal structures. For example, multicolor 3D super-resolution
imaging has been performed to determine the molecular distributions of ten protein
components of the presynaptic active zone and the postsynaptic density (Fig. 9)
[70]. This study has shown a laminar organization of the postsynaptic density
components, PSD-95, Shank, and Homer, consistent with previous EM analysis
[118] (Fig. 9i). It has also revealed a previously unknown, oriented organization of
the presynaptic scaffolding proteins, Bassoon and Piccolo (Fig. 9i). Significant
variations in the spatial distributions of neurotransmitter receptors have also been
observed from synapse to synapse (Fig. 9f–h). Moreover, quantitative receptor
composition analysis led to the discovery of a surprisingly large population of
immature synapses with activity-dependent plasticity in the adult accessory olfac-
tory bulb [70]. In a different study, high-density single-molecule tracking with
Fig. 8 STORM images of nucleoid-associated proteins in living E. coli cells. (a) H-NS forms
compact clusters in the nucleosome. Left panel: Bright-field image of the cells. Right panel: 3Dsuper-resolution image of H-NS fused with mEos2. The z-coordinates are color coded according to
the color bar (top). (b) HU is scattered through the nucleoid. Left panel: Bright-field image of the
cells. Right panel: 3D super-resolution image of HU fused with mEos2. (c) Colocalization of H-NS
clusters and gene loci revealed by two-color live-cell images of mEos2-labeled H-NS (magenta)and eYFP-labeled gene loci (green). The two H-NS–regulated loci, hdeA (left) and hchA (center),were colocalized with H-NS clusters to a noticeably larger extent than did lacZ (right), which is
not regulated by H-NS. Scale bars: 500 nm. Figure adapted from reference [114]
K. Xu et al.
Fig. 9 STORM images of synaptic proteins in brain tissues. (a–d) STORM imaging of pre-
and postsynaptic scaffolding proteins. Presynaptic protein Bassoon (red) and postsynaptic proteinHomer1 (green) in the mouse main olfactory bulb were immunolabeled with Cy3-Alexa 647 and
Alexa 405-Alexa 647 dye pairs. Partially overlapping puncta in a conventional image (a) were
clearly resolved as distinct synaptic structures in the corresponding STORM image (b). (c, d)
Well-separated elliptical disks of presynaptic scaffolds Bassoon (red) and postsynaptic scaffolds
Homer1 (green) are shown in two different orientations. (c) A side view with the trans-synaptic
axis rotated into the viewing plane. (d) An en face view with the trans-synaptic axis rotated
Super-Resolution Imaging Through Stochastic Switching and Localization of. . .
photoactivatable proteins has been used to investigate actin dynamics within
dendritic spines [119]. This work has revealed a heterogeneous distribution of the
actin polymerization rate as well as highly localized but spatially diverse foci of
actin polymerization, indicating an active regulatory role of actin in the synapses
[119].
Due to the space limit, we could only provide a glimpse of the recent applications
of STORM, (F)PALM, and related imaging methods. More applications of these
methods can be found in subsequent chapters of this book. The number of
applications is increasing exponentially. We expect numerous new discoveries
enabled by these powerful imaging approaches.
9 Concluding Remarks and Future Developments
By separating the otherwise spatially overlapping fluorescence signals from densely
packed fluorophores in the time domain, STORM, (F)PALM, and related methods
overcome the diffraction limit through switching and localization of individual
molecules. These methods improve the spatial resolution of far-field optical micros-
copy by more than an order of magnitude, achieving resolutions down to the sub-
10 nm range for biological specimens. The ability to perform multicolor, 3D, and
live-cell imaging further enhances the versatility of these methods. Super-resolu-
tion fluorescence imaging can also be combined with other microscopy methods,
such as EM [16, 120], to simultaneously exploit the respective strengths of different
imaging modalities.
In principle, the image resolution of these methods can be extremely high, as
long as suitable conditions could be found to allow for both maximal emission of
photons and proper photoswitching (though in practice, being a fluorescence
imaging modality, the image resolution may not exceed the size of the fluorescent
labels). It is thus expected that the spatial resolution of these methods could become
substantially better than 10 nm. In fact, a recent work has demonstrated the use of
reductive caging to generate ultrabright photoactivatable fluorescent probes and
improved image resolution to the single digit nanometer range [121]. We anticipate
even higher resolution to be possible. Likewise, further improvement in faster
switching probes, faster camera, and image analysis algorithms should also allow
Fig. 9 (continued) perpendicular to the viewing plane. (e) AMPA receptor subunit GluR1 (blue)imaged together with Bassoon (red) and Homer1 (green). A side view of a synapse is shown here.
(f–h) Radial distributions of glutamate neurotransmitter receptors in the postsynaptic density
(PSD) shown in the en face view. AMPA receptor subunit GluR1 (blue) and NMDA receptor
subunit NR2B (red) were imaged together with Homer1 (green). (i) Axial positions of 13 synapticproteins along the trans-synaptic axis. For each protein, the colored dots indicate the mean
position, the two vertical lines represent the associated standard error, and the half-lengths of
the horizontal bar denote standard deviation, derived from multiple synapses. Scale bars: 1 μm(a–b), 200 nm (c–h). Figure adapted from reference [70]
K. Xu et al.
imaging with time resolutions substantially faster than 1 s. Another important
frontier is in vivo imaging, which requires substantial improvement of the imaging
depth of these methods in scattering tissues.
Future development of these methods will require synergy between multiple
disciplines. On the optics and hardware front, careful design and/or calibration of
the imaging setup [6] could lead to extraordinarily high localization precision of
single molecules. Besides continued innovations in the detection paths [39, 53–57,
59, 61, 122], recent studies have shown that developments in the illumination paths
are also fruitful, especially for increasing imaging depth using multi-
photoactivation and sheet illumination [65, 67]. Advances in cameras (e.g., scien-
tific CMOS) [123, 124] could also be beneficial by improving the spatiotemporal
resolution and/or introducing new capabilities.
Meanwhile, developments in analysis algorithms and theoretical modeling, possi-
bly in combination with modifications to how the experimental data are acquired,
could continue to improve the performance of these super-resolution methods and
further broaden their range of application. For example, for improvement of spatial
resolution, maximum-likelihood fitting of single-molecule images to true PSFs has
led to more optimal localization results [125, 126]. For improvement of temporal
resolution, methods have been developed to analyze overlapped images of multiple
fluorophores simultaneously [30–33, 36–38] (see also discussion in Sects. 2 and 6.2).
On the chemistry and chemical biology side, the design and/or screening of
new photoswitchable probes [40, 84, 85, 127, 128] with superior brightness of
the fluorescent state (i.e., large number of photons per switching event), higher
contrast ratio between the fluorescent and dark state, lower on-off duty cycle,
faster switching speed, and more switching cycles would be tremendously
helpful not only for improving the spatial and temporal resolutions, but also
for prolonging the observation time window and expanding the color palette. To
this end, understanding the photoswitching mechanisms of the probes will be
very useful [128–131]. Novel stochastic readouts other than photoswitching
could further expand the palette of probes and the information content [28, 29,
132]. The development of new, live-cell-compatible labeling methods that can
achieve high molecular specificity and high labeling density with small label
sizes [98] would also contribute substantially to further improvement of imaging
qualities.
Combining the above efforts, we anticipate that true molecular-scale resolution
in living cells, tissues, and even living animals will be within reach some day. At
the other end of the spectrum, engineering efforts have packaged the imaging
system into a compact, easy-to-operate unit. Commercial, user-friendly, super-
resolution imaging systems are becoming available through multiple companies
[133, 134]. These systems could make the benefits of these imaging methods
accessible to all researchers, not just those who are comfortable with building
their own setups.
Acknowledgments We thank Hazen P. Babcock for help in manuscript preparation. This work is
supported in part by the National Institute of Health (to X.Z.). X.Z. is a Howard Hughes Medical
Institute investigator.
Super-Resolution Imaging Through Stochastic Switching and Localization of. . .
References
1. Guilford WH, Cheezum MK, Walker WF (2001) Quantitative comparison of algorithms for
tracking single fluorescent particles. Biophys J 81(4):2378–2388
2. Thompson RE, Larson DR, Webb WW (2002) Precise nanometer localization analysis for
individual fluorescent probes. Biophys J 82(5):2775–2783
3. Gelles J, Schnapp BJ, Sheetz MP (1988) Tracking kinesin-driven movements with
nanometre-scale precision. Nature 331(6155):450–453
4. Moerner WE, Orrit M (1999) Illuminating single molecules in condensed matter. Science
283(5408):1670–1676
5. Yildiz A, Forkey JN, McKinney SA, Ha T, Goldman YE, Selvin PR (2003) Myosin V walks
hand-over-hand: single fluorophore imaging with 1.5-nm localization. Science
300(5628):2061–2065
6. Pertsinidis A, Zhang YX, Chu S (2010) Subnanometre single-molecule localization, registra-
tion and distance measurements. Nature 466(7306):647–651
7. Betzig E (1995) Proposed method for molecular optical imaging. Opt Lett 20(3):237–239
8. Schmidt J, van Oijen AM, Kohler J, Muller M, Brakenhoff GJ (1998) 3-Dimensional super-
resolution by spectrally selective imaging. Chem Phys Lett 292(1–2):183–187
9. Lacoste TD, Michalet X, Pinaud F, Chemla DS, Alivisatos AP, Weiss S (2000) Ultrahigh-
resolution multicolor colocalization of single fluorescent probes. Proc Natl Acad Sci U S A
97(17):9461–9466
10. Churchman LS, Okten Z, Rock RS, Dawson JF, Spudich JA (2005) Single molecule high-
resolution colocalization of Cy3 and Cy5 attached to macromolecules measures intramolec-
ular distances through time. Proc Natl Acad Sci U S A 102(5):1419–1423
11. Gordon MP, Ha T, Selvin PR (2004) Single-molecule high-resolution imaging with
photobleaching. Proc Natl Acad Sci U S A 101(17):6462–6465
12. Qu XH, Wu D, Mets L, Scherer NF (2004) Nanometer-localized multiple single-molecule
fluorescence microscopy. Proc Natl Acad Sci U S A 101(31):11298–11303
13. Lidke KA, Rieger B, Jovin TM, Heintzmann R (2005) Superresolution by localization of
quantum dots using blinking statistics. Opt Express 13(18):7052–7062
14. Lagerholm BC, Averett L, Weinreb GE, Jacobson K, Thompson NL (2006) Analysis
method for measuring submicroscopic distances with blinking quantum dots. Biophys J
91(8):3050–3060
15. Rust MJ, Bates M, Zhuang XW (2006) Sub-diffraction-limit imaging by stochastic optical
reconstruction microscopy (STORM). Nat Methods 3(10):793–795
16. Betzig E, Patterson GH, Sougrat R, Lindwasser OW, Olenych S, Bonifacino JS, Davidson
MW, Lippincott-Schwartz J, Hess HF (2006) Imaging intracellular fluorescent proteins at
nanometer resolution. Science 313(5793):1642–1645
17. Hess ST, Girirajan TPK, Mason MD (2006) Ultra-high resolution imaging by fluorescence
photoactivation localization microscopy. Biophys J 91(11):4258–4272
18. Bates M, Huang B, Dempsey GT, Zhuang XW (2007) Multicolor super-resolution imaging
with photo-switchable fluorescent probes. Science 317(5845):1749–1753
19. Huang B, Babcock H, Zhuang XW (2010) Breaking the diffraction barrier: super-resolution
imaging of cells. Cell 143(7):1047–1058
20. Egner A, Geisler C, Von Middendorff C, Bock H, Wenzel D, Medda R, Andresen M, Stiel
AC, Jakobs S, Eggeling C, Schonle A, Hell SW (2007) Fluorescence nanoscopy in whole
cells by asynchronous localization of photoswitching emitters. Biophys J 93(9):3285–3290
21. Bock H, Geisler C, Wurm CA, Von Middendorff C, Jakobs S, Schonle A, Egner A, Hell SW,
Eggeling C (2007) Two-color far-field fluorescence nanoscopy based on photoswitchable
emitters. Appl Phys B-Lasers Opt 88(2):161–165
22. Folling J, Bossi M, Bock H, Medda R, Wurm CA, Hein B, Jakobs S, Eggeling C, Hell SW
(2008) Fluorescence nanoscopy by ground-state depletion and single-molecule return.
Nat Methods 5(11):943–945
K. Xu et al.
23. Heilemann M, van de Linde S, Schuttpelz M, Kasper R, Seefeldt B, Mukherjee A, Tinnefeld P,
Sauer M (2008) Subdiffraction-resolution fluorescence imaging with conventional fluorescent
probes. Angew Chem-Int Edit 47(33):6172–6176
24. Vogelsang J, Cordes T, Forthmann C, Steinhauer C, Tinnefeld P (2009) Controlling the
fluorescence of ordinary oxazine dyes for single-molecule switching and superresolution
microscopy. Proc Natl Acad Sci U S A 106(20):8107–8112
25. Lemmer P, Gunkel M, Weiland Y, Muller P, Baddeley D, Kaufmann R, Urich A, Eipel H,
Amberger R, Hausmann M, Cremer C (2009) Using conventional fluorescent markers for far-
field fluorescence localization nanoscopy allows resolution in the 10-nm range. J Microsc-
Oxf 235(2):163–171
26. Dickson RM, Cubitt AB, Tsien RY, Moerner WE (1997) On/off blinking and switching
behaviour of single molecules of green fluorescent protein. Nature 388(6640):355–358
27. Biteen JS, Thompson MA, Tselentis NK, Bowman GR, Shapiro L, Moerner WE (2008)
Super-resolution imaging in live Caulobacter crescentus cells using photoswitchable EYFP.
Nat Methods 5(11):947–949
28. Sharonov A, Hochstrasser RM (2006) Wide-field subdiffraction imaging by accumulated
binding of diffusing probes. Proc Natl Acad Sci U S A 103(50):18911–18916
29. Schwering M, Kiel A, Kurz A, Lymperopoulos K, Sprodefeld A, Kramer R, Herten DP
(2011) Far-field nanoscopy with reversible chemical reactions. Angew Chem-Int Edit
50(13):2940–2945
30. Holden SJ, Uphoff S, Kapanidis AN (2011) DAOSTORM: an algorithm for high-density
super-resolution microscopy. Nat Methods 8(4):279–280
31. Huang F, Schwartz SL, Byars JM, Lidke KA (2011) Simultaneous multiple-emitter fitting for
single molecule super-resolution imaging. Biomed Opt Express 2(5):1377–1393
32. Babcock H, Sigal Y, Zhuang X (2012) A high-density 3D localization algorithm for stochas-
tic optical reconstruction microscopy. Optical Nanoscopy 1(1):6
33. Zhu L, Zhang W, Elnatan D, Huang B (2012) Faster STORM using compressed sensing.
Nat Methods 9(7):721–723
34. Burnette DT, Sengupta P, Dai YH, Lippincott-Schwartz J, Kachar B (2011) Bleaching/
blinking assisted localization microscopy for superresolution imaging using standard fluores-
cent molecules. Proc Natl Acad Sci U S A 108(52):21081–21086
35. Simonson PD, Rothenberg E, Selvin PR (2011) Single-molecule-based super-resolution
images in the presence of multiple fluorophores. Nano Lett 11(11):5090–5096
36. Cox S, Rosten E, Monypenny J, Jovanovic-Talisman T, Burnette DT, Lippincott-Schwartz J,
Jones GE, Heintzmann R (2012) Bayesian localization microscopy reveals nanoscale
podosome dynamics. Nat Methods 9(2):195–200
37. Dertinger T, Colyer R, Iyer G, Weiss S, Enderlein J (2009) Fast, background-free, 3D
super-resolution optical fluctuation imaging (SOFI). Proc Natl Acad Sci U S A
106(52):22287–22292
38. Mukamel E, Babcock H, Zhuang X (2012) Statistical deconvolution for superresolution
fluorescence microscopy. Biophys J 102(10):2391–2400
39. Huang B, Wang WQ, Bates M, Zhuang XW (2008) Three-dimensional super-resolution
imaging by stochastic optical reconstruction microscopy. Science 319(5864):810–813
40. Dempsey GT, Vaughan JC, Chen KH, Bates M, Zhuang X (2011) Evaluation of fluorophores
for optimal performance in localization-based super-resolution imaging. Nat Methods
8(12):1027–1036
41. Jones SA, Shim SH, He J, Zhuang XW (2011) Fast, three-dimensional super-resolution
imaging of live cells. Nat Methods 8(6):499–505
42. Shroff H, Galbraith CG, Galbraith JA, Betzig E (2008) Live-cell photoactivated localization
microscopy of nanoscale adhesion dynamics. Nat Methods 5(5):417–423
43. Kao HP, Verkman AS (1994) Tracking of single fluorescent particles in three dimensions: use
of cylindrical optics to encode particle position. Biophys J 67(3):1291–1300
44. van Oijen AM, Kohler J, Schmidt J, Muller M, Brakenhoff GJ (1998) 3-Dimensional super-
resolution by spectrally selective imaging. Chem Phys Lett 292(1–2):183–187
Super-Resolution Imaging Through Stochastic Switching and Localization of. . .
45. Speidel M, Jonas A, Florin EL (2003) Three-dimensional tracking of fluorescent
nanoparticles with subnanometer precision by use of off-focus imaging. Opt Lett 28(2):69–71
46. Prabhat P, Ram S, Ward ES, Ober RJ (2006) Simultaneous imaging of several focal planes in
fluorescence microscopy for the study of cellular dynamics in 3D. Proc SPIE 6090:60900L
47. Holtzer L, Meckel T, Schmidt T (2007) Nanometric three-dimensional tracking of individual
quantum dots in cells. Appl Phys Lett 90(5):3
48. Toprak E, Balci H, Blehm BH, Selvin PR (2007) Three-dimensional particle tracking via
bifocal imaging. Nano Lett 7(7):2043–2045
49. Pavani SRP, Piestun R (2008) Three dimensional tracking of fluorescent microparticles using
a photon-limited double-helix response system. Opt Express 16(26):22048–22057
50. Braun D, Fromherz P (1998) Fluorescence interferometry of neuronal cell adhesion on
microstructured silicon. Phys Rev Lett 81(23):5241–5244
51. Bilenca A, Cao J, Colice M, Ozcan A, Bouma B, Raftery L, Tearney G (2008) Fluorescence
interferometry: principles and applications in biology. Ann N Y Acad Sci 1130(1):68–77
52. McMahon MD, Berglund AJ, Carmichael P, McClelland JJ, Liddle JA (2009) 3D particle
trajectories observed by orthogonal tracking microscopy. ACS Nano 3(3):609–614
53. Xu K, Babcock HP, Zhuang X (2012) Dual-objective STORM reveals three-dimensional
filament organization in the actin cytoskeleton. Nat Methods 9(2):185–188
54. Juette MF, Gould TJ, Lessard MD, Mlodzianoski MJ, Nagpure BS, Bennett BT, Hess ST,
Bewersdorf J (2008) Three-dimensional sub-100 nm resolution fluorescence microscopy of
thick samples. Nat Methods 5(6):527–529
55. Pavani SRP, Thompson MA, Biteen JS, Lord SJ, Liu N, Twieg RJ, Piestun R, Moerner
WE (2009) Three-dimensional, single-molecule fluorescence imaging beyond the diffrac-
tion limit by using a double-helix point spread function. Proc Natl Acad Sci U S A
106(9):2995–2999
56. Lew MD, Lee SF, Badieirostami M, Moerner WE (2011) Corkscrew point spread function
for far-field three-dimensional nanoscale localization of pointlike objects. Opt Lett
36(2):202–204
57. Shtengel G, Galbraith JA, Galbraith CG, Lippincott-Schwartz J, Gillette JM, Manley S,
Sougrat R, Waterman CM, Kanchanawong P, Davidson MW, Fetter RD, Hess HF (2009)
Interferometric fluorescent super-resolution microscopy resolves 3D cellular ultrastructure.
Proc Natl Acad Sci U S A 106(9):3125–3130
58. Von Middendorff C, Egner A, Geisler C, Hell S, Schonle A (2008) Isotropic 3D Nanoscopy
based on single emitter switching. Opt Express 16(25):20774–20788
59. Aquino D, Schonle A, Geisler C, von Middendorff C, Wurm CA, Okamura Y, Lang T, Hell
SW, Egner A (2011) Two-color nanoscopy of three-dimensional volumes by 4Pi detection of
stochastically switched fluorophores. Nat Methods 8(4):353–359
60. Lew MD, Lee SF, Ptacin JL, Lee MK, Twieg RJ, Shapiro L, Moerner WE (2011) Three-
dimensional superresolution colocalization of intracellular protein superstructures and the
cell surface in live Caulobacter crescentus. Proc Natl Acad Sci U S A 108(46):E1102–E1110
61. Tang JY, Akerboom J, Vaziri A, Looger LL, Shank CV (2010) Near-isotropic 3D
optical nanoscopy with photon-limited chromophores. Proc Natl Acad Sci U S A
107(22):10068–10073
62. Huang B, Jones SA, Brandenburg B, Zhuang XW (2008) Whole-cell 3D STORM reveals
interactions between cellular structures with nanometer-scale resolution. Nat Methods
5(12):1047–1052
63. Vaziri AVA, Tang JY, Shroff H, Shank CV (2008) Multilayer three-dimensional
super resolution imaging of thick biological samples. Proc Natl Acad Sci U S A
105(51):20221–20226
64. Folling J, Belov V, Kunetsky R, Medda R, Schonle A, Egner A, Eggeling C, Bossi M, Hell
SW (2007) Photochromic rhodamines provide nanoscopy with optical sectioning. Angew
Chem-Int Edit 46(33):6266–6270
K. Xu et al.
65. York AG, Ghitani A, Vaziri A, Davidson MW, Shroff H (2011) Confined activation and
subdiffractive localization enables whole-cell PALM with genetically expressed probes.
Nat Methods 8(4):327–333
66. Huisken J, Swoger J, Del Bene F,Wittbrodt J, Stelzer EH (2004) Optical sectioning deep inside
live embryos by selective plane illumination microscopy. Science 305(5686):1007–1009
67. Cella Zanacchi F, Lavagnino Z, Perrone Donnorso M, Del Bue A, Furia L, Faretta M, Diaspro
A (2011) Live-cell 3D super-resolution imaging in thick biological samples. Nat Methods
8(12):1047–1049
68. Zhuang XW (2009) Nano-imaging with STORM. Nat Photonics 3(7):365–367
69. Bates M, Dempsey GT, Chen KH, Zhuang X (2012) Multicolor super-resolution fluorescence
imaging via multi-parameter fluorophore detection. ChemPhysChem 13(1):99–107
70. Dani A, Huang B, Bergan J, Dulac C, Zhuang XW (2010) Superresolution imaging of
chemical synapses in the brain. Neuron 68(5):843–856
71. Shroff H, Galbraith CG, Galbraith JA, White H, Gillette J, Olenych S, Davidson MW, Betzig
E (2007) Dual-color superresolution imaging of genetically expressed probes within individ-
ual adhesion complexes. Proc Natl Acad Sci U S A 104(51):20308–20313
72. Andresen M, Stiel AC, Folling J, Wenzel D, Schonle A, Egner A, Eggeling C, Hell SW,
Jakobs S (2008) Photoswitchable fluorescent proteins enable monochromatic multilabel
imaging and dual color fluorescence nanoscopy. Nat Biotechnol 26(9):1035–1040
73. Subach FV, Patterson GH, Manley S, Gillette JM, Lippincott-Schwartz J, Verkhusha VV
(2009) Photoactivatable mCherry for high-resolution two-color fluorescence microscopy.
Nat Methods 6(2):153–159
74. Gunewardene MS, Subach FV, Gould TJ, Penoncello GP, Gudheti MV, Verkhusha VV, Hess
ST (2011) Superresolution imaging of multiple fluorescent proteins with highly overlapping
emission spectra in living cells. Biophys J 101(6):1522–1528
75. Bossi M, Folling J, Belov VN, Boyarskiy VP, Medda R, Egner A, Eggeling C, Schonle A,
Hell SW (2008) Multicolor far-field fluorescence nanoscopy through isolated detection of
distinct molecular species. Nano Lett 8(8):2463–2468
76. van de Linde S, Endesfelder U, Mukherjee A, Schuttpelz M, Wiebusch G, Wolter S,
Heilemann M, Sauer M (2009) Multicolor photoswitching microscopy for subdiffraction-
resolution fluorescence imaging. Photochem Photobiol Sci 8(4):465–469
77. Testa I, Wurm CA, Medda R, Rothermel E, von Middendorf C, Folling J, Jakobs S, Schonle
A, Hell SW, Eggeling C (2010) Multicolor fluorescence nanoscopy in fixed and living cells
by exciting conventional fluorophores with a single wavelength. Biophys J 99(8):2686–2694
78. Lubeck E, Cai L (2012) Single-cell systems biology by super-resolution imaging and
combinatorial labeling. Nat Methods 9(7):743–748
79. Hess ST, Gould TJ, Gudheti MV, Maas SA, Mills KD, Zimmerberg J (2007) Dynamic
clustered distribution of hemagglutinin resolved at 40 nm in living cell membranes
discriminates between raft theories. Proc Natl Acad Sci U S A 104(44):17370–17375
80. Gurskaya NG, Verkhusha VV, Shcheglov AS, Staroverov DB, Chepurnykh TV, Fradkov AF,
Lukyanov S, Lukyanov KA (2006) Engineering of a monomeric green-to-red photoactivatable
fluorescent protein induced by blue light. Nat Biotechnol 24(4):461–465
81. McKinney SA, Murphy CS, Hazelwood KL, Davidson MW, Looger LL (2009) A bright and
photostable photoconvertible fluorescent protein. Nat Methods 6(2):131–133
82. Subach FV, Patterson GH, Renz M, Lippincott-Schwartz J, Verkhusha VV (2010) Bright
monomeric photoactivatable red fluorescent protein for two-color super-resolution sptPALM
of live cells. J Am Chem Soc 132(18):6481–6491
83. Zhang MS, Chang H, Zhang YD, Yu JW, Wu LJ, Ji W, Chen JJ, Liu B, Lu JZ, Liu YF, Zhang
JL, Xu PY, Xu T (2012) Rational design of true monomeric and bright photoactivatable
fluorescent proteins. Nat Methods 9(7):727–729
84. Grotjohann T, Testa I, Leutenegger M, Bock H, Urban NT, Lavoie-Cardinal F, Willig KI,
Eggeling C, Jakobs S, Hell SW (2011) Diffraction-unlimited all-optical imaging and writing
with a photochromic GFP. Nature 478(7368):204–208
Super-Resolution Imaging Through Stochastic Switching and Localization of. . .
85. Brakemann T, Stiel AC, Weber G, Andresen M, Testa I, Grotjohann T, Leutenegger M,
Plessmann U, Urlaub H, Eggeling C, Wahl MC, Hell SW, Jakobs S (2011) A reversibly
photoswitchable GFP-like protein with fluorescence excitation decoupled from switching.
Nat Biotechnol 29(10):942–947
86. Wombacher R, Heidbreder M, van de Linde S, Sheetz MP, Heilemann M, Cornish VW, Sauer
M (2010) Live-cell super-resolution imaging with trimethoprim conjugates. Nat Methods
7(9):717–719
87. Lee HL, Lord SJ, Iwanaga S, Zhan K, Xie H, Williams JC, Wang H, Bowman GR, Goley ED,
Shapiro L, Twieg RJ, Rao J, Moerner WE (2010) Superresolution imaging of targeted
proteins in fixed and living cells using photoactivatable organic fluorophores. J Am Chem
Soc 132(43):15099–15101
88. Klein T, Loschberger A, Proppert S, Wolter S, van de Linde SV, Sauer M (2011) Live-cell
dSTORM with SNAP-tag fusion proteins. Nat Methods 8(1):7–9
89. Benke A, Manley S (2012) Live-Cell dSTORM of Cellular DNA Based on Direct DNA
Labeling. ChemBioChem 13(2):298–301
90. Shim S-H, Xia C, Zhong G, Babcock HP, Vaughan JC, Huang B, Wang X, Xu C, Bi G-Q,
Zhuang X (2012) Super-resolution fluorescence imaging of organelles in live cells with
photoswitchable membrane probes. Proc Nat Acad Sci U S A 109(35):13978–13983
91. Hell SW (2009) Microscopy and its focal switch. Nat Methods 6(1):24–32
92. Douglass AD, Vale RD (2005) Single-molecule microscopy reveals plasma membrane
microdomains created by protein-protein networks that exclude or trap signaling molecules
in T cells. Cell 121(6):937–950
93. Manley S, Gillette JM, Patterson GH, Shroff H, Hess HF, Betzig E, Lippincott-Schwartz J
(2008) High-density mapping of single-molecule trajectories with photoactivated localization
microscopy. Nat Methods 5(2):155–157
94. Giannone G, Hosy E, Levet F, Constals A, Schulze K, Sobolevsky AI, Rosconi MP, Gouaux
E, Tampe R, Choquet D, Cognet L (2010) Dynamic superresolution imaging of endogenous
proteins on living cells at ultra-high density. Biophys J 99(4):1303–1310
95. Sengupta P, Jovanovic-Talisman T, Skoko D, Renz M, Veatch SL, Lippincott-Schwartz J
(2011) Probing protein heterogeneity in the plasma membrane using PALM and pair correla-
tion analysis. Nat Methods 8(11):969–975
96. Subach OM, Patterson GH, Ting L-M, Wang Y, Condeelis JS, Verkhusha VV (2011) A
photoswitchable orange-to-far-red fluorescent protein, PSmOrange. Nat Methods
8(9):771–777
97. Goldman RD, Spector DL (2005) Live cell imaging: a laboratory manual. Cold Spring Harbor
Laboratory Press. Cold Spring Harbor, New York
98. Fernandez-Suarez M, Ting AY (2008) Fluorescent probes for super-resolution imaging in
living cells. Nat Rev Mol Cell Biol 9(12):929–943
99. Dellagiacoma C, Lukinavicius G, Bocchio N, Banala S, Geissbuhler S, Marki I, Johnsson K,
Lasser T (2010) Targeted photoswitchable probe for nanoscopy of biological structures.
ChemBioChem 11(10):1361–1363
100. Popp MW, Antos JM, Grotenbreg GM, Spooner E, Ploegh HL (2007) Sortagging: a versatile
method for protein labeling. Nat Chem Biol 3(11):707–708
101. Fernandez-Suarez M, Baruah H, Martinez-Hernandez L, Xie KT, Baskin JM, Bertozzi CR,
Ting AY (2007) Redirecting lipoic acid ligase for cell surface protein labeling with small-
molecule probes. Nat Biotechnol 25(12):1483–1487
102. Uttamapinant C, White KA, Baruah H, Thompson S, Fernandez-Suarez M, Puthenveetil S,
Ting AY (2010) A fluorophore ligase for site-specific protein labeling inside living cells. Proc
Natl Acad Sci U S A 107(24):10914–10919
103. Hoyer P, Staudt T, Engelhardt J, Hell SW (2011) Quantum dot blueing and blinking enables
fluorescence nanoscopy. Nano Lett 11(1):245–250
104. Bates M, Blosser TR, Zhuang XW (2005) Short-range spectroscopic ruler based on a single-
molecule optical switch. Phys Rev Lett 94(10):108101
K. Xu et al.
105. Conley NR, Biteen JS, Moerner WE (2008) Cy3-Cy5 covalent heterodimers for single-
molecule photoswitching. J Phys Chem B 112(38):11878–11880
106. Annibale P, Scarselli M, Kodiyan A, Radenovic A (2010) Photoactivatable fluorescent
protein mEos2 displays repeated photoactivation after a long-lived dark state in the red
photoconverted form. J Phys Chem Lett 1(9):1506–1510
107. Endesfelder U, Malkusch S, Flottmann B, Mondry J, Liguzinski P, Verveer PJ, Heilemann M
(2011) Chemically induced photoswitching of fluorescent probes-a general concept for super-
resolution microscopy. Molecules 16(4):3106–3118
108. Annibale P, Vanni S, Scarselli M, Rothlisberger U, Radenovic A (2011) Quantitative photo
activated localization microscopy: unraveling the effects of photoblinking. PLoS One 6(7):
e22678
109. Lando D, Endesfelder U, Berger H, Subramanian L, Dunne PD, McColl J, Klenerman D, Carr
AM, Sauer M, Allshire RC, Heilemann M, Laue ED (2012) Quantitative single-molecule
microscopy reveals that CENP-ACnp1 deposition occurs during G2 in fission yeast. Open Biol
2:120078
110. Wiedenmann J, Ivanchenko S, Oswald F, Schmitt F, Rocker C, Salih A, Spindler KD,
Nienhaus GU (2004) EosFP, a fluorescent marker protein with UV-inducible green-to-red
fluorescence conversion. Proc Natl Acad Sci U S A 101(45):15905–15910
111. Wu M, Huang B, Graham M, Raimondi A, Heuser JE, Zhuang XW, De Camilli P (2010)
Coupling between clathrin-dependent endocytic budding and F-BAR-dependent tubulation in
a cell-free system. Nat Cell Biol 12(9):902–908
112. Greenfield D, McEvoy AL, Shroff H, Crooks GE, Wingreen NS, Betzig E, Liphardt J (2009)
Self-organization of the Escherichia coli chemotaxis network imaged with super-resolution
light microscopy. PLoS Biol 7(6):e1000137
113. Ptacin JL, Lee SF, Garner EC, Toro E, Eckart M, Comolli LR, Moerner W, Shapiro L (2010)
A spindle-like apparatus guides bacterial chromosome segregation. Nat Cell Biol
12(8):791–798
114. Wang WQ, Li GW, Chen CY, Xie XS, Zhuang XW (2011) Chromosome organization by a
nucleoid-associated protein in live bacteria. Science 333(6048):1445–1449
115. Lee SF, Thompson MA, Schwartz MA, Shapiro L, Moerner WE (2011) Super-resolution
imaging of the nucleoid-associated protein HU in Caulobacter crescentus. Biophys J 100(7):L31–33
116. Fu G, Huang T, Buss J, Coltharp C, Hensel Z, Xiao J (2010) In vivo structure of the E. coliFtsZ-ring revealed by photoactivated localization microscopy (PALM). PLoS One 5(9):
e12682
117. Fleming TC, Shin JY, Lee SH, Becker E, Huang KC, Bustamante C, Pogliano K (2010)
Dynamic SpoIIIE assembly mediates septal membrane fission during Bacillus subtilis sporu-lation. Genes Dev 24(11):1160–1172
118. Valtschanoff JG, Weinberg RJ (2001) Laminar organization of the NMDA receptor complex
within the postsynaptic density. J Neurosci 21(4):1211–1217
119. Frost NA, Shroff H, Kong HH, Betzig E, Blanpied TA (2010) Single-molecule discrimination
of discrete perisynaptic and distributed sites of actin filament assembly within dendritic
spines. Neuron 67(1):86–99
120. Watanabe S, Punge A, Hollopeter G, Willig KI, Hobson RJ, Davis MW, Hell SW, Jorgensen
EM (2011) Protein localization in electron micrographs using fluorescence nanoscopy.
Nat Methods 8(1):80–84
121. Vaughan JC, Jia S, Zhuang XW (2012) Ultrabright photoactivatable fluorophores created by
reductive caging. Nat Methods 9(12):1181–1184
122. Izeddin I, El Beheiry M, Andilla J, Ciepielewski D, Darzacq X, Dahan M (2012) PSF shaping
using adaptive optics for three-dimensional single-molecule super-resolution imaging and
tracking. Opt Express 20(5):4957–4967
123. Baker M (2011) Faster frames, clearer pictures. Nat Methods 8(12):1005–1009
Super-Resolution Imaging Through Stochastic Switching and Localization of. . .
124. Huang ZL, Zhu H, Long F, Ma H, Qin L, Liu Y, Ding J, Zhang Z, Luo Q, Zeng S (2011)
Localization-based super-resolution microscopy with an sCMOS camera. Opt Express
19(20):19156–19168
125. Smith CS, Joseph N, Rieger B, Lidke KA (2010) Fast, single-molecule localization that
achieves theoretically minimum uncertainty. Nat Methods 7(5):373–375
126. Mortensen KI, Churchman LS, Spudich JA, Flyvbjerg H (2010) Optimized localization
analysis for single-molecule tracking and super-resolution microscopy. Nat Methods
7(5):377–381
127. Lippincott-Schwartz J, Patterson GH (2009) Photoactivatable fluorescent proteins for diffrac-
tion-limited and super-resolution imaging. Trends Cell Biol 19(11):555–565
128. Vogelsang J, Steinhauer C, Forthmann C, Stein IH, Person-Skegro B, Cordes T, Tinnefeld P
(2010) Make them blink: probes for super-resolution microscopy. ChemPhysChem
11(12):2475–2490
129. Dempsey GT, BatesM, KowtoniukWE, Liu DR, Tsien RY, Zhuang XW (2009) Photoswitching
mechanism of cyanine dyes. J Am Chem Soc 131(51):18192–18193
130. Kottke T, van de Linde S, Sauer M, Kakorin S, Heilemann M (2010) Identification of the
product of photoswitching of an oxazine fluorophore using Fourier transform infrared
difference spectroscopy. J Phys Chem Lett 1(21):3156–3159
131. van de Linde S, Krstic I, Prisner T, Doose S, Heilemann M, Sauer M (2011) Photoinduced
formation of reversible dye radicals and their impact on super-resolution imaging. Photochem
Photobiol Sci 10(4):499–506
132. Roeffaers MBJ, De Cremer G, Libeert J, Ameloot R, Dedecker P, Bons AJ, Buckins M,
Martens JA, Sels BF, De Vos DE, Hofkens J (2009) Super-resolution reactivity mapping of
nanostructured catalyst particles. Angew Chem-Int Edit 48(49):9285–9289
133. Chi KR (2009) Microscopy: Ever-increasing resolution. Nature 462(7273):675–678
134. Baker M (2011) Bright light, better labels. Nature 478(7367):137–142
K. Xu et al.


![Option Pricing Under a Discrete-Time Markov Switching ... · arXiv:2006.15054v1 [q-fin.PR] 26 Jun 2020 Option Pricing Under a Discrete-Time Markov Switching Stochastic Volatility](https://img.pdfslide.us/doc/110x75/5fc5bcca12dd631bfe463aea/option-pricing-under-a-discrete-time-markov-switching-arxiv200615054v1-q-finpr.jpg)
![The Synthesis and Analysis of Stochastic Switching Circuits switching circuits 2012.pdf · arXiv:1209.0715v1 [cs.IT] 4 Sep 2012 1 The Synthesis and Analysis of Stochastic Switching](https://img.pdfslide.us/doc/110x75/5f9ef73753e4451ac83eff37/the-synthesis-and-analysis-of-stochastic-switching-circuits-switching-circuits-2012pdf.jpg)