Embed Size (px)
DESCRIPTION
oleoresiin
Citation preview

Journal of Food Engineering 65 (2004) 55–66
www.elsevier.com/locate/jfoodeng
Supercritical carbon dioxide extraction of redpepper (Capsicum annuum L.) oleoresin
Edgar Uquiche a,*, Jos�e M. del Valle b, Jaime Ortiz c
a Department of Chemical Engineering, Universidad de La Frontera, P.O. Box 54-D, Temuco, Chileb Department of Chemical and Bioprocess Engineering, Pontificia Universidad Cat�olica de Chile, P.O. Box 306, Santiago, Chile
c Department of Food Science and Chemical Technology, Universidad de Chile, P.O. Box 233, Santiago, Chile
Received 18 July 2003; accepted 8 December 2003
Abstract
The extraction kinetics of red pepper oleoresin with supercritical carbon dioxide (SC-CO2) at 40 �C from a pelletized substratewas evaluated as a function of crushed-pellet particle size (Dp ¼ 0:273–3:90 mm), superficial solvent velocity (Us ¼ 0:57–1:25 mm/s),and extraction pressure (320–540 bar). Batch productivity increased with substrate pelletization, which caused a 4-time increase in
apparent density. Microscopy was utilized to characterize the microstructure of the pelletized substrate. Fractal analysis of binary
images and mercury porosimetry allowed an estimation of pellet porosity and tortuosity, which in turn allowed an independent
estimation of effective diffusivity. Solute partition between the solid matrix and SC-CO2 ðKÞ was estimated from the initial slope ofcumulative plots of oleoresin yield versus specific solvent mass, and did not depend on Dp and Us. Yield of oleoresins and carotenoidpigments increased, and K decreased as the extraction pressure increased. A linear driving force approximation was used to modelexperimental data, and discrepancies between model predictions and experimental data points with large particles were explained.
� 2003 Elsevier Ltd. All rights reserved.
Keywords: Effective diffusivity; Extraction; Fractal analysis; Microstructure; Oleoresin; Pelletization; Red pepper; Supercritical CO2
1. Introduction
There is a worldwide growing interest in the applica-
tion of natural colorants for food products, and red
pepper (Capsicum annuum L.) or paprika has been used
since ancient times as a colorant to enhance or change
food color. Carotenoids are one of the most important
groups of natural colorants, and paprika oleoresin is an
important natural source of these pigments (Jar�en-Gal�an, Nienaber, & Schwartz, 1999). The main consti-tuents of the carotenoid fraction are capsanthin and
capsorubin (Weissenberg, Schaeffler, Menagem, Barzilai,
& Levy, 1997), which are almost exclusive to the genus
Capsicum and are responsible for the final red color.
Supercritical fluid (SCF) extraction has received
increasing attention in a variety of industries, because
SCFs can provide high solubility, improved mass-
transfer rates, and increased selectivity with small
*Corresponding author: Tel.: +56-2-3544986; fax: +56-2-3545803.
E-mail address: [email protected] (E. Uquiche).
0260-8774/$ - see front matter � 2003 Elsevier Ltd. All rights reserved.doi:10.1016/j.jfoodeng.2003.12.003
changes in process temperature and pressure (Brunner,
1994). Carbon dioxide (CO2) is probably the mostwidely used SCF. Advantages include inertness, non-
toxicity, non-flammability, non-explosiveness, and
availability with high purity at low cost (del Valle &
Aguilera, 1999; Lang & Wai, 2001). Furthermore, rela-
tively low critical properties make CO2 (Tc ¼ 304:1 K,pc ¼ 73:8 bar) an ideal solvent for the extraction ofthermally labile components such as carotenoids.
Various investigators have studied the extraction ofpaprika oleoresin with supercritical CO2 (SC-CO2), and
concluded that extraction yields increase pronouncedly
as the extraction pressure increases. Jar�en-Gal�an et al.(1999) established that the fraction of carotenoid pig-
ments in the oleoresin increased 3 times as a result of an
increase in pressure from 137.8 to 413.4 bar. Further-
more, pigments isolated at low pressure (137.8 bar)
consisted almost exclusively of b-carotene, while pig-ments isolated at a higher pressure (413.4 bar) contained
greater proportions of capsorubin and capsanthin.
Gnayfeed, Daood, Ill�es, and Biacs (2001) confirmed thatthe solubility of paprika pigments in SC-CO2 and their
Nomenclature
ap specific surface area of particle (m�1)
Bi dimensionless Biot number (–)
Cf solute concentration in the SCF phase
(kg/m3)
Cf0 solute concentration in the SCF phase at thebeginning of the experiment (kg/m3)
Cfs solute concentration in the SCF phase at
particle surface (kg/m3)
Cs average solute concentration in the solid
phase (kg/m3)
Cs0 solute concentration in the solid phase at the
beginning of the experiment (kg/m)
d spectral dimension in fractal analysis (–)dp pore diameter (lm)De effective diffusivity of solute in the solid ma-
trix (m/s2)
Dm mass fractal dimension (–)
Dp average particle size of solid substrate
(mm)
D12 binary diffusion coefficient of solute in SC-
CO2 (m2/s)
F factor that accounts for solute–solid interac-
tions in Eq. (7) (–)
H height of the packed bed (m)
J mass of solute transferred from the solid to
the SCF phase per unit volume of the bed
(kg/s/m3)
kf external solid-SCF mass transfer coefficient
(m/s)kp overall mass transfer coefficient (m/s)
K solute partition coefficient between the solid
matrix and SCF phase (–)
m size of square box in fractal analysis (pixel)
n number of random walks conducted through
the pore space in fractal analysis (–)
pc critical pressure of SC-CO2 (73.8 bar)
rc characteristic diameter of the image in Eq. (1)(mm)
r1 length minimal of solid image that can be
approximated by fractal analysis in Eq. (1)
(mm)
R particle radius (m)
Sn number of distinct sites visited in a random
walk in fractal analysis (–)
t extraction time (s)T process temperature (K)
Tc critical temperature of SC-CO2 (304.1 K)
Tr reduced temperature of SC-CO2 (–)
Us superficial velocity of SCF in the packed bed
(m/s)
Vc2 critical volume of the solute (cm3/mol)
z distance from the entrance of the SCF along
the packed bed (m)
Greek letters
e void fraction in the bed (–)
ep void fraction in solid particles (–)
k ratio of solute size to pore diameter (–)
l viscosity of SC-CO2 (kg/m/s)q density of SC-CO2 (kg/m
3)
qb apparent density of the packed bed (kg/m3)
qc critical density of CO2 (468 kg/m3)
qr reduced density of CO2 (–)
s pellet tortuosity (–)
56 E. Uquiche et al. / Journal of Food Engineering 65 (2004) 55–66
recovery increased pronouncedly when pressure in-
creased from 100–200 to 400 bar (both at 40 �C). Daoodet al. (2002) expanded the conclusions of Gnayfeed et al.
(2001) for the 35–55 �C temperature range, and reporteda 5-time increase in recovery of carotenoid pigments as a
result of an increase in pressure from 100 to 400 bar.Ambrogi, Cardarelli, and Eggers (2002) also confirmed
an improvement in extraction kinetics of carotenoid
pigments from paprika with an increase in process
pressure (300–500 bar), and reported a solubility of 7.5 g
oleoresin/kg CO2 at 60 �C and 300 bar.SCF extraction processes for solid substrates such as
milled red pepper are unfortunately limited to batch
operation due to the requirement of high process pres-sures. An alternative to overcome this limitation is
compacting the raw material so as to increase the load of
substrate in the extractor (del Valle & Aguilera, 1989;
del Valle, Jim�enez, Napolitano, Zetzl, & Brunner, 2003).
The densification of vegetable substrates by pelletization
results in a new microstructure due to the rearrange-
ment, fracture and/or plastic deformation of the con-
stituent particles which progressively occupy void spaces
(Stanley-Wood, 1990). Additionally, cell walls and other
barriers to mass transfer within the substrate are de-stroyed by high shearing forces during pelletization
(Aguilera & Stanley, 1999). Although mass transfer
rates may decrease as a result of substrate densification,
this reduction would be partially overcome by the
excellent transport properties of SC-CO2. Therefore,
there exists great interest in relating the extractability of
a pelletized substrate with its microstructural charac-
teristics. del Valle, Jim�enez, and de la Fuente (2003)investigated the SC-CO2 extraction of Jalape~no pepperoleoresin, and suggested that solute was homogeneously
distributed following a multistage pre-treatment con-
sisting of fine grinding, high pressure pelletization, and
E. Uquiche et al. / Journal of Food Engineering 65 (2004) 55–66 57
particle size reduction. However, no microstructuralevidence was included for this claim.
Most porous materials are heterogeneous, irregulars,
and difficult to describe using Euclidean geometry.
Several investigations have demonstrated the potential
of fractal concepts to quantify heterogeneous and
irregular forms in nature in general, and food materials
in particular (Pedreschi, Aguilera, & Brown, 2000;
Quevedo, L�opez, Aguilera, & Cadoche, 2002). Themotion of a dissolved solute through a porous matrix is
constrained by the heterogeneity and tortuosity of the
network. There exist fractal dimensions, which are de-
fined in Section 2.2, which allow a quantitative charac-
terization of microstructural features of a porous solid
that are relevant for internal mass transfer.
The objective of the present work was to evaluate and
model the effect of particle size, solvent flow rate, andpressure on the extraction rate and yield of oleoresin
from pre-pelletized red pepper using SC-CO2. As part of
our work we propose a methodology based on micros-
copy, image analysis and other physical tests to quanti-
tatively characterize the microstructure of the porous
substrate, and to relate it to the effective diffusivity of the
solute in the solid matrix.
2. Materials and methods
2.1. Substrate for extraction
Commercial flakes of red pepper (Invertec Foods,
Rengo, Chile) with a moisture content of 4% w/w (d.b.)
were used as the substrate. The material was ground in ahammer mill (M2 Assa, Assa Tecnolog�ıa S.A., Santiago,Chile) with 5-mm openings, and pelletized in a labora-
tory pellet mill (California Pellet Mill, Crawfordsville,
IN) with 3.5-mm openings. Pellets were grinded in the
hammer mill and size-classified in four fractions for
further analysis: )5/+6 mesh Tyler (3:46 mm <Dp < 4:00 mm); )6/+14 mesh Tyler (1:19 mm < Dp <3:46 mm); )14/+35 mesh Tyler (0:420 mm < Dp < 1:19mm); and )35/+100 mesh Tyler (0:149 mm < Dp <0:420mm). Samples were packaged in polyethylene bags and
stored in a refrigerator (5 �C) up to analysis.
2.2. Substrate characterization
Pellet apparent density ðqbÞ in a packed bed wasdetermined gravimetrically (weighing the material loa-
ded in a 1-dm3 graduated cylinder) using a standard
tapping procedure.
Bed porosity ðeÞ of packed beds was estimated
according to procedure of Lozano, Rotstein, and Ur-bicain (1980) by measuring qb and the apparent densityof finely milled material (weighing the tightly packed
powder in a 10-cm3 graduated cylinder).
Particle porosity ðepÞ was measured by mercuryporosimetry in a Micromeritics Pore Sizer 9420 Auto-
pore III (Micromeritics Instrument Corp., Norcross,
GA). Tests required 5-cm3 samples per replicate. The
data was acquired using WIN 9400 Series V2.00 soft-
ware from the same company.
Scanning electron microscopy (SEM) was done
according to del Valle, Jim�enez, Napolitano et al.
(2003). Samples of fresh red pepper tissue and dehy-drated flakes were fixed using a mixture of formalin,
acetic acid and aqueous ethanol, and then dehydrated
by immersion in a series of aqueous ethanol solutions.
Pellets, on the other hand, were manually and axially
pulled from each end until fracture to analyze the ex-
posed surface. All samples were dried for 3 h using a
critical point dryer technique in a Sorvall 49300 unit
(Sorvall Products, Newtown, CT), and then coated with15 nm of gold-palladium in a Pelco 91000 sputter coater
(Polaron Equipment Ltd., Uckfield, UK). Prepared
samples were observed in a Jeol JSM 25 S II scanning
electron microscope (Jeol Ltd., Akishima, Japan) oper-
ated at an accelerating voltage of 30 kV.
Light microscopy was done according to del Valle and
Uquiche (2002). Fresh samples, dehydrated flakes and
pellets were fixed according to aforementioned proce-dure. Samples were embedded with paraffin prior to
cutting thin slices (30-lm thick) using a manual micro-tome (Jung, Heidelberg, Germany). Paraffin was re-
moved by treating samples with xylol and the staining
was done with safranine and fast green. The images were
obtained bymeans of an Olympus BX50 light microscope
(Tokio, Japan), equipped with a JVC TK-1280E video
camera (Yokohama, Japan) utilizing Studio DC10 plussoftware (Pinnacle System Inc., Braunschweig, Ger-
many), and saved in format bitmap (*.bmp). The original
size of all captured images was the same (1.6 · 1.2 mm2).Fractal analysis was done on binary light microscopy
images according to Anderson, McBratney, and Fitz-
Patrick (1996) to determine fractal parameters Dm andd, which are used to describe the heterogeneity of theporous space, and the connectedness of a network ofpores, respectively. Since an image in gray level scale can
be considered as a 2-dimensional surface (Talukar &
Acharya, 1995), the quantification method is based on
fractal image texture analysis, which consists on mea-
suring the space distribution of the brightness (Liao,
Cavalieri, & Pitts, 1990) using a box-counting method
(Conci & Proenc�a, 1997). Parameter Dm was measuredby filling the pore space (sectors in white in binaryimages) with progressively smaller boxes (called pore m-pixels). A pore m-pixel is an m by m square that is fullycontained in the pore area. The size of m begins at 1
pixel and increases to a maximum of 500 pixels, and
the number of pore m-pixels was counted in each case.Value Dm was estimated as the negative slope of a plot ofln [number of pore m-pixels] versus ln½m�.
58 E. Uquiche et al. / Journal of Food Engineering 65 (2004) 55–66
Parameter d, on the other hand, is determined on thebasis of the number of random walks conducted
through the pore space. The number of distinct sites
visited ðSnÞ, is determined with caution to eliminate therepeated sites. Value d is estimated as double the slopeof a plot of ln½Sn� versus ln½n�, where n represents thenumber of necessary stages to complete the path
(Anderson et al., 1996).
Pellet tortuosity ðsÞ was determined as a function ofDm and d using the expression proposed by Anderson,Crawford, and McBratney (2000):
lnðsÞ ¼ 2ðDm � dÞd
�þ Dm � 2
�ln
rcr1
� �ð1Þ
where r1 represents the smallest solid image that can beapproximated by fractal analysis, and rc is the charac-teristic diameter of the image.
2.3. Supercritical extraction
SCF extraction experiments were carried out
according to del Valle, Jim�enez, and de la Fuente (2003),by using a Thar Technologies’ (Pittsburgh, PA) SFE-1L
process development unit. Extraction experiments were
performed using food grade (99.8% pure) CO2 (AGAS.A., Santiago, Chile). Extraction vessels (20-mm
internal diameter, 50-cm3 capacity) were placed in a
convection oven that kept the loaded SC-CO2 phase at a
constant extraction temperature of 40 �C. Depending onthe particle size, 25–30 g of pelletized substrate sample
was loaded in the extractor. Between 12 and 14 extract
aliquots were periodically collected in pre-weighed glass
vials (15-cm3 capacity), and the recovered extract wasassessed gravimetrically by difference with cleaned and
dried vials. In order to remove water from extract
samples, vials were dried in an oven (Binder WTC,
Tutlingen, Germany) set at 70 �C prior to weighing. Tostudy the effect of average particle diameter (Dp ¼ 0:273,0.689, 2.92, or 3.90 mm), extractions were conducted at
a pressure of 320 bar using a superficial solvent velocity
ðUsÞ of 0.92 mm/s. The effect of Us (0.57, 0.92 or 1.25mm/s) was studied at 320 bar using Dp ¼ 0:689 mm.Finally, the effect of treatment pressure (320, 430, or 540
bar) was studied for Dp ¼ 0:689 mm and Us � 0:90 mm/s. All extraction experiments were performed in dupli-
cate.
2.4. Analysis
Moisture content was determined gravimetrically by
drying in the oven (Binder WTC, Tutlingen, Germany)
at 105 �C for �15 h to reach a final constant weight.Untreated and spent samples were finely ground with a
mortar and pestle prior to analysis of moisture and
oleoresin content.
Oleoresin content of untreated and spent pellet sam-ples was determined gravimetrically by extraction with
technical grade hexane (TCL, Santiago, Chile) to
exhaustion in a Soxhlet apparatus. Hexane was mostly
recovered in a Fisatom (Sao Paulo, Brasil) rotary
evaporator that was operated with a Gast (Gast Man-
ufacturing Inc., Carlstadt, NJ) vacuum pump, and
residual solvent traces were removed in the oven (�2 hat 80 �C).
Total carotenoid pigment content in oleoresin samples
was determined using the spectrophotometric method of
Jar�en-Gal�an et al. (1999). The extracted oleoresin wasdissolved in acetone p.a. (TCL, Santiago, Chile) and
absorbance measurements were performed at 460 nm in
a Shimadzu UV-160 spectrophotometer (Shimadzu
Corp., Kyoto, Japan). Pigment concentration was esti-
mated by using the extinction coefficient in acetone ofcapsanthin (E1% ¼ 2300), the most important carotenoidpigment in red pepper, and the results were expressed in
g carotenoid pigment/kg oleoresin.
Individual carotenoids pigments were quantified using
the isocratic high performance liquid chromatography
(HPLC) method of M�ınguez-Mosquera and Hornero-M�endez (1993). Extracted oleoresin samples were dis-solved in 25 cm3 of hexane p.a. (Merck, Darmstadt,Germany), and a 5-cm3 aliquot was saponified by
addition of methanolic 10% (w/v) KOH solution
(Merck, Darmstadt, Germany). After 12 h at room
temperature, the saponified pigments were washed
repeatedly with water to neutral conditions (pH¼ 7),and filtered through a layer of anhydrous Na2SO4(Sigma Chemical Co., Saint Louis, MO). The solvent
was evaporated to dryness and the pigments were re-dissolved in 1 cm3 of HPLC grade acetone (Merck,
Darmstadt, Germany). This solution was passed
through a filter media with 0.22-lm openings (Millipore,Bedford, MA) prior to injection into the HPLC system.
The chromatograph consisted of a Merck-Hitachi’s
(Hitachi Ltd., Tokyo, Japan) L-6200A pump, and a
computer-controlled Waters 996 photodiode array
detector with software Millennium 32 both from Waters(Milford, MA). The separation was performed using a
Symmetry reversed-phase C-18 column (Waters Corp.,
Milford, MA). A 60:25:15 (v/v) mixture of HPLC grade
acetonitrile, methanol and hexane all from Merck
(Darmstadt, Germany) was used as the mobile phase at
a flow rate of 1 cm3/min. A calibration curve was made
using red pepper pigment standards obtained by thin
layer chromatography (TLC) as indicated in next sec-tion.
2.5. Standards for HPLC analysis
Red pepper carotenoid pigments were isolated using
the method of M�ınguez-Mosquera and Hornero-
M�endez (1993). A 10-g sample of red peppers was sliced
E. Uquiche et al. / Journal of Food Engineering 65 (2004) 55–66 59
and extracted with 30 cm3 of acetone p.a. (Merck,Darmstadt, Germany). Following 2 h in the dark, the
extract was filtered through a layer of anhydrous
Na2SO4 (Sigma Chemical Co., Saint Louis, MO) with
addition of acetone until exhaustion of all color. The
organic phase was evaporated to dryness in a B€uchi R-205 rotary evaporator (B€uchi Labortechnik AG, Zurich,Switzerland) at 40 �C. Pigments were collected in 5 cm3of cyclohexane p.a. (Merck, Darmstadt, Germany), anda 1-cm3 aliquot of the cyclohexane solution was frac-
tionated by TLC using 20 · 20 cm2 plates with a 0.7-mmthickness layer of silica gel 60 F254 (Merck, Darmstadt,
Germany). A 93:3:2:2 mixture of HPLC grade hexane-
ethyl acetate-ethanol-acetone all from Merck (Darms-
tadt, Germany) was used as the separation eluent. Sev-
eral bands appeared on the TLC plates which were
identified according to their chromatographic behavioras capsorubin (red–brown band), capsanthin (intense
red band), capsanthin 5,6 epoxide (red band), zeaxan-
thin (yellow–orange band), cryptocapsin (pale red
band), b-cryptoxanthin (yellow band), and b-carotene(yellow–orange band). Each component was scraped
from the plate and dissolved in 50 cm3 of ethanol. The
concentration of each solution was determined spec-
trophotometrically (ATI Unicam UV/Vis V3, Cam-bridge, UK) using corresponding values of molar
extinction coefficients. Finally standard solutions were
injected to the HPLC system to identify the retention
time and concentration–absorbance relationship for
each pigment.
Table 1
Physical properties of the vegetable substrate
Average particle
diameter (Dp, mm)Apparent density
(qb, kg/m3)
Bed porosity ðe;�Þ
Flakes 155 0.84
0.273 499 0.48
0.689 518 0.46
2.92 591 0.39
3.90 601 0.38
2.6. Mathematical model
The extraction of packed substrate beds using SCFs
can be modeled by integrating differential mass balances
for a section of the fixed bed constituted by vegetableparticles assumed to be spherical in shape (radius R) (delValle, Napolitano, & Fuentes, 2000). A mass transfer
hypothesis that has been widely applied in literature
considers a linear driving force (LDF) approximation,
which is equivalent to assuming a parabolic profile of
residual solute in the solid matrix (Peker, Srinivasan,
Smith, & McCoy, 1992). Using this assumption, intra-
particle diffusion ðDeÞ and external mass transfer ðkfÞeffects can be combined in an overall mass transfer
coefficient ðkpÞ, defined as:
kp ¼5Dekf
5De þ Rkfð2Þ
A derivation and discussion of the LDF model are
provided by Peker et al. (1992). The differential mass
balance equations for the SCF in the void spaces of the
bed (Eq. (3)) and the solid substrate particles (Eq. (4))
were
oCfot
þ UsoCfoz
¼ 1� ee
J ð3Þ
oCsot
¼ �J ð4Þ
where
J ¼ 3kpR
1
KCs
�� Cf
�ð5aÞ
K ¼ CsCfs
ð5bÞ
The initial and border conditions for Eqs. (3) and (4)were
Cfðz; 0Þ ¼ Cf0 ð06 z6HÞ ð6aÞCfð0; tÞ ¼ 0 ðtP 0Þ ð6bÞCsðz; 0Þ ¼ Cs0 ð06 z6HÞ ð6cÞThese equations were numerically solved using a
fourth-order Runge–Kutta method implemented in
MATLAB 5.3 (Math Works, Natick, MA). A constant
partition ðKÞ for the solute between the solid matrix andSC-CO2 was used that depended only on extraction
pressure. De was estimated as a function of the binarydiffusion coefficient ðD12Þ of a relevant solute in SC-CO2,which depends only on extraction temperature and
pressure, and microstructural features of the solid ma-
trix. Values of kf were estimated using the correlation ofTan, Liang, and Liou (1988) for packed beds operating
with SCFs.
3. Results and discussion
3.1. Characterization of the substrate
Table 1 summarizes values of apparent density ðqbÞand porosity ðeÞ for a packed bed as a function of par-ticle size ðDpÞ. It is clear that as the size of fracturedpellets increases the substrate load of an extraction
vessel may increase up to �20% when comparing 0.273-and 3.90-mm diameter particles. This increase in load
density may partially compensate the decrease in mass
transfer rates that was mentioned in the Introduction
and that will be discussed below, so as to allow an in-crease in volumetric yield (mass of recovered extract, per
60 E. Uquiche et al. / Journal of Food Engineering 65 (2004) 55–66
unit time, and unit volume of extraction vessel) withlarge, dense pellets. It is relevant to indicate that the
apparent density of commercial flakes was just 155 kg/
m3, which underlines the importance of pelletization as a
sample pre-treatment to increase the load density by a
factor of �4. For the calculation of e an experimentalvalue of 970 kg/m3 for the density of the solid was used.
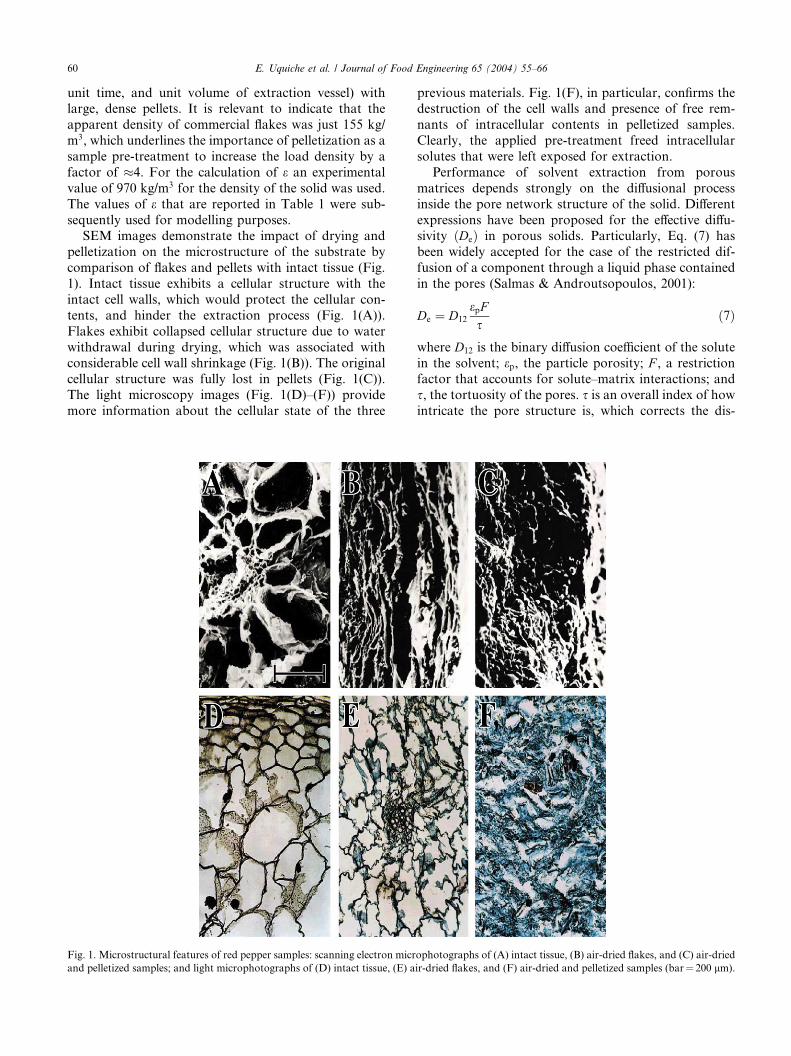
The values of e that are reported in Table 1 were sub-sequently used for modelling purposes.SEM images demonstrate the impact of drying and
pelletization on the microstructure of the substrate by
comparison of flakes and pellets with intact tissue (Fig.
1). Intact tissue exhibits a cellular structure with the
intact cell walls, which would protect the cellular con-
tents, and hinder the extraction process (Fig. 1(A)).
Flakes exhibit collapsed cellular structure due to water
withdrawal during drying, which was associated withconsiderable cell wall shrinkage (Fig. 1(B)). The original
cellular structure was fully lost in pellets (Fig. 1(C)).
The light microscopy images (Fig. 1(D)–(F)) provide
more information about the cellular state of the three
Fig. 1. Microstructural features of red pepper samples: scanning electron micr
and pelletized samples; and light microphotographs of (D) intact tissue, (E) a
previous materials. Fig. 1(F), in particular, confirms thedestruction of the cell walls and presence of free rem-
nants of intracellular contents in pelletized samples.
Clearly, the applied pre-treatment freed intracellular
solutes that were left exposed for extraction.
Performance of solvent extraction from porous
matrices depends strongly on the diffusional process
inside the pore network structure of the solid. Different
expressions have been proposed for the effective diffu-sivity ðDeÞ in porous solids. Particularly, Eq. (7) hasbeen widely accepted for the case of the restricted dif-
fusion of a component through a liquid phase contained
in the pores (Salmas & Androutsopoulos, 2001):
De ¼ D12epFs
ð7Þ
where D12 is the binary diffusion coefficient of the solutein the solvent; ep, the particle porosity; F , a restrictionfactor that accounts for solute–matrix interactions; and
s, the tortuosity of the pores. s is an overall index of howintricate the pore structure is, which corrects the dis-
ophotographs of (A) intact tissue, (B) air-dried flakes, and (C) air-dried
ir-dried flakes, and (F) air-dried and pelletized samples (bar¼ 200 lm).
E. Uquiche et al. / Journal of Food Engineering 65 (2004) 55–66 61
tance travelled by the solute considering its sinuous pathalong the pore network. F is less than unity, and de-pends on the ratio k of solute size to pore diameter(F ! 1 when k is sufficiently small) (Salmas & And-
routsopoulos, 2001).
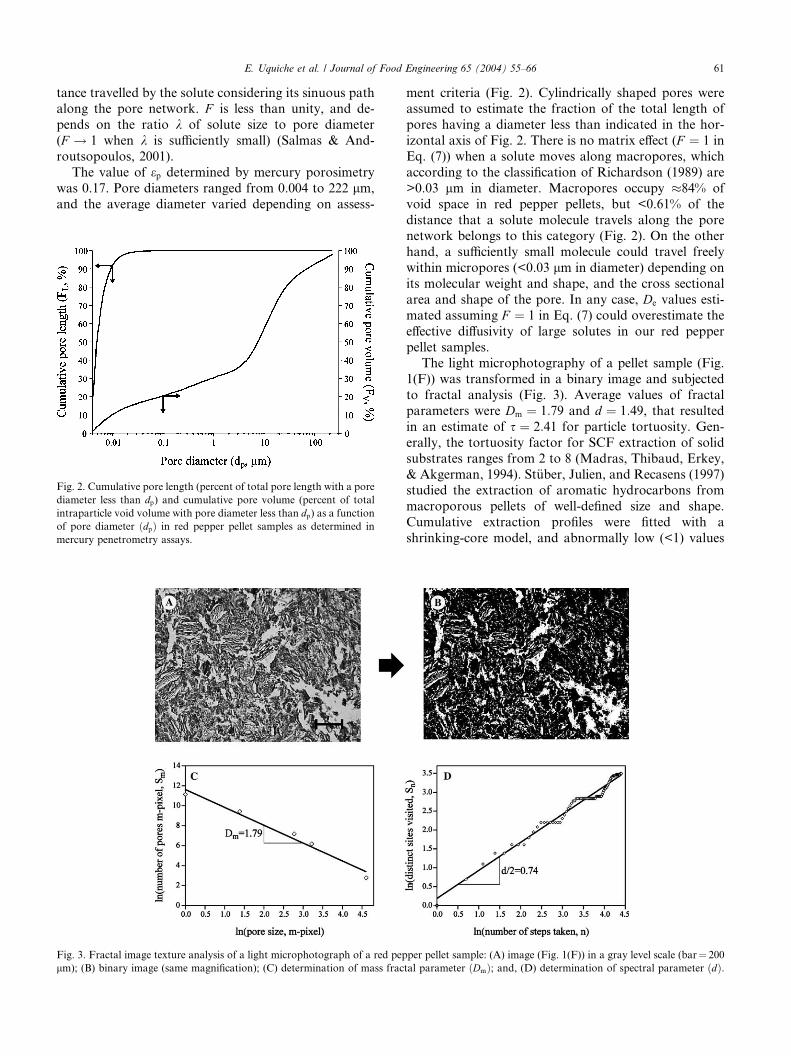
The value of ep determined by mercury porosimetrywas 0.17. Pore diameters ranged from 0.004 to 222 lm,and the average diameter varied depending on assess-
Fig. 2. Cumulative pore length (percent of total pore length with a pore
diameter less than dp) and cumulative pore volume (percent of totalintraparticle void volume with pore diameter less than dp) as a functionof pore diameter ðdpÞ in red pepper pellet samples as determined inmercury penetrometry assays.
Fig. 3. Fractal image texture analysis of a light microphotograph of a red pep
lm); (B) binary image (same magnification); (C) determination of mass frac
ment criteria (Fig. 2). Cylindrically shaped pores wereassumed to estimate the fraction of the total length of
pores having a diameter less than indicated in the hor-
izontal axis of Fig. 2. There is no matrix effect (F ¼ 1 inEq. (7)) when a solute moves along macropores, which
according to the classification of Richardson (1989) are
>0.03 lm in diameter. Macropores occupy �84% of
void space in red pepper pellets, but <0.61% of the
distance that a solute molecule travels along the porenetwork belongs to this category (Fig. 2). On the other
hand, a sufficiently small molecule could travel freely
within micropores (<0.03 lm in diameter) depending onits molecular weight and shape, and the cross sectional
area and shape of the pore. In any case, De values esti-mated assuming F ¼ 1 in Eq. (7) could overestimate theeffective diffusivity of large solutes in our red pepper
pellet samples.The light microphotography of a pellet sample (Fig.
1(F)) was transformed in a binary image and subjected
to fractal analysis (Fig. 3). Average values of fractal
parameters were Dm ¼ 1:79 and d ¼ 1:49, that resultedin an estimate of s ¼ 2:41 for particle tortuosity. Gen-erally, the tortuosity factor for SCF extraction of solid
substrates ranges from 2 to 8 (Madras, Thibaud, Erkey,
& Akgerman, 1994). St€uber, Julien, and Recasens (1997)studied the extraction of aromatic hydrocarbons from
macroporous pellets of well-defined size and shape.
Cumulative extraction profiles were fitted with a
shrinking-core model, and abnormally low (<1) values
per pellet sample: (A) image (Fig. 1(F)) in a gray level scale (bar¼ 200tal parameter ðDmÞ; and, (D) determination of spectral parameter ðdÞ.

62 E. Uquiche et al. / Journal of Food Engineering 65 (2004) 55–66
of s were estimated from best-fit values of De. The au-thors suggested that a surface diffusion phenomenon,
which was not accounted for in their mass transfer
model, could contribute to solute transport in macrop-
ores filled with a SCF. These observations are similar to
those of Chou, Wong, and Tan (1997). Thus, low tor-
tuosity values are common for porous matrices treated
with SCFs.
Fig. 4. Cumulative extraction yield of pre-pelletized red peppers as a
function of the specific solvent mass using SC-CO2 at 40 �C. (A) Effectof average particle size (p ¼ 320 bar, Us ¼ 0:92 mm/s) for: ( )
Dp ¼ 0:273 mm; ( ) Dp ¼ 0:689 mm; ( ) Dp ¼ 2:92 mm;and, ( ) Dp ¼ 3:90 mm. (B) Effect of superficial solvent velocity(p ¼ 320 bar, Dp ¼ 0:689 mm) for: ( ) Us ¼ 0:57 mm/s;
( ) Us ¼ 0:92 mm/s; and, ( ) Us ¼ 1:25 mm/s. (C) Effectof process pressure (Dp ¼ 0:689 mm) for: ( ) p ¼ 320 bar(Us ¼ 0:92 mm/s); ( ) p ¼ 430 bar (Us ¼ 0:90 mm/s); and,( ) p ¼ 540 bar (Us ¼ 0:87 mm/s). (Open symbols¼ experi-mental data points for replicate 1; dot centered symbols¼ ibid. repli-cate 2.)
3.2. Supercritical extraction
Fig. 4(A) shows the effects of sample particle size ðDpÞon the cumulative extraction yields of red pepper oleo-
resin (g oleoresin/kg substrate) as a function of the
specific solvent mass (kg CO2/kg substrate). We ob-
served that as Dp increases the extraction rate decreasesso that 1 kg SC-CO2 at 40 �C and 320 bar dissolved 6.5,4.5, 2.1 and 0.80 g of red pepper oleoresin from 0.273-,0.689-, 2.92- and 3.90-mm diameter particles, respec-
tively. These results could be explained by an increase in
the resistance to mass transfer due to an increase in the
diffusion path within solid particles and a reduction in
the area for mass transfer. When spherical particle
geometry is assumed, the specific surface area ––ap, totalparticle surface per unit volume––increases from 750 to
10,990 m�1 as Dp decreases from 3.90 to 0.273 mm. Thisway, the net effect of an increase in particle size from
0.273 mm ðBi ¼ 19Þ to 3.90 mm ðBi ¼ 170Þ was a shift inthe controlling resistance from external solid-SCF mass
transfer to intraparticle diffusion.
Fig. 4(B) shows the results of cumulative extraction
yield as a function of the specific solvent mass for
experiments performed using different superficial solvent
velocities ðUsÞ. Extraction curves for different values ofUs were superimposed initially, which indicates thatexternal mass transfer phenomena did not affect
extraction rates. It is suggested that solute partition
between the solid and SCF controls the initial stages of
the extraction process, and the common initial slope of
the plot defines the apparent solubility of red pepper
oleoresin in SC-CO2 at 40 �C and 320 bar.Fig. 4(C) shows the effect of process pressure on
cumulative extraction yields as a function of the specific
solvent mass. Extraction yields increased with an in-
crease in pressure from 320 to 540 bar. This significant
effect of process pressure on extraction rate could be due
to the increase in solubility of red pepper oleoresin in
general, and carotenoid pigments in particular, as the
solvent power of SC-CO2 increases (Ambrogi et al.,
2002; Daood et al., 2002; Gnayfeed et al., 2001; Jar�en-Gal�an et al., 1999). This increase in solubility wouldobviously result in a larger driving force for mass
transfer at high pressure (430–540 bar) than lower
pressure (320 bar).
Red pepper oleoresins are constituted of a mixture of
light (e.g., fatty oils) and heavy components (e.g., pig-
ments) (Jar�en-Gal�an et al., 1999; Vesper & Nitz, 1997).The total yield would depend on how much of these twofractions are extracted. The extraction of heavy com-
ponents would be expected to be small at 320 bar be-
cause of limited solubility at low pressure. An increment
in process pressure to 540 bar would result in an in-
creased solvent power for heavy components. Based on
the experimental data and models of G�omez-Prieto,Caja, and Santa-Mar�ıa (2002), the solubility of b-caro-
E. Uquiche et al. / Journal of Food Engineering 65 (2004) 55–66 63
tene in SC-CO2 at 40 �C can be estimated as 1.2 mg/kgat 320 bar and 1.9 mg/kg at 540 bar, respectively. Cor-
responding solubility values for lycopene (red caroten-
oid pigment in tomato) can be estimated as 1.4 and
2.6 mg pigment/kg CO2 at 320 and 540 bar, respectively.
These estimated values suggest an important increase in
solubility within our experimental region, but are much
smaller than apparent solubilities of red pepper oleore-
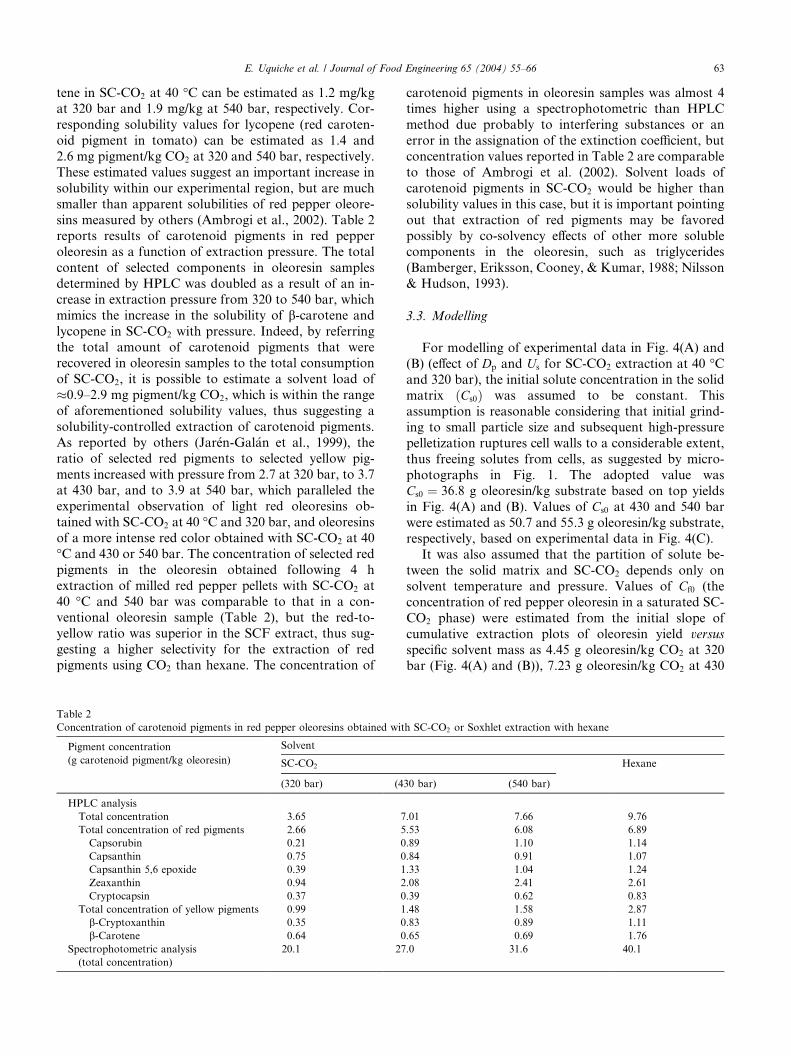
sins measured by others (Ambrogi et al., 2002). Table 2reports results of carotenoid pigments in red pepper
oleoresin as a function of extraction pressure. The total
content of selected components in oleoresin samples
determined by HPLC was doubled as a result of an in-
crease in extraction pressure from 320 to 540 bar, which
mimics the increase in the solubility of b-carotene andlycopene in SC-CO2 with pressure. Indeed, by referring
the total amount of carotenoid pigments that wererecovered in oleoresin samples to the total consumption
of SC-CO2, it is possible to estimate a solvent load of
�0.9–2.9 mg pigment/kg CO2, which is within the rangeof aforementioned solubility values, thus suggesting a
solubility-controlled extraction of carotenoid pigments.
As reported by others (Jar�en-Gal�an et al., 1999), theratio of selected red pigments to selected yellow pig-
ments increased with pressure from 2.7 at 320 bar, to 3.7at 430 bar, and to 3.9 at 540 bar, which paralleled the
experimental observation of light red oleoresins ob-
tained with SC-CO2 at 40 �C and 320 bar, and oleoresinsof a more intense red color obtained with SC-CO2 at 40
�C and 430 or 540 bar. The concentration of selected redpigments in the oleoresin obtained following 4 h
extraction of milled red pepper pellets with SC-CO2 at
40 �C and 540 bar was comparable to that in a con-ventional oleoresin sample (Table 2), but the red-to-
yellow ratio was superior in the SCF extract, thus sug-
gesting a higher selectivity for the extraction of red
pigments using CO2 than hexane. The concentration of
Table 2
Concentration of carotenoid pigments in red pepper oleoresins obtained wit
Pigment concentration
(g carotenoid pigment/kg oleoresin)
Solvent
SC-CO2
(320 bar) (4
HPLC analysis
Total concentration 3.65 7
Total concentration of red pigments 2.66 5
Capsorubin 0.21 0
Capsanthin 0.75 0
Capsanthin 5,6 epoxide 0.39 1
Zeaxanthin 0.94 2
Cryptocapsin 0.37 0
Total concentration of yellow pigments 0.99 1
b-Cryptoxanthin 0.35 0
b-Carotene 0.64 0
Spectrophotometric analysis
(total concentration)
20.1 27
carotenoid pigments in oleoresin samples was almost 4times higher using a spectrophotometric than HPLC
method due probably to interfering substances or an
error in the assignation of the extinction coefficient, but
concentration values reported in Table 2 are comparable
to those of Ambrogi et al. (2002). Solvent loads of
carotenoid pigments in SC-CO2 would be higher than
solubility values in this case, but it is important pointing
out that extraction of red pigments may be favoredpossibly by co-solvency effects of other more soluble
components in the oleoresin, such as triglycerides
(Bamberger, Eriksson, Cooney, & Kumar, 1988; Nilsson
& Hudson, 1993).
3.3. Modelling
For modelling of experimental data in Fig. 4(A) and
(B) (effect of Dp and Us for SC-CO2 extraction at 40 �Cand 320 bar), the initial solute concentration in the solid
matrix ðCs0Þ was assumed to be constant. Thisassumption is reasonable considering that initial grind-
ing to small particle size and subsequent high-pressure
pelletization ruptures cell walls to a considerable extent,
thus freeing solutes from cells, as suggested by micro-
photographs in Fig. 1. The adopted value was
Cs0 ¼ 36:8 g oleoresin/kg substrate based on top yieldsin Fig. 4(A) and (B). Values of Cs0 at 430 and 540 barwere estimated as 50.7 and 55.3 g oleoresin/kg substrate,respectively, based on experimental data in Fig. 4(C).
It was also assumed that the partition of solute be-
tween the solid matrix and SC-CO2 depends only on
solvent temperature and pressure. Values of Cf0 (theconcentration of red pepper oleoresin in a saturated SC-
CO2 phase) were estimated from the initial slope of
cumulative extraction plots of oleoresin yield versus
specific solvent mass as 4.45 g oleoresin/kg CO2 at 320bar (Fig. 4(A) and (B)), 7.23 g oleoresin/kg CO2 at 430
h SC-CO2 or Soxhlet extraction with hexane
Hexane
30 bar) (540 bar)
.01 7.66 9.76
.53 6.08 6.89
.89 1.10 1.14
.84 0.91 1.07
.33 1.04 1.24
.08 2.41 2.61
.39 0.62 0.83
.48 1.58 2.87
.83 0.89 1.11
.65 0.69 1.76
.0 31.6 40.1
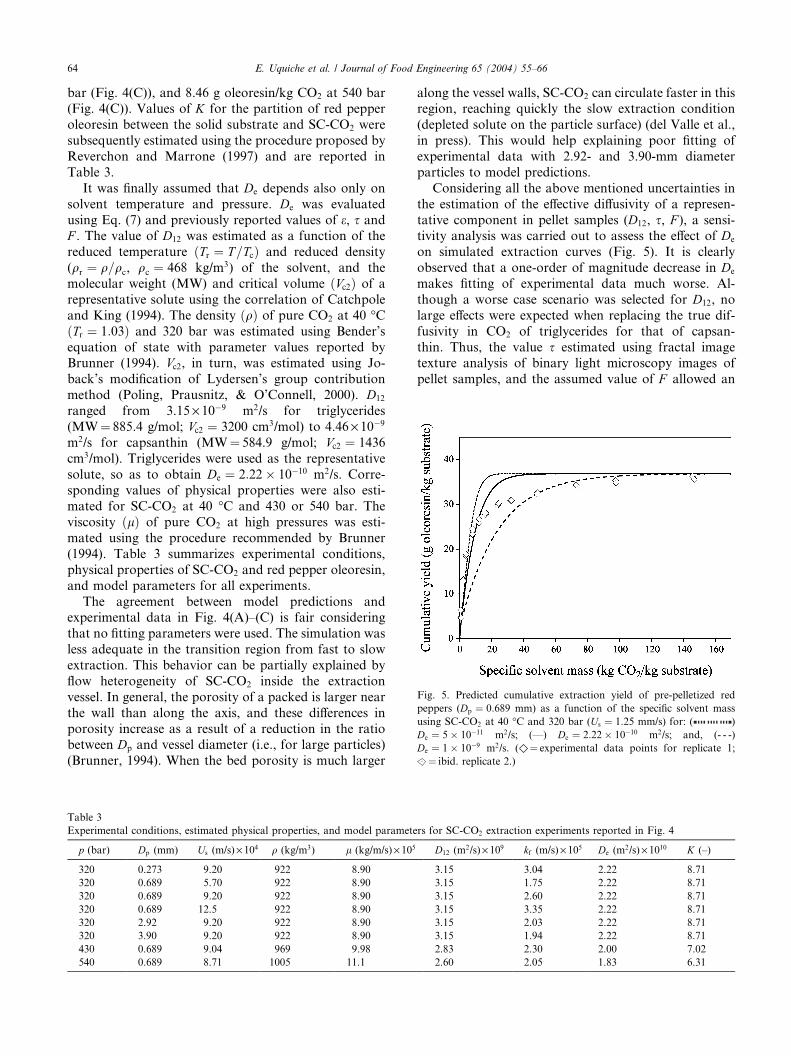
Fig. 5. Predicted cumulative extraction yield of pre-pelletized red
peppers (Dp ¼ 0:689 mm) as a function of the specific solvent massusing SC-CO2 at 40 �C and 320 bar (Us ¼ 1:25 mm/s) for: ( )
De ¼ 5 10�11 m2/s; (––) De ¼ 2:22 10�10 m2/s; and, (- - -)
De ¼ 1 10�9 m2/s. ( ¼ experimental data points for replicate 1;¼ ibid. replicate 2.)
64 E. Uquiche et al. / Journal of Food Engineering 65 (2004) 55–66
bar (Fig. 4(C)), and 8.46 g oleoresin/kg CO2 at 540 bar(Fig. 4(C)). Values of K for the partition of red pepperoleoresin between the solid substrate and SC-CO2 were
subsequently estimated using the procedure proposed by
Reverchon and Marrone (1997) and are reported in
Table 3.
It was finally assumed that De depends also only onsolvent temperature and pressure. De was evaluatedusing Eq. (7) and previously reported values of e, s andF . The value of D12 was estimated as a function of thereduced temperature ðTr ¼ T=TcÞ and reduced density(qr ¼ q=qc, qc ¼ 468 kg/m3) of the solvent, and themolecular weight (MW) and critical volume ðVc2Þ of arepresentative solute using the correlation of Catchpole
and King (1994). The density ðqÞ of pure CO2 at 40 �CðTr ¼ 1:03Þ and 320 bar was estimated using Bender’sequation of state with parameter values reported byBrunner (1994). Vc2, in turn, was estimated using Jo-back’s modification of Lydersen’s group contribution
method (Poling, Prausnitz, & O’Connell, 2000). D12ranged from 3.15 · 10�9 m2/s for triglycerides
(MW¼ 885.4 g/mol; Vc2 ¼ 3200 cm3/mol) to 4.46 · 10�9m2/s for capsanthin (MW¼ 584.9 g/mol; Vc2 ¼ 1436cm3/mol). Triglycerides were used as the representative
solute, so as to obtain De ¼ 2:22 10�10 m2/s. Corre-sponding values of physical properties were also esti-
mated for SC-CO2 at 40 �C and 430 or 540 bar. Theviscosity ðlÞ of pure CO2 at high pressures was esti-mated using the procedure recommended by Brunner
(1994). Table 3 summarizes experimental conditions,
physical properties of SC-CO2 and red pepper oleoresin,
and model parameters for all experiments.
The agreement between model predictions andexperimental data in Fig. 4(A)–(C) is fair considering
that no fitting parameters were used. The simulation was
less adequate in the transition region from fast to slow
extraction. This behavior can be partially explained by
flow heterogeneity of SC-CO2 inside the extraction
vessel. In general, the porosity of a packed is larger near
the wall than along the axis, and these differences in
porosity increase as a result of a reduction in the ratiobetween Dp and vessel diameter (i.e., for large particles)(Brunner, 1994). When the bed porosity is much larger
Table 3
Experimental conditions, estimated physical properties, and model paramete
p (bar) Dp (mm) Us (m/s)· 104 q (kg/m3) l (kg/m/s)· 105
320 0.273 9.20 922 8.90
320 0.689 5.70 922 8.90
320 0.689 9.20 922 8.90
320 0.689 12.5 922 8.90
320 2.92 9.20 922 8.90
320 3.90 9.20 922 8.90
430 0.689 9.04 969 9.98
540 0.689 8.71 1005 11.1
along the vessel walls, SC-CO2 can circulate faster in thisregion, reaching quickly the slow extraction condition
(depleted solute on the particle surface) (del Valle et al.,
in press). This would help explaining poor fitting of
experimental data with 2.92- and 3.90-mm diameter
particles to model predictions.
Considering all the above mentioned uncertainties in
the estimation of the effective diffusivity of a represen-
tative component in pellet samples (D12, s, F ), a sensi-tivity analysis was carried out to assess the effect of Deon simulated extraction curves (Fig. 5). It is clearly
observed that a one-order of magnitude decrease in Demakes fitting of experimental data much worse. Al-
though a worse case scenario was selected for D12, nolarge effects were expected when replacing the true dif-
fusivity in CO2 of triglycerides for that of capsan-
thin. Thus, the value s estimated using fractal imagetexture analysis of binary light microscopy images of
pellet samples, and the assumed value of F allowed an
rs for SC-CO2 extraction experiments reported in Fig. 4
D12 (m2/s)· 109 kf (m/s)· 105 De (m2/s) · 1010 K (–)
3.15 3.04 2.22 8.71
3.15 1.75 2.22 8.71
3.15 2.60 2.22 8.71
3.15 3.35 2.22 8.71
3.15 2.03 2.22 8.71
3.15 1.94 2.22 8.71
2.83 2.30 2.00 7.02
2.60 2.05 1.83 6.31

E. Uquiche et al. / Journal of Food Engineering 65 (2004) 55–66 65
independent estimation of De of the correct order ofmagnitude.
Although a chief advantage of the LDF approxima-
tion is that the mathematical model is drastically sim-
plified, the applicability of the proposed model is
however limited by the accuracy of the approximation
for solute concentration gradients in the solid. Errors
become large in the initial stages of the extraction pro-
cess (Do & Rice, 1986). For extraction processes, theLDF model provides good approximations to exact
solutions if dimensionless Biot number ðBi ¼ kfR=DeÞ issmaller than 100 (Goto, Smith, & McCoy, 1990). Bigives the relative importance of intraparticle diffusion
and external solid-SCF mass transfer (Goto, Roy, &
Hirose, 1996) and in our experiments Bi ¼ 19 forDp ¼ 0:273 mm, Bi ¼ 40 for Dp ¼ 0:689 mm, Bi ¼ 134for Dp ¼ 2:92 mm, and Bi ¼ 170 for Dp ¼ 3:90 mm. Thissuggest that the LDF approximation was not appro-
priate for the two largest particle size fractions that were
assessed in the present studies, which would be com-
pounded with the previously mentioned flow heteroge-
neity effect in making the proposed mathematical model
inadequate for some experimental data.
4. Conclusions
It was possible to produce a 4-time increment from
155 to 601 kg/m3 in the load density of a packed bed for
red pepper flakes by applying a pelletization treatment.
Subsequent size reduction of the pellets by milling im-proves mass transfer, but at the expense of a reduction
in apparent density. The interaction of the two factors
should be assessed to establish an optimal particle size
for maximal volumetric yield. However, it is common
practice to use whole pellets for improved SC-CO2 flow
(without channelling) through packed beds of solid
substrates in industrial-size extraction vessels (Quirin,
K.-W., Flavex Naturextrakte GmbH, Rehlingen, Ger-many, 2000. Personal communication).
The present work demonstrates that it is possible to
estimate an order of magnitude for De in the extractionof a solute from a pelletized substrate with SC-CO2, by
using mercury porosimetry, and fractal image texture
analysis of binary light microscopy images of the pellets.
This type of microstructure–extractability relationship
would allow an independent optimization of substratepre-treatments in the development of SCF extraction
processes for solid food materials.
Acknowledgements
The present work was financed by Fondecyt (Project
103-0735). We thank Mr. Francisco Lathrop (Invertec
Foods, Santiago, Chile) for kind provision of red pepper
flake samples, Mr. Luis Gonz�alez (Department of Veg-etal Sciences, PUC, Santiago, Chile) for light micros-
copy studies, Dr. Roberto Quevedo (Universidad de Los
Lagos, Osorno, Chile) for writing the computer program
for fractal image texture analysis, Prof. Gerd Brunner
(Technische Universit€at Hamburg-Harburg, Harburg,Germany) for funding of mercury porosimetry mea-
surements, and Mr. Jerry Wisser (Thar Technologies
Inc., Pittsburgh, PA) for technical support with SCFextraction experiments.
References
Aguilera, J. M., & Stanley, D. W. (1999).Microstructural principles of
food processing and engineering (2nd ed.). Gaithersburg, MD:
Aspen Publishers Inc.
Ambrogi, A., Cardarelli, D. A., & Eggers, R. (2002). Fractional
extraction of paprika using supercritical carbon dioxide and on-line
determination of carotenoids. Journal of Food Science, 67, 3236–
3241.
Anderson, A. N., Crawford, J. W., & McBratney, A. B. (2000). On
diffusion in fractal soil structures. Soil Science Society of America
Journal, 64, 19–24.
Anderson, A. N., McBratney, A. B., & FitzPatrick, E. A. (1996). Soil
mass, surface and spectral fractal dimensions estimated from thin
section photographs. Soil Science Society of America Journal, 60,
962–969.
Bamberger, T., Eriksson, J. C., Cooney, C. L., & Kumar, S. K. (1988).
Measurement and model prediction of solubilities of pure fatty
acids, pure triglycerides, and mixtures of triglycerides in supercrit-
ical carbon dioxide. Journal of Chemical Engineering Data, 33, 327–
333.
Brunner, G. (1994). Gas extraction. An introduction to fundamentals
of supercritical fluids and the application to separation processes.
New York, NY: Springer.
Catchpole, O. J., & King, M. B. (1994). Measurement and correlation
of binaiy diffusion coefficients in near critical fluids. Industrial &
Engineering Chemistry Research, 33, 1828–1837.
Chou, S. H., Wong, D. S. H., & Tan, C. S. (1997). Adsorption and
diffusion of benzene in activated carbon at high pressures.
Industrial & Engineering Chemistry Research, 36, 5501–5506.
Conci, A., & Proenc�a, C. B. (1997). A box-counting approach to colorsegmentation. IEEE Transactions on Pattern Analytical Machine
Intelligence, 19, 228–230.
Daood, H. G., Ill�es, V., Gnayfeed, M. H., M�esz�aros, B., Horv�ath, G.,
& Biacs, P. A. (2002). Extraction of pungent spice paprika by
supercritical carbon dioxide and subcritical propane. The Journal
of Supercritical Fluids, 23, 143–152.
del Valle, J. M., & Aguilera, J. M. (1989). Effects of substrate
densification and CO2 conditions on supercritical extraction of
mushroom oleoresins. Journal of Food Science, 54, 135–141.
del Valle, J. M., & Aguilera, J. M. (1999). Extracci�on con CO2 a alta
presion. Fundamentos y aplicaciones en la industria de alimentos.
Food Science and Technology International, 5, 1–24.
del Valle, J. M., Jim�enez, M., & de la Fuente, J. C. (2003). Extraction
kinetics of pre-pelletized Jalape~no peppers with supercritical CO2.
The Journal of Supercritical Fluids, 25, 33–44.
del Valle, J. M., Jim�enez, M., Napolitano, P., Zetzl, C., & Brunner, G.(2003). Supercritical carbon dioxide extraction of pelletized Jal-
ape~no peppers. Journal of the Science of Food and Agriculture, 83,
550–556.
del Valle, J. M., Napolitano, P., & Fuentes, N. (2000). Estimation of
relevant mass transfer parameters for the extraction of packed
66 E. Uquiche et al. / Journal of Food Engineering 65 (2004) 55–66
substrate beds using supercritical fluids. Industrial & Engineering
Chemistry Research, 39, 4720–4728.
del Valle, J. M., Rivera, O., Mattea, M., Ruetsch, E., Daghero, J., &
Flores, A. (in press). Supercritical CO2 processing of pretreated
rosehip seeds: effect of process scale on oil extraction kinetics. The
Journal of Supercritical Fluids.
del Valle, J. M., & Uquiche, E. (2002). Particle size effects on
supercritical CO2 extraction of oil containing seeds. Journal of
American Oils Chemists’ Society, 79, 1261–1266.
Do, D. D., & Rice, R. G. (1986). Validity of the parabolic profile
assumption in adsorption studies. AIChE Journal, 32,, 149–154.
Gnayfeed, M. H., Daood, H. G., Ill�es, V., & Biacs, P. A. (2001).
Supercritical CO2 and subcritical propane extraction of pungent
paprika and quantification of carotenoids, tocopherols, and capsa-
icinoids. Journal of Agriculture and Food Chemistry, 49, 2761–2766.
G�omez-Prieto, M. S., Caja, M. M., & Santa-Mar�ıa, G. (2002).Solubility in supercritical carbon dioxide of the predominant
carotenes of tomato skin. Journal of American Oils Chemists’
Society, 79, 897–902.
Goto, M., Roy, B. C., & Hirose, T. (1996). Shrinking core leaching
model for supercritical fluid extraction. The Journal of Supercritical
Fluids, 9, 128–133.
Goto, M., Smith, J. M., & McCoy, B. J. (1990). Parabolic profile
approximation (linear driving force-model) for chemical reactions.
Chemical Engineering Science, 45, 443–448.
Jar�en-Gal�an, M., Nienaber, U., & Schwartz, S. J. (1999). Paprika
(Capsicum annuum L.) oleoresin extraction with supercritical
carbon dioxide. Journal of Agriculture and Food Chemistry, 47,
3558–3564.
Lang, Q., & Wai, Ch. M. (2001). Supercritical fluid extraction in herbal
and natural product studies––a practical review. Talanta, 53, 771–
782.
Liao, K., Cavalieri, P., & Pitts, J. (1990). Hausdorff dimensional
analysis and digital imaging based quality inspection. Transactions
in Agriculture, 33, 298–304.
Lozano, J. E., Rotstein, E., & Urbicain, M. J. (1980). Total porosity
and open-pore porosity in the drying of fruits. Journal of Food
Science, 45, 1403–1407.
Madras, G., Thibaud, C., Erkey, C., & Akgerman, A. (1994).
Modeling of supercritical extraction of organics from solid
matrices. AIChE Journal, 40, 777–785.
M�ınguez-Mosquera, M. I., & Hornero-M�endez, D. (1993). Separationand quantification of the carotenoids pigments in red peppers
(Capsicum annuum L.), paprika, and oleoresin by reversed phase
HPLC. Journal of Agriculture and Food Chemistry, 41, 1616–1620.
Nilsson, W. B., & Hudson, J. K. (1993). Solubility of simple and mixed
triacylglycerols in supercritical CO2. Journal of the American Oil
Chemists’ Society, 70, 749–754.
Pedreschi, F., Aguilera, J. M., & Brown, C. (2000). Characterization of
food surfaces using scale-sensitive fractal analysis. Journal of Food
Process Engineering, 23, 127–143.
Peker, H., Srinivasan, M. P., Smith, J. M., & McCoy, B. J. (1992).
Caffeine extraction rates from coffee beans with supercritical
carbon dioxide. AIChE Journal, 38, 761–770.
Poling, B. E., Prausnitz, J. M., & O’Connell, J. P. (2000). The
properties of gases and liquids (5th ed.). New York, NY: McGraw-
Hill.
Quevedo, R., L�opez, C., Aguilera, J. M., & Cadoche, L. (2002).
Description of food surfaces and microstructural changes using
fractal image texture analysis. Journal of Food Engineering, 53,
361–371.
Reverchon, E., & Marrone, C. (1997). Supercritical extraction of clove
bud essential oil: isolation and mathematical modeling. Chemical
Engineering Science, 52, 3421–3428.
Richardson, J. T. (1989). Principles of catalyst development. New York,
NY: Plenum Press.
Salmas, C. E., & Androutsopoulos, G. P. (2001). A novel pore
structure tortuosity concept based on nitrogen sorption hysteresis
data. Industrial & Engineering Chemistry Research, 40, 721–
730.
Stanley-Wood, N. G. (1990). Size enlargement. In M. J. Rhodes (Ed.),
Principles of powder technology (pp. 193–227). Chichester, UK:
John Wiley & Sons.
St€uber, F., Julien, S., & Recasens, F. (1997). Internal mass transfer in
sintered metallic pellets filled with supercritical fluid. Chemical
Engineering Science, 52, 1527–1542.
Talukar, D., & Acharya, R. (1995). Estimation of fractal dimension
using alternating sequential filters. IEEE Transactions on Pattern
Analytical Machine Intelligence, 17, 231–234.
Tan, C. S., Liang, S. K., & Liou, D. C. (1988). Fluid–solid mass
transfer in a supercritical fluid extractor. Chemical Engineering
Journal, 38, 17–22.
Vesper, H., & Nitz, S. (1997). Composition of extracts from paprika
(Capsicum annuum L.) obtained by conventional and supercritical
fluid extraction. Advances in Food Science, 19, 172–177.
Weissenberg, M., Schaeffler, I. L., Menagem, E., Barzilai, M., & Levy,
A. (1997). Isocratic non-aqueous reversed high-performance liquid
chromatographic separation of capsanthin and capsorubin in red
peppers (Capsicum annuum L.), paprika and oleoresin. Journal of
Chromatography A, 757, 89–95.


![Untitled-1 [courses.chem.psu.edu]courses.chem.psu.edu/chem431/800Expts/EX874.pdf · Isolation of Piperine from Black Pepper William W. Epstein ... 5Black pepper oleoresin is obtained](https://img.pdfslide.us/doc/110x75/5b5643927f8b9a022e8c548a/untitled-1-isolation-of-piperine-from-black-pepper-william-w-epstein-.jpg)