Embed Size (px)
Citation preview
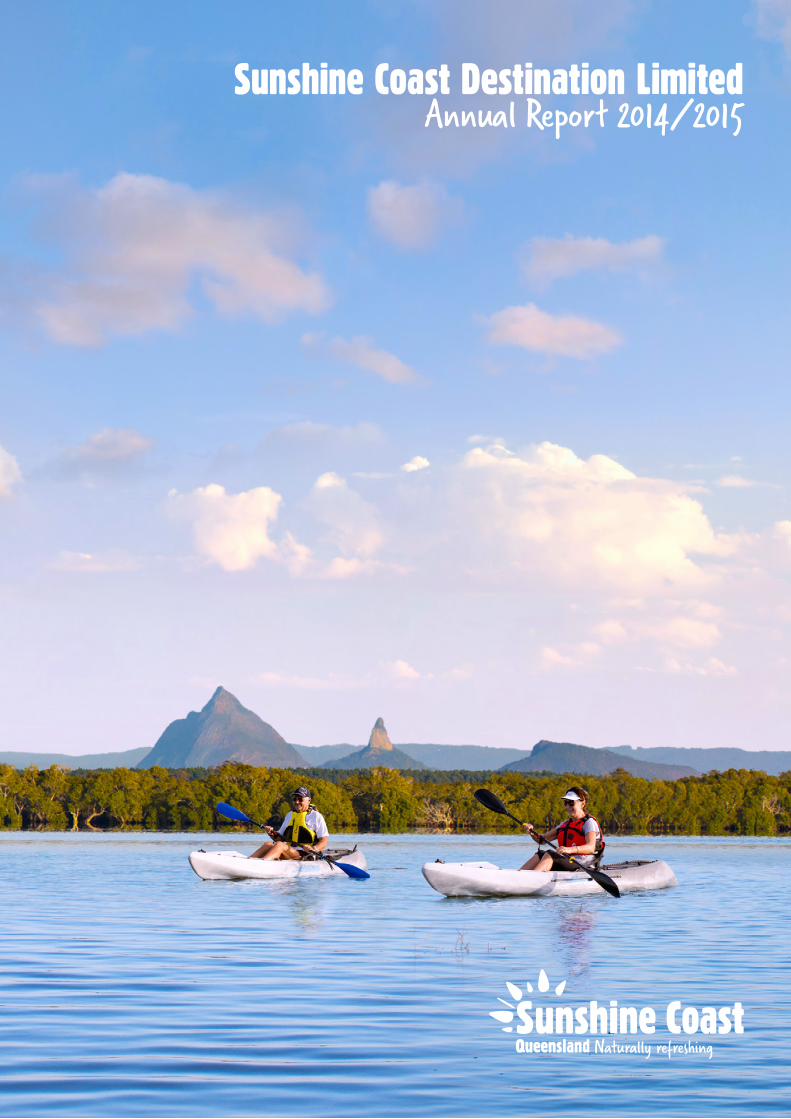
Sunshine Coast Destination LimitedAnnual Report 2014/2015
2 Sunshine Coast Destination Limited Annual Report 2014/2015
Chairman’s Report 4
Chief Executive Officer’s Report 5
About Sunshine Coast Destination Limited 6
Research 7
Aviation 8
Membership 9
Marketing 10-11
Digital 12
PR and Communications 13
Industry Development 14
International and Trade 15
Business Events Sunshine Coast 16
Tourism Development 17
Visitor Information Centres 18
Annual Financial Reports 21
Contents
Sunshine Coast Destination Limited Annual Report 2014/2015 3*NOTE: This map is not to be used for commercial purposes*NOTE: This map is not to be used for commercial purposes
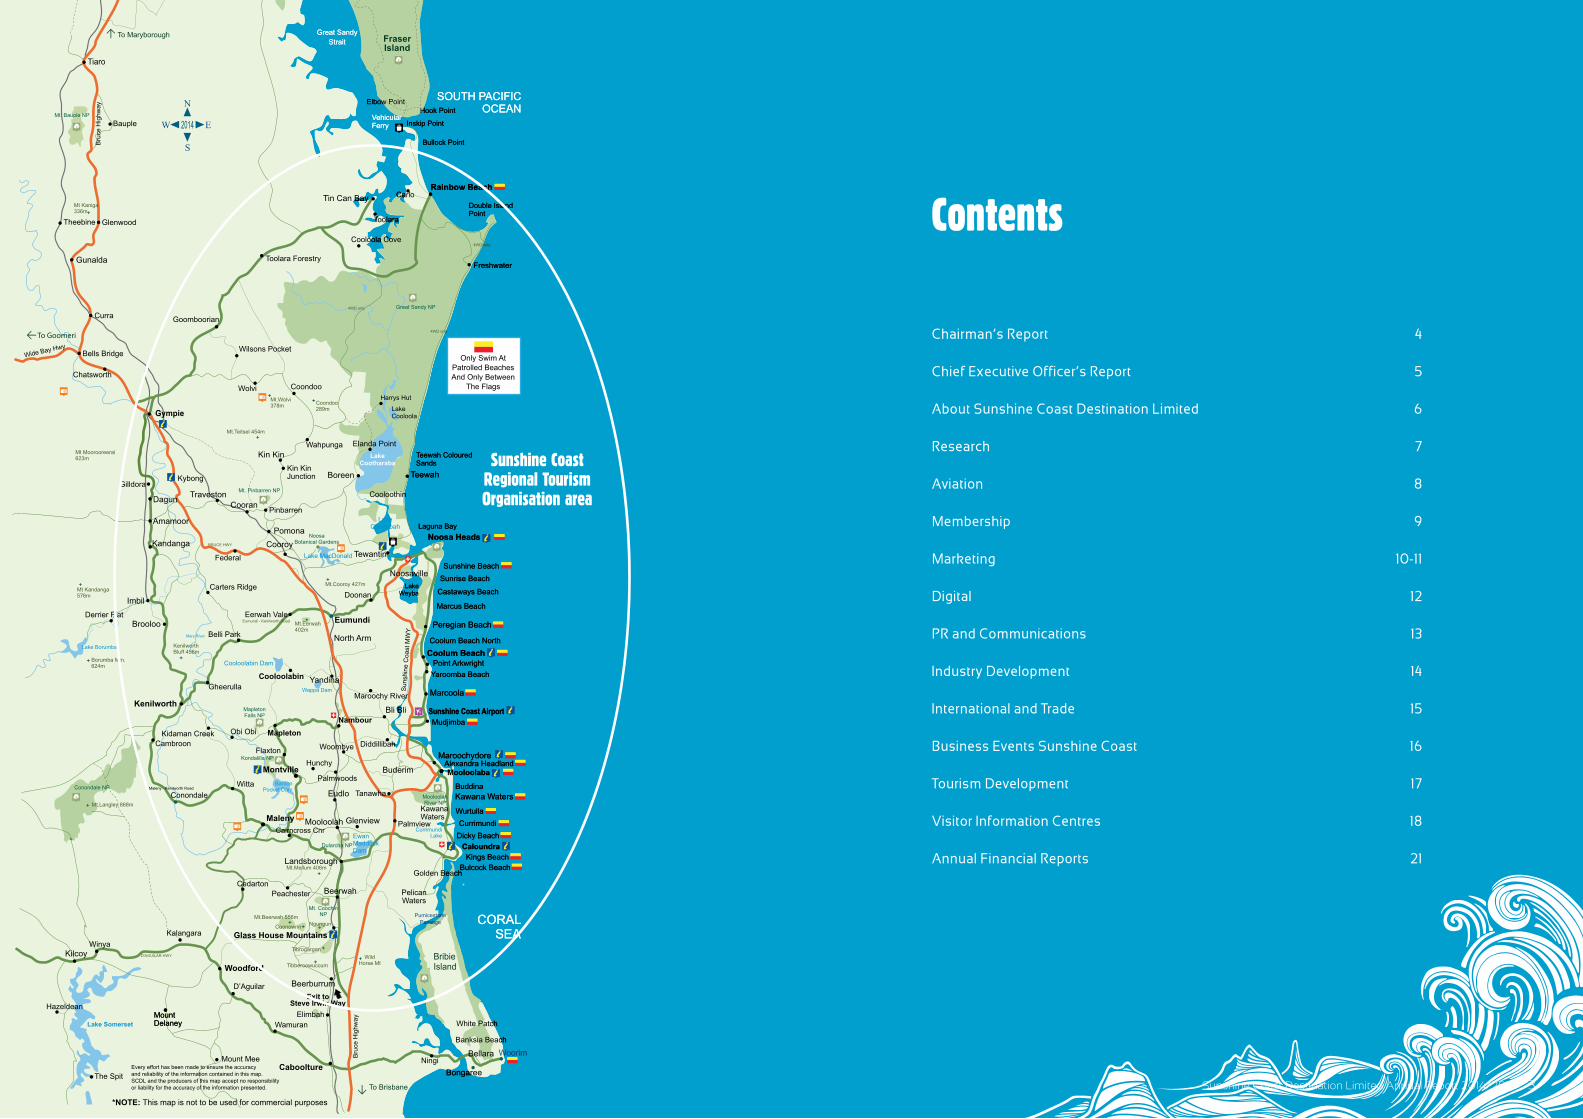
Sunshine Coast Regional Tourism Organisation area
*NOTE: This map is not to be used for commercial purposes*NOTE: This map is not to be used for commercial purposes
Sunshine Coast Regional Tourism Organisation area
Sunshine Coast Destination Limited Annual Report 2014/2015 54 Sunshine Coast Destination Limited Annual Report 2014/2015
Chairman’s Report Chief Executive Officer’s Report
With my second year in the role as CEO now complete, it is very pleasing to be able to report to members and partners that Sunshine Coast Destination Ltd (SCDL) has experienced an outstanding year, outperforming all visitation forecasts.
From the outset of my tenure, I have made it a priority to build strong relationships with members, stakeholders and partners and I would like to thank all of these people and organisations for their support. It has enabled the region to kick very impressive goals during 2014/2015.
Some key achievements during 2014/2015:• The Vacation Migration campaign was the largest to
date with digital, outdoor and television in Sydney, Melbourne and Brisbane. The likelihood to visit increased by 30% for both Melbourne and Sydney;
• A major marketing partnership was signed with Flight Centre and Tourism and Events Queensland (TEQ) to promote the region’s attractions in the domestic market;
• Sunshine Coast attracted major increases in air services from Air New Zealand following the success of the 2013/2014 season, as well as increased services from Jetstar and Virgin.
• P&O Cruises announced the Sunshine Coast as a major stopover port for its cruises, with a successful maiden stop-over in July 2015;
• SCDL launched the Great Beach Drive as part of its Australia’s Nature Coast partnership with Fraser Coast, attracting massive interest in the destination both overseas and in Australia;
• A record amount of media coverage showcasing the Sunshine Coast was achieved during 2014/2015, with the value of print, electronic and online media coverage valued at $41.8 million, up from $28.4 million in 2013/2014;
• SCDL actively participated in a series of domestic and international famils and trade shows, highlighting the region as a prime destination for conferences and events, including the first famil of trade specialists from south-east Asia;
It is very pleasing that in my second report as Chairman of the Board, I am able to report the Sunshine Coast has led most of Queensland – and Australia – in its tourism growth, posting four continuous quarters of growth in domestic and international arrivals.
The figures from the past year have demonstrated unequivocally that our marketing campaigns have created a very positive and powerful image for the Sunshine Coast that is producing record results for all areas – from the coastal towns of Caloundra, Mooloolaba, Maroochydore, Noosa and Rainbow Beach, through to inland destinations in the Hinterland and Gympie areas.
It is a measure of the team’s talent and hard work that despite challenging economic conditions, SCDL has been able to make such a profound impact with Australian and overseas travellers.
The team has launched a number of innovative marketing strategies to capture the attention of travellers and they were highly effective in communicating the message that within an hour of the beach there was a vast range of other attractions – markets, a vibrant food and arts culture, nature and events – to make the Sunshine Coast a ‘complete’ holiday playground.
Over the past year, the Board has worked assiduously to ensure that the structure and strategic direction of SCDL is best equipped to meet the ongoing and future needs of the region’s tourism businesses.
The Board had to make a number of fundamental changes to the organisation to meet the specific challenges that were caused by the decision of Tourism Noosa to cut marketing involvement with SCDL in the 2014/2015 financial year. Noosa Council has also now declined to provide funding for regional tourism promotion from July 2015, despite SCDL delivering outstanding results to Noosa’s businesses from its domestic, European and New Zealand campaigns.
• The new structure for Visitor Information Centres was introduced and the volunteers, along with SCDL coordinating staff have done an outstanding job in servicing the needs of travellers visiting the region. A major highlight was the Glass House Mountains Visitor and Interpretive Centre winning a silver award for Visitor and Information Services in the Queensland Tourism Awards.
With our leaner organisation, priorities have necessarily changed, with greater emphasis on digital marketing and carefully targeted promotions to boost emerging and potential markets. While we have made encouraging progress in the Asian market, we have recognised that traditional markets such as the United Kingdom, Europe, New Zealand and the domestic Australian markets still offer the greatest potential for growth, both in numbers and yield.
Tourism is such a crucial ingredient of the Sunshine Coast economy that I believe it is vital to work collectively and positively to ensure our industry continues to benefit the entire region.
I would like to express my thanks to the SCDL team. We are fortunate to have a very proactive new Head of Marketing and Strategic Partnerships, Simon Latchford, as well as new members of the team who have brought energy and ideas to the organisation. I would also like to thank the Board of Directors for their guidance and support, our wonderful Visitor Information Centre volunteers who are true ambassadors for the region, and our members, stakeholders and partners for their continued support and commitment to the Sunshine Coast’s tourism sector.
Simon AmbroseChief Executive Officer
Despite the uncertainty caused by the disruption to funding, the team at SCDL consistently produced outstanding results that helped deliver almost $2 billion of economic benefit to residents and businesses of the Sunshine Coast tourism region.
I have been extremely well-served by my Board of Directors, who have continued to provide passion, vision and expertise to the organisation.
We are fortunate to have great support from the Sunshine Coast and Gympie Councils, Tourism and Events Queensland and the Sunshine Coast Airport, and our membership is vibrant and supportive. A tourism organisation relies on its members to be fully effective and we are fortunate to have members who are both progressive and energetic.
To conclude, I would like to acknowledge again the hard work and dedication of the SCDL team including our 300 Visitor Information Centre volunteer ambassadors and thank our members and partners for their exemplary support.
Grant Hunt,Chairman of the Board
6 Sunshine Coast Destination Limited Annual Report 2014/2015 Sunshine Coast Destination Limited Annual Report 2014/2015 7
:V
V
LOGO
alidation DA/DC
alidation Client
Date : 31/05/11
Nº dossier : 20110049E
100 83 0 22
10 25 25 40
Overview
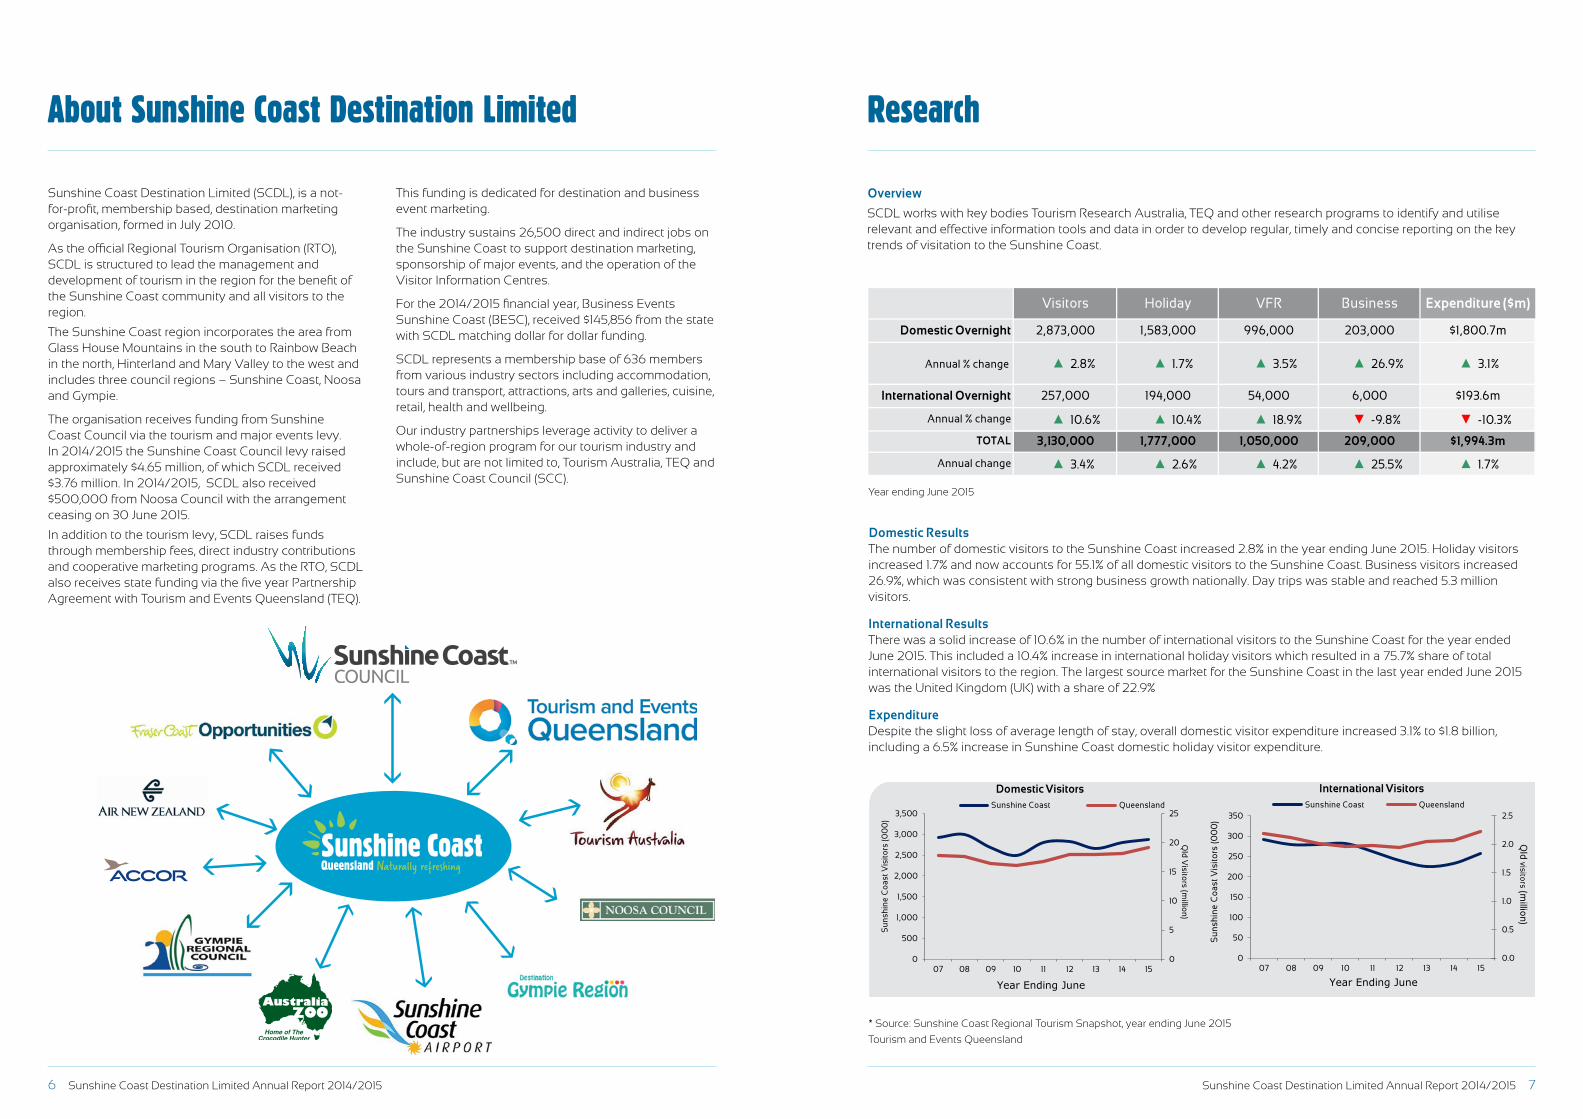
SCDL works with key bodies Tourism Research Australia, TEQ and other research programs to identify and utilise relevant and effective information tools and data in order to develop regular, timely and concise reporting on the key trends of visitation to the Sunshine Coast.
About Sunshine Coast Destination Limited
Sunshine Coast Destination Limited (SCDL), is a not-for-profit, membership based, destination marketing organisation, formed in July 2010.
As the official Regional Tourism Organisation (RTO), SCDL is structured to lead the management and development of tourism in the region for the benefit of the Sunshine Coast community and all visitors to the region.
The Sunshine Coast region incorporates the area from Glass House Mountains in the south to Rainbow Beach in the north, Hinterland and Mary Valley to the west and includes three council regions – Sunshine Coast, Noosa and Gympie.
The organisation receives funding from Sunshine Coast Council via the tourism and major events levy. In 2014/2015 the Sunshine Coast Council levy raised approximately $4.65 million, of which SCDL received $3.76 million. In 2014/2015, SCDL also received $500,000 from Noosa Council with the arrangement ceasing on 30 June 2015.
In addition to the tourism levy, SCDL raises funds through membership fees, direct industry contributions and cooperative marketing programs. As the RTO, SCDL also receives state funding via the five year Partnership Agreement with Tourism and Events Queensland (TEQ).
This funding is dedicated for destination and business event marketing.
The industry sustains 26,500 direct and indirect jobs on the Sunshine Coast to support destination marketing, sponsorship of major events, and the operation of the Visitor Information Centres.
For the 2014/2015 financial year, Business Events Sunshine Coast (BESC), received $145,856 from the state with SCDL matching dollar for dollar funding.
SCDL represents a membership base of 636 members from various industry sectors including accommodation, tours and transport, attractions, arts and galleries, cuisine, retail, health and wellbeing.
Our industry partnerships leverage activity to deliver a whole-of-region program for our tourism industry and include, but are not limited to, Tourism Australia, TEQ and Sunshine Coast Council (SCC).
Research
Year Ending June 2015
▲ 2.8% ▲ 1.7% ▲ 3.5% ▲ 26.9% ▲ 3.1%
● 0.4% ▼ -0.6% ▲ 2.0% ● -0.4% ▲ 1.8%
▲ 10.6% ▲ 10.4% ▲ 18.9% ▼ -9.8% ▼ -10.3%
▲ 2.4% ▲ 3.2% ▼ -2.7% ▼ -9.7% ▼ -2.0%
▲ 3.4% ▲ 2.6% ▲ 4.2% ▲ 25.5% ▲ 1.7%
####
Visitors Holiday VFR Business Expenditure ($m)
Annual % change
Annual change
Annual % change
Trend % change2
International Overnight 257,000 194,000 54,000 6,000 $193.6m
Domestic Overnight 2,873,000 1,583,000 996,000 203,000 $1,800.7m
TOTAL 3,130,000 1,777,000 1,050,000 209,000 $1,994.3m
Trend % change
-10.0%
-5.0%
0.0%
5.0%
10.0%
15.0%
20.0%
07 08 09 10 11 12 13 14 15
Annual % Change in Total Visitation
Brisbane Queensland
Sunshine Coast Regional Snapshot
For the year ended June 2013, the number ofdomestic visitors to Brisbane increased 2%. Thiswas the result of growth in intrastate visitation, asthe number of interstate visitors declined.
The intrastate increase was driven by stronggrowth in holiday visitors from within the Brisbaneregion as well as the resource regions of SQC andCentral Queensland. There were also gains due tointrastate business travel from CentralQueensland and the Sunshine Coast.
Interstate holiday and VFR travel to Brisbaneincreased, however there was a large decline ininterstate business travel, particularly from NSWand Victoria, which resulted in the overallinterstate decline.
The decline in interstate business travel is part ofthe normalising of interstate business travelfollowing the spikes created over the last threeyears by natural disaster recovery programs andresource related construction projects.
The number of international visitors to Brisbanegrew markedly over the year ended June 2013.
Overall growth reached 10%, including a nearuniversal increase in visitors from every keysource market. This general increase was alsoevident in every type of purpose, including thenumber of holiday visitors which increased 14%.The proportion of international holiday visitorsincreased to 50% of all international visitors toBrisbane.
China continued to have the highest growth ofall Brisbane source markets, increasing by 19%over the year. Direct flights from the USA toBrisbane continued to improve annual visitationwith a 20% increase in visitors and a 68%increase in visitor nights. Visitors from the UKincreased 9% and visitor nights improved 36%, astheir domestic economy continued a tentativerecovery from the GFC. Brisbane also had awelcome increase in Japanese visitation, whichlifted 35%.
0
6
12
18
24
0
1,000
2,000
3,000
4,000
5,000
6,000
06 07 08 09 10 11 12 13 14 15
Qld visitors (m
illion)
Vis
itors
(00
0)
Domestic Visitors
Brisbane Queensland
0.0
5.0
10.0
15.0
20.0
25.0
0
1
2
3
4
5
06 07 08 09 10 11 12 13 14 15
International NightsD
omes
tic N
ight
s
Average Length of Stay (ALoS)Intrastate Interstate International
The average length of stay for domesticvisitors to Brisbane remained unchanged overthe year. Both intrastate and interstate lengthof stay remained stable, however the numberof visitor nights grew, particularly holiday andVFR.
The average length of stay for internationalvisitors to Brisbane grew slightly to 21 nights,including holiday visitors which increased to12.4 nights.
Though the number of internationalbusiness visitors grew 2%, the number ofinternational business nights grew 26% (ormore than 200 000 nights) over the year. Thislifted the average length of stay of businesstravellers to 7.7 nights. Singapore had theopposite effect with an increase in visitors of20%, however only a 1% increase in visitornights.
The overall increase in visitor nightscontributed to international expendituregrowth of 6%.
Research UpdatesTo receive an email alert whenever new tourism
figures are released click here
There were 6,096,000 international and domesticovernight visitors to Brisbane in the year endedJune 2013, this was a increase of 3% on the yearended June 2012.
Intrastate50.3%
Interstate33.3%
International16.5%
0
500
1,000
1,500
2,000
2,500
0
200
400
600
800
1,000
1,200
06 07 08 09 10 11 12 13 14 15
Vis
itors
(00
0)
International Visitors
Brisbane Queensland
Qld visitors (0
00
)
www.tq.com.au/research
Sunshine Coast Regional Snapshot
Year Ending JuneYear Ending JuneYear Ending June
Year Ending June
Sunshine Coast Regional Snapshot, Year Ending June 2015
-10.0%
-5.0%
0.0%
5.0%
10.0%
15.0%
20.0%
07 08 09 10 11 12 13 14 15
Annual % Change in Total Visitation
Brisbane Queensland
For the year ended June 2013, the number ofdomestic visitors to Brisbane increased 2%. Thiswas the result of growth in intrastate visitation, asthe number of interstate visitors declined.
The intrastate increase was driven by stronggrowth in holiday visitors from within the Brisbaneregion as well as the resource regions of SQC andCentral Queensland. There were also gains due tointrastate business travel from CentralQueensland and the Sunshine Coast.
Interstate holiday and VFR travel to Brisbaneincreased, however there was a large decline ininterstate business travel, particularly from NSWand Victoria, which resulted in the overallinterstate decline.
The decline in interstate business travel is part ofthe normalising of interstate business travelfollowing the spikes created over the last threeyears by natural disaster recovery programs andresource related construction projects.
The number of international visitors to Brisbanegrew markedly over the year ended June 2013.
Overall growth reached 10%, including a nearuniversal increase in visitors from every keysource market. This general increase was alsoevident in every type of purpose, including thenumber of holiday visitors which increased 14%.The proportion of international holiday visitorsincreased to 50% of all international visitors toBrisbane.
China continued to have the highest growth ofall Brisbane source markets, increasing by 19%over the year. Direct flights from the USA toBrisbane continued to improve annual visitationwith a 20% increase in visitors and a 68%increase in visitor nights. Visitors from the UKincreased 9% and visitor nights improved 36%, astheir domestic economy continued a tentativerecovery from the GFC. Brisbane also had awelcome increase in Japanese visitation, whichlifted 35%.
0
6
12
18
24
3,000
3,100
3,200
3,300
3,400
3,500
3,600
3,700
3,800
06 07 08 09 10 11 12 13 14 15
Qld visitors (m
illion)
Vis
itors
(00
0)
Domestic Visitors
Gold Coast Queensland
0.0
5.0
10.0
15.0
20.0
25.0
0
1
2
3
4
5
06 07 08 09 10 11 12 13 14 15
International NightsD
omes
tic N
ight
s
Average Length of Stay (ALoS)Intrastate Interstate International
The average length of stay for domesticvisitors to Brisbane remained unchanged overthe year. Both intrastate and interstate lengthof stay remained stable, however the numberof visitor nights grew, particularly holiday andVFR.
The average length of stay for internationalvisitors to Brisbane grew slightly to 21 nights,including holiday visitors which increased to12.4 nights.
Though the number of internationalbusiness visitors grew 2%, the number ofinternational business nights grew 26% (ormore than 200 000 nights) over the year. Thislifted the average length of stay of businesstravellers to 7.7 nights. Singapore had theopposite effect with an increase in visitors of20%, however only a 1% increase in visitornights.
The overall increase in visitor nightscontributed to international expendituregrowth of 6%.
Research UpdatesTo receive an email alert whenever new tourism
figures are released click here
There were 6,096,000 international and domesticovernight visitors to Brisbane in the year endedJune 2013, this was a increase of 3% on the yearended June 2012.
Intrastate50.3%
Interstate33.3%
International16.5%
0
500
1,000
1,500
2,000
2,500
0
200
400
600
800
1,000
1,200
06 07 08 09 10 11 12 13 14 15
Vis
itors
(00
0)
International Visitors
Brisbane Queensland
Qld visitors (0
00
)
www.tq.com.au/research
Year Ending JuneYear Ending JuneYear Ending June
Year Ending June
Sunshine Coast Regional Snapshot, Year Ending June 2015
-15%
-10%
-5%
0%
5%
10%
15%
08 09 10 11 12 13 14 15
Annual % Change in Total Visitation
Sunshine Coast Queensland
0
5
10
15
20
25
0
500
1,000
1,500
2,000
2,500
3,000
3,500
07 08 09 10 11 12 13 14 15
Qld
Visitors (m
illion)
Su
nsh
ine
Coa
st V
isito
rs (0
00
)
Domestic VisitorsSunshine Coast Queensland
0.0
2.0
4.0
6.0
8.0
10.0
12.0
14.0
0.0
1.0
2.0
3.0
4.0
5.0
6.0
7.0
8.0
9.0
07 08 09 10 11 12 13 14 15
International NightsD
omes
tic N
ight
s
Average Length of Stay (ALoS)
Intrastate Interstate International
Research UpdatesTo receive an email alert whenever new tourism
figures are released click here
There were 3,130,000 international anddomestic overnight visitors to the SunshineCoast in the year ended June 2015, this was anincrease of 3.4% on the year ended June 2014.
Intrastate70.8%
Interstate21.0%
International8.2%
0.0
0.5
1.0
1.5
2.0
2.5
0
50
100
150
200
250
300
350
07 08 09 10 11 12 13 14 15
Sun
shin
e C
oast
Vis
itors
(00
0)
International VisitorsSunshine Coast Queensland
Qld visito
rs(m
illion)
www.teq.queensland.com
Year Ending JuneYear Ending JuneYear Ending June
Year Ending June
Sunshine Coast Regional Snapshot, Year Ending June 2015
The number of domestic visitors to the SunshineCoast increased 2.8% in the year ending June 2015.Holiday visitors increased 1.7% and now accountsfor 55.1% of all domestic visitors to the SunshineCoast. Business visitors increased 26.9%, whichwas consistent with strong business growthnationally. This growth was however, off a lowbase as Business travel only contributes 7.1% of alldomestic visitors to the region.
Interstate visitors to the Sunshine Coast declined4.2% and made up 22.8% of all domestic visitors.The number of interstate holiday visitors wasessentially stable however VFR declined slightly.Intrastate visitors grew 5.1% overall including a2.9% lift in intrastate holiday visitors. Both VFR andbusiness visitors had strong increases as well.
For the year ended June 2015, Brisbaneremained the largest domestic source market forvisitors to the Sunshine Coast with 48.4% andRegional Queensland is second with 28.8%. Interms of nights however, interstate visitors are thelargest single source market witha 37.8% share ofthe total domestic nights spent in the region.
There was a solid increase of 10.6% in thenumber of international visitors to the SunshineCoast for the year ended June 2015. This includeda 10.4% increase in international holiday visitorswhich resulted in a 75.7% share of totalinternational visitors to the region.. The largest source market for the SunshineCoast in the year ended June 2015 was theUnited Kingdom (UK) with a share of 22.9%. UKholiday visitors to the Sunshine Coast increased27.6% due in part to the strength of theAustralia's Nature Coast initiative. Importantly,the UK was also the number one internationalsource market for visitor nights with 23.3% share.
New Zealand was the second largestinternational source market for the SunshineCoast with the number of overall visitorsremaining stable. With 30.6% growth in visitornumbers, Germany remained the third largestsource market with a 12.4% share of internationalvisitors.
International visitor nights declined 7.0%,including a 5.6% decrease in holiday visitornights.
Overall, domestic visitors to the SunshineCoast shortened their average length of stayby 2.6%, as visitor night growth was slightlyless than the growth in visitors. Interstatevisitors stayed an average of 6.2 nights andintrastate visitors stayed 3.0 nights.
Despite the slight loss of average length ofstay, overall domestic visitor expenditureincreased 3.1% to $1.8 billion, including a 6.5%increase in Sunshine Coast domestic holidayvisitor expenditure.
Internationally, a rise in overall visitorsoccurred at the same time as a sharp rise invisitor nights for Education and Employmentvisitors, which lifted overall internationalvisitor nights by 28.1%. This combinationresulted in a 10.9% increase in the overallaverage length of stay.
These additional visitors and nightsincreased international overnight visitorexpenditure by 17.0%.
Year Ending June 2015
▲ 2.8% ▲ 1.7% ▲ 3.5% ▲ 26.9% ▲ 3.1%
● 0.4% ▼ -0.6% ▲ 2.0% ● -0.4% ▲ 1.8%
▲ 10.6% ▲ 10.4% ▲ 18.9% ▼ -9.8% ▼ -10.3%
▲ 2.4% ▲ 3.2% ▼ -2.7% ▼ -9.7% ▼ -2.0%
▲ 3.4% ▲ 2.6% ▲ 4.2% ▲ 25.5% ▲ 1.7%
####
Visitors Holiday VFR Business Expenditure ($m)
Annual % change
Annual change
Annual % change
Trend % change2
International Overnight 257,000 194,000 54,000 6,000 $193.6m
Domestic Overnight 2,873,000 1,583,000 996,000 203,000 $1,800.7m
TOTAL 3,130,000 1,777,000 1,050,000 209,000 $1,994.3m
Trend % change
-10.0%
-5.0%
0.0%
5.0%
10.0%
15.0%
20.0%
07 08 09 10 11 12 13 14 15
Annual % Change in Total Visitation
Brisbane Queensland
Sunshine Coast Regional Snapshot
For the year ended June 2013, the number ofdomestic visitors to Brisbane increased 2%. Thiswas the result of growth in intrastate visitation, asthe number of interstate visitors declined.
The intrastate increase was driven by stronggrowth in holiday visitors from within the Brisbaneregion as well as the resource regions of SQC andCentral Queensland. There were also gains due tointrastate business travel from CentralQueensland and the Sunshine Coast.
Interstate holiday and VFR travel to Brisbaneincreased, however there was a large decline ininterstate business travel, particularly from NSWand Victoria, which resulted in the overallinterstate decline.
The decline in interstate business travel is part ofthe normalising of interstate business travelfollowing the spikes created over the last threeyears by natural disaster recovery programs andresource related construction projects.
The number of international visitors to Brisbanegrew markedly over the year ended June 2013.
Overall growth reached 10%, including a nearuniversal increase in visitors from every keysource market. This general increase was alsoevident in every type of purpose, including thenumber of holiday visitors which increased 14%.The proportion of international holiday visitorsincreased to 50% of all international visitors toBrisbane.
China continued to have the highest growth ofall Brisbane source markets, increasing by 19%over the year. Direct flights from the USA toBrisbane continued to improve annual visitationwith a 20% increase in visitors and a 68%increase in visitor nights. Visitors from the UKincreased 9% and visitor nights improved 36%, astheir domestic economy continued a tentativerecovery from the GFC. Brisbane also had awelcome increase in Japanese visitation, whichlifted 35%.
0
6
12
18
24
0
1,000
2,000
3,000
4,000
5,000
6,000
06 07 08 09 10 11 12 13 14 15Q
ld visitors (million)
Vis
itors
(00
0)
Domestic Visitors
Brisbane Queensland
0.0
5.0
10.0
15.0
20.0
25.0
0
1
2
3
4
5
06 07 08 09 10 11 12 13 14 15
International NightsD
omes
tic N
ight
s
Average Length of Stay (ALoS)Intrastate Interstate International
The average length of stay for domesticvisitors to Brisbane remained unchanged overthe year. Both intrastate and interstate lengthof stay remained stable, however the numberof visitor nights grew, particularly holiday andVFR.
The average length of stay for internationalvisitors to Brisbane grew slightly to 21 nights,including holiday visitors which increased to12.4 nights.
Though the number of internationalbusiness visitors grew 2%, the number ofinternational business nights grew 26% (ormore than 200 000 nights) over the year. Thislifted the average length of stay of businesstravellers to 7.7 nights. Singapore had theopposite effect with an increase in visitors of20%, however only a 1% increase in visitornights.
The overall increase in visitor nightscontributed to international expendituregrowth of 6%.
Research UpdatesTo receive an email alert whenever new tourism
figures are released click here
There were 6,096,000 international and domesticovernight visitors to Brisbane in the year endedJune 2013, this was a increase of 3% on the yearended June 2012.
Intrastate50.3%
Interstate33.3%
International16.5%
0
500
1,000
1,500
2,000
2,500
0
200
400
600
800
1,000
1,200
06 07 08 09 10 11 12 13 14 15
Vis
itors
(00
0)
International Visitors
Brisbane Queensland
Qld visitors (0
00
)
www.tq.com.au/research
Sunshine Coast Regional Snapshot
Year Ending JuneYear Ending JuneYear Ending June
Year Ending June
Sunshine Coast Regional Snapshot, Year Ending June 2015
-10.0%
-5.0%
0.0%
5.0%
10.0%
15.0%
20.0%
07 08 09 10 11 12 13 14 15
Annual % Change in Total Visitation
Brisbane Queensland
For the year ended June 2013, the number ofdomestic visitors to Brisbane increased 2%. Thiswas the result of growth in intrastate visitation, asthe number of interstate visitors declined.
The intrastate increase was driven by stronggrowth in holiday visitors from within the Brisbaneregion as well as the resource regions of SQC andCentral Queensland. There were also gains due tointrastate business travel from CentralQueensland and the Sunshine Coast.
Interstate holiday and VFR travel to Brisbaneincreased, however there was a large decline ininterstate business travel, particularly from NSWand Victoria, which resulted in the overallinterstate decline.
The decline in interstate business travel is part ofthe normalising of interstate business travelfollowing the spikes created over the last threeyears by natural disaster recovery programs andresource related construction projects.
The number of international visitors to Brisbanegrew markedly over the year ended June 2013.
Overall growth reached 10%, including a nearuniversal increase in visitors from every keysource market. This general increase was alsoevident in every type of purpose, including thenumber of holiday visitors which increased 14%.The proportion of international holiday visitorsincreased to 50% of all international visitors toBrisbane.
China continued to have the highest growth ofall Brisbane source markets, increasing by 19%over the year. Direct flights from the USA toBrisbane continued to improve annual visitationwith a 20% increase in visitors and a 68%increase in visitor nights. Visitors from the UKincreased 9% and visitor nights improved 36%, astheir domestic economy continued a tentativerecovery from the GFC. Brisbane also had awelcome increase in Japanese visitation, whichlifted 35%.
0
6
12
18
24
3,000
3,100
3,200
3,300
3,400
3,500
3,600
3,700
3,800
06 07 08 09 10 11 12 13 14 15Q
ld visitors (million)
Vis
itors
(00
0)
Domestic Visitors
Gold Coast Queensland
0.0
5.0
10.0
15.0
20.0
25.0
0
1
2
3
4
5
06 07 08 09 10 11 12 13 14 15
International NightsD
omes
tic N
ight
s
Average Length of Stay (ALoS)Intrastate Interstate International
The average length of stay for domesticvisitors to Brisbane remained unchanged overthe year. Both intrastate and interstate lengthof stay remained stable, however the numberof visitor nights grew, particularly holiday andVFR.
The average length of stay for internationalvisitors to Brisbane grew slightly to 21 nights,including holiday visitors which increased to12.4 nights.
Though the number of internationalbusiness visitors grew 2%, the number ofinternational business nights grew 26% (ormore than 200 000 nights) over the year. Thislifted the average length of stay of businesstravellers to 7.7 nights. Singapore had theopposite effect with an increase in visitors of20%, however only a 1% increase in visitornights.
The overall increase in visitor nightscontributed to international expendituregrowth of 6%.
Research UpdatesTo receive an email alert whenever new tourism
figures are released click here
There were 6,096,000 international and domesticovernight visitors to Brisbane in the year endedJune 2013, this was a increase of 3% on the yearended June 2012.
Intrastate50.3%
Interstate33.3%
International16.5%
0
500
1,000
1,500
2,000
2,500
0
200
400
600
800
1,000
1,200
06 07 08 09 10 11 12 13 14 15
Vis
itors
(00
0)
International Visitors
Brisbane Queensland
Qld visitors (0
00
)
www.tq.com.au/research
Year Ending JuneYear Ending JuneYear Ending June
Year Ending June
Sunshine Coast Regional Snapshot, Year Ending June 2015
-15%
-10%
-5%
0%
5%
10%
15%
08 09 10 11 12 13 14 15
Annual % Change in Total Visitation
Sunshine Coast Queensland
0
5
10
15
20
25
0
500
1,000
1,500
2,000
2,500
3,000
3,500
07 08 09 10 11 12 13 14 15Q
ld V
isitors (million
)
Su
nsh
ine
Coa
st V
isito
rs (0
00
)
Domestic VisitorsSunshine Coast Queensland
0.0
2.0
4.0
6.0
8.0
10.0
12.0
14.0
0.0
1.0
2.0
3.0
4.0
5.0
6.0
7.0
8.0
9.0
07 08 09 10 11 12 13 14 15
International NightsD
omes
tic N
ight
s
Average Length of Stay (ALoS)
Intrastate Interstate International
Research UpdatesTo receive an email alert whenever new tourism
figures are released click here
There were 3,130,000 international anddomestic overnight visitors to the SunshineCoast in the year ended June 2015, this was anincrease of 3.4% on the year ended June 2014.
Intrastate70.8%
Interstate21.0%
International8.2%
0.0
0.5
1.0
1.5
2.0
2.5
0
50
100
150
200
250
300
350
07 08 09 10 11 12 13 14 15
Sun
shin
e C
oast
Vis
itors
(00
0)
International VisitorsSunshine Coast Queensland
Qld visito
rs(m
illion)
www.teq.queensland.com
Year Ending JuneYear Ending JuneYear Ending June
Year Ending June
Sunshine Coast Regional Snapshot, Year Ending June 2015
The number of domestic visitors to the SunshineCoast increased 2.8% in the year ending June 2015.Holiday visitors increased 1.7% and now accountsfor 55.1% of all domestic visitors to the SunshineCoast. Business visitors increased 26.9%, whichwas consistent with strong business growthnationally. This growth was however, off a lowbase as Business travel only contributes 7.1% of alldomestic visitors to the region.
Interstate visitors to the Sunshine Coast declined4.2% and made up 22.8% of all domestic visitors.The number of interstate holiday visitors wasessentially stable however VFR declined slightly.Intrastate visitors grew 5.1% overall including a2.9% lift in intrastate holiday visitors. Both VFR andbusiness visitors had strong increases as well.
For the year ended June 2015, Brisbaneremained the largest domestic source market forvisitors to the Sunshine Coast with 48.4% andRegional Queensland is second with 28.8%. Interms of nights however, interstate visitors are thelargest single source market witha 37.8% share ofthe total domestic nights spent in the region.
There was a solid increase of 10.6% in thenumber of international visitors to the SunshineCoast for the year ended June 2015. This includeda 10.4% increase in international holiday visitorswhich resulted in a 75.7% share of totalinternational visitors to the region.. The largest source market for the SunshineCoast in the year ended June 2015 was theUnited Kingdom (UK) with a share of 22.9%. UKholiday visitors to the Sunshine Coast increased27.6% due in part to the strength of theAustralia's Nature Coast initiative. Importantly,the UK was also the number one internationalsource market for visitor nights with 23.3% share.
New Zealand was the second largestinternational source market for the SunshineCoast with the number of overall visitorsremaining stable. With 30.6% growth in visitornumbers, Germany remained the third largestsource market with a 12.4% share of internationalvisitors.
International visitor nights declined 7.0%,including a 5.6% decrease in holiday visitornights.
Overall, domestic visitors to the SunshineCoast shortened their average length of stayby 2.6%, as visitor night growth was slightlyless than the growth in visitors. Interstatevisitors stayed an average of 6.2 nights andintrastate visitors stayed 3.0 nights.
Despite the slight loss of average length ofstay, overall domestic visitor expenditureincreased 3.1% to $1.8 billion, including a 6.5%increase in Sunshine Coast domestic holidayvisitor expenditure.
Internationally, a rise in overall visitorsoccurred at the same time as a sharp rise invisitor nights for Education and Employmentvisitors, which lifted overall internationalvisitor nights by 28.1%. This combinationresulted in a 10.9% increase in the overallaverage length of stay.
These additional visitors and nightsincreased international overnight visitorexpenditure by 17.0%.
Year Ending June 2015
▲ 2.8% ▲ 1.7% ▲ 3.5% ▲ 26.9% ▲ 3.1%
● 0.4% ▼ -0.6% ▲ 2.0% ● -0.4% ▲ 1.8%
▲ 10.6% ▲ 10.4% ▲ 18.9% ▼ -9.8% ▼ -10.3%
▲ 2.4% ▲ 3.2% ▼ -2.7% ▼ -9.7% ▼ -2.0%
▲ 3.4% ▲ 2.6% ▲ 4.2% ▲ 25.5% ▲ 1.7%
####
Visitors Holiday VFR Business Expenditure ($m)
Annual % change
Annual change
Annual % change
Trend % change2
International Overnight 257,000 194,000 54,000 6,000 $193.6m
Domestic Overnight 2,873,000 1,583,000 996,000 203,000 $1,800.7m
TOTAL 3,130,000 1,777,000 1,050,000 209,000 $1,994.3m
Trend % change
-10.0%
-5.0%
0.0%
5.0%
10.0%
15.0%
20.0%
07 08 09 10 11 12 13 14 15
Annual % Change in Total Visitation
Brisbane Queensland
Sunshine Coast Regional Snapshot
For the year ended June 2013, the number ofdomestic visitors to Brisbane increased 2%. Thiswas the result of growth in intrastate visitation, asthe number of interstate visitors declined.
The intrastate increase was driven by stronggrowth in holiday visitors from within the Brisbaneregion as well as the resource regions of SQC andCentral Queensland. There were also gains due tointrastate business travel from CentralQueensland and the Sunshine Coast.
Interstate holiday and VFR travel to Brisbaneincreased, however there was a large decline ininterstate business travel, particularly from NSWand Victoria, which resulted in the overallinterstate decline.
The decline in interstate business travel is part ofthe normalising of interstate business travelfollowing the spikes created over the last threeyears by natural disaster recovery programs andresource related construction projects.
The number of international visitors to Brisbanegrew markedly over the year ended June 2013.
Overall growth reached 10%, including a nearuniversal increase in visitors from every keysource market. This general increase was alsoevident in every type of purpose, including thenumber of holiday visitors which increased 14%.The proportion of international holiday visitorsincreased to 50% of all international visitors toBrisbane.
China continued to have the highest growth ofall Brisbane source markets, increasing by 19%over the year. Direct flights from the USA toBrisbane continued to improve annual visitationwith a 20% increase in visitors and a 68%increase in visitor nights. Visitors from the UKincreased 9% and visitor nights improved 36%, astheir domestic economy continued a tentativerecovery from the GFC. Brisbane also had awelcome increase in Japanese visitation, whichlifted 35%.
0
6
12
18
24
0
1,000
2,000
3,000
4,000
5,000
6,000
06 07 08 09 10 11 12 13 14 15
Qld visitors (m
illion)
Vis
itors
(00
0)
Domestic Visitors
Brisbane Queensland
0.0
5.0
10.0
15.0
20.0
25.0
0
1
2
3
4
5
06 07 08 09 10 11 12 13 14 15
International NightsD
omes
tic N
ight
s
Average Length of Stay (ALoS)Intrastate Interstate International
The average length of stay for domesticvisitors to Brisbane remained unchanged overthe year. Both intrastate and interstate lengthof stay remained stable, however the numberof visitor nights grew, particularly holiday andVFR.
The average length of stay for internationalvisitors to Brisbane grew slightly to 21 nights,including holiday visitors which increased to12.4 nights.
Though the number of internationalbusiness visitors grew 2%, the number ofinternational business nights grew 26% (ormore than 200 000 nights) over the year. Thislifted the average length of stay of businesstravellers to 7.7 nights. Singapore had theopposite effect with an increase in visitors of20%, however only a 1% increase in visitornights.
The overall increase in visitor nightscontributed to international expendituregrowth of 6%.
Research UpdatesTo receive an email alert whenever new tourism
figures are released click here
There were 6,096,000 international and domesticovernight visitors to Brisbane in the year endedJune 2013, this was a increase of 3% on the yearended June 2012.
Intrastate50.3%
Interstate33.3%
International16.5%
0
500
1,000
1,500
2,000
2,500
0
200
400
600
800
1,000
1,200
06 07 08 09 10 11 12 13 14 15
Vis
itors
(00
0)
International Visitors
Brisbane Queensland
Qld visitors (0
00
)
www.tq.com.au/research
Sunshine Coast Regional Snapshot
Year Ending JuneYear Ending JuneYear Ending June
Year Ending June
Sunshine Coast Regional Snapshot, Year Ending June 2015
-10.0%
-5.0%
0.0%
5.0%
10.0%
15.0%
20.0%
07 08 09 10 11 12 13 14 15
Annual % Change in Total Visitation
Brisbane Queensland
For the year ended June 2013, the number ofdomestic visitors to Brisbane increased 2%. Thiswas the result of growth in intrastate visitation, asthe number of interstate visitors declined.
The intrastate increase was driven by stronggrowth in holiday visitors from within the Brisbaneregion as well as the resource regions of SQC andCentral Queensland. There were also gains due tointrastate business travel from CentralQueensland and the Sunshine Coast.
Interstate holiday and VFR travel to Brisbaneincreased, however there was a large decline ininterstate business travel, particularly from NSWand Victoria, which resulted in the overallinterstate decline.
The decline in interstate business travel is part ofthe normalising of interstate business travelfollowing the spikes created over the last threeyears by natural disaster recovery programs andresource related construction projects.
The number of international visitors to Brisbanegrew markedly over the year ended June 2013.
Overall growth reached 10%, including a nearuniversal increase in visitors from every keysource market. This general increase was alsoevident in every type of purpose, including thenumber of holiday visitors which increased 14%.The proportion of international holiday visitorsincreased to 50% of all international visitors toBrisbane.
China continued to have the highest growth ofall Brisbane source markets, increasing by 19%over the year. Direct flights from the USA toBrisbane continued to improve annual visitationwith a 20% increase in visitors and a 68%increase in visitor nights. Visitors from the UKincreased 9% and visitor nights improved 36%, astheir domestic economy continued a tentativerecovery from the GFC. Brisbane also had awelcome increase in Japanese visitation, whichlifted 35%.
0
6
12
18
24
3,000
3,100
3,200
3,300
3,400
3,500
3,600
3,700
3,800
06 07 08 09 10 11 12 13 14 15
Qld visitors (m
illion)
Vis
itors
(00
0)
Domestic Visitors
Gold Coast Queensland
0.0
5.0
10.0
15.0
20.0
25.0
0
1
2
3
4
5
06 07 08 09 10 11 12 13 14 15
International NightsD
omes
tic N
ight
s
Average Length of Stay (ALoS)Intrastate Interstate International
The average length of stay for domesticvisitors to Brisbane remained unchanged overthe year. Both intrastate and interstate lengthof stay remained stable, however the numberof visitor nights grew, particularly holiday andVFR.
The average length of stay for internationalvisitors to Brisbane grew slightly to 21 nights,including holiday visitors which increased to12.4 nights.
Though the number of internationalbusiness visitors grew 2%, the number ofinternational business nights grew 26% (ormore than 200 000 nights) over the year. Thislifted the average length of stay of businesstravellers to 7.7 nights. Singapore had theopposite effect with an increase in visitors of20%, however only a 1% increase in visitornights.
The overall increase in visitor nightscontributed to international expendituregrowth of 6%.
Research UpdatesTo receive an email alert whenever new tourism
figures are released click here
There were 6,096,000 international and domesticovernight visitors to Brisbane in the year endedJune 2013, this was a increase of 3% on the yearended June 2012.
Intrastate50.3%
Interstate33.3%
International16.5%
0
500
1,000
1,500
2,000
2,500
0
200
400
600
800
1,000
1,200
06 07 08 09 10 11 12 13 14 15
Vis
itors
(00
0)
International Visitors
Brisbane Queensland
Qld visitors (0
00
)
www.tq.com.au/research
Year Ending JuneYear Ending JuneYear Ending June
Year Ending June
Sunshine Coast Regional Snapshot, Year Ending June 2015
-15%
-10%
-5%
0%
5%
10%
15%
08 09 10 11 12 13 14 15
Annual % Change in Total Visitation
Sunshine Coast Queensland
0
5
10
15
20
25
0
500
1,000
1,500
2,000
2,500
3,000
3,500
07 08 09 10 11 12 13 14 15
Qld
Visitors (m
illion)
Su
nsh
ine
Coa
st V
isito
rs (0
00
)
Domestic VisitorsSunshine Coast Queensland
0.0
2.0
4.0
6.0
8.0
10.0
12.0
14.0
0.0
1.0
2.0
3.0
4.0
5.0
6.0
7.0
8.0
9.0
07 08 09 10 11 12 13 14 15
International NightsD
omes
tic N
ight
s
Average Length of Stay (ALoS)
Intrastate Interstate International
Research UpdatesTo receive an email alert whenever new tourism
figures are released click here
There were 3,130,000 international anddomestic overnight visitors to the SunshineCoast in the year ended June 2015, this was anincrease of 3.4% on the year ended June 2014.
Intrastate70.8%
Interstate21.0%
International8.2%
0.0
0.5
1.0
1.5
2.0
2.5
0
50
100
150
200
250
300
350
07 08 09 10 11 12 13 14 15
Sun
shin
e C
oast
Vis
itors
(00
0)
International VisitorsSunshine Coast Queensland
Qld visito
rs(m
illion)
www.teq.queensland.com
Year Ending JuneYear Ending JuneYear Ending June
Year Ending June
Sunshine Coast Regional Snapshot, Year Ending June 2015
The number of domestic visitors to the SunshineCoast increased 2.8% in the year ending June 2015.Holiday visitors increased 1.7% and now accountsfor 55.1% of all domestic visitors to the SunshineCoast. Business visitors increased 26.9%, whichwas consistent with strong business growthnationally. This growth was however, off a lowbase as Business travel only contributes 7.1% of alldomestic visitors to the region.
Interstate visitors to the Sunshine Coast declined4.2% and made up 22.8% of all domestic visitors.The number of interstate holiday visitors wasessentially stable however VFR declined slightly.Intrastate visitors grew 5.1% overall including a2.9% lift in intrastate holiday visitors. Both VFR andbusiness visitors had strong increases as well.
For the year ended June 2015, Brisbaneremained the largest domestic source market forvisitors to the Sunshine Coast with 48.4% andRegional Queensland is second with 28.8%. Interms of nights however, interstate visitors are thelargest single source market witha 37.8% share ofthe total domestic nights spent in the region.
There was a solid increase of 10.6% in thenumber of international visitors to the SunshineCoast for the year ended June 2015. This includeda 10.4% increase in international holiday visitorswhich resulted in a 75.7% share of totalinternational visitors to the region.. The largest source market for the SunshineCoast in the year ended June 2015 was theUnited Kingdom (UK) with a share of 22.9%. UKholiday visitors to the Sunshine Coast increased27.6% due in part to the strength of theAustralia's Nature Coast initiative. Importantly,the UK was also the number one internationalsource market for visitor nights with 23.3% share.
New Zealand was the second largestinternational source market for the SunshineCoast with the number of overall visitorsremaining stable. With 30.6% growth in visitornumbers, Germany remained the third largestsource market with a 12.4% share of internationalvisitors.
International visitor nights declined 7.0%,including a 5.6% decrease in holiday visitornights.
Overall, domestic visitors to the SunshineCoast shortened their average length of stayby 2.6%, as visitor night growth was slightlyless than the growth in visitors. Interstatevisitors stayed an average of 6.2 nights andintrastate visitors stayed 3.0 nights.
Despite the slight loss of average length ofstay, overall domestic visitor expenditureincreased 3.1% to $1.8 billion, including a 6.5%increase in Sunshine Coast domestic holidayvisitor expenditure.
Internationally, a rise in overall visitorsoccurred at the same time as a sharp rise invisitor nights for Education and Employmentvisitors, which lifted overall internationalvisitor nights by 28.1%. This combinationresulted in a 10.9% increase in the overallaverage length of stay.
These additional visitors and nightsincreased international overnight visitorexpenditure by 17.0%.
Domestic ResultsThe number of domestic visitors to the Sunshine Coast increased 2.8% in the year ending June 2015. Holiday visitors increased 1.7% and now accounts for 55.1% of all domestic visitors to the Sunshine Coast. Business visitors increased 26.9%, which was consistent with strong business growth nationally. Day trips was stable and reached 5.3 million visitors.
International ResultsThere was a solid increase of 10.6% in the number of international visitors to the Sunshine Coast for the year ended June 2015. This included a 10.4% increase in international holiday visitors which resulted in a 75.7% share of total international visitors to the region. The largest source market for the Sunshine Coast in the last year ended June 2015 was the United Kingdom (UK) with a share of 22.9%
ExpenditureDespite the slight loss of average length of stay, overall domestic visitor expenditure increased 3.1% to $1.8 billion, including a 6.5% increase in Sunshine Coast domestic holiday visitor expenditure.
* Source: Sunshine Coast Regional Tourism Snapshot, year ending June 2015
Tourism and Events Queensland
Year ending June 2015
8 Sunshine Coast Destination Limited Annual Report 2014/2015 Sunshine Coast Destination Limited Annual Report 2014/2015 9
Membership
Overview
SCDL undertook a major review of the membership model and introduced a new structure that aligned to the outcomes of the Membership Satisfaction Survey conducted the year prior. Membership still remains at the highest level of any RTO in Queensland with 636 active members.
Members by Region 2014/2015
Members by Level 2014/2015
Tina Grey (Oaks Hotels), Gaynor Grimshaw (Sea Life) &
Emma Buckingham (Rumba Resort Caloundra)
Conversations for industry with SCDL and TEQ staff
Air New Zealand flying into the Sunshine Coast
Aviation
Overview
Sunshine Coast Airport (SCA) provides key access for the region. A strategic approach to route development is essential to increase passenger numbers and visitation to the region. The region’s ability to grow inbound passenger numbers is dependent on two key factors:
1. Successful marketing of existing air capacity into the region.
2. Effective leveraging of the partnership between SCDL and SCA to support existing direct routes, connections and the development of new services.
• During 2014/2015, airline partners Jetstar, Virgin Australia and Air New Zealand offered over 60 flights per week to Sydney, Melbourne and Auckland.
• Capacity was affected by the suspension of Tigerair Melbourne services in July 2014 and overall passenger numbers decreased by 5.6% year-on-year with 852,000 passenger movements during the financial year.
• Despite lower passenger numbers, SCA flights were in high demand with an average load factor of 83%. Jetstar and Virgin Australia continued to increase services to Melbourne to cater for underlying demand.
International
Air New Zealand commenced their fourth year of direct Auckland to Sunshine Coast services and announced an extended season providing greater choice for New Zealanders wishing to holiday on the Sunshine Coast.
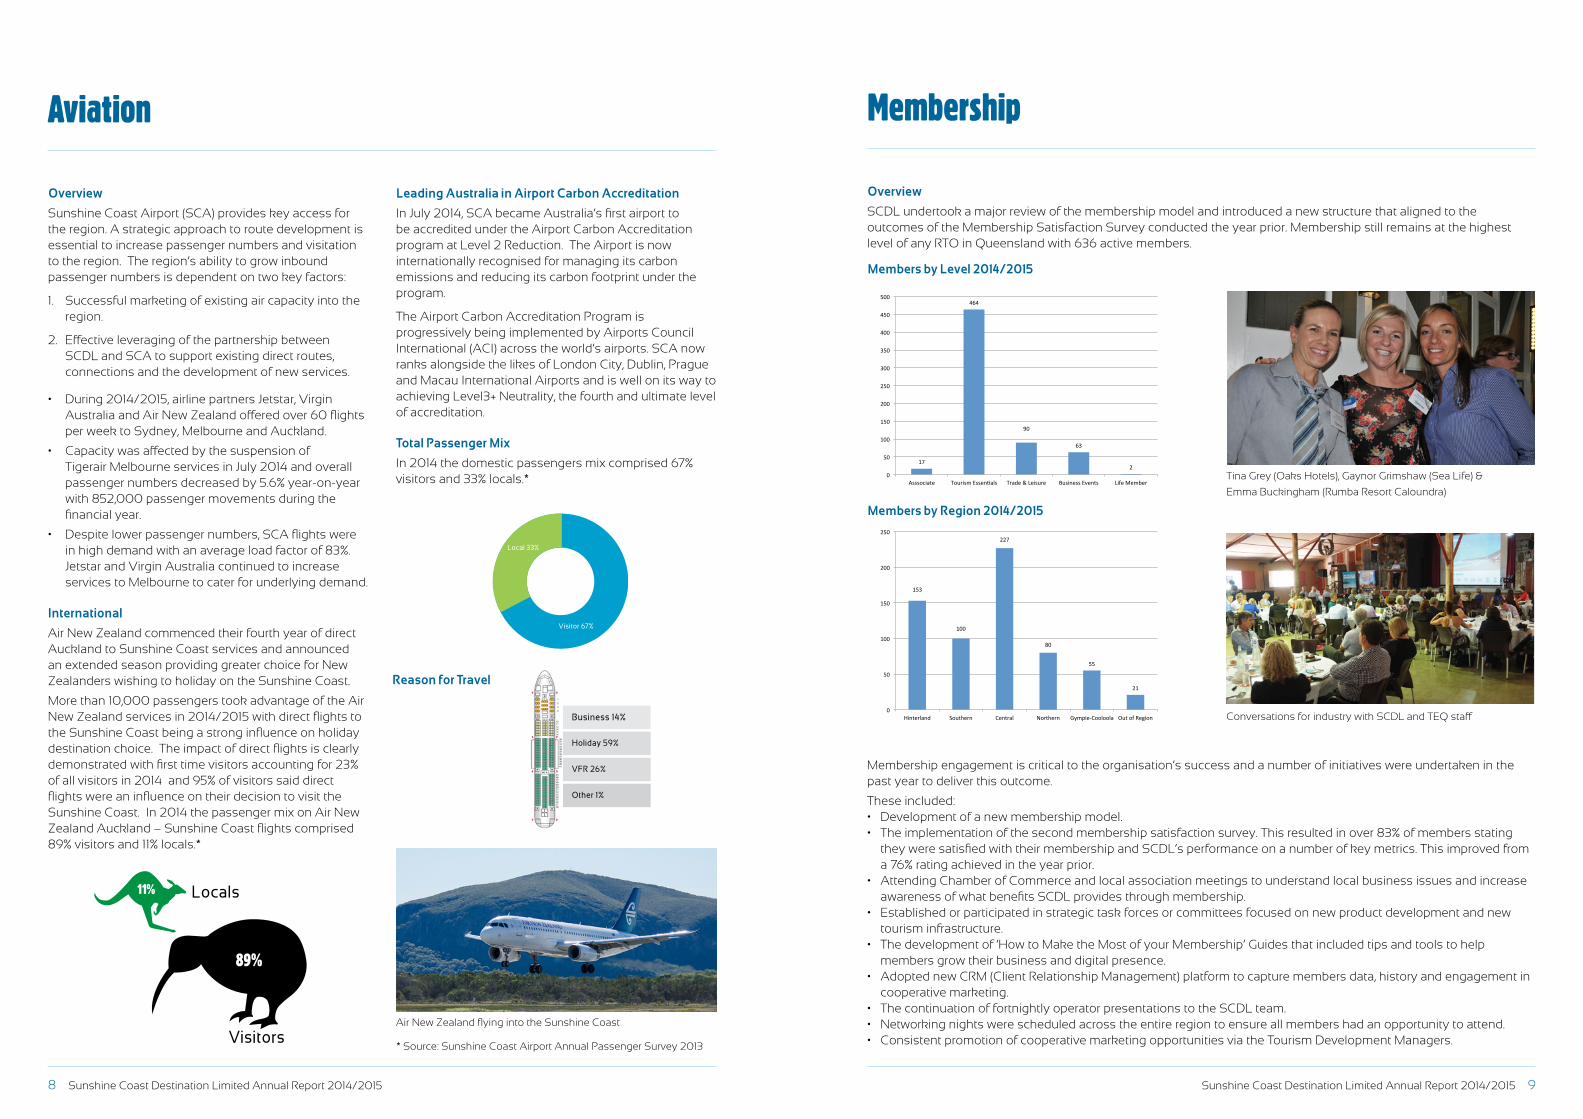
More than 10,000 passengers took advantage of the Air New Zealand services in 2014/2015 with direct flights to the Sunshine Coast being a strong influence on holiday destination choice. The impact of direct flights is clearly demonstrated with first time visitors accounting for 23% of all visitors in 2014 and 95% of visitors said direct flights were an influence on their decision to visit the Sunshine Coast. In 2014 the passenger mix on Air New Zealand Auckland – Sunshine Coast flights comprised 89% visitors and 11% locals.*
* Source: Sunshine Coast Airport Annual Passenger Survey 2013
Leading Australia in Airport Carbon Accreditation
In July 2014, SCA became Australia’s first airport to be accredited under the Airport Carbon Accreditation program at Level 2 Reduction. The Airport is now internationally recognised for managing its carbon emissions and reducing its carbon footprint under the program.
The Airport Carbon Accreditation Program is progressively being implemented by Airports Council International (ACI) across the world’s airports. SCA now ranks alongside the likes of London City, Dublin, Prague and Macau International Airports and is well on its way to achieving Level3+ Neutrality, the fourth and ultimate level of accreditation.
Total Passenger Mix
In 2014 the domestic passengers mix comprised 67% visitors and 33% locals.*
89%
Visitors
Locals11%
Local 33%
Visitor 67%
Holiday 59%
VFR 26%
Other 1%
Business 14%
Membership engagement is critical to the organisation’s success and a number of initiatives were undertaken in the past year to deliver this outcome.
These included:• Development of a new membership model.• The implementation of the second membership satisfaction survey. This resulted in over 83% of members stating
they were satisfied with their membership and SCDL’s performance on a number of key metrics. This improved from a 76% rating achieved in the year prior.
• Attending Chamber of Commerce and local association meetings to understand local business issues and increase awareness of what benefits SCDL provides through membership.
• Established or participated in strategic task forces or committees focused on new product development and new tourism infrastructure.
• The development of ‘How to Make the Most of your Membership’ Guides that included tips and tools to help members grow their business and digital presence.
• Adopted new CRM (Client Relationship Management) platform to capture members data, history and engagement in cooperative marketing.
• The continuation of fortnightly operator presentations to the SCDL team.• Networking nights were scheduled across the entire region to ensure all members had an opportunity to attend. • Consistent promotion of cooperative marketing opportunities via the Tourism Development Managers.
21/10/2015 3:03 PM
17
464
90
63
2 0
50
100
150
200
250
300
350
400
450
500
Asssociate Tourism Essen9als Trade & Leisure Business Events Life Member
153
100
227
80
55
21
0
50
100
150
200
250
Hinterland Southern Central Northern Gympie-‐Cooloola Out of Region
21/10/2015 3:03 PM
17
464
90
63
2 0
50
100
150
200
250
300
350
400
450
500
Asssociate Tourism Essen9als Trade & Leisure Business Events Life Member
153
100
227
80
55
21
0
50
100
150
200
250
Hinterland Southern Central Northern Gympie-‐Cooloola Out of Region
Reason for Travel
10 Sunshine Coast Destination Limited Annual Report 2014/2015 Sunshine Coast Destination Limited Annual Report 2014/2015 11
Outdoor adventureWhether you are looking for an adrenalin rush, or just a whole lot of fun with your friends - you’ll find endless activities to keep your blood pumping in the great outdoors.
Natural highThere are many hiking trails throughout the Sunshine Coast that are suitable for walkers of all levels of fitness, from steep paths that offer breathtaking mountain views, to easy strolls through bushland. An area of particular interest for experienced hikers is the Glass House Mountains, while other peaks worth climbing include Mount Cooroy, Mount Coolum and Mount Cooroora in Pomona, which is home to the annual ‘King of the Mountain’ race.
Up in the airFly down the river on a jet ski, sail down the side of a rock face, defy gravity as you kite board across the waves - experience the lighter side of Sunshine Coast life. For a truly heart-stopping experience, head to Caloundra, Coolum or Rainbow Beach and sky dive from 15,000 feet.
24 visitsunshinecoast.com.au
25
Did you know?Mount Coolum is the world’s second largest rock behind the world famous Uluru. This spectacular volcanic dome is a favourite climbing spot for locals and visitors mainly due to the panoramic coastal views at the top.
Beach highwayIf you want to get off the beaten track, head for the Great Sandy National Park and take to the beach in your four-wheel drive (4WD). Cruise along the shoreline, marvel at the coastal cliffs and some coloured sands, throw in your fishing line and catch yourself dinner. You’ll need a vehicle permit to drive along the sand and there are some places where camping is restricted, so be sure to check the signs before you set off on your adventure.
Under the starsPitch a tent or park your campervan and enjoy the serenity of one of the many quiet camping grounds dotted around the Coast, from beachside caravan parks where the kids can make new friends, to tucked-away places in the hinterland where you can share your site with kangaroos and possums. For a true nature-lovers’ getaway, pack your camping gear and head to the world
Fraser Island
Skydiving, Bulcock BeachMount Coolum
Whale watching, Whale One
Water lifeWater life is synonymous with the Sunshine Coast.
8 visitsunshinecoast.com.au
Did you know?The Sunshine Coast is a fantastic
viewing platform to watch the
whales migrate north. 9
Under the water
Each year more than 8,000 humpback whales travel
along the east coast of Australia as part of their migration.
Due to its location, the Sunshine Coast is an ideal place
to view these magnificent marine creatures as they swim
past. You will be able to see them frolicking with their
young from various locations including Point Arkwright,
Point Cartwright, Mount Coolum, Point Perry, Moffat
Headland, Alexandra Headland and within the Noosa
National Park. Whale watching cruises operate from June
to November, allowing you to get a closer look at the
humpbacks and Sunreef Mooloolaba also offers the
amazing opportunity to swim with the whales.
Other experiences to add to your ‘to do’ list include
feeding the dolphins at Tin Can Bay, diving down to the
wreck of ex-HMAS Brisbane, or diving at Wolf Rock with
grey nurse sharks.
On the water
If you are looking for fun on the water - surfing, swimming
or cruising - you will find it on the Sunshine Coast. Feel
the rush as you sail, jet ski or water ski through clear,
clean water, or fly across the waves on a kite board.
Hire a tinnie or join a charter and take the family on a
fishing adventure, or get to know the local birdlife as you
paddle board or kayak around one of the region’s quiet
lakes.
Tidal info
Play it safe on and around the water by checking
the latest tidal information and weather conditions at
coastwatch.com.au
Pumicestone Passage, Caloundra
The Spit, Mooloolaba
ex-HMAS Brisbane
Marketing Marketing
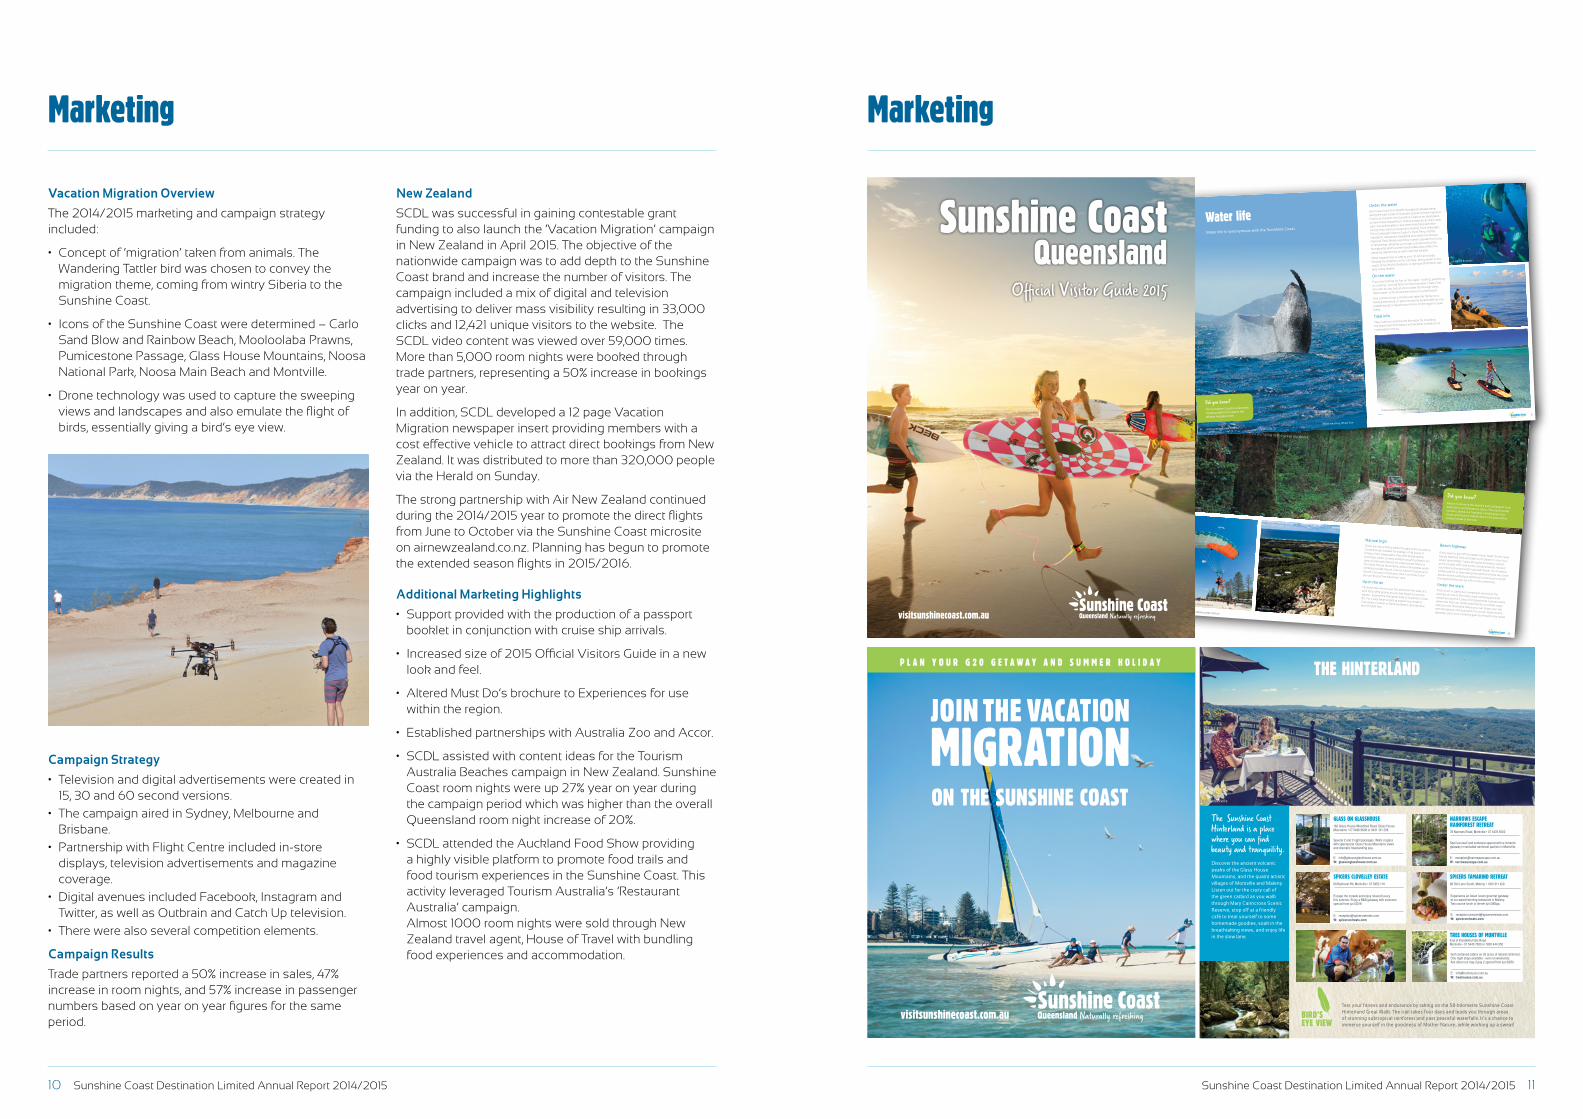
Vacation Migration Overview
The 2014/2015 marketing and campaign strategy included:
• Concept of ‘migration’ taken from animals. The Wandering Tattler bird was chosen to convey the migration theme, coming from wintry Siberia to the Sunshine Coast.
• Icons of the Sunshine Coast were determined – Carlo Sand Blow and Rainbow Beach, Mooloolaba Prawns, Pumicestone Passage, Glass House Mountains, Noosa National Park, Noosa Main Beach and Montville.
• Drone technology was used to capture the sweeping views and landscapes and also emulate the flight of birds, essentially giving a bird’s eye view.
Campaign Strategy
• Television and digital advertisements were created in 15, 30 and 60 second versions.
• The campaign aired in Sydney, Melbourne and Brisbane.
• Partnership with Flight Centre included in-store displays, television advertisements and magazine coverage.
• Digital avenues included Facebook, Instagram and Twitter, as well as Outbrain and Catch Up television.
• There were also several competition elements.
Campaign Results
Trade partners reported a 50% increase in sales, 47% increase in room nights, and 57% increase in passenger numbers based on year on year figures for the same period.
New Zealand
SCDL was successful in gaining contestable grant funding to also launch the ‘Vacation Migration’ campaign in New Zealand in April 2015. The objective of the nationwide campaign was to add depth to the Sunshine Coast brand and increase the number of visitors. The campaign included a mix of digital and television advertising to deliver mass visibility resulting in 33,000 clicks and 12,421 unique visitors to the website. The SCDL video content was viewed over 59,000 times. More than 5,000 room nights were booked through trade partners, representing a 50% increase in bookings year on year.
In addition, SCDL developed a 12 page Vacation Migration newspaper insert providing members with a cost effective vehicle to attract direct bookings from New Zealand. It was distributed to more than 320,000 people via the Herald on Sunday.
The strong partnership with Air New Zealand continued during the 2014/2015 year to promote the direct flights from June to October via the Sunshine Coast microsite on airnewzealand.co.nz. Planning has begun to promote the extended season flights in 2015/2016.
Additional Marketing Highlights
• Support provided with the production of a passport booklet in conjunction with cruise ship arrivals.
• Increased size of 2015 Official Visitors Guide in a new look and feel.
• Altered Must Do’s brochure to Experiences for use within the region.
• Established partnerships with Australia Zoo and Accor.
• SCDL assisted with content ideas for the Tourism Australia Beaches campaign in New Zealand. Sunshine Coast room nights were up 27% year on year during the campaign period which was higher than the overall Queensland room night increase of 20%.
• SCDL attended the Auckland Food Show providing a highly visible platform to promote food trails and food tourism experiences in the Sunshine Coast. This activity leveraged Tourism Australia’s ‘Restaurant Australia’ campaign.
Almost 1000 room nights were sold through New Zealand travel agent, House of Travel with bundling food experiences and accommodation.
Sunshine CoastOfficial Visitor Guide 2015
Queensland
visitsunshinecoast.com.au
MIGRATION JOIN THE VACATION
ON THE SUNSHINE COAST
P L A N Y O U R G 2 0 G E T A W A Y A N D S U M M E R H O L I D A Y
visitsunshinecoast.com.au
GOLF
GYMPIE TO COOLOOLA
182 Glass House-Woodford Road, Glass House Mountains • 07 5496 9608 or 0431 101 208
E: [email protected]: glassonglasshouse.com.au
Special 2 and 3 night packages. Walls of glass with spectacular Glass House Mountains views and dramatic freestanding spa.
Glass on Glasshouse
78 Narrows Road, Montville • 07 5478 5000
E: [email protected]: narrowsescape.com.au
Spoil yourself and someone special with a romantic getaway in secluded rainforest pavilion in Montville.
narrows escape rainforest retreat
68 Balmoral Rd, Montville • 07 5452 1111
E: [email protected]: spicersretreats.com
Escape the crowds and enjoy relaxed luxury this summer. Enjoy a B&B getaway with someone special from just $319.
spicers clovelley estate88 Obi Lane South, Maleny • 1300 311 429
E: [email protected]: spicersretreats.com
Experience an Asian fusion gourmet getaway at our award-winning restaurant in Maleny. Two course lunch or dinner just $65pp.
spicers tamarind retreat
tree houses of montvilleEnd of Kondalilla Falls Road Montville • 07 5445 7650 or 1800 444 350
E: [email protected]: treehouses.com.au
Self contained cabins on 20 acres of natural rainforest. One night stays available - even on weekends. Ask about our stay 3 pay 2 special from just $350.
THE HINTERLAND
The Sunshine Coast Hinterland is a place where you can find beauty and tranquility.Discover the ancient volcanic peaks of the Glass House Mountains, and the quaint artistic villages of Montville and Maleny. Listen out for the crazy call of the green catbird as you walk through Mary Cairncross Scenic Reserve, stop off at a friendly café to treat yourself to some homemade goodies, soak in the breathtaking views, and enjoy life in the slow lane.
Test your fitness and endurance by taking on the 58-kilometre Sunshine Coast Hinterland Great Walk. The trail takes four days and leads you through areas of stunning subtropical rainforest and past peaceful waterfalls. It’s a chance to immerse yourself in the goodness of Mother Nature...while working up a sweat!
BIRD’S EYE VIEW
8
Montville
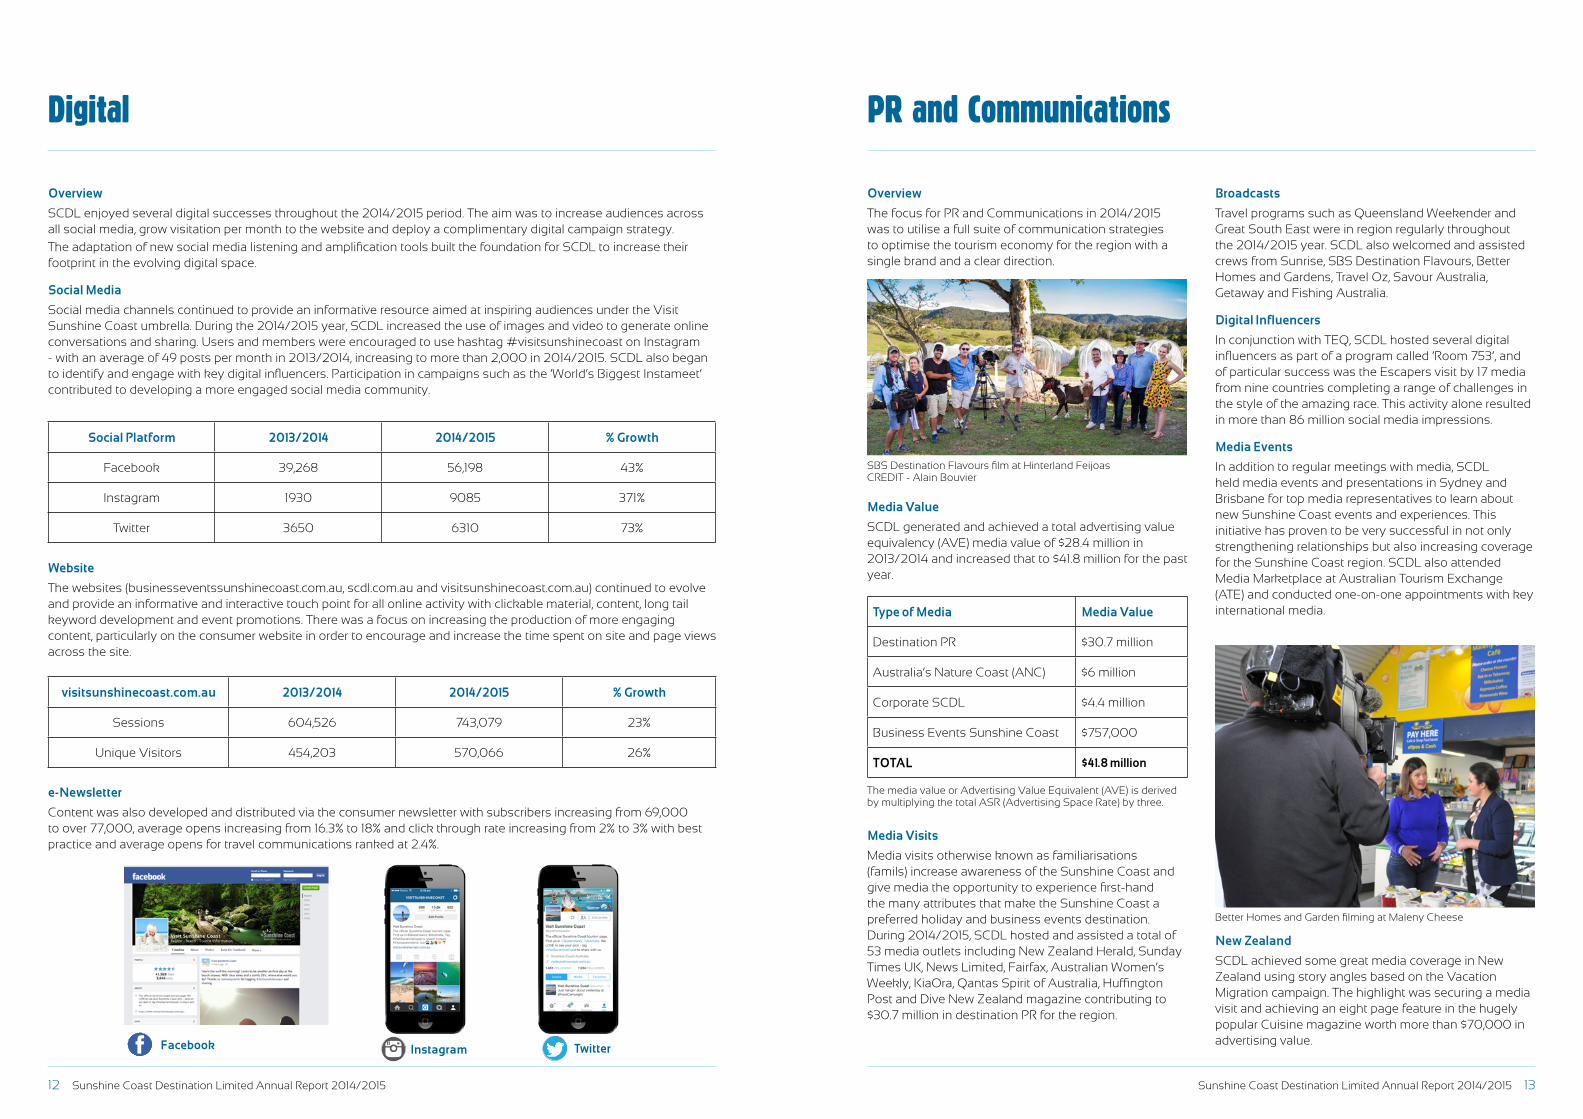
12 Sunshine Coast Destination Limited Annual Report 2014/2015 Sunshine Coast Destination Limited Annual Report 2014/2015 13
Digital
Overview
SCDL enjoyed several digital successes throughout the 2014/2015 period. The aim was to increase audiences across all social media, grow visitation per month to the website and deploy a complimentary digital campaign strategy.
The adaptation of new social media listening and amplification tools built the foundation for SCDL to increase their footprint in the evolving digital space.
Social Media
Social media channels continued to provide an informative resource aimed at inspiring audiences under the Visit Sunshine Coast umbrella. During the 2014/2015 year, SCDL increased the use of images and video to generate online conversations and sharing. Users and members were encouraged to use hashtag #visitsunshinecoast on Instagram - with an average of 49 posts per month in 2013/2014, increasing to more than 2,000 in 2014/2015. SCDL also began to identify and engage with key digital influencers. Participation in campaigns such as the ‘World’s Biggest Instameet’ contributed to developing a more engaged social media community.
Website
The websites (businesseventssunshinecoast.com.au, scdl.com.au and visitsunshinecoast.com.au) continued to evolve and provide an informative and interactive touch point for all online activity with clickable material, content, long tail keyword development and event promotions. There was a focus on increasing the production of more engaging content, particularly on the consumer website in order to encourage and increase the time spent on site and page views across the site.
e-Newsletter
Content was also developed and distributed via the consumer newsletter with subscribers increasing from 69,000 to over 77,000, average opens increasing from 16.3% to 18% and click through rate increasing from 2% to 3% with best practice and average opens for travel communications ranked at 2.4%.
PR and Communications
Overview
The focus for PR and Communications in 2014/2015 was to utilise a full suite of communication strategies to optimise the tourism economy for the region with a single brand and a clear direction.
Media Value
SCDL generated and achieved a total advertising value equivalency (AVE) media value of $28.4 million in 2013/2014 and increased that to $41.8 million for the past year.
Media Visits
Media visits otherwise known as familiarisations (famils) increase awareness of the Sunshine Coast and give media the opportunity to experience first-hand the many attributes that make the Sunshine Coast a preferred holiday and business events destination. During 2014/2015, SCDL hosted and assisted a total of 53 media outlets including New Zealand Herald, Sunday Times UK, News Limited, Fairfax, Australian Women’s Weekly, KiaOra, Qantas Spirit of Australia, Huffington Post and Dive New Zealand magazine contributing to $30.7 million in destination PR for the region.
Broadcasts
Travel programs such as Queensland Weekender and Great South East were in region regularly throughout the 2014/2015 year. SCDL also welcomed and assisted crews from Sunrise, SBS Destination Flavours, Better Homes and Gardens, Travel Oz, Savour Australia, Getaway and Fishing Australia.
Digital Influencers
In conjunction with TEQ, SCDL hosted several digital influencers as part of a program called ‘Room 753’, and of particular success was the Escapers visit by 17 media from nine countries completing a range of challenges in the style of the amazing race. This activity alone resulted in more than 86 million social media impressions.
Media Events
In addition to regular meetings with media, SCDL held media events and presentations in Sydney and Brisbane for top media representatives to learn about new Sunshine Coast events and experiences. This initiative has proven to be very successful in not only strengthening relationships but also increasing coverage for the Sunshine Coast region. SCDL also attended Media Marketplace at Australian Tourism Exchange (ATE) and conducted one-on-one appointments with key international media.
New Zealand
SCDL achieved some great media coverage in New Zealand using story angles based on the Vacation Migration campaign. The highlight was securing a media visit and achieving an eight page feature in the hugely popular Cuisine magazine worth more than $70,000 in advertising value.
SBS Destination Flavours film at Hinterland FeijoasCREDIT - Alain Bouvier
The media value or Advertising Value Equivalent (AVE) is derived by multiplying the total ASR (Advertising Space Rate) by three.
Better Homes and Garden filming at Maleny Cheese
Social Platform 2013/2014 2014/2015 % Growth
Facebook 39,268 56,198 43%
Instagram 1930 9085 371%
Twitter 3650 6310 73%
visitsunshinecoast.com.au 2013/2014 2014/2015 % Growth
Sessions 604,526 743,079 23%
Unique Visitors 454,203 570,066 26%
Type of Media Media Value
Destination PR $30.7 million
Australia’s Nature Coast (ANC) $6 million
Corporate SCDL $4.4 million
Business Events Sunshine Coast $757,000
TOTAL $41.8 million
Facebook Instagram Twitter
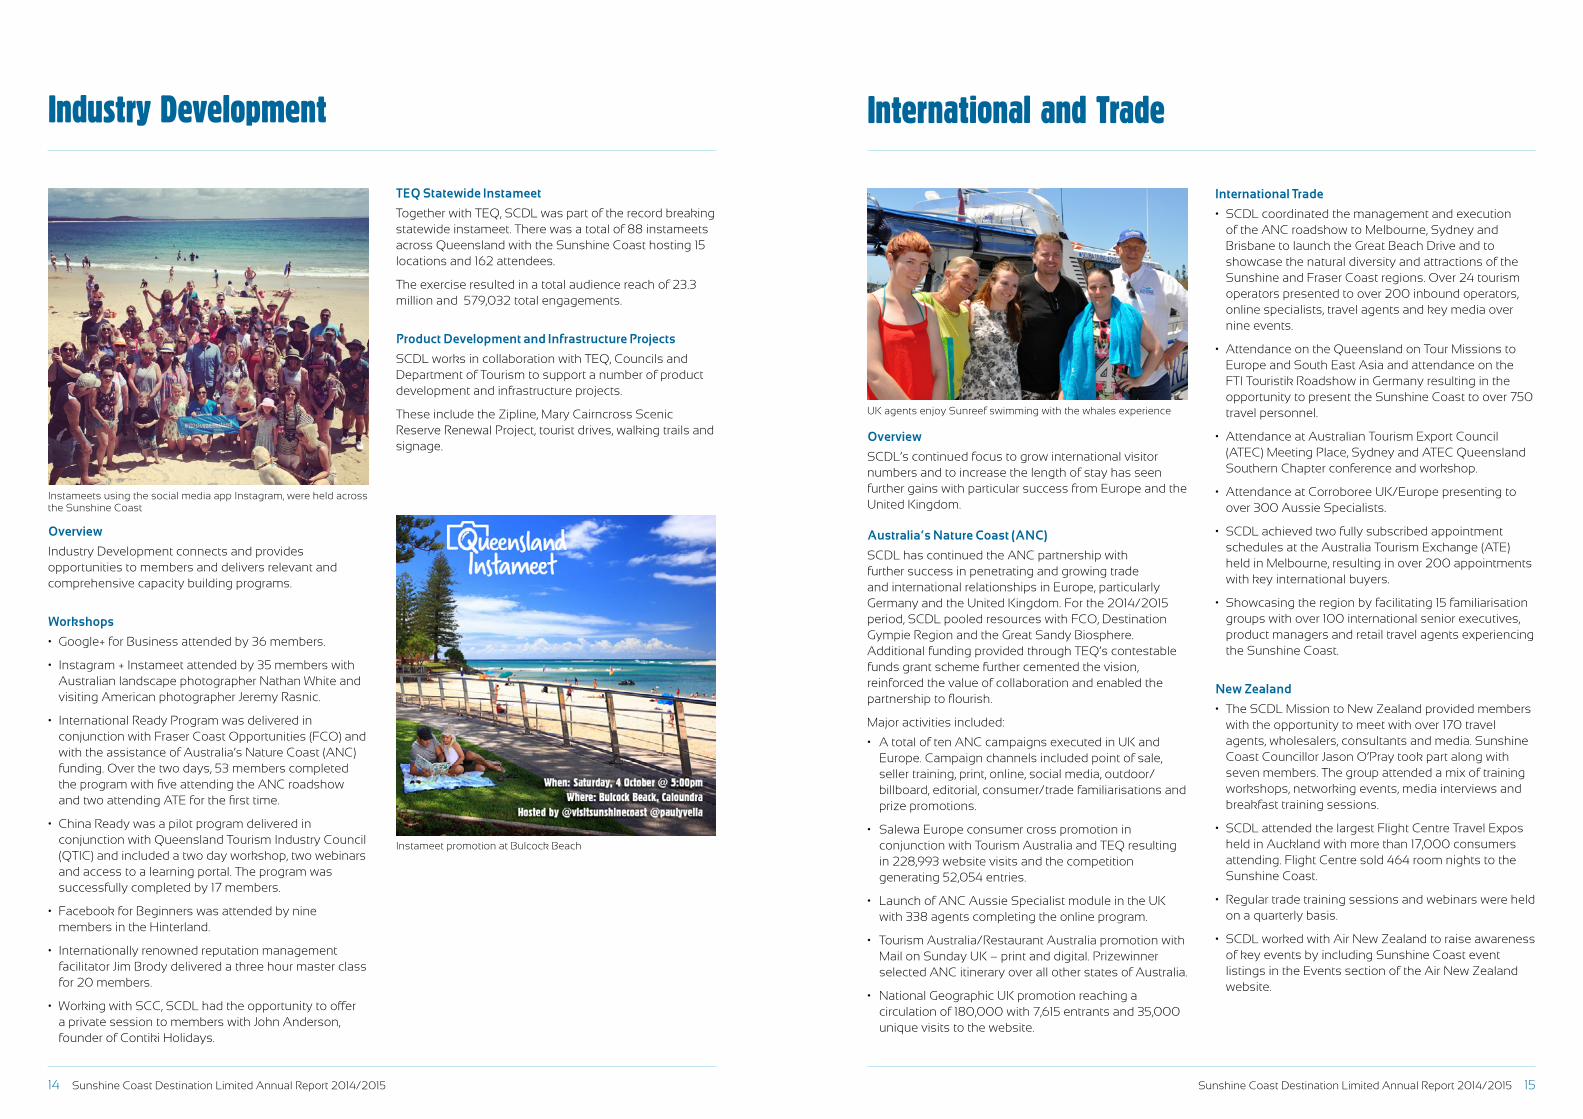
14 Sunshine Coast Destination Limited Annual Report 2014/2015 Sunshine Coast Destination Limited Annual Report 2014/2015 15
Industry Development
Overview
Industry Development connects and provides opportunities to members and delivers relevant and comprehensive capacity building programs.
Workshops
• Google+ for Business attended by 36 members.
• Instagram + Instameet attended by 35 members with Australian landscape photographer Nathan White and visiting American photographer Jeremy Rasnic.
• International Ready Program was delivered in conjunction with Fraser Coast Opportunities (FCO) and with the assistance of Australia’s Nature Coast (ANC) funding. Over the two days, 53 members completed the program with five attending the ANC roadshow and two attending ATE for the first time.
• China Ready was a pilot program delivered in conjunction with Queensland Tourism Industry Council (QTIC) and included a two day workshop, two webinars and access to a learning portal. The program was successfully completed by 17 members.
• Facebook for Beginners was attended by nine members in the Hinterland.
• Internationally renowned reputation management facilitator Jim Brody delivered a three hour master class for 20 members.
• Working with SCC, SCDL had the opportunity to offer a private session to members with John Anderson, founder of Contiki Holidays.
TEQ Statewide Instameet
Together with TEQ, SCDL was part of the record breaking statewide instameet. There was a total of 88 instameets across Queensland with the Sunshine Coast hosting 15 locations and 162 attendees.
The exercise resulted in a total audience reach of 23.3 million and 579,032 total engagements.
Product Development and Infrastructure Projects
SCDL works in collaboration with TEQ, Councils and Department of Tourism to support a number of product development and infrastructure projects.
These include the Zipline, Mary Cairncross Scenic Reserve Renewal Project, tourist drives, walking trails and signage.
Instameets using the social media app Instagram, were held across the Sunshine Coast
Instameet promotion at Bulcock Beach
International and Trade
Overview
SCDL’s continued focus to grow international visitor numbers and to increase the length of stay has seen further gains with particular success from Europe and the United Kingdom.
Australia’s Nature Coast (ANC)
SCDL has continued the ANC partnership with further success in penetrating and growing trade and international relationships in Europe, particularly Germany and the United Kingdom. For the 2014/2015 period, SCDL pooled resources with FCO, Destination Gympie Region and the Great Sandy Biosphere. Additional funding provided through TEQ’s contestable funds grant scheme further cemented the vision, reinforced the value of collaboration and enabled the partnership to flourish.
Major activities included:
• A total of ten ANC campaigns executed in UK and Europe. Campaign channels included point of sale, seller training, print, online, social media, outdoor/billboard, editorial, consumer/trade familiarisations and prize promotions.
• Salewa Europe consumer cross promotion in conjunction with Tourism Australia and TEQ resulting in 228,993 website visits and the competition generating 52,054 entries.
• Launch of ANC Aussie Specialist module in the UK with 338 agents completing the online program.
• Tourism Australia/Restaurant Australia promotion with Mail on Sunday UK – print and digital. Prizewinner selected ANC itinerary over all other states of Australia.
• National Geographic UK promotion reaching a circulation of 180,000 with 7,615 entrants and 35,000 unique visits to the website.
International Trade
• SCDL coordinated the management and execution of the ANC roadshow to Melbourne, Sydney and Brisbane to launch the Great Beach Drive and to showcase the natural diversity and attractions of the Sunshine and Fraser Coast regions. Over 24 tourism operators presented to over 200 inbound operators, online specialists, travel agents and key media over nine events.
• Attendance on the Queensland on Tour Missions to Europe and South East Asia and attendance on the FTI Touristik Roadshow in Germany resulting in the opportunity to present the Sunshine Coast to over 750 travel personnel.
• Attendance at Australian Tourism Export Council (ATEC) Meeting Place, Sydney and ATEC Queensland Southern Chapter conference and workshop.
• Attendance at Corroboree UK/Europe presenting to over 300 Aussie Specialists.
• SCDL achieved two fully subscribed appointment schedules at the Australia Tourism Exchange (ATE) held in Melbourne, resulting in over 200 appointments with key international buyers.
• Showcasing the region by facilitating 15 familiarisation groups with over 100 international senior executives, product managers and retail travel agents experiencing the Sunshine Coast.
New Zealand
• The SCDL Mission to New Zealand provided members with the opportunity to meet with over 170 travel agents, wholesalers, consultants and media. Sunshine Coast Councillor Jason O’Pray took part along with seven members. The group attended a mix of training workshops, networking events, media interviews and breakfast training sessions.
• SCDL attended the largest Flight Centre Travel Expos held in Auckland with more than 17,000 consumers attending. Flight Centre sold 464 room nights to the Sunshine Coast.
• Regular trade training sessions and webinars were held on a quarterly basis.
• SCDL worked with Air New Zealand to raise awareness of key events by including Sunshine Coast event listings in the Events section of the Air New Zealand website.
UK agents enjoy Sunreef swimming with the whales experience

16 Sunshine Coast Destination Limited Annual Report 2014/2015 Sunshine Coast Destination Limited Annual Report 2014/2015 17
Overview
In 2014/2015, Business Events Sunshine Coast (BESC) delivered a number of marketing events chosen to align with the overarching strategy to promote the Sunshine Coast as an attractive and viable destination for business events.
Buyer Engagement: Familiarisations and Tradeshows
• ConveneQ tradeshow, Brisbane.
• Associations Forum tradeshow, Canberra.
• Executive Assistant Network (EAN) Congress, Brisbane.
• Pacific Area Incentives and Conference Expo (PAICE), Auckland.
• Launched 2015/2016 Planner Guide at Asia-Pacific Incentives and Meetings Expo (AIME), Melbourne.
• Held the fifth Annual Sunshine Soiree (BESC event buyer function), Brisbane.
• Hosted the Business Events Australia ‘South East Asia Educational’. This follows on from international activity undertaken in the previous year attending Tourism Australia’s South East Asia showcase. This was also the first famil held on the Sunshine Coast for business events buyers from this market and met with a great response.
• Inaugural attendance for BESC on ANC Roadshow, Brisbane/Sydney/Melbourne – once again following on from attendance at Tourism Australia’s North Asia and South East Asia showcases. The aim was to target Australian based Inbound Tour Operators (ITO’s) who deal with Meeting Incentives Conferences and Events (MICE) groups.
• Completion of contestable project – Bid Manager role results to date: Queensland Information Centres Association (QICA) conference 2015, Social Media in Tourism Symposium 2015 (#SoMeT15AU).
Industry Leadership and Development
• Held three ‘What’s in your backyard?’ industry networking/education events.
• Lead consultation forum which resulted in streamlining the leads dissemination process with the aim of converting more leads into sales.
• Caloundra collaboration session to encourage cross-referrals and strengthening of relationships between Caloundra business events suppliers to create a stronger destinational presence.
• Held three Business Events Ready workshops.
• Attendance at Australian Association of Convention Bureau (AACB) Annual Conference.
Research, Reporting and Governance
• 2014/2015 Queensland Business Events Survey.
• AACB Market Intelligence Project.
• AACB Operations Survey.
Additional Activity
Working with SCDL, BESC managed the successful event management of the DestinationQ Forum Welcome Event in partnership with Tourism Noosa in September 2014.
Business Events Sunshine Coast
Chef-guided food trail of the Sunshine Coast Hinterland at Business Events Australia South East Asia Educational
DestinationQ Forum Welcome Event
Tourism Development
Overview
Tourism Development acts as conduit between industry, SCDL and other key stakeholders.
• Developing niche markets and visitor segments.
• Encouraging and growing member engagement and participation in cooperative marketing campaigns.
• Assuming responsibility for Visitor Information Centres and Industry Development post restructure.
Strategy
• Provide member benefits in a new model based on key findings of the member satisfaction survey.
• Focus on managing member expectations as new membership model rolled out.
• Develop industry skills to support and align with SCDL’s marketing plan.
• Develop niche segments to be included in mainstream marketing activity.
Advisory Panels
• These continued to provide key insights and industry engagement particularly in the niche segments of Food and Attractions.
• SCDL worked with the various Local Tourism Organisations and Chambers of Commerce to deliver specific regional outcomes.
Niche Segments
• Food – Secured contestable funding from TEQ to develop a food trail website that would assist consumers and grow this segment. To ensure that industry collaboration would be robust, a Food Forum was held and attended by 73 food industry leaders covering segments from paddock to plate and beyond.
A new mobile food trail website to be launched early in the new financial year.
• Attractions – developed and designed joint creative concept for Australia Zoo, Sea Life, Aussie World, The Ginger Factory and Big Kart Track. This group also sponsored the new uniforms for the VIC volunteers.
• Cruise – an emerging but highly attractive market segment as P&O announced their first cruise to Mooloolaba on the Pacific Pearl. A cruise working group was developed to ensure that the first arrival would be a success and generate positive visitor feedback. P&O has announced additional cruises to visit the Sunshine Coast during 2015/2016.
Events
This segment has grown significantly both by number and scale of events with SCDL providing the marketing support and benefits to SCC sponsored events. During 2014/2015, SCDL assisted 24 major events growing from 13 major events leveraged in the previous year.
The strength of the event portfolio was significantly enhanced by the announcement that the Australian Surf Life Saving Titles (The Aussies) and three World Title events had been secured for the Sunshine Coast.
Planning meetings were held with the organisers of these events including World Tag Cup, World Outrigging Titles and World Ironman 70.3. A marketing communications working group established for the Aussies is chaired by SCDL.
During 2014/2015 a greater focus was placed on developing collaborative partnerships between event promoters and SCDL facilitated a stand at the Gold Coast Marathon Fitness Expo and the Sydney City to Surf Fitness Expo which was manned by the staff from five Sunshine Coast sporting events.
SCDL also worked closely with Sunshine Coast Council to develop and launch the Events+ app.
Sunshine Coast Events Stand at Gold Coast Marathon
Lynne Wilbraham (Gympie Council), Andrew Saunders (Destination Gympie Region), Carolyn Bullen (Noosa Council), Shane Stanley (Big Top Markets) and Wendy Macdonald (Sunshine Coast Council) at the Food Tourism Forum.
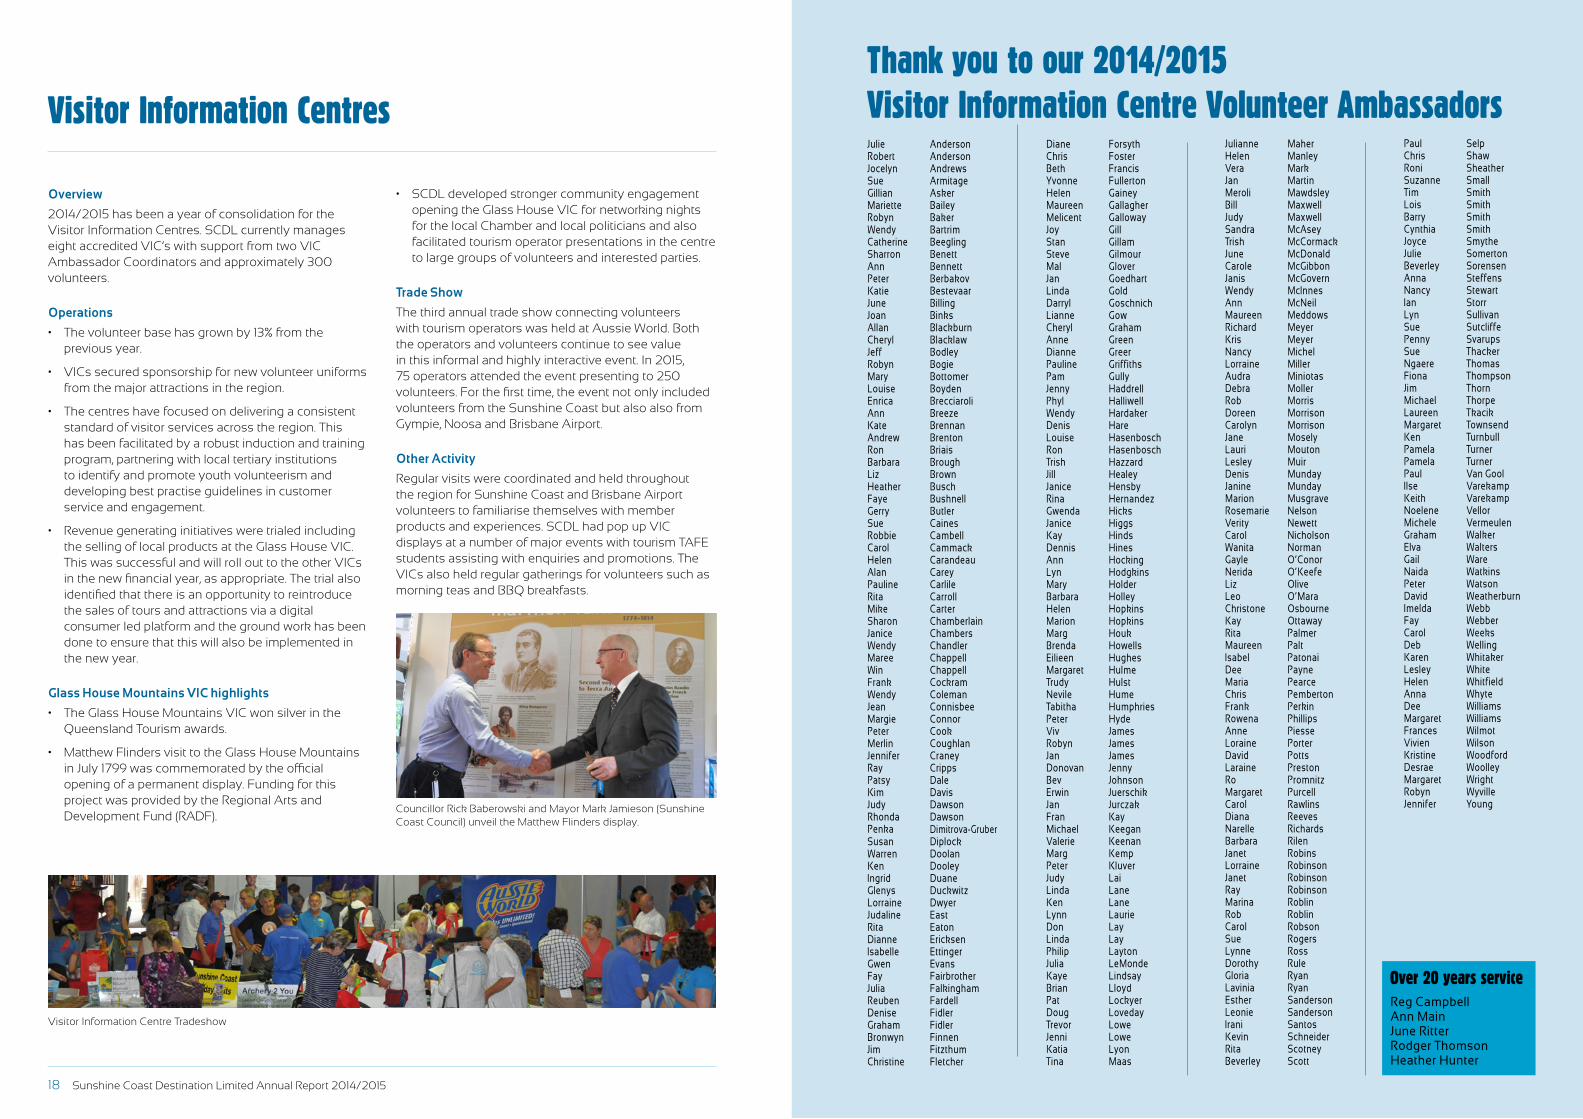
18 Sunshine Coast Destination Limited Annual Report 2014/2015 Sunshine Coast Destination Limited Annual Report 2014/2015 19
Visitor Information Centres
Overview
2014/2015 has been a year of consolidation for the Visitor Information Centres. SCDL currently manages eight accredited VIC’s with support from two VIC Ambassador Coordinators and approximately 300 volunteers.
Operations
• The volunteer base has grown by 13% from the previous year.
• VICs secured sponsorship for new volunteer uniforms from the major attractions in the region.
• The centres have focused on delivering a consistent standard of visitor services across the region. This has been facilitated by a robust induction and training program, partnering with local tertiary institutions to identify and promote youth volunteerism and developing best practise guidelines in customer service and engagement.
• Revenue generating initiatives were trialed including the selling of local products at the Glass House VIC.This was successful and will roll out to the other VICs in the new financial year, as appropriate. The trial also identified that there is an opportunity to reintroduce the sales of tours and attractions via a digital consumer led platform and the ground work has been done to ensure that this will also be implemented in the new year.
Glass House Mountains VIC highlights
• The Glass House Mountains VIC won silver in the Queensland Tourism awards.
• Matthew Flinders visit to the Glass House Mountains in July 1799 was commemorated by the official opening of a permanent display. Funding for this project was provided by the Regional Arts and Development Fund (RADF).
• SCDL developed stronger community engagement opening the Glass House VIC for networking nights for the local Chamber and local politicians and also facilitated tourism operator presentations in the centre to large groups of volunteers and interested parties.
Trade Show
The third annual trade show connecting volunteers with tourism operators was held at Aussie World. Both the operators and volunteers continue to see value in this informal and highly interactive event. In 2015, 75 operators attended the event presenting to 250 volunteers. For the first time, the event not only included volunteers from the Sunshine Coast but also also from Gympie, Noosa and Brisbane Airport.
Other Activity
Regular visits were coordinated and held throughout the region for Sunshine Coast and Brisbane Airport volunteers to familiarise themselves with member products and experiences. SCDL had pop up VIC displays at a number of major events with tourism TAFE students assisting with enquiries and promotions. The VICs also held regular gatherings for volunteers such as morning teas and BBQ breakfasts.
Councillor Rick Baberowski and Mayor Mark Jamieson (Sunshine Coast Council) unveil the Matthew Flinders display.
Visitor Information Centre Tradeshow
Thank you to our 2014/2015Visitor Information Centre Volunteer Ambassadors Julie AndersonRobert AndersonJocelyn AndrewsSue ArmitageGillian AskerMariette BaileyRobyn BakerWendy BartrimCatherine BeeglingSharron BenettAnn BennettPeter BerbakovKatie BestevaarJune BillingJoan BinksAllan BlackburnCheryl BlacklawJeff BodleyRobyn BogieMary BottomerLouise BoydenEnrica BrecciaroliAnn BreezeKate BrennanAndrew BrentonRon BriaisBarbara BroughLiz BrownHeather BuschFaye BushnellGerry ButlerSue CainesRobbie CambellCarol CammackHelen CarandeauAlan CareyPauline CarlileRita CarrollMike CarterSharon ChamberlainJanice ChambersWendy ChandlerMaree ChappellWin ChappellFrank CockramWendy ColemanJean ConnisbeeMargie ConnorPeter CookMerlin CoughlanJennifer CraneyRay CrippsPatsy DaleKim DavisJudy DawsonRhonda DawsonPenka Dimitrova-GruberSusan DiplockWarren DoolanKen DooleyIngrid DuaneGlenys DuckwitzLorraine DwyerJudaline EastRita EatonDianne EricksenIsabelle EttingerGwen EvansFay FairbrotherJulia FalkinghamReuben FardellDenise FidlerGraham FidlerBronwyn FinnenJim FitzthumChristine Fletcher
Diane ForsythChris FosterBeth FrancisYvonne FullertonHelen GaineyMaureen GallagherMelicent GallowayJoy GillStan GillamSteve GilmourMal GloverJan GoedhartLinda GoldDarryl GoschnichLianne GowCheryl GrahamAnne GreenDianne Greer Pauline GriffithsPam GullyJenny HaddrellPhyl HalliwellWendy HardakerDenis HareLouise HasenboschRon HasenboschTrish HazzardJill HealeyJanice HensbyRina HernandezGwenda HicksJanice HiggsKay HindsDennis HinesAnn HockingLyn HodgkinsMary HolderBarbara HolleyHelen HopkinsMarion HopkinsMarg HoukBrenda HowellsEilieen HughesMargaret HulmeTrudy HulstNevile HumeTabitha HumphriesPeter HydeViv JamesRobyn JamesJan JamesDonovan JennyBev JohnsonErwin JuerschikJan JurczakFran KayMichael KeeganValerie KeenanMarg KempPeter KluverJudy LaiLinda LaneKen LaneLynn LaurieDon LayLinda LayPhilip LaytonJulia LeMondeKaye LindsayBrian LloydPat LockyerDoug LovedayTrevor LoweJenni LoweKatia LyonTina Maas
Julianne MaherHelen ManleyVera MarkJan MartinMeroli MawdsleyBill MaxwellJudy MaxwellSandra McAseyTrish McCormackJune McDonaldCarole McGibbonJanis McGovernWendy McInnesAnn McNeilMaureen MeddowsRichard MeyerKris MeyerNancy MichelLorraine MillerAudra MiniotasDebra MollerRob MorrisDoreen MorrisonCarolyn MorrisonJane MoselyLauri MoutonLesley MuirDenis MundayJanine MundayMarion MusgraveRosemarie NelsonVerity NewettCarol NicholsonWanita NormanGayle O’ConorNerida O’KeefeLiz OliveLeo O’MaraChristone OsbourneKay OttawayRita PalmerMaureen PaltIsabel PatonaiDee PayneMaria PearceChris PembertonFrank PerkinRowena PhillipsAnne PiesseLoraine PorterDavid PottsLaraine PrestonRo PromnitzMargaret PurcellCarol RawlinsDiana ReevesNarelle RichardsBarbara RilenJanet RobinsLorraine RobinsonJanet RobinsonRay RobinsonMarina RoblinRob RoblinCarol RobsonSue RogersLynne RossDorothy RuleGloria RyanLavinia RyanEsther SandersonLeonie SandersonIrani SantosKevin SchneiderRita ScotneyBeverley Scott
Paul SelpChris ShawRoni SheatherSuzanne SmallTim SmithLois SmithBarry SmithCynthia SmithJoyce SmytheJulie SomertonBeverley SorensenAnna SteffensNancy StewartIan StorrLyn SullivanSue SutcliffePenny SvarupsSue ThackerNgaere ThomasFiona ThompsonJim ThornMichael ThorpeLaureen TkacikMargaret TownsendKen TurnbullPamela TurnerPamela TurnerPaul Van GoolIlse VarekampKeith VarekampNoelene VellorMichele VermeulenGraham WalkerElva WaltersGail WareNaida WatkinsPeter WatsonDavid WeatherburnImelda WebbFay WebberCarol WeeksDeb WellingKaren WhitakerLesley WhiteHelen WhitfieldAnna WhyteDee WilliamsMargaret WilliamsFrances WilmotVivien WilsonKristine WoodfordDesrae WoolleyMargaret WrightRobyn WyvilleJennifer Young
Over 20 years serviceReg CampbellAnn MainJune RitterRodger ThomsonHeather Hunter
20 Sunshine Coast Destination Limited Annual Report 2014/2015 Sunshine Coast Destination Limited Annual Report 2014/2015 21
Annual FinancialReport ContentsDirectors’ Report for the year ended 30 June 2015 22-25
Auditor’s Independence Declaration 26
Statement of Financial Position as at 30 June 2015 27
Statement of Profit or Loss and other Comprehensive Incomefor the year ended 30 June 2015 28
Statement of Cash Flows for the year ended 30 June 2015 29
Statement of Changes in Equity for the year ended 30 June 2015 30
Notes to the Financial Statements for the year ended 30 June 2015 31-45
Directors’ Declaration 46
Independent Auditor’s Report 47
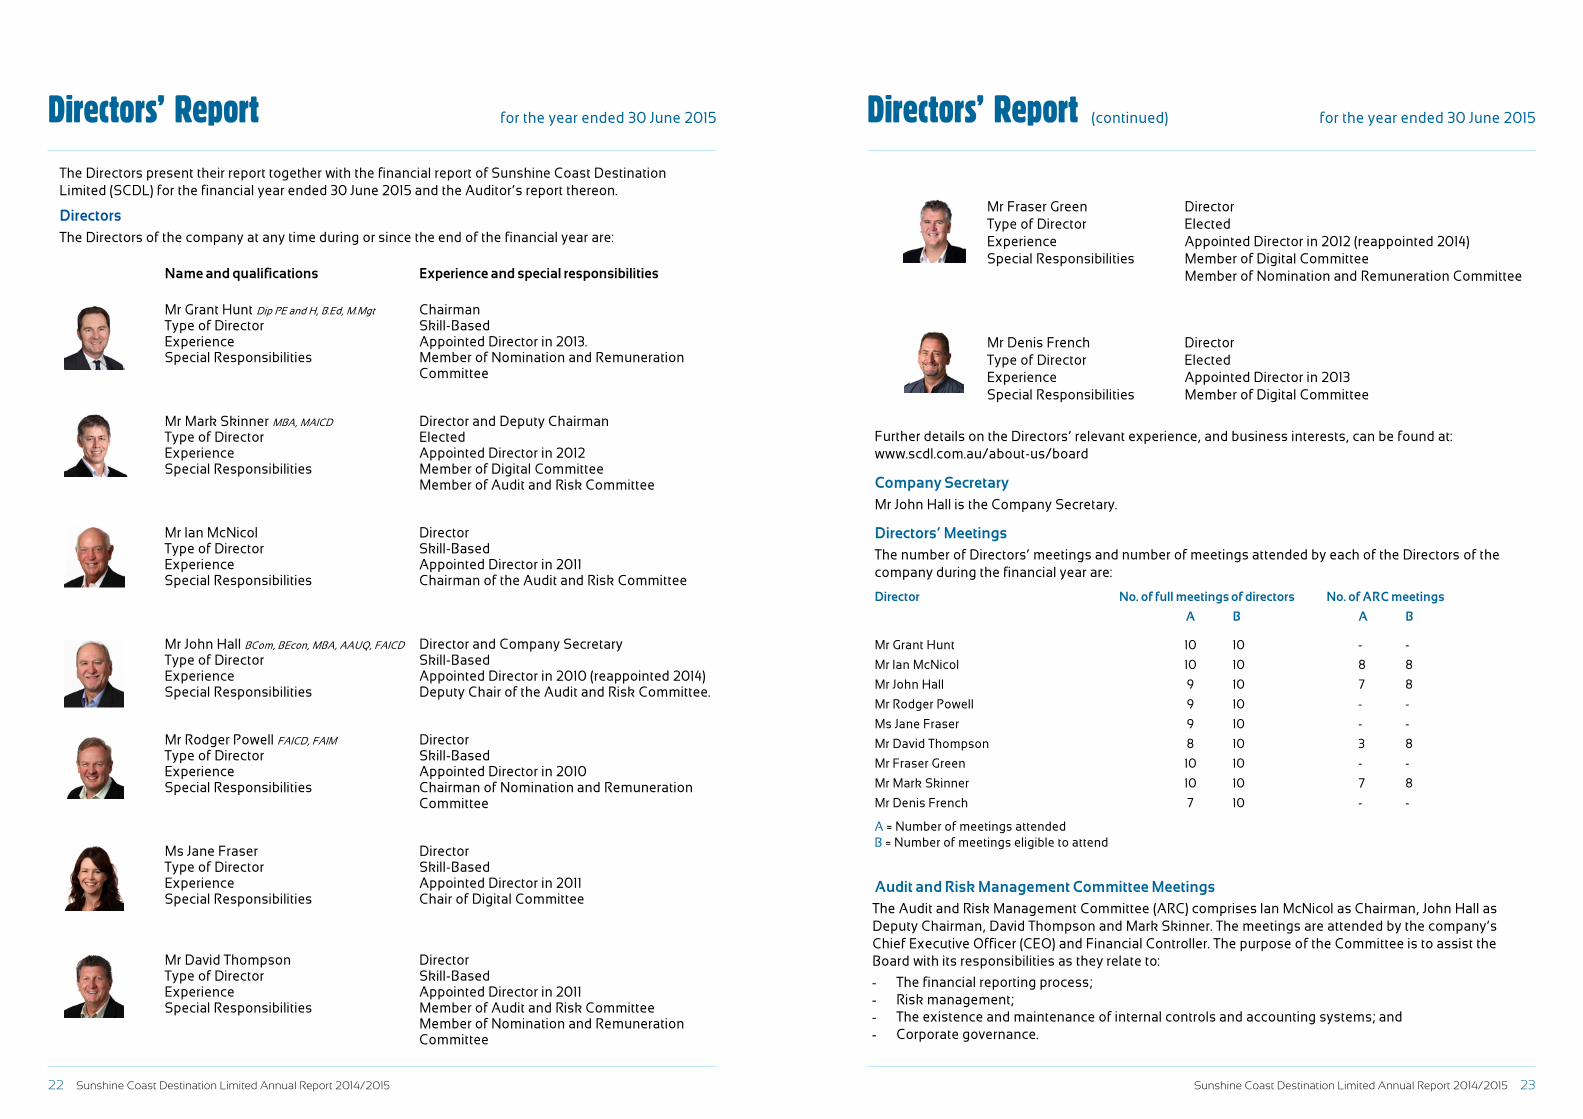
22 Sunshine Coast Destination Limited Annual Report 2014/2015 Sunshine Coast Destination Limited Annual Report 2014/2015 23
Sunshine Coast Destination Limited Annual Report 2014/2015 23
Directors’ Report (continued) for the year ended 30 June 2015
Mr Fraser Green Director Type of Director Elected Experience Appointed Director in 2012 (reappointed 2014) Special Responsibilities Member of Digital Committee Member of Nomination and Remuneration Committee
Mr Denis French Director Type of Director Elected Experience Appointed Director in 2013 Special Responsibilities Member of Digital Committee
Further details on the Directors’ relevant experience, and business interests, can be found at: www.scdl.com.au/about-us/board
Company Secretary Mr John Hall is the Company Secretary.
Directors’ Meetings The number of Directors’ meetings and number of meetings attended by each of the Directors of the company during the financial year are:
Director No. of full meetings of directors No. of ARC meetings
A B A B
Mr Grant Hunt 10 10 - -
Mr Ian McNicol 10 10 8 8
Mr John Hall 9 10 7 8
Mr Rodger Powell 9 10 - -
Ms Jane Fraser 9 10 - -
Mr David Thompson 8 10 3 8
Mr Fraser Green 10 10 - -
Mr Mark Skinner 10 10 7 8
Mr Denis French 7 10 - -
A = Number of meetings attended B = Number of meetings eligible to attend
Audit and Risk Management Committee Meetings The Audit and Risk Management Committee (ARC) comprises Ian McNicol as Chairman, John Hall as Deputy Chairman, David Thompson and Mark Skinner. The meetings are attended by the company’s Chief Executive Officer (CEO) and Financial Controller. The purpose of the Committee is to assist the Board with its responsibilities as they relate to:
- The financial reporting process; - Risk management; - The existence and maintenance of internal controls and accounting systems; and - Corporate governance.
Sunshine Coast Destination Limited Annual Report 2014/2015 22
Directors’ Report for the year ended 30 June 2015
The Directors present their report together with the financial report of Sunshine Coast Destination Limited (SCDL) for the financial year ended 30 June 2015 and the Auditor’s report thereon.
Directors The Directors of the company at any time during or since the end of the financial year are:
Name and qualifications Experience and special responsibilities
Mr Grant Hunt Dip PE and H, B.Ed, M.Mgt Chairman Type of Director Skill-Based Experience Appointed Director in 2013.
Special Responsibilities Member of Nomination and Remuneration Committee
Mr Mark Skinner MBA, MAICD Director and Deputy Chairman Type of Director Elected Experience Appointed Director in 2012 Special Responsibilities Member of Digital Committee Member of Audit and Risk Committee Mr Ian McNicol Director Type of Director Skill-Based Experience Appointed Director in 2011 Special Responsibilities Chairman of the Audit and Risk Committee Mr John Hall BCom, BEcon, MBA, AAUQ, FAICD Director and Company Secretary Type of Director Skill-Based Experience Appointed Director in 2010 (reappointed 2014) Special Responsibilities Deputy Chair of the Audit and Risk Committee. Mr Rodger Powell FAICD, FAIM Director Type of Director Skill-Based Experience Appointed Director in 2010 Special Responsibilities Chairman of Nomination and Remuneration
Committee Ms Jane Fraser Director Type of Director Skill-Based Experience Appointed Director in 2011 Special Responsibilities Chair of Digital Committee
Mr David Thompson Director Type of Director Skill-Based Experience Appointed Director in 2011 Special Responsibilities Member of Audit and Risk Committee
Member of Nomination and Remuneration Committee
Directors’ Report for the year ended 30 June 2015 Directors’ Report for the year ended 30 June 2015(continued)
24 Sunshine Coast Destination Limited Annual Report 2014/2015 Sunshine Coast Destination Limited Annual Report 2014/2015 25
Directors’ Report for the year ended 30 June 2015(continued) Directors’ Report for the year ended 30 June 2015(continued)
Sunshine Coast Destination Limited Annual Report 2014/2015 25
Directors’ Report (continued) for the year ended 30 June 2015
Corporate Governance Statement Responsibilities
The Board of Directors is responsible to the members for the performance of the company in both the short and the long term and seek to balance these sometimes competing objectives in the best interests of the company as a whole.
The functions of the Board include: - Review and approval of corporate strategies, the annual budget and financial plans; - Monitoring organisational performance and the achievement of the company’s strategic goals and
objectives; - Monitoring financial performance including approval of the annual financial reports and liaison
with the company’s Auditors; - Appointment and assessment of the performance of the CEO; - Ensuring there are effective management processes in place and approving major corporate
initiatives; - Enhancing and protecting the reputation of the company; - Ensuring that significant risks facing the company have been identified and appropriate and
adequate control, monitoring and reporting mechanisms are in place; and - Reporting to members.
Board Members Details of the members of the Board, their qualifications and independent status are set out in the Directors’ report under the heading “Directors”. The Board operates in accordance with the principles set out in the company’s constitution, including: - The Board can be a minimum of five and a maximum of eleven and currently comprises nine
members. - The Chairman of the Board is appointed by the Board.
Likely Developments The company will continue to implement strategies to increase visitation to the Sunshine Coast and achieve its goals. This includes continued engagement with its members, key stakeholders and by targeting new strategic partnerships. Lead Auditor’s Independence Declaration The lead Auditor’s Independence Declaration is set out on page 26 and forms part of the Directors’ report for the financial year ended 30 June 2015.
This report is made with a resolution of the Directors.
Grant Hunt Chairman
Dated at Marcoola this day 26th of October 2015.
Sunshine Coast Destination Limited Annual Report 2014/2015 24
Directors’ Report (continued) for the year ended 30 June 2015
Digital Committee Meetings The Digital Committee comprises Jane Fraser as Chair, Mark Skinner, Fraser Green and Denis French. The meetings are attended by the company’s CEO, Head of Marketing and Digital Manager. The committee’s purpose is to assist the Board with its responsibilities as they relate to:
- Annual SCDL digital strategy review;
- Digital supplier management plan; and
- Business case development for funding approval.
Nomination and Remuneration Committee Meetings The Nomination and Remuneration Committee comprises Rodger Powell as Chairman, Grant Hunt, David Thompson and Fraser Green.
Principal Activities The principal activity of the Company is to advance the promotion and development of tourism within the Sunshine Coast region, which encompasses the combined local government areas of the Sunshine Coast Council, Noosa Shire Council and Gympie Regional Council. There were no significant changes in the nature of the activities of the company during the year. However, due to the de-amalgamation of the Noosa and Sunshine Coast Councils and the resulting reduction in local government funding, the company has streamlined and refocused its operations.
Strategic Objectives The company’s objective is to grow the contribution of tourism to the Sunshine Coast economy by:
1. Promoting the region and building destination awareness within Australia and international markets to drive demand and grow visitor nights and yield.
2. Expanding digital presence through innovative online and social media strategies.
3. Being regarded as the sought after partner by key tourism industry stakeholders.
4. Building an engaged and active membership base to ensure a sense of common purpose and direction between all stakeholders.
5. Strengthening existing and developing new strategic partnerships to grow funding and resources.
6. Assisting industry to improve service quality and supply, by developing new product offerings and refurbishing existing products.
7. Lobbying and influencing strategic partners to develop improved visitor access to the region.
Dividends SCDL is a company limited by guarantee. Accordingly, no dividends were paid or declared by the company during the financial year.
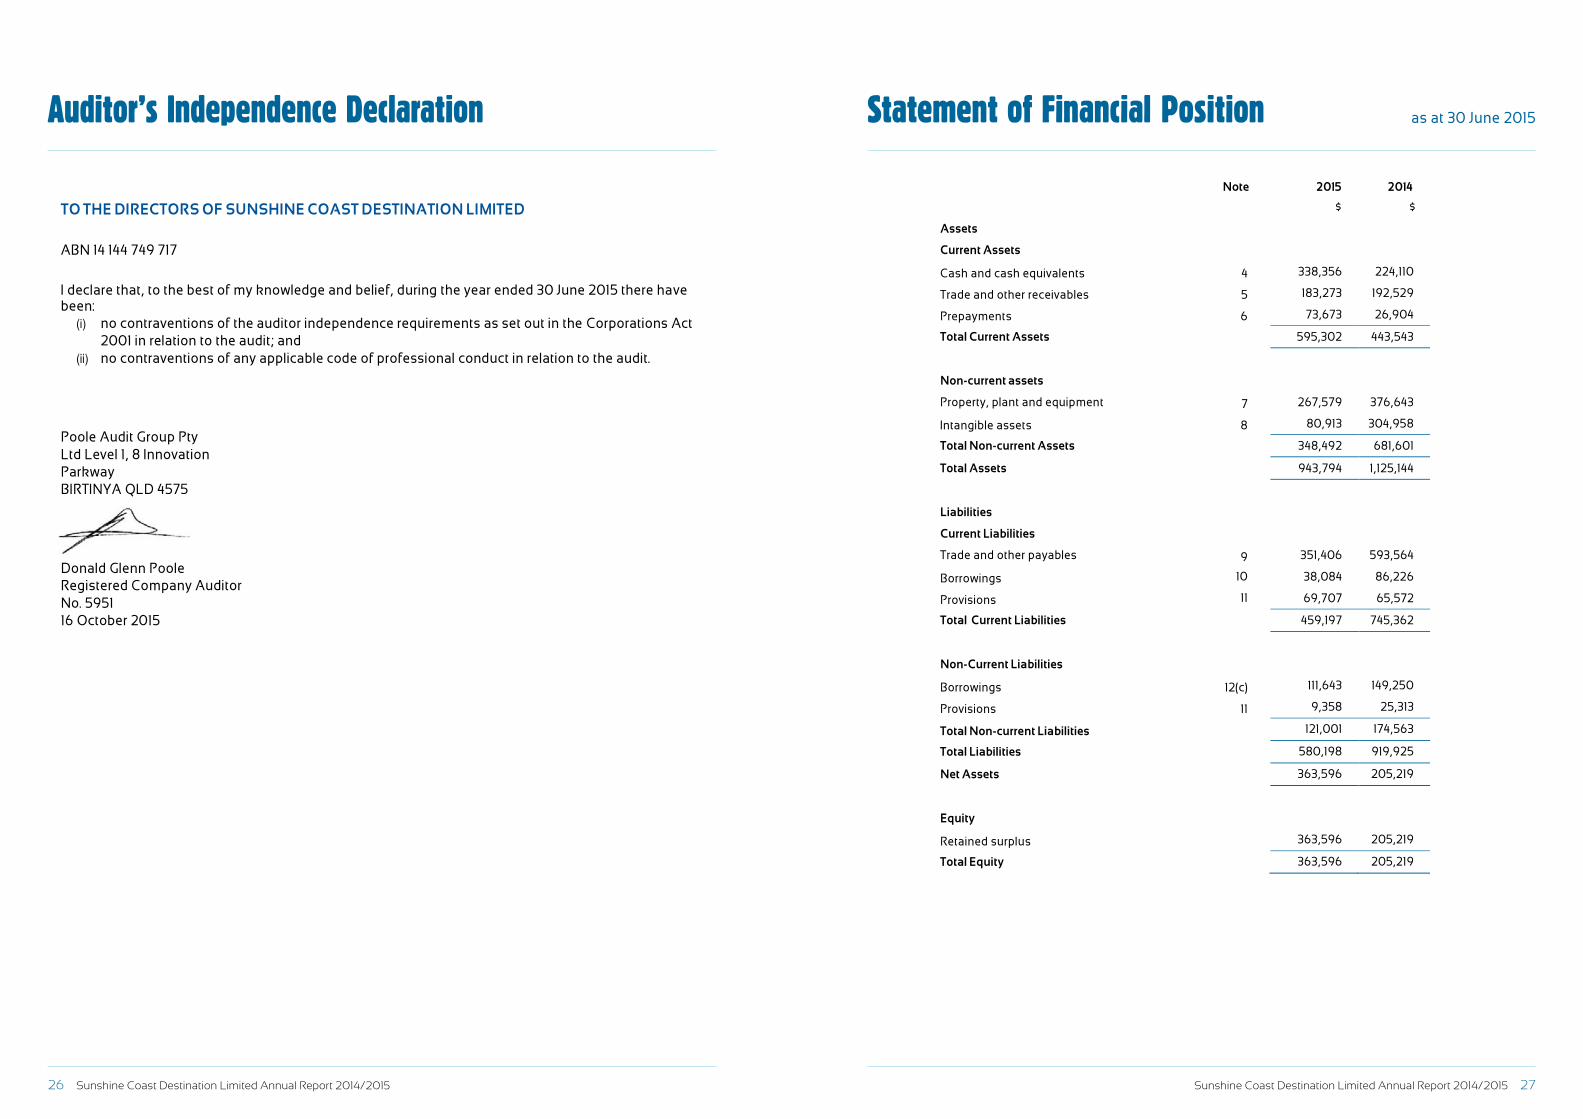
26 Sunshine Coast Destination Limited Annual Report 2014/2015 Sunshine Coast Destination Limited Annual Report 2014/2015 27
Auditor’s Independence Declaration Statement of Financial Position as at 30 June 2015
Sunshine Coast Destination Limited Annual Report 2014/2015 27
Statement of Financial Position as at 30 June 2015
Note 2015
2014
$ $
Assets
Current Assets
Cash and cash equivalents 4 338,356 224,110
Trade and other receivables 5 183,273 192,529
Prepayments 6 73,673 26,904
Total Current Assets 595,302 443,543
Non-current assets
Property, plant and equipment 7 267,579 376,643
Intangible assets 8 80,913 304,958
Total Non-current Assets 348,492 681,601
Total Assets 943,794 1,125,144
Liabilities
Current Liabilities
Trade and other payables 9 351,406 593,564
Borrowings 10 38,084 86,226
Provisions 11 69,707 65,572
Total Current Liabilities 459,197 745,362
Non-Current Liabilities
Borrowings 12(c) 111,643 149,250
Provisions 11 9,358 25,313
Total Non-current Liabilities 121,001 174,563
Total Liabilities 580,198 919,925
Net Assets 363,596 205,219
Equity
Retained surplus 363,596 205,219
Total Equity 363,596 205,219
Sunshine Coast Destination Limited Annual Report 2014/2015 26
Auditor’s Independence Declaration
AUDITOR’S INDEPENDENCE DECLARATION UNDER S 307C OF THE CORPORATIONS ACT 2001 TO THE DIRECTORS OF SUNSHINE COAST DESTINATION LIMITED
ABN 14 144 749 717
I declare that, to the best of my knowledge and belief, during the year ended 30 June 2015 there have been:
(i) no contraventions of the auditor independence requirements as set out in the Corporations Act 2001 in relation to the audit; and
(ii) no contraventions of any applicable code of professional conduct in relation to the audit.
Poole Audit Group Pty Ltd Level 1, 8 Innovation Parkway BIRTINYA QLD 4575
Donald Glenn Poole Registered Company Auditor No. 5951 16 October 2015
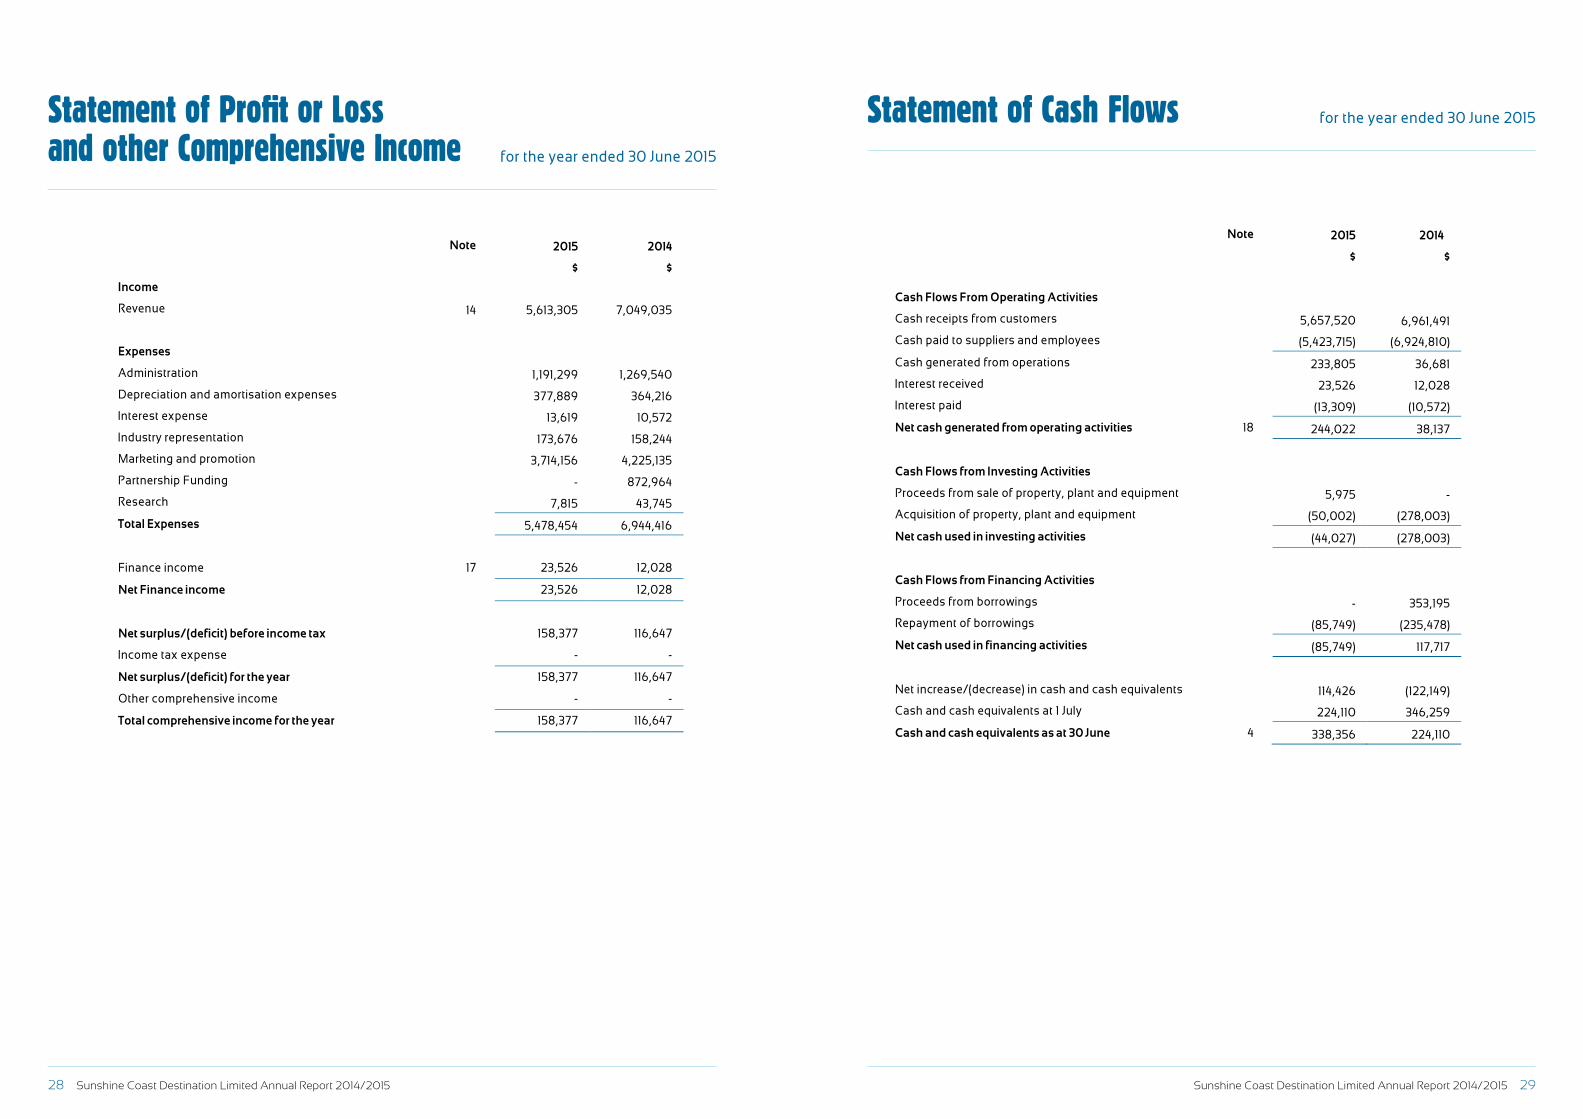
28 Sunshine Coast Destination Limited Annual Report 2014/2015 Sunshine Coast Destination Limited Annual Report 2014/2015 29
Statement of Profit or Lossand other Comprehensive Income for the year ended 30 June 2015
Statement of Cash Flows for the year ended 30 June 2015
Sunshine Coast Destination Limited Annual Report 2014/2015 29
Statement of Cash Flows for the year ended 30 June 2015
Note 2015 2014
$ $
Cash Flows From Operating Activities
Cash receipts from customers 5,657,520 6,961,491
Cash paid to suppliers and employees (5,423,715) (6,924,810)
Cash generated from operations 233,805 36,681
Interest received 23,526 12,028
Interest paid (13,309) (10,572)
Net cash generated from operating activities 18 244,022 38,137
Cash Flows from Investing Activities
Proceeds from sale of property, plant and equipment 5,975 -
Acquisition of property, plant and equipment (50,002) (278,003)
Net cash used in investing activities (44,027) (278,003)
Cash Flows from Financing Activities
Proceeds from borrowings - 353,195
Repayment of borrowings (85,749) (235,478)
Net cash used in financing activities (85,749) 117,717
Net increase/(decrease) in cash and cash equivalents 114,426 (122,149)
Cash and cash equivalents at 1 July 224,110 346,259
Cash and cash equivalents as at 30 June 4 338,356 224,110
Sunshine Coast Destination Limited Annual Report 2014/2015 28
Statement of Profit or Loss and other Comprehensive Income for the year ended 30 June 2015
Note 2015 2014 $ $
Income
Revenue 14 5,613,305 7,049,035
Expenses
Administration 1,191,299 1,269,540
Depreciation and amortisation expenses 377,889 364,216
Interest expense 13,619 10,572
Industry representation 173,676 158,244
Marketing and promotion 3,714,156 4,225,135
Partnership Funding - 872,964
Research 7,815 43,745
Total Expenses 5,478,454 6,944,416
Finance income 17 23,526 12,028
Net Finance income 23,526 12,028
Net surplus/(deficit) before income tax 158,377 116,647
Income tax expense - -
Net surplus/(deficit) for the year 158,377 116,647
Other comprehensive income - -
Total comprehensive income for the year 158,377 116,647
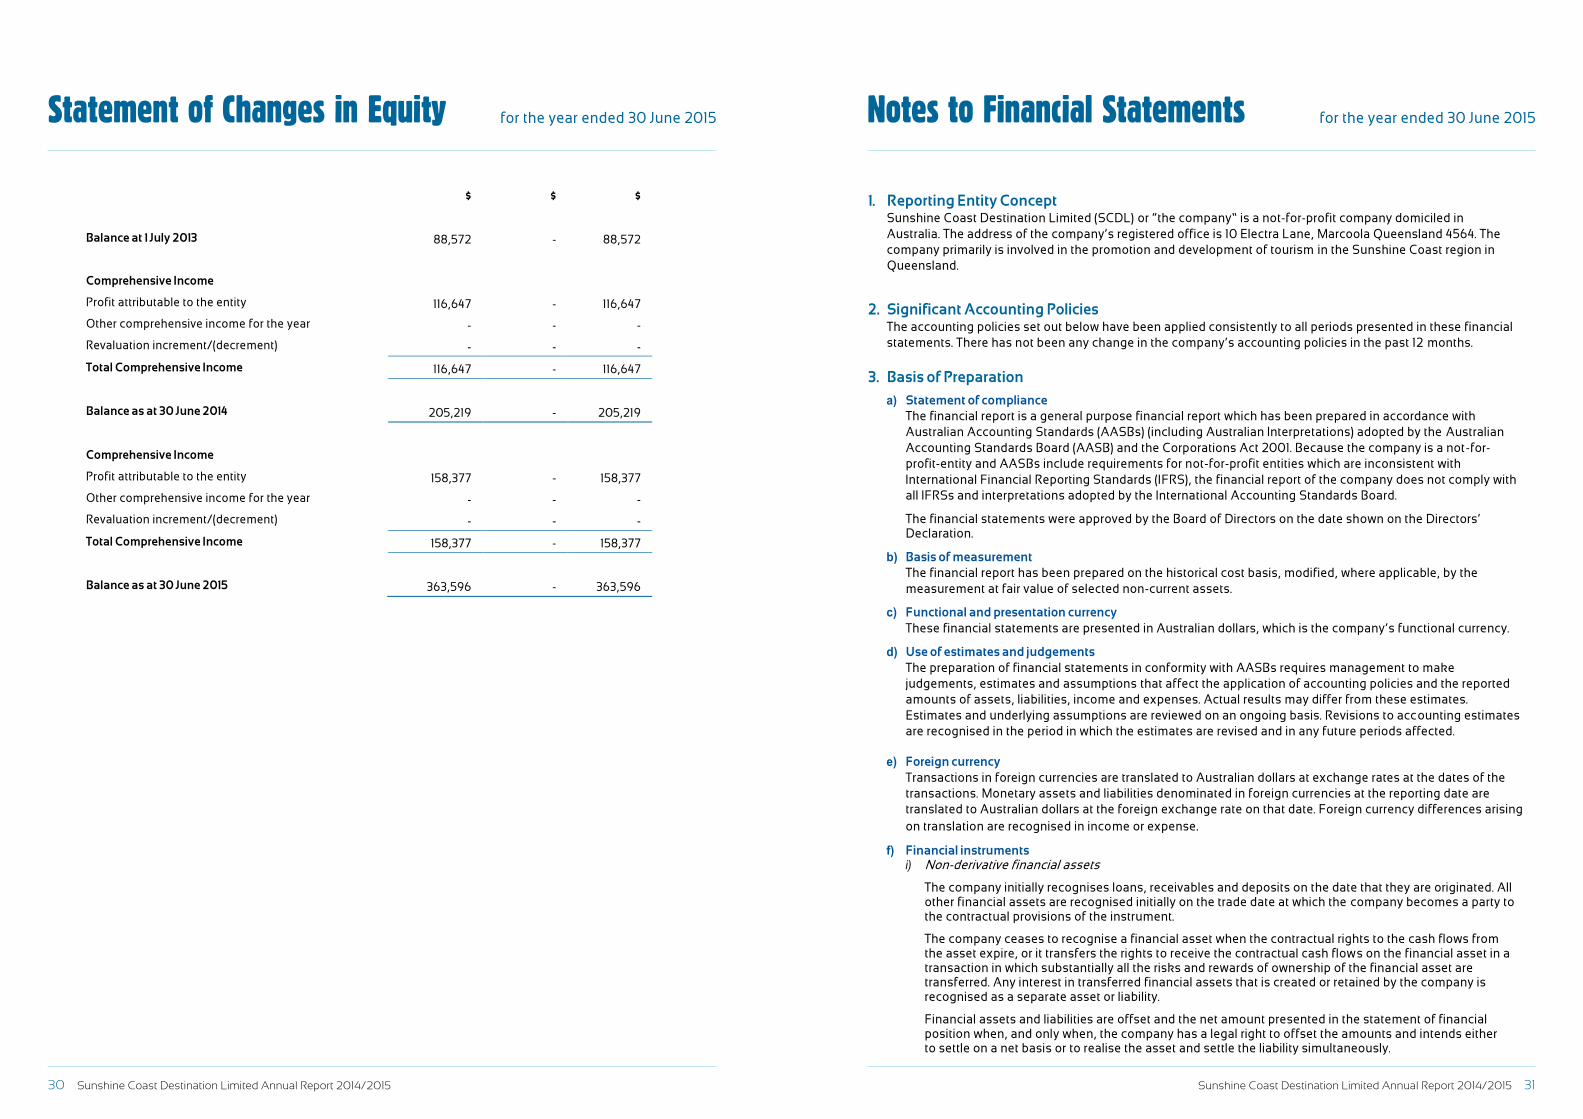
30 Sunshine Coast Destination Limited Annual Report 2014/2015 Sunshine Coast Destination Limited Annual Report 2014/2015 31
Statement of Changes in Equity for the year ended 30 June 2015 Notes to Financial Statements for the year ended 30 June 2015
Sunshine Coast Destination Limited Annual Report 2014/2015 31
Notes to Financial Statements for the year ended 30 June 2015
1. Reporting Entity Concept Sunshine Coast Destination Limited (SCDL) or “the company” is a not-for-profit company domiciled in Australia. The address of the company’s registered office is 10 Electra Lane, Marcoola Queensland 4564. The company primarily is involved in the promotion and development of tourism in the Sunshine Coast region in Queensland.
2. Significant Accounting Policies The accounting policies set out below have been applied consistently to all periods presented in these financial statements. There has not been any change in the company’s accounting policies in the past 12 months.
3. Basis of Preparation
a) Statement of compliance The financial report is a general purpose financial report which has been prepared in accordance with
Australian Accounting Standards (AASBs) (including Australian Interpretations) adopted by the Australian Accounting Standards Board (AASB) and the Corporations Act 2001. Because the company is a not-for-profit-entity and AASBs include requirements for not-for-profit entities which are inconsistent with International Financial Reporting Standards (IFRS), the financial report of the company does not comply with all IFRSs and interpretations adopted by the International Accounting Standards Board.
The financial statements were approved by the Board of Directors on the date shown on the Directors’
Declaration.
b) Basis of measurement The financial report has been prepared on the historical cost basis, modified, where applicable, by the measurement at fair value of selected non-current assets.
c) Functional and presentation currency These financial statements are presented in Australian dollars, which is the company’s functional currency.
d) Use of estimates and judgements The preparation of financial statements in conformity with AASBs requires management to make judgements, estimates and assumptions that affect the application of accounting policies and the reported amounts of assets, liabilities, income and expenses. Actual results may differ from these estimates. Estimates and underlying assumptions are reviewed on an ongoing basis. Revisions to accounting estimates are recognised in the period in which the estimates are revised and in any future periods affected.
e) Foreign currency Transactions in foreign currencies are translated to Australian dollars at exchange rates at the dates of the transactions. Monetary assets and liabilities denominated in foreign currencies at the reporting date are translated to Australian dollars at the foreign exchange rate on that date. Foreign currency differences arising on translation are recognised in income or expense.
f) Financial instruments i) Non-derivative financial assets
The company initially recognises loans, receivables and deposits on the date that they are originated. All other financial assets are recognised initially on the trade date at which the company becomes a party to the contractual provisions of the instrument.
The company ceases to recognise a financial asset when the contractual rights to the cash flows from the asset expire, or it transfers the rights to receive the contractual cash flows on the financial asset in a transaction in which substantially all the risks and rewards of ownership of the financial asset are transferred. Any interest in transferred financial assets that is created or retained by the company is recognised as a separate asset or liability.
Financial assets and liabilities are offset and the net amount presented in the statement of financial position when, and only when, the company has a legal right to offset the amounts and intends either to settle on a net basis or to realise the asset and settle the liability simultaneously.
Sunshine Coast Destination Limited Annual Report 2014/2015 30
Statement of Changes in Equity for the year ended 30 June 2015
Retained Surplus
Revaluation Surplus Total
$ $ $
Balance at 1 July 2013 88,572 - 88,572
Comprehensive Income
Profit attributable to the entity 116,647 - 116,647
Other comprehensive income for the year - - -
Revaluation increment/(decrement) - - -
Total Comprehensive Income 116,647 - 116,647
Balance as at 30 June 2014 205,219 - 205,219
Comprehensive Income
Profit attributable to the entity 158,377 - 158,377
Other comprehensive income for the year - - -
Revaluation increment/(decrement) - - -
Total Comprehensive Income 158,377 - 158,377
Balance as at 30 June 2015 363,596 - 363,596
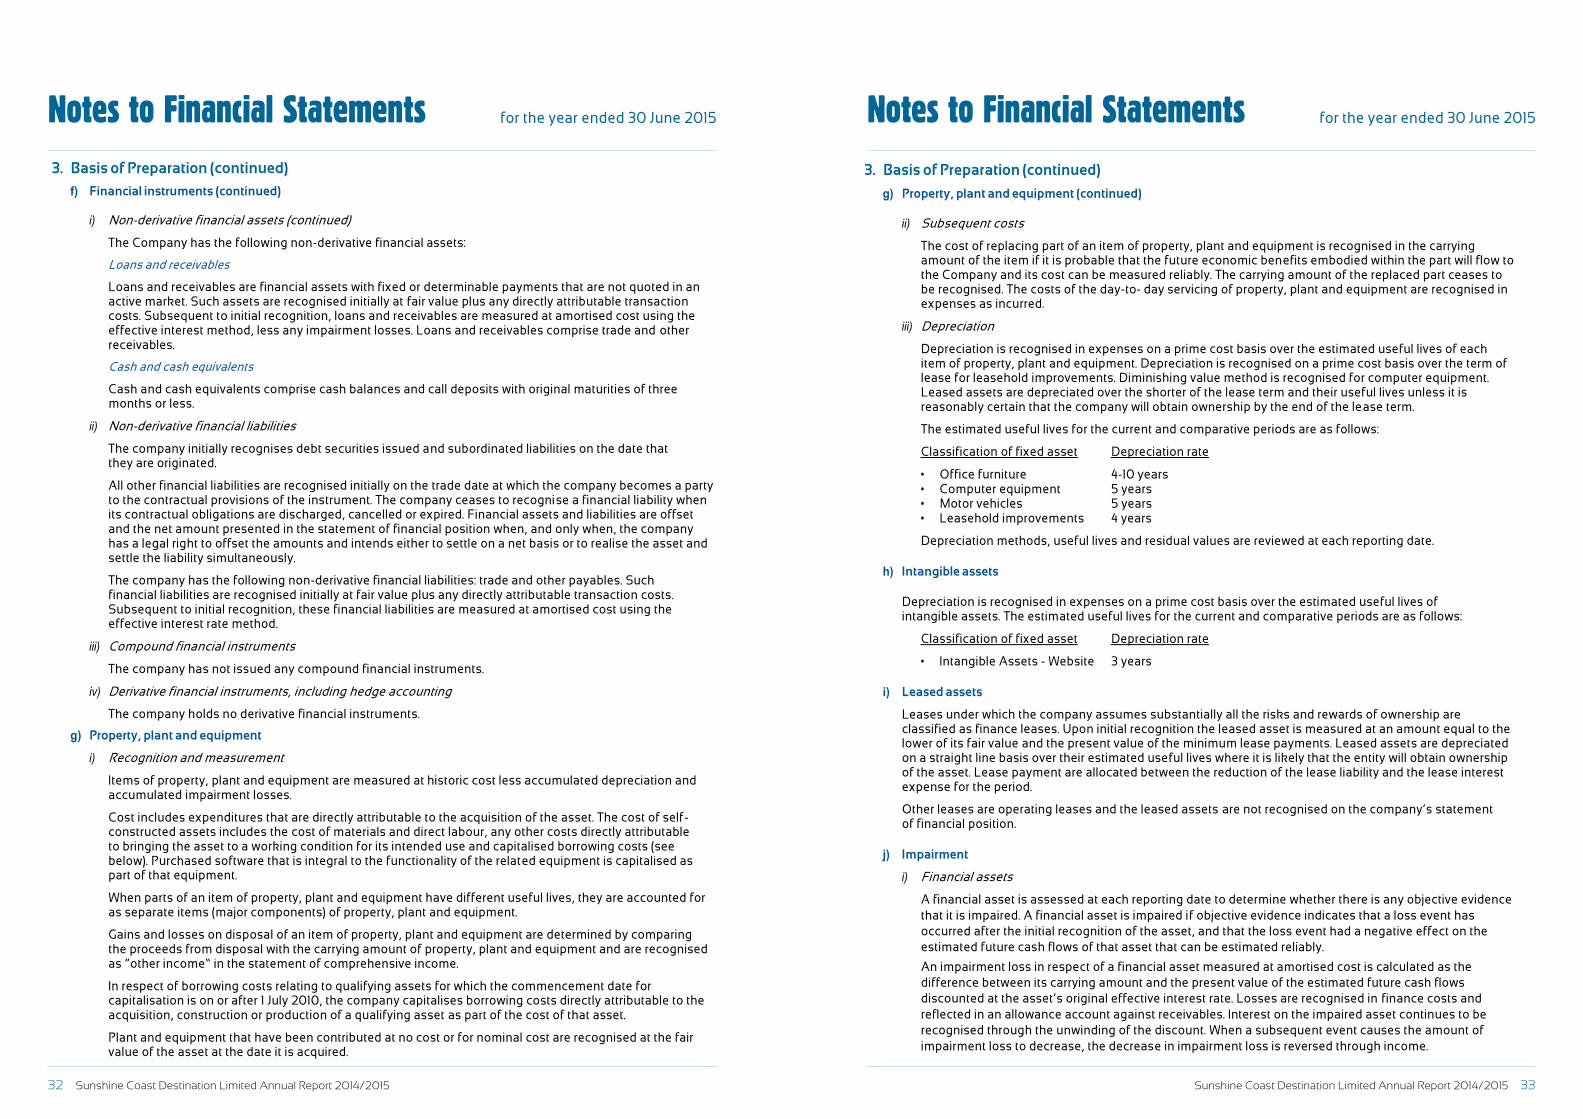
32 Sunshine Coast Destination Limited Annual Report 2014/2015 Sunshine Coast Destination Limited Annual Report 2014/2015 33
Notes to Financial Statements for the year ended 30 June 2015 Notes to Financial Statements for the year ended 30 June 2015
Sunshine Coast Destination Limited Annual Report 2014/2015 33
Notes to Financial Statements for the year ended 30 June 2015
3. Basis of Preparation (continued)
g) Property, plant and equipment (continued)
ii) Subsequent costs
The cost of replacing part of an item of property, plant and equipment is recognised in the carrying amount of the item if it is probable that the future economic benefits embodied within the part will flow to the Company and its cost can be measured reliably. The carrying amount of the replaced part ceases to be recognised. The costs of the day-to- day servicing of property, plant and equipment are recognised in expenses as incurred.
iii) Depreciation
Depreciation is recognised in expenses on a prime cost basis over the estimated useful lives of each item of property, plant and equipment. Depreciation is recognised on a prime cost basis over the term of lease for leasehold improvements. Diminishing value method is recognised for computer equipment. Leased assets are depreciated over the shorter of the lease term and their useful lives unless it is reasonably certain that the company will obtain ownership by the end of the lease term.
The estimated useful lives for the current and comparative periods are as follows:
Classification of fixed asset Depreciation rate
• Office furniture 4-10 years • Computer equipment 5 years • Motor vehicles 5 years • Leasehold improvements 4 years
Depreciation methods, useful lives and residual values are reviewed at each reporting date.
h) Intangible assets
Depreciation is recognised in expenses on a prime cost basis over the estimated useful lives of intangible assets. The estimated useful lives for the current and comparative periods are as follows:
Classification of fixed asset Depreciation rate
• Intangible Assets - Website 3 years
i) Leased assets
Leases under which the company assumes substantially all the risks and rewards of ownership are classified as finance leases. Upon initial recognition the leased asset is measured at an amount equal to the lower of its fair value and the present value of the minimum lease payments. Leased assets are depreciated on a straight line basis over their estimated useful lives where it is likely that the entity will obtain ownership of the asset. Lease payment are allocated between the reduction of the lease liability and the lease interest expense for the period.
Other leases are operating leases and the leased assets are not recognised on the company’s statement of financial position.
j) Impairment
i) Financial assets
A financial asset is assessed at each reporting date to determine whether there is any objective evidence that it is impaired. A financial asset is impaired if objective evidence indicates that a loss event has occurred after the initial recognition of the asset, and that the loss event had a negative effect on the estimated future cash flows of that asset that can be estimated reliably.
An impairment loss in respect of a financial asset measured at amortised cost is calculated as the difference between its carrying amount and the present value of the estimated future cash flows discounted at the asset’s original effective interest rate. Losses are recognised in finance costs and reflected in an allowance account against receivables. Interest on the impaired asset continues to be recognised through the unwinding of the discount. When a subsequent event causes the amount of impairment loss to decrease, the decrease in impairment loss is reversed through income.
Sunshine Coast Destination Limited Annual Report 2014/2015 32
Notes to Financial Statements for the year ended 30 June 2015
3. Basis of Preparation (continued)
f) Financial instruments (continued) i) Non-derivative financial assets (continued)
The Company has the following non-derivative financial assets:
Loans and receivables
Loans and receivables are financial assets with fixed or determinable payments that are not quoted in an active market. Such assets are recognised initially at fair value plus any directly attributable transaction costs. Subsequent to initial recognition, loans and receivables are measured at amortised cost using the effective interest method, less any impairment losses. Loans and receivables comprise trade and other receivables.
Cash and cash equivalents
Cash and cash equivalents comprise cash balances and call deposits with original maturities of three months or less.
ii) Non-derivative financial liabilities
The company initially recognises debt securities issued and subordinated liabilities on the date that they are originated.
All other financial liabilities are recognised initially on the trade date at which the company becomes a party to the contractual provisions of the instrument. The company ceases to recognise a financial liability when its contractual obligations are discharged, cancelled or expired. Financial assets and liabilities are offset and the net amount presented in the statement of financial position when, and only when, the company has a legal right to offset the amounts and intends either to settle on a net basis or to realise the asset and settle the liability simultaneously.
The company has the following non-derivative financial liabilities: trade and other payables. Such financial liabilities are recognised initially at fair value plus any directly attributable transaction costs. Subsequent to initial recognition, these financial liabilities are measured at amortised cost using the effective interest rate method.
iii) Compound financial instruments
The company has not issued any compound financial instruments.
iv) Derivative financial instruments, including hedge accounting
The company holds no derivative financial instruments.
g) Property, plant and equipment
i) Recognition and measurement
Items of property, plant and equipment are measured at historic cost less accumulated depreciation and accumulated impairment losses.
Cost includes expenditures that are directly attributable to the acquisition of the asset. The cost of self-constructed assets includes the cost of materials and direct labour, any other costs directly attributable to bringing the asset to a working condition for its intended use and capitalised borrowing costs (see below). Purchased software that is integral to the functionality of the related equipment is capitalised as part of that equipment.
When parts of an item of property, plant and equipment have different useful lives, they are accounted for as separate items (major components) of property, plant and equipment.
Gains and losses on disposal of an item of property, plant and equipment are determined by comparing the proceeds from disposal with the carrying amount of property, plant and equipment and are recognised as “other income” in the statement of comprehensive income.
In respect of borrowing costs relating to qualifying assets for which the commencement date for capitalisation is on or after 1 July 2010, the company capitalises borrowing costs directly attributable to the acquisition, construction or production of a qualifying asset as part of the cost of that asset.
Plant and equipment that have been contributed at no cost or for nominal cost are recognised at the fair value of the asset at the date it is acquired.
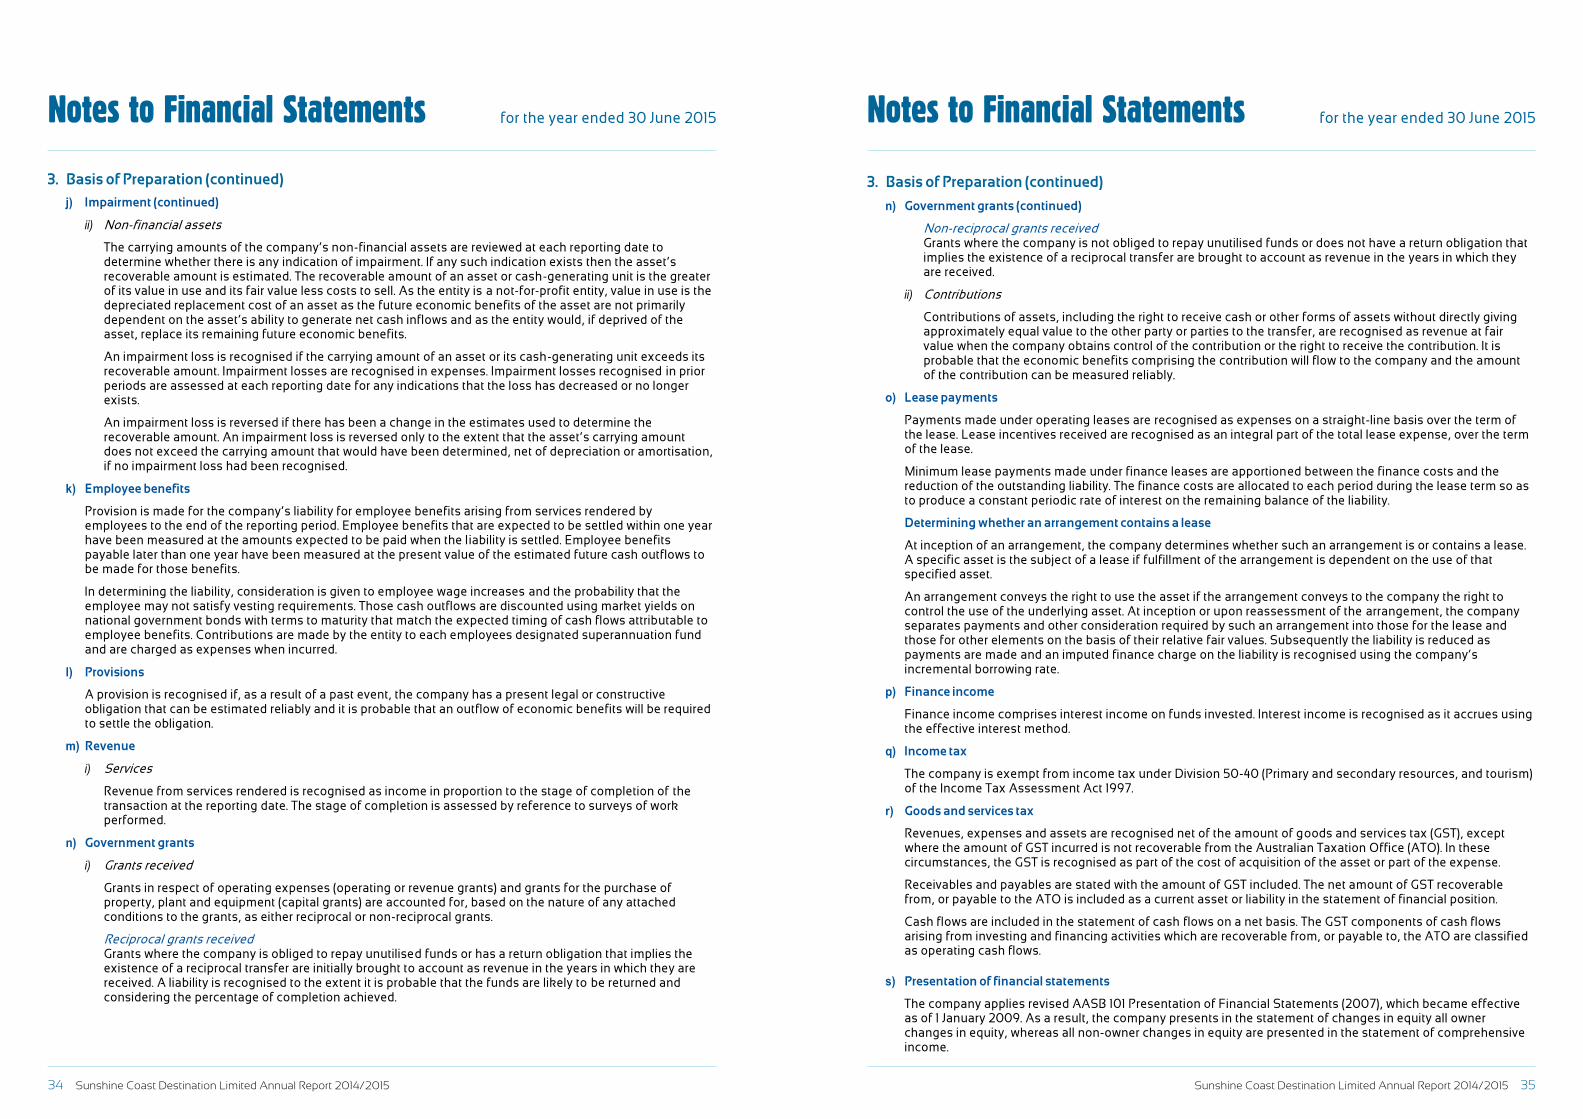
34 Sunshine Coast Destination Limited Annual Report 2014/2015 Sunshine Coast Destination Limited Annual Report 2014/2015 35
Notes to Financial Statements for the year ended 30 June 2015 Notes to Financial Statements for the year ended 30 June 2015
Sunshine Coast Destination Limited Annual Report 2014/2015 35
Notes to Financial Statements for the year ended 30 June 2015 3. Basis of Preparation (continued)
n) Government grants (continued)
Non-reciprocal grants received Grants where the company is not obliged to repay unutilised funds or does not have a return obligation that implies the existence of a reciprocal transfer are brought to account as revenue in the years in which they are received.
ii) Contributions
Contributions of assets, including the right to receive cash or other forms of assets without directly giving approximately equal value to the other party or parties to the transfer, are recognised as revenue at fair value when the company obtains control of the contribution or the right to receive the contribution. It is probable that the economic benefits comprising the contribution will flow to the company and the amount of the contribution can be measured reliably.
o) Lease payments
Payments made under operating leases are recognised as expenses on a straight-line basis over the term of the lease. Lease incentives received are recognised as an integral part of the total lease expense, over the term of the lease.
Minimum lease payments made under finance leases are apportioned between the finance costs and the reduction of the outstanding liability. The finance costs are allocated to each period during the lease term so as to produce a constant periodic rate of interest on the remaining balance of the liability.
Determining whether an arrangement contains a lease
At inception of an arrangement, the company determines whether such an arrangement is or contains a lease. A specific asset is the subject of a lease if fulfillment of the arrangement is dependent on the use of that specified asset.
An arrangement conveys the right to use the asset if the arrangement conveys to the company the right to control the use of the underlying asset. At inception or upon reassessment of the arrangement, the company separates payments and other consideration required by such an arrangement into those for the lease and those for other elements on the basis of their relative fair values. Subsequently the liability is reduced as payments are made and an imputed finance charge on the liability is recognised using the company’s incremental borrowing rate.
p) Finance income
Finance income comprises interest income on funds invested. Interest income is recognised as it accrues using the effective interest method.
q) Income tax
The company is exempt from income tax under Division 50-40 (Primary and secondary resources, and tourism) of the Income Tax Assessment Act 1997.
r) Goods and services tax
Revenues, expenses and assets are recognised net of the amount of goods and services tax (GST), except where the amount of GST incurred is not recoverable from the Australian Taxation Office (ATO). In these circumstances, the GST is recognised as part of the cost of acquisition of the asset or part of the expense.
Receivables and payables are stated with the amount of GST included. The net amount of GST recoverable from, or payable to the ATO is included as a current asset or liability in the statement of financial position.
Cash flows are included in the statement of cash flows on a net basis. The GST components of cash flows arising from investing and financing activities which are recoverable from, or payable to, the ATO are classified as operating cash flows.
s) Presentation of financial statements
The company applies revised AASB 101 Presentation of Financial Statements (2007), which became effective as of 1 January 2009. As a result, the company presents in the statement of changes in equity all owner changes in equity, whereas all non-owner changes in equity are presented in the statement of comprehensive income.
Sunshine Coast Destination Limited Annual Report 2014/2015 34
Notes to Financial Statements for the year ended 30 June 2015
3. Basis of Preparation (continued)
j) Impairment (continued)
ii) Non-financial assets
The carrying amounts of the company’s non-financial assets are reviewed at each reporting date to determine whether there is any indication of impairment. If any such indication exists then the asset’s recoverable amount is estimated. The recoverable amount of an asset or cash-generating unit is the greater of its value in use and its fair value less costs to sell. As the entity is a not-for-profit entity, value in use is the depreciated replacement cost of an asset as the future economic benefits of the asset are not primarily dependent on the asset’s ability to generate net cash inflows and as the entity would, if deprived of the asset, replace its remaining future economic benefits.
An impairment loss is recognised if the carrying amount of an asset or its cash-generating unit exceeds its recoverable amount. Impairment losses are recognised in expenses. Impairment losses recognised in prior periods are assessed at each reporting date for any indications that the loss has decreased or no longer exists.
An impairment loss is reversed if there has been a change in the estimates used to determine the recoverable amount. An impairment loss is reversed only to the extent that the asset’s carrying amount does not exceed the carrying amount that would have been determined, net of depreciation or amortisation, if no impairment loss had been recognised.
k) Employee benefits
Provision is made for the company’s liability for employee benefits arising from services rendered by employees to the end of the reporting period. Employee benefits that are expected to be settled within one year have been measured at the amounts expected to be paid when the liability is settled. Employee benefits payable later than one year have been measured at the present value of the estimated future cash outflows to be made for those benefits.
In determining the liability, consideration is given to employee wage increases and the probability that the employee may not satisfy vesting requirements. Those cash outflows are discounted using market yields on national government bonds with terms to maturity that match the expected timing of cash flows attributable to employee benefits. Contributions are made by the entity to each employees designated superannuation fund and are charged as expenses when incurred.
l) Provisions
A provision is recognised if, as a result of a past event, the company has a present legal or constructive obligation that can be estimated reliably and it is probable that an outflow of economic benefits will be required to settle the obligation.
m) Revenue
i) Services
Revenue from services rendered is recognised as income in proportion to the stage of completion of the transaction at the reporting date. The stage of completion is assessed by reference to surveys of work performed.
n) Government grants
i) Grants received
Grants in respect of operating expenses (operating or revenue grants) and grants for the purchase of property, plant and equipment (capital grants) are accounted for, based on the nature of any attached conditions to the grants, as either reciprocal or non-reciprocal grants.
Reciprocal grants received Grants where the company is obliged to repay unutilised funds or has a return obligation that implies the existence of a reciprocal transfer are initially brought to account as revenue in the years in which they are received. A liability is recognised to the extent it is probable that the funds are likely to be returned and considering the percentage of completion achieved.
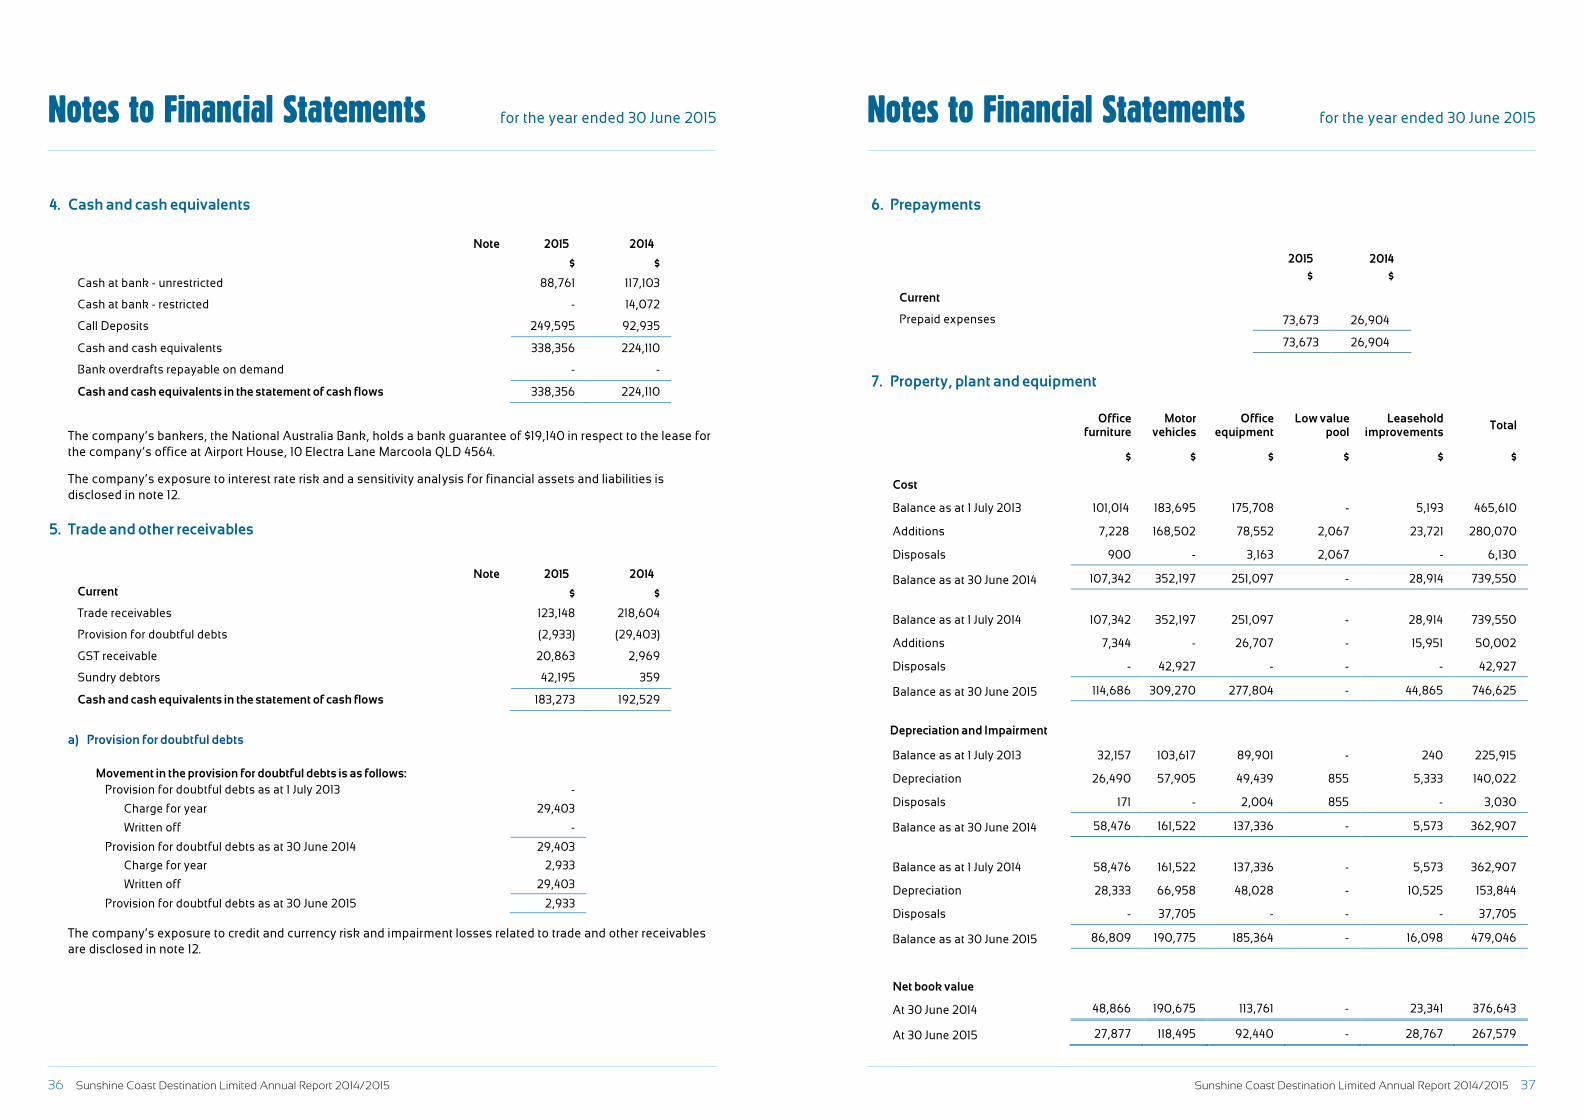
36 Sunshine Coast Destination Limited Annual Report 2014/2015 Sunshine Coast Destination Limited Annual Report 2014/2015 37
Notes to Financial Statements for the year ended 30 June 2015 Notes to Financial Statements for the year ended 30 June 2015
Sunshine Coast Destination Limited Annual Report 2014/2015 37
Notes to Financial Statements for the year ended 30 June 2015
6. Prepayments
2015 2014
$ $
Current
Prepaid expenses 73,673 26,904
73,673 26,904
7. Property, plant and equipment
Office furniture
Motor vehicles
Office equipment
Low value pool
Leasehold improvements Total
$ $ $ $ $ $
Cost
Balance as at 1 July 2013 101,014 183,695 175,708 - 5,193 465,610
Additions 7,228 168,502 78,552 2,067 23,721 280,070
Disposals 900 - 3,163 2,067 - 6,130
Balance as at 30 June 2014 107,342 352,197 251,097 - 28,914 739,550
Balance as at 1 July 2014 107,342 352,197 251,097 - 28,914 739,550
Additions 7,344 - 26,707 - 15,951 50,002
Disposals - 42,927 - - - 42,927
Balance as at 30 June 2015 114,686 309,270 277,804 - 44,865 746,625
Depreciation and Impairment
Balance as at 1 July 2013 32,157 103,617 89,901 - 240 225,915
Depreciation 26,490 57,905 49,439 855 5,333 140,022
Disposals 171 - 2,004 855 - 3,030
Balance as at 30 June 2014 58,476 161,522 137,336 - 5,573 362,907
Balance as at 1 July 2014 58,476 161,522 137,336 - 5,573 362,907
Depreciation 28,333 66,958 48,028 - 10,525 153,844
Disposals - 37,705 - - - 37,705
Balance as at 30 June 2015 86,809 190,775 185,364 - 16,098 479,046
Net book value
At 30 June 2014 48,866 190,675 113,761 - 23,341 376,643
At 30 June 2015 27,877 118,495 92,440 - 28,767 267,579
Sunshine Coast Destination Limited Annual Report 2014/2015 36
Notes to Financial Statements for the year ended 30 June 2015
4. Cash and cash equivalents
Note 2015 2014
$ $
Cash at bank - unrestricted 88,761 117,103
Cash at bank - restricted - 14,072
Call Deposits 249,595 92,935
Cash and cash equivalents 338,356 224,110
Bank overdrafts repayable on demand - -
Cash and cash equivalents in the statement of cash flows 338,356 224,110
The company’s bankers, the National Australia Bank, holds a bank guarantee of $19,140 in respect to the lease for the company’s office at Airport House, 10 Electra Lane Marcoola QLD 4564. The company’s exposure to interest rate risk and a sensitivity analysis for financial assets and liabilities is disclosed in note 12.
5. Trade and other receivables
Note 2015 2014 Current $ $
Trade receivables 123,148 218,604
Provision for doubtful debts (2,933) (29,403)
GST receivable 20,863 2,969
Sundry debtors 42,195 359
Cash and cash equivalents in the statement of cash flows 183,273 192,529
a) Provision for doubtful debts
Movement in the provision for doubtful debts is as follows:
Provision for doubtful debts as at 1 July 2013 -
Charge for year 29,403 Written off -
Provision for doubtful debts as at 30 June 2014 29,403 Charge for year 2,933 Written off 29,403
Provision for doubtful debts as at 30 June 2015 2,933
The company’s exposure to credit and currency risk and impairment losses related to trade and other receivables are disclosed in note 12.
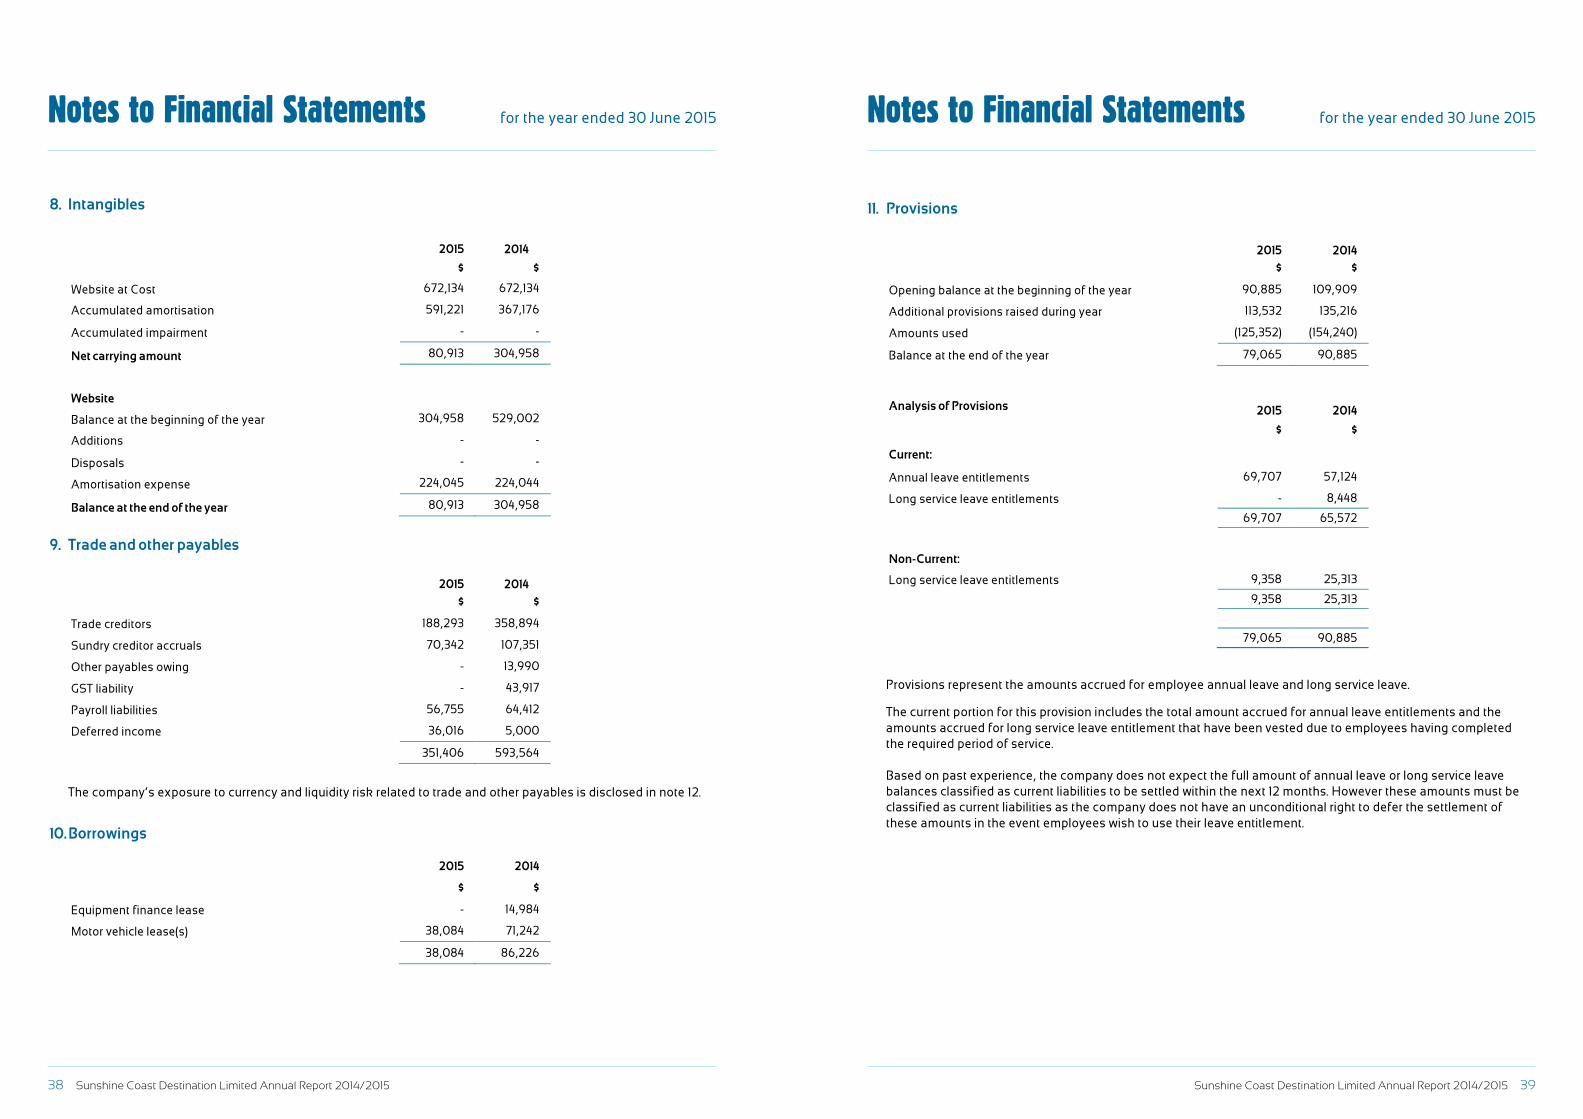
38 Sunshine Coast Destination Limited Annual Report 2014/2015 Sunshine Coast Destination Limited Annual Report 2014/2015 39
Notes to Financial Statements for the year ended 30 June 2015 Notes to Financial Statements for the year ended 30 June 2015
Sunshine Coast Destination Limited Annual Report 2014/2015 38
Notes to Financial Statements for the year ended 30 June 2015
8. Intangibles 2015 2014 $ $
Website at Cost 672,134 672,134
Accumulated amortisation 591,221 367,176
Accumulated impairment - -
Net carrying amount 80,913 304,958
Website
Balance at the beginning of the year 304,958 529,002
Additions - -
Disposals - -
Amortisation expense 224,045 224,044
Balance at the end of the year 80,913 304,958
9. Trade and other payables
2015 2014 $ $
Trade creditors 188,293 358,894
Sundry creditor accruals 70,342 107,351
Other payables owing - 13,990
GST liability - 43,917
Payroll liabilities 56,755 64,412
Deferred income 36,016 5,000
351,406 593,564
The company’s exposure to currency and liquidity risk related to trade and other payables is disclosed in note 12.
10. Borrowings
2015 2014
$ $
Equipment finance lease - 14,984
Motor vehicle lease(s) 38,084 71,242
38,084 86,226
Sunshine Coast Destination Limited Annual Report 2014/2015 39
Notes to Financial Statements for the year ended 30 June 2015
11. Provisions
2015 2014 $ $
Opening balance at the beginning of the year 90,885 109,909
Additional provisions raised during year 113,532 135,216
Amounts used (125,352) (154,240)
Balance at the end of the year 79,065 90,885
Analysis of Provisions 2015 2014
$ $
Current:
Annual leave entitlements 69,707 57,124
Long service leave entitlements - 8,448
69,707 65,572
Non-Current:
Long service leave entitlements 9,358 25,313 9,358 25,313 79,065 90,885
Provisions represent the amounts accrued for employee annual leave and long service leave. The current portion for this provision includes the total amount accrued for annual leave entitlements and the amounts accrued for long service leave entitlement that have been vested due to employees having completed the required period of service. Based on past experience, the company does not expect the full amount of annual leave or long service leave balances classified as current liabilities to be settled within the next 12 months. However these amounts must be classified as current liabilities as the company does not have an unconditional right to defer the settlement of these amounts in the event employees wish to use their leave entitlement.
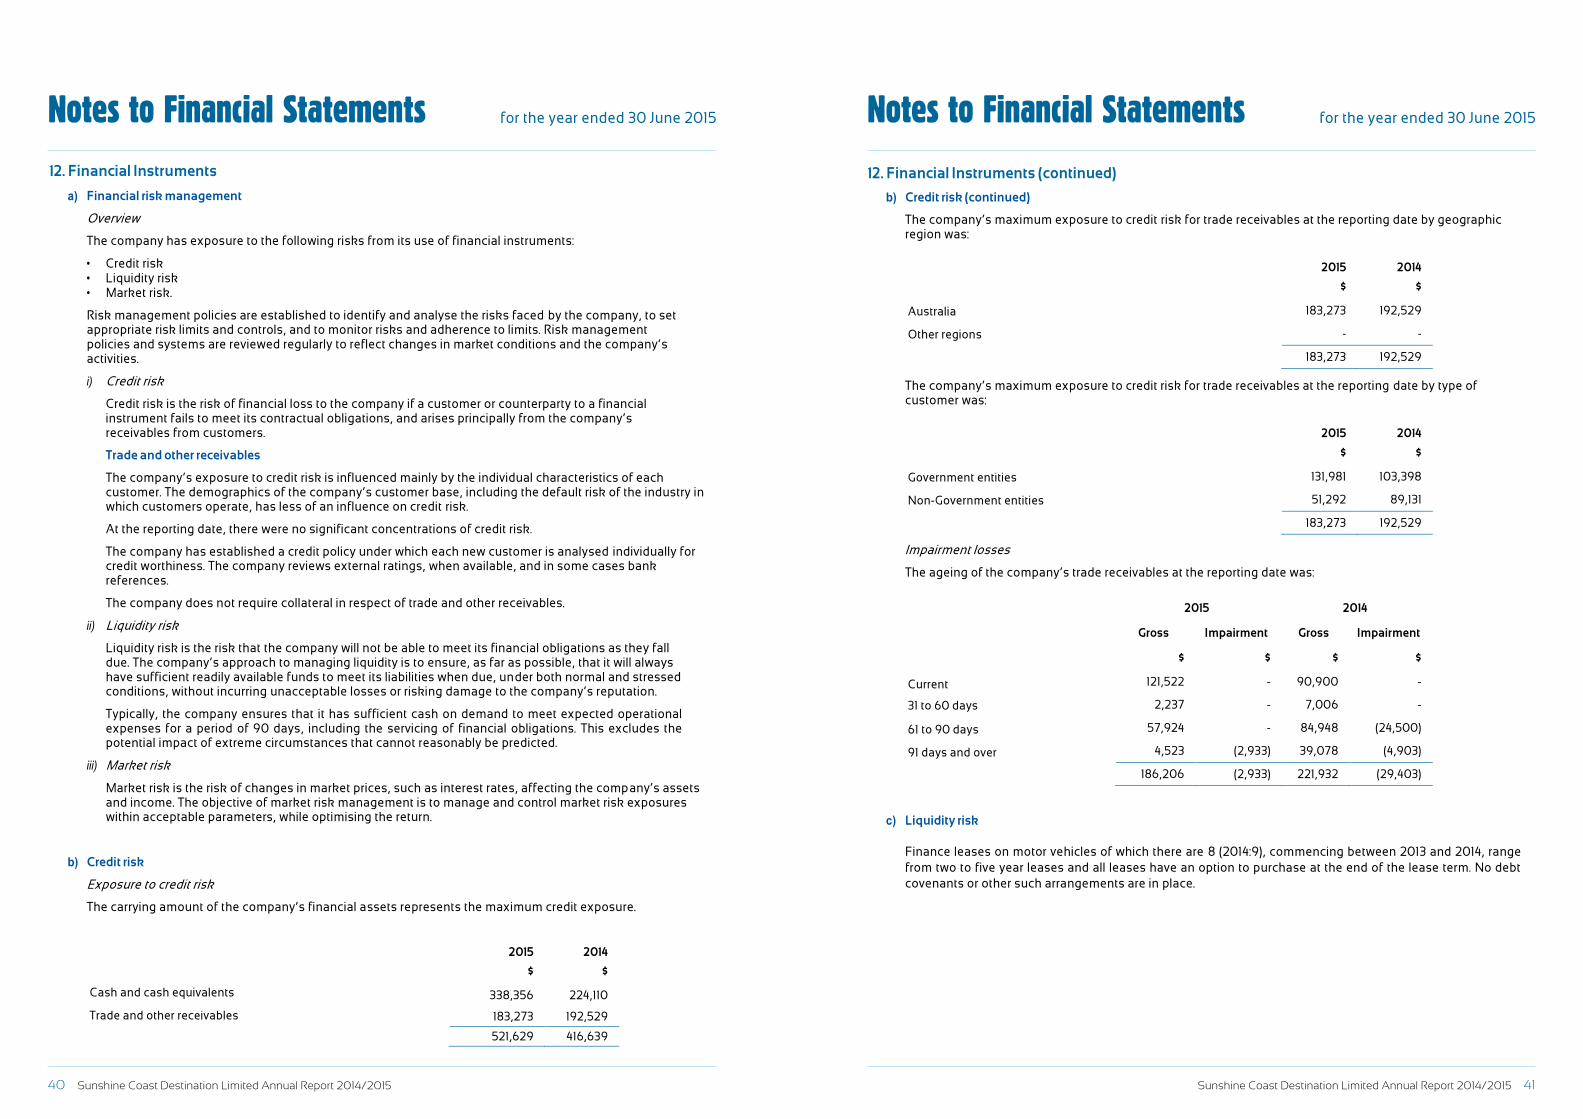
40 Sunshine Coast Destination Limited Annual Report 2014/2015 Sunshine Coast Destination Limited Annual Report 2014/2015 41
Notes to Financial Statements for the year ended 30 June 2015 Notes to Financial Statements for the year ended 30 June 2015
Sunshine Coast Destination Limited Annual Report 2014/2015 40
Notes to Financial Statements for the year ended 30 June 2015
12. Financial Instruments
a) Financial risk management
Overview
The company has exposure to the following risks from its use of financial instruments:
• Credit risk • Liquidity risk • Market risk.
Risk management policies are established to identify and analyse the risks faced by the company, to set appropriate risk limits and controls, and to monitor risks and adherence to limits. Risk management policies and systems are reviewed regularly to reflect changes in market conditions and the company’s activities.
i) Credit risk
Credit risk is the risk of financial loss to the company if a customer or counterparty to a financial instrument fails to meet its contractual obligations, and arises principally from the company’s receivables from customers.
Trade and other receivables
The company’s exposure to credit risk is influenced mainly by the individual characteristics of each customer. The demographics of the company’s customer base, including the default risk of the industry in which customers operate, has less of an influence on credit risk.
At the reporting date, there were no significant concentrations of credit risk.
The company has established a credit policy under which each new customer is analysed individually for credit worthiness. The company reviews external ratings, when available, and in some cases bank references.
The company does not require collateral in respect of trade and other receivables.
ii) Liquidity risk
Liquidity risk is the risk that the company will not be able to meet its financial obligations as they fall due. The company’s approach to managing liquidity is to ensure, as far as possible, that it will always have sufficient readily available funds to meet its liabilities when due, under both normal and stressed conditions, without incurring unacceptable losses or risking damage to the company’s reputation.
Typically, the company ensures that it has sufficient cash on demand to meet expected operational expenses for a period of 90 days, including the servicing of financial obligations. This excludes the potential impact of extreme circumstances that cannot reasonably be predicted.
iii) Market risk
Market risk is the risk of changes in market prices, such as interest rates, affecting the company’s assets and income. The objective of market risk management is to manage and control market risk exposures within acceptable parameters, while optimising the return.
b) Credit risk
Exposure to credit risk
The carrying amount of the company’s financial assets represents the maximum credit exposure.
2015 2014
$ $
Cash and cash equivalents 338,356 224,110
Trade and other receivables 183,273 192,529
521,629 416,639
Sunshine Coast Destination Limited Annual Report 2014/2015 41
Notes to Financial Statements for the year ended 30 June 2015 12. Financial Instruments (continued)
b) Credit risk (continued)
The company’s maximum exposure to credit risk for trade receivables at the reporting date by geographic region was:
2015 2014
$ $
Australia 183,273 192,529
Other regions - -
183,273 192,529
The company’s maximum exposure to credit risk for trade receivables at the reporting date by type of customer was:
2015 2014 $ $
Government entities 131,981 103,398
Non-Government entities 51,292 89,131
183,273 192,529
Impairment losses
The ageing of the company’s trade receivables at the reporting date was:
2015 2014
Gross Impairment Gross Impairment
$ $ $ $
Current 121,522 - 90,900 -
31 to 60 days 2,237 - 7,006 -
61 to 90 days 57,924 - 84,948 (24,500)
91 days and over 4,523 (2,933) 39,078 (4,903)
186,206 (2,933) 221,932 (29,403)
c) Liquidity risk
Finance leases on motor vehicles of which there are 8 (2014:9), commencing between 2013 and 2014, range from two to five year leases and all leases have an option to purchase at the end of the lease term. No debt covenants or other such arrangements are in place.
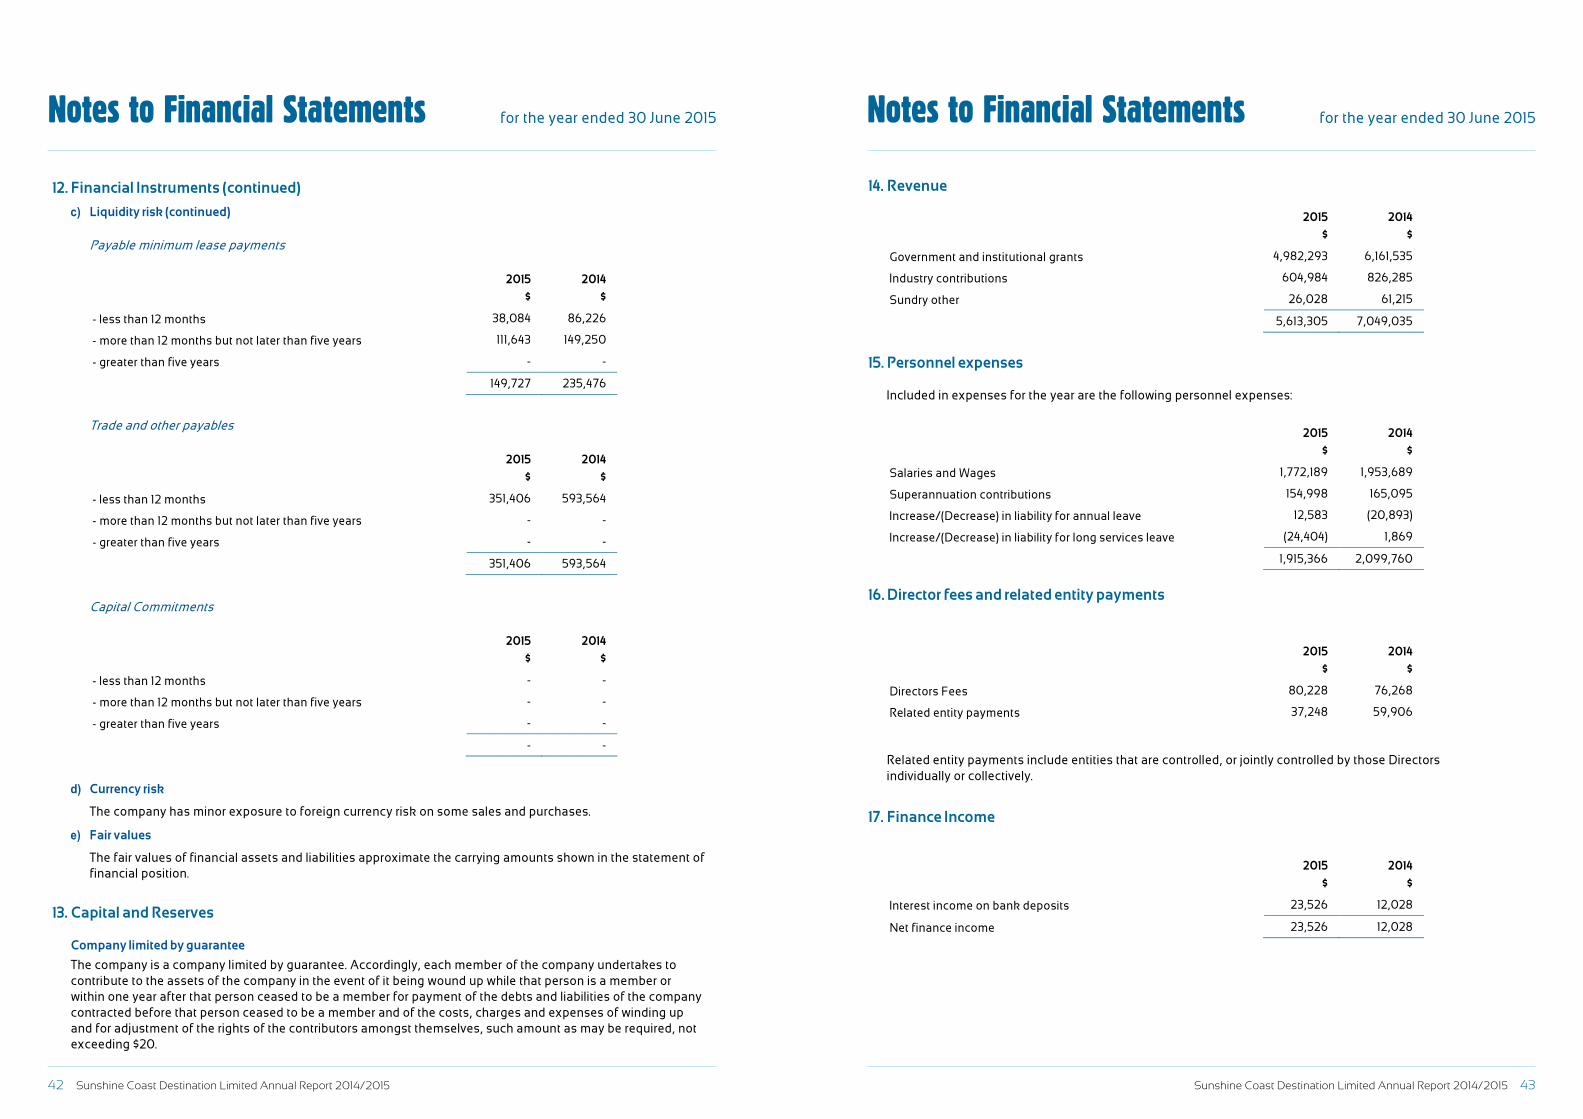
42 Sunshine Coast Destination Limited Annual Report 2014/2015 Sunshine Coast Destination Limited Annual Report 2014/2015 43
Notes to Financial Statements for the year ended 30 June 2015 Notes to Financial Statements for the year ended 30 June 2015
Sunshine Coast Destination Limited Annual Report 2014/2015 42
Notes to Financial Statements for the year ended 30 June 2015 12. Financial Instruments (continued)
c) Liquidity risk (continued)
Payable minimum lease payments
2015 2014
$ $
- less than 12 months 38,084 86,226
- more than 12 months but not later than five years 111,643 149,250
- greater than five years - -
149,727 235,476
Trade and other payables
2015 2014
$ $
- less than 12 months 351,406 593,564
- more than 12 months but not later than five years - -
- greater than five years - -
351,406 593,564
Capital Commitments
2015 2014
$ $
- less than 12 months - -
- more than 12 months but not later than five years - -
- greater than five years - -
- -
d) Currency risk
The company has minor exposure to foreign currency risk on some sales and purchases.
e) Fair values
The fair values of financial assets and liabilities approximate the carrying amounts shown in the statement of financial position.
13. Capital and Reserves
Company limited by guarantee
The company is a company limited by guarantee. Accordingly, each member of the company undertakes to contribute to the assets of the company in the event of it being wound up while that person is a member or within one year after that person ceased to be a member for payment of the debts and liabilities of the company contracted before that person ceased to be a member and of the costs, charges and expenses of winding up and for adjustment of the rights of the contributors amongst themselves, such amount as may be required, not exceeding $20.
Sunshine Coast Destination Limited Annual Report 2014/2015 43
Notes to Financial Statements for the year ended 30 June 2015 14. Revenue
2015 2014
$ $
Government and institutional grants 4,982,293 6,161,535
Industry contributions 604,984 826,285
Sundry other 26,028 61,215
5,613,305 7,049,035
15. Personnel expenses
Included in expenses for the year are the following personnel expenses:
2015 2014
$ $
Salaries and Wages 1,772,189 1,953,689
Superannuation contributions 154,998 165,095
Increase/(Decrease) in liability for annual leave 12,583 (20,893)
Increase/(Decrease) in liability for long services leave (24,404) 1,869
1,915,366 2,099,760
16. Director fees and related entity payments
2015 2014
$ $
Directors Fees 80,228 76,268
Related entity payments 37,248 59,906
Related entity payments include entities that are controlled, or jointly controlled by those Directors individually or collectively.
17. Finance Income
2015 2014
$ $
Interest income on bank deposits 23,526 12,028
Net finance income 23,526 12,028
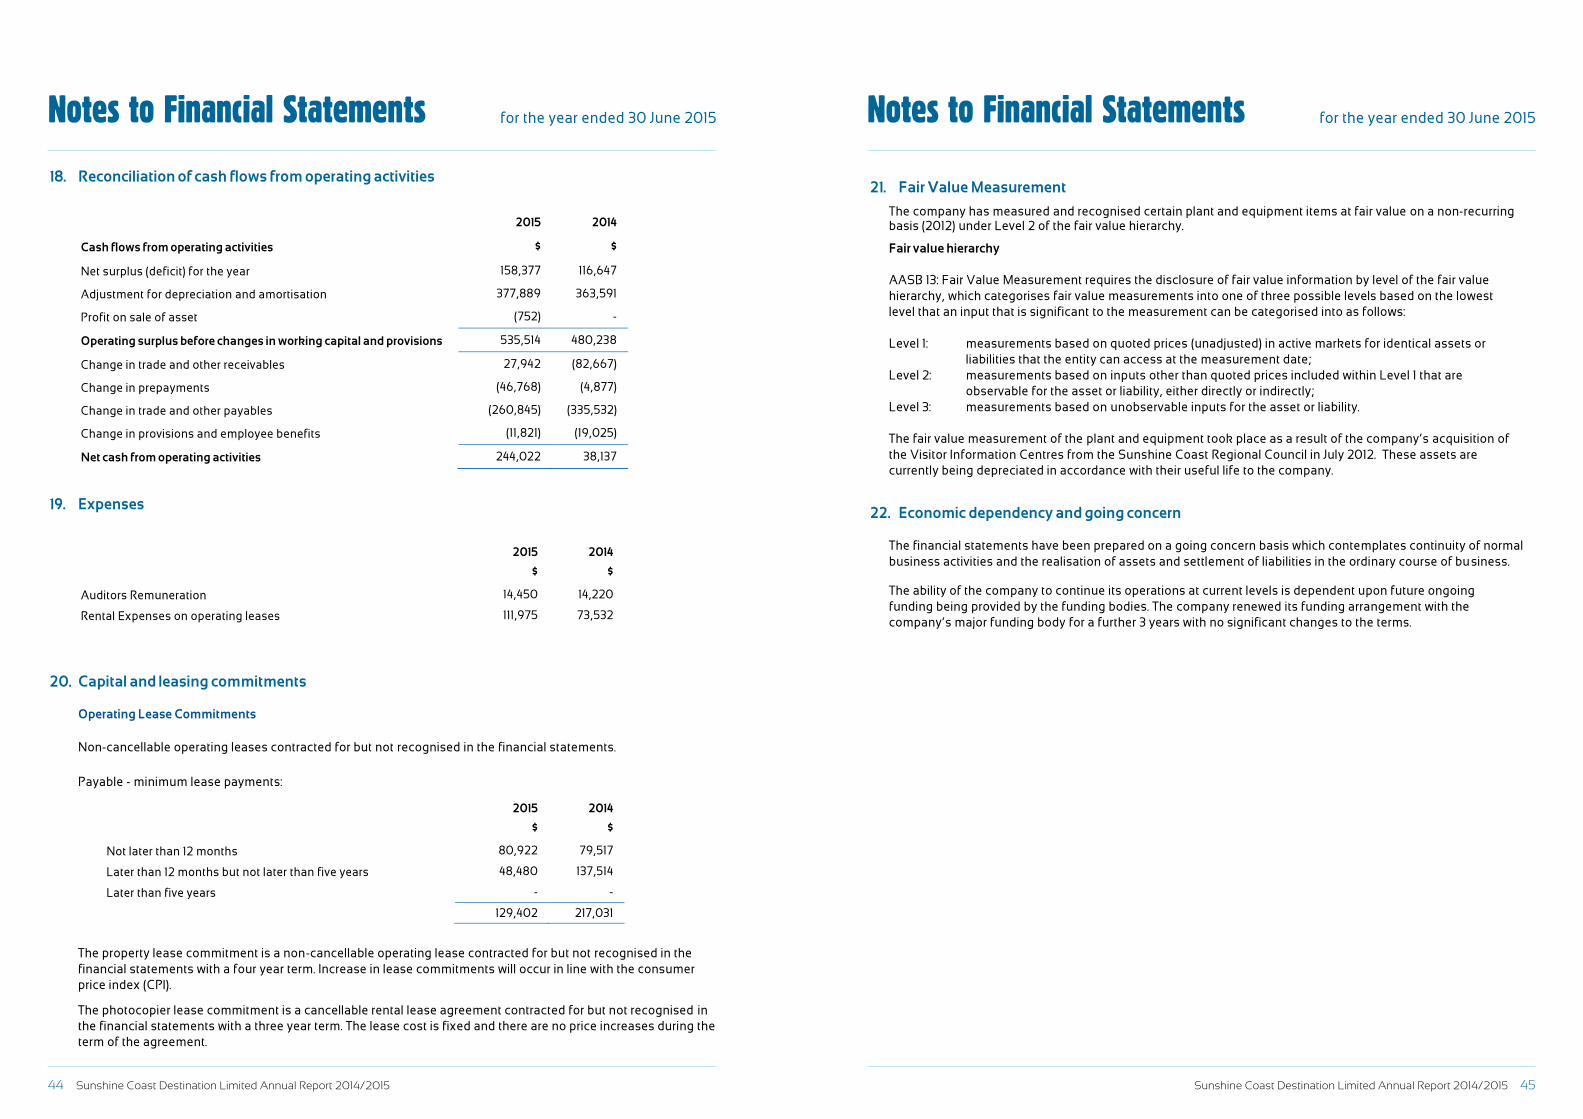
44 Sunshine Coast Destination Limited Annual Report 2014/2015 Sunshine Coast Destination Limited Annual Report 2014/2015 45
Notes to Financial Statements for the year ended 30 June 2015 Notes to Financial Statements for the year ended 30 June 2015
Sunshine Coast Destination Limited Annual Report 2014/2015 44
Notes to Financial Statements for the year ended 30 June 2015 18. Reconciliation of cash flows from operating activities
2015 2014
Cash flows from operating activities $ $
Net surplus (deficit) for the year 158,377 116,647
Adjustment for depreciation and amortisation 377,889 363,591
Profit on sale of asset (752) -
Operating surplus before changes in working capital and provisions 535,514 480,238
Change in trade and other receivables 27,942 (82,667)
Change in prepayments (46,768) (4,877)
Change in trade and other payables (260,845) (335,532)
Change in provisions and employee benefits (11,821) (19,025)
Net cash from operating activities 244,022 38,137
19. Expenses
2015 2014
$ $
Auditors Remuneration 14,450 14,220
Rental Expenses on operating leases 111,975 73,532
20. Capital and leasing commitments
Operating Lease Commitments Non-cancellable operating leases contracted for but not recognised in the financial statements. Payable - minimum lease payments:
2015 2014
$ $
Not later than 12 months 80,922 79,517
Later than 12 months but not later than five years 48,480 137,514
Later than five years - -
129,402 217,031
The property lease commitment is a non-cancellable operating lease contracted for but not recognised in the financial statements with a four year term. Increase in lease commitments will occur in line with the consumer price index (CPI). The photocopier lease commitment is a cancellable rental lease agreement contracted for but not recognised in the financial statements with a three year term. The lease cost is fixed and there are no price increases during the term of the agreement.
Sunshine Coast Destination Limited Annual Report 2014/2015 45
Notes to Financial Statements for the year ended 30 June 2015 21. Fair Value Measurement
The company has measured and recognised certain plant and equipment items at fair value on a non-recurring basis (2012) under Level 2 of the fair value hierarchy.
Fair value hierarchy AASB 13: Fair Value Measurement requires the disclosure of fair value information by level of the fair value hierarchy, which categorises fair value measurements into one of three possible levels based on the lowest level that an input that is significant to the measurement can be categorised into as follows: Level 1: measurements based on quoted prices (unadjusted) in active markets for identical assets or
liabilities that the entity can access at the measurement date; Level 2: measurements based on inputs other than quoted prices included within Level 1 that are
observable for the asset or liability, either directly or indirectly; Level 3: measurements based on unobservable inputs for the asset or liability. The fair value measurement of the plant and equipment took place as a result of the company’s acquisition of the Visitor Information Centres from the Sunshine Coast Regional Council in July 2012. These assets are currently being depreciated in accordance with their useful life to the company.
22. Economic dependency and going concern
The financial statements have been prepared on a going concern basis which contemplates continuity of normal business activities and the realisation of assets and settlement of liabilities in the ordinary course of business. The ability of the company to continue its operations at current levels is dependent upon future ongoing funding being provided by the funding bodies. The company renewed its funding arrangement with the company’s major funding body for a further 3 years with no significant changes to the terms.
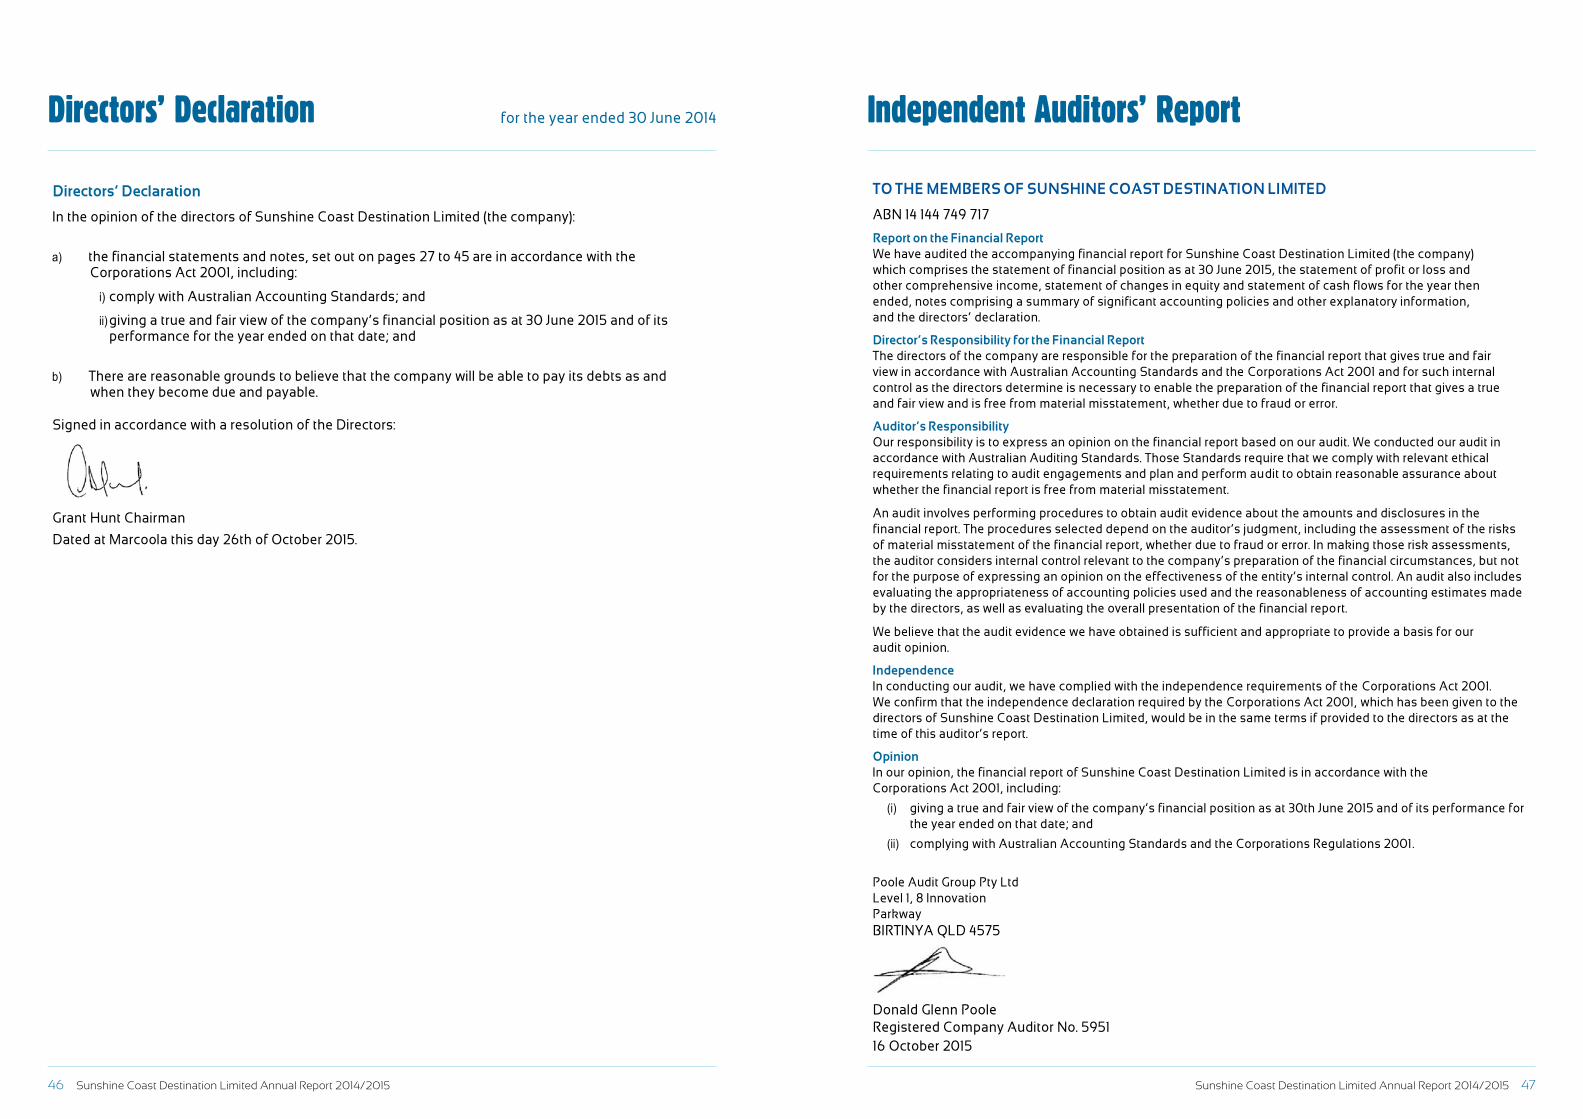
46 Sunshine Coast Destination Limited Annual Report 2014/2015 Sunshine Coast Destination Limited Annual Report 2014/2015 47
Directors’ Declaration for the year ended 30 June 2014 Independent Auditors’ Report
Sunshine Coast Destination Limited Annual Report 2014/2015 46
Directors’ Declaration for the year ended 30 June 2015 Directors’ Declaration
In the opinion of the directors of Sunshine Coast Destination Limited (the company):
a) the financial statements and notes, set out on pages 27 to 45 are in accordance with the Corporations Act 2001, including:
i) comply with Australian Accounting Standards; and
ii) giving a true and fair view of the company’s financial position as at 30 June 2015 and of its performance for the year ended on that date; and
b) There are reasonable grounds to believe that the company will be able to pay its debts as and when they become due and payable.
Signed in accordance with a resolution of the Directors:
Grant Hunt Chairman
Dated at Marcoola this day 26th of October 2015.
Independent Auditors’ Report
TO THE MEMBERS OF SUNSHINE COAST DESTINATION LIMITED
ABN 14 144 749 717
Report on the Financial Report We have audited the accompanying financial report for Sunshine Coast Destination Limited (the company) which comprises the statement of financial position as at 30 June 2015, the statement of profit or loss and other comprehensive income, statement of changes in equity and statement of cash flows for the year then ended, notes comprising a summary of significant accounting policies and other explanatory information, and the directors’ declaration.
Director’s Responsibility for the Financial Report The directors of the company are responsible for the preparation of the financial report that gives true and fair view in accordance with Australian Accounting Standards and the Corporations Act 2001 and for such internal control as the directors determine is necessary to enable the preparation of the financial report that gives a true and fair view and is free from material misstatement, whether due to fraud or error.
Auditor’s Responsibility Our responsibility is to express an opinion on the financial report based on our audit. We conducted our audit in accordance with Australian Auditing Standards. Those Standards require that we comply with relevant ethical requirements relating to audit engagements and plan and perform audit to obtain reasonable assurance about whether the financial report is free from material misstatement.
An audit involves performing procedures to obtain audit evidence about the amounts and disclosures in the financial report. The procedures selected depend on the auditor’s judgment, including the assessment of the risks of material misstatement of the financial report, whether due to fraud or error. In making those risk assessments, the auditor considers internal control relevant to the company’s preparation of the financial circumstances, but not for the purpose of expressing an opinion on the effectiveness of the entity’s internal control. An audit also includes evaluating the appropriateness of accounting policies used and the reasonableness of accounting estimates made by the directors, as well as evaluating the overall presentation of the financial report.
We believe that the audit evidence we have obtained is sufficient and appropriate to provide a basis for our audit opinion.
Independence In conducting our audit, we have complied with the independence requirements of the Corporations Act 2001. We confirm that the independence declaration required by the Corporations Act 2001, which has been given to the directors of Sunshine Coast Destination Limited, would be in the same terms if provided to the directors as at the time of this auditor’s report.
Opinion In our opinion, the financial report of Sunshine Coast Destination Limited is in accordance with the Corporations Act 2001, including:
(i) giving a true and fair view of the company’s financial position as at 30th June 2015 and of its performance for the year ended on that date; and
(ii) complying with Australian Accounting Standards and the Corporations Regulations 2001.
Poole Audit Group Pty Ltd Level 1, 8 Innovation Parkway BIRTINYA QLD 4575
Donald Glenn Poole Registered Company Auditor No. 5951 16 October 2015
48 Sunshine Coast Destination Limited Annual Report 2014/2015
Sunshine Coast Destination Ltd10 Electra Lane, MarcoolaPO Box 9325, Pacific Paradise, Queensland 4564T: 07 5458 8800 E: [email protected] W: scdl.com.au | visitsunshinecoast.com.au
SC
DL
An
nu
al R
epo
rt 2
015
V1/
00
11