Embed Size (px)
Citation preview

2016
7 April 2016
Summer Outlook Report

To help you find the information you need quickly and easily, we have published the Summer Outlook Report as an interactive document.
Home buttonThis will take you to the contents page. You can click on the titles to navigate to a section.
ArrowsClick on the arrows to move backwards or forwards a page.
A to ZYou will find a link to the glossary on each page.
HyperlinksHyperlinks are highlighted in bold throughout the report. You can click on them to access further information.
Contents
How to use this document
Foreword 1Executive summary 2Stakeholder engagement 6National Grid’s role 8Gas: Summer Outlook 10Fuel prices 11Gas demand 14Gas supply 21Gas system operability 26Electricity: Summer Outlook 30Summer demand and generation 31Operational view 43Operational toolbox 51Glossary 58

Summer Outlook Report 1
Foreword
Welcome to our 2016 Summer Outlook Report, where we share our latest view on the gas and electricity systems for the summer ahead.
Our outlook reports continue to evolve to reflect our stakeholders’ feedback, as we aim to provide you with the tools you need to plan for the coming months. We have made some changes to the structure and content of the report this year, just as we have done for our other outlook publications. We hope you’ll find it a valuable and accessible source of information.
With significant changes occurring in the energy sector, we’re re-thinking how we operate the gas and electricity systems. This brings with it exciting market opportunities. We’re working with stakeholders across the energy industry, as well as academics and researchers, to explore, build and implement new ways of balancing the networks.
For electricity, we expect to see further falls in both peak and minimum demands this summer. In response, we’re exploring new demand side services, which offer opportunities for large energy users to voluntarily shift their electricity usage in exchange for payment. As supply becomes increasingly dependent on weather, we are working with a number of stakeholders to improve our solar generation forecasting.
For gas, a variety of supply sources and changing demand patterns in the summer continue to reduce the predictability of flows and present us with new challenges
in operating the system. You can find out more in the report about how we’re managing and maintaining the network, while continuing to improve the experience for our customers.
We want to support your business planning by improving when and how we engage with you. To help you make decisions for next winter, we’ll be publishing our review of winter 2015/16 earlier than usual, next month in May. The consultation process for next winter will be launched separately in early summer 2016.
Our outlook reports are just one source of information in our suite of ‘Future of Energy’ publications. As the energy landscape continues to evolve, I encourage you to read our other documents, which cover potential developments in the industry over the next ten years and out to 2050. Go to our website to find out more and register for email updates.
Thank you for taking the time to read this year’s Summer Outlook Report. We hope it helps you to prepare for this summer and beyond.
We want to make sure our publications are as useful to you as possible, so please let us know what you think. You can share your feedback via our website, or by emailing us at [email protected]. You can also join the debate in real time on Twitter using #NGSummerOutlook or on our LinkedIn Future of Energy page.
Cordi O’HaraDirector, UK System Operator

2
Executive summaryThe Summer Outlook Report is an annual publication delivered by National Grid, which presents our view of the gas and electricity systems for the summer ahead (April to October). It is designed to inform and enable the energy industry to prepare for the summer months.
Overview: Gas summer 2016
Great Britain (GB) benefits from highly diverse and flexible sources of gas supply. We are confident that this range of supply sources will be sufficient to ensure demand is met this summer.
Our analysis of fuel prices suggests that gas will be favoured over coal for power generation this summer. However, when comparing coal with lower-efficiency gas plants, the price differential is very narrow. It is likely that a small change in either fuel or the carbon price could increase competition between coal and lower-efficiency gas.
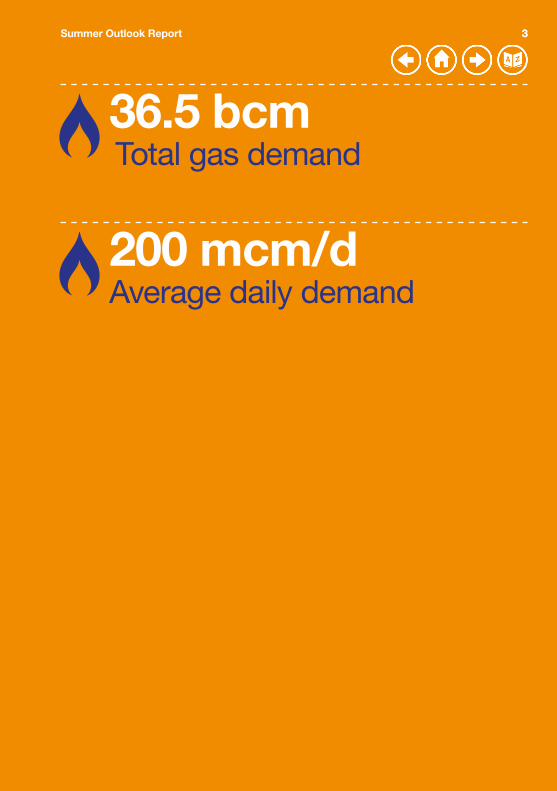
Gas demand is expected to be higher than last year. This is mainly because of the lower cost of gas for electricity generation. Total gas demand for this summer is forecast at 36.5 bcm with an average daily demand of 200 mcm/d.
Supplies from the UK Continental Shelf (UKCS) and Norway are expected to be similar to last year and will continue to make up the majority of GB’s gas supply. Imports from the Netherlands, via the BBL pipeline, are likely to remain low this summer due to continued production restrictions at the Groningen field. With high global availability of liquefied natural gas (LNG), we expect higher volumes to be delivered to GB compared to summer 2015.
Although the diversity of supply benefits GB gas security, the varied sources lead to greater operational unpredictability. In addition, we are also seeing greater demand variability on the system due to changing storage and gas-fired power station requirements. So that we can respond, we need a network that is more flexible than ever before. We’re working with the industry to make sure that we can plan the most efficient and cost-effective network, while continuing to meet the needs of our customers.
3Summer Outlook Report 3
200 mcm/d Average daily demand
36.5 bcm Total gas demand
4
Overview: Electricity summer 2016
We expect there will be sufficient generation available to meet demand this summer. Periods of low demand have implications on how we operate the system. We focus on how we’re responding to summer operability issues in the electricity section of the report.
We expect to see a fall in electricity demand this summer compared to last year, with both lower peak and minimum demand levels. The peak demand forecast for the high summer is 35.7 GW, while the summer minimum is 18.1 GW.
We currently expect there to be sufficient generation and interconnector imports to meet British Summer Time demand. Our operational view is based on data provided to us on 31 March. As generators update their outage plans, the level of operational surplus may increase or decrease. We encourage you to regularly access the latest operational data by visiting the BM Reports website.
Based on current information we anticipate that during some weeks there will be more inflexible generation on the system than is needed to meet demand. In order to balance the system, it may be necessary, during these weeks, for us to instruct inflexible generators to reduce their output.
In the summer, we need to take into consideration how periods of low demand and within-day supply and demand variability impact on the operation of the transmission system. The operational toolbox section of this document introduces the range of tools and services that are available to us as the System Operator. These ensure that we can maintain sufficient levels of flexibility and reserve to securely operate the system under a range of scenarios.

5Summer Outlook Report
35.7 GWPeak demand forecast
18.1 GWSummer minimum demand

6
Stakeholder engagement
Our outlook reports present our analysis of the gas and electricity systems for the coming six months. They are informed by the feedback and information received from a broad range of stakeholders, which underpins the development of our outlook.
In November 2015 we asked you to tell us what you thought of last year’s outlook reports. You told us that you liked the presentation of our analysis and found that concepts were well explained. In particular, you found the key terms and glossary helpful.
Based on your feedback, we have updated the presentation of this Summer Outlook Report so that it aligns with our other publications. You will find the big picture and key messages at the start of each section, before our detailed analysis. You can click on the link at the top of any page to be taken to the glossary, where you’ll find definitions and links to further information.
We want to make sure that our reports continue to improve and provide you with the right information to support your business planning. To do this we’d like to know what you think of this report. You can share your feedback via the short survey on our website or by emailing us at [email protected].
Our publications This report is the second in our suite of ‘Future of Energy’ publications for 2016. In May we’ll be publishing our review of winter 2015/16. To help us understand the views of our stakeholders on supply and demand for next winter, we’ll then be launching our Winter Consultation in early summer. The feedback we receive from the consultation process shapes our analysis, from the assumptions underlying our forecasts to the layout and style of the report. We hope you’ll be able to provide your views.
We’ll be launching this year’s Future Energy Scenarios (FES) in London on 5 July. FES presents a range of credible pathways for the future of energy out to 2050. You can find out more and apply for a ticket to the launch event on our dedicated FES website.

7Summer Outlook Report
For further information please go to our website.
Developm
ent of the gas and electricity
transmission system
s
Gas Ten YearStatement
November 2016
Electricity Ten Year StatementNovember 2016
System OperabilityFramework
November 2016
Operability assessm
ent of the electricity netw
ork
Credible pathways for energy out to 2050
Supply and demand for the year ahead
Future EnergyScenarios5 July 2016
Future EnergyScenarios
stakeholderfeedback document
January 2016
SummerOutlook Report
April 2016
WinterOutlook Report
October 2016
2016
Winter Outlook Report
WinterReview
May 2016
2016
Winter Review
WinterConsultation
June 2016
2016
Winter Consultation
Future of Energy publications 2016
8
National Grid’s role
National Grid owns and manages the gas and electricity networks that connect homes and businesses to the energy they need.
We own and operate the high pressure gas transmission network for the whole of Great Britain. We are responsible for managing the flow of gas to homes and businesses, working with other companies to make sure that gas is available where and when it is needed.
We do not own the gas we transport and neither do we sell it to consumers. That is the responsibility of the energy suppliers and shippers.
On the electricity side, we own and manage the high voltage electricity transmission network in England and Wales. We are also the System Operator of the high voltage electricity transmission network for the whole of Great Britain, balancing the flows of electricity to homes and businesses in real time.
We don’t generate electricity and we don’t sell it to consumers. It is the role of the energy suppliers to buy enough electricity from the power stations and other electricity producers to meet their customers’ needs. Once that electricity enters our network, our job is to fine-tune the system to make sure supply and demand are balanced on a second-by-second basis.
Together, these networks connect people to the energy they use.

Summer Outlook Report 9

10
Gas Summer Outlook
This chapter sets out our current view of the gas system for summer 2016. It details our analysis of supply and demand and outlines how we are managing the network to make sure we meet our customers’ needs.
The chapter contains the following sections:
n Fuel pricesn Gas demandn Gas supplyn Gas system operability

11Summer Outlook Report
Key messagesn Gas is likely to be the preferred fuel for electricity generation this summern However, when comparing coal to lower-efficiency gas plant, the price
differential is narrow. A small change in price may lead to fuel switchingn While liquefied natural gas (LNG) prices in East Asia are expected to be
slightly higher than in Europe, flattening demands and increasing supplies in the Pacific Basin may result in higher LNG supplies to the UK and Europe
n Oil prices continue to be low.
Fuel pricesIn our Summer Outlook Report we concentrate on how short-term uncertainty in prices is likely to influence the choice of fuel for electricity generation this summer. This is because fuel prices for electricity generation are largely governed by shorter-term spot markets. As a result, any uncertainty in fuel prices over a short time period, such as the summer ahead, is likely to have a greater effect on the choice of fuel for electricity generation. In contrast, fuel prices for end users are generally based on tariffs that respond to longer-term trends in wholesale prices.
Key termsn Liquefied natural gas (LNG): formed by chilling gas to -161˚C so that it occupies
600 times less space than in its gaseous formn Combined cycle gas turbine (CCGT): a power station that uses the combustion
of natural gas or liquid fuel to drive a gas turbine generator to produce electricity. The exhaust gas from this process is used to produce steam in a heat recovery boiler. This steam then drives a turbine generator to generate more electricity
n National balancing point (NBP) gas price: the wholesale gas market in Britain has one price for gas, irrespective of where it has come from. This is called the national balancing point price of gas. It is usually quoted in pence per therm.
12
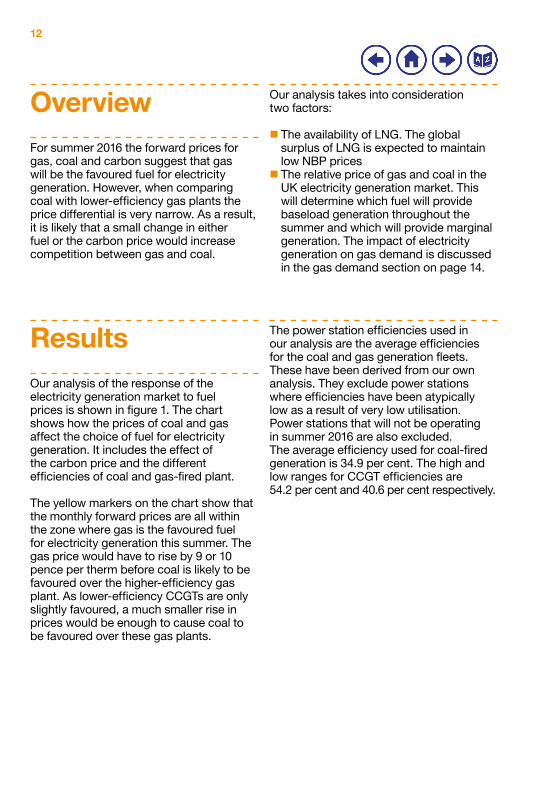
Overview For summer 2016 the forward prices for gas, coal and carbon suggest that gas will be the favoured fuel for electricity generation. However, when comparing coal with lower-efficiency gas plants the price differential is very narrow. As a result, it is likely that a small change in either fuel or the carbon price would increase competition between gas and coal.
Results Our analysis of the response of the electricity generation market to fuel prices is shown in figure 1. The chart shows how the prices of coal and gas affect the choice of fuel for electricity generation. It includes the effect of the carbon price and the different efficiencies of coal and gas-fired plant.
The yellow markers on the chart show that the monthly forward prices are all within the zone where gas is the favoured fuel for electricity generation this summer. The gas price would have to rise by 9 or 10 pence per therm before coal is likely to be favoured over the higher-efficiency gas plant. As lower-efficiency CCGTs are only slightly favoured, a much smaller rise in prices would be enough to cause coal to be favoured over these gas plants.
The power station efficiencies used in our analysis are the average efficiencies for the coal and gas generation fleets. These have been derived from our own analysis. They exclude power stations where efficiencies have been atypically low as a result of very low utilisation. Power stations that will not be operating in summer 2016 are also excluded. The average efficiency used for coal-fired generation is 34.9 per cent. The high and low ranges for CCGT efficiencies are 54.2 per cent and 40.6 per cent respectively.
Our analysis takes into consideration two factors:
nThe availability of LNG. The global surplus of LNG is expected to maintain low NBP prices
nThe relative price of gas and coal in the UK electricity generation market. This will determine which fuel will provide baseload generation throughout the summer and which will provide marginal generation. The impact of electricity generation on gas demand is discussed in the gas demand section on page 14.

13Summer Outlook Report
Figure 1Coal and gas prices and the impact on electricity generation
Gas
(p/t
h)
20
30
50
40
60
30 35 40 45
Coal ($/tonne)
50 55 60 65 70
Coal favouredUncertainGas favoured Price indication Gas efficiency range (41% – 54%)
Gas burn favoured
Coal burn favoured
Coal/gas burn
Carbon (�/tonne): 28.2
April 16 – September 1654% CCGT efficiency
41% CCGT efficiency
14
Key messagesn Gas demand for electricity generation is anticipated to be high as forward
prices indicate gas as the lower-cost fuel for generationn Non-daily metered (NDM) demand is dependent on weather conditions.
Historically NDM has been most variable in April and Mayn Gas exports to Ireland will be lower than last year. This is as a result of the
start of supplies flowing from the Corrib gas field to the Republic of Ireland.
Gas demandFor summer 2016, gas demand is expected to be higher than last year’s weather corrected demand, particularly for electricity generation. The recent fall in gas prices is reflected in the latest forward prices, which indicate gas as the lower-cost fuel for generation.
Key termsn Non-daily metered (NDM) demand: a classification of demand, which typically
includes residential, commercial or smaller industrial consumersn Weather corrected demand: demand calculated with the impact of the weather
removed. This is sometimes known as ‘underlying demand’. Weather is one of the main drivers of the difference in demand from one day to the next. We take out the impact of the weather to understand other important underlying trends
n Composite weather variable (CWV): temperature explains most of the variation in gas demand but a better fit can be obtained by including other variables. The combination of temperature and other weather variables is called the composite weather variable.

15Summer Outlook Report
Daily demand Figure 2 shows the actual demands in summer 2015. Features worth highlighting are:
nExports to Ireland and daily metered demands remained largely flat over the summer and in line with projections
nStorage injection was in line with the previous summers, while imports on the IUK interconnector were higher than summer 2014. An outage in June led to increased storage injection
This summer we are anticipating significantly higher gas demand for electricity generation than the previous few summers. The recent fall in gas prices is reflected in the latest forward prices, which indicate gas as the lower-cost fuel for generation. Subsequently, our projections are in line with that of summer 2011 when gas was previously the lower-cost fuel for generation.
nNon-daily metered (NDM) demand was slightly higher than forecast due to prolonged periods of weather below seasonal normal conditions
nGas for electricity generation was higher than forecast. This reflected higher coal prices and lower gas prices than expected. The gas prices declined throughout the summer and, although both fuels were affected by an increasing EU Emissions Trading Scheme (ETS) price, this had a greater impact on coal-fired electricity generation than gas-fired.
Figure 3 and tables 1 and 2 show the forecast for summer 2016. Forecast values are derived using seasonal normal weather conditions. We have not made any assumptions concerning unplanned outages at any sites. Our electricity generation approach considers standard annual plant availability assumptions.
Figure 2Summer 2015 actual gas demand
0
mcm
/d
50
150
100
200
300
250
350
400
01 A
pr
01 M
ay
01 J
un
01 J
ul
01 A
ug
01 S
ep
IUK physical exportsStorage injectionElectricity generationNon-daily meteredDaily meteredExports to Ireland

16
Figure 3Summer 2016 forecast gas demand
0
mcm
/d
50
150
100
200
300
250
350
01 A
pr
01 M
ay
01 J
un
01 J
ul
01 A
ug
01 S
ep
IUK physical exportsStorage injectionElectricity generationNon-daily meteredDaily meteredExports to Ireland
The Corrib gas field, west of Ireland, obtained permits to start flowing in December 2015. We expect that, following a pipeline inspection, an increase in supplies from the gas field into the Republic of Ireland will occur mid to late summer. This will reduce the requirement for GB gas exports to Ireland.
Table 1 shows the forecast daily average demand for summer 2016. For comparison we show the actual daily average demand for summer 2015 (as observed) and the weather corrected daily average demand. The weather corrected daily average demand is the value we would have observed had the weather been seasonally normal.
Table 1Average daily demands (mcm/d)
Daily average2015
actual2015 weather
corrected2016
forecastNDM 62 59 58DM + Industrial 23 23 24Ireland 15 15 8Electricity generation 46 46 66Total demand 146 143 157IUK export 27 27 22Storage injection 19 19 20GB total 192 189 200
17Summer Outlook Report
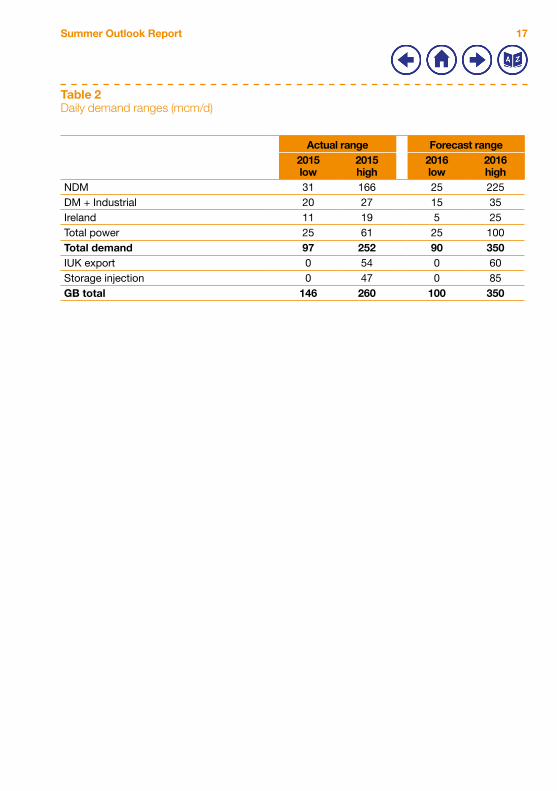
Table 2Daily demand ranges (mcm/d)
Actual range Forecast range2015low
2015high
2016low
2016high
NDM 31 166 25 225DM + Industrial 20 27 15 35Ireland 11 19 5 25Total power 25 61 25 100Total demand 97 252 90 350IUK export 0 54 0 60Storage injection 0 47 0 85GB total 146 260 100 350

18
Figure 4Summer composite weather
0
Com
posi
te w
eath
er
2
6
4
12
10
8
16
14
18
01 A
pr08
Apr
15 A
pr22
Apr
29 A
pr06
May
13 M
ay20
May
27 M
ay03
Jun
10 J
un17
Jun
24 J
un01
Jul
08 J
ul15
Jul
22 J
ul29
Jul
05 A
ug12
Aug
19 A
ug26
Aug
02 S
ep09
Sep
16 S
ep23
Sep
Seasonal normalSummer 2015Historic range
The impact of weather on summer gas demandFigure 4 shows the historical composite weather variable (CWV), which can be regarded as a proxy for temperature, along with seasonal normal conditions and actual conditions for summer 2015.
The CWV is capped at 15.8 as gas demand does not respond to weather conditions above this. This means that in warmer months (June, July and August) there is very little variation in CWVs and subsequently less variation in weather sensitive gas demands, such as in the residential sector. The wide range of CWVs possible in April and May can lead to greater variations in demand. It is likely that the highest gas demand for the summer will occur in these months.
For summer 2015, weather conditions tended to be slightly colder than seasonal normal. This resulted in a two per cent higher demand than had weather conditions been seasonally normal.

19Summer Outlook Report
Figure 5Summer storage stocks 2011-2015
0
Sto
rage
sto
cks
(bcm
)
3
2
1
5
4
6
01 A
pr
01 M
ay
01 J
un
01 J
ul
01 A
ug
01 S
ep
Projected stock level for 20162015201420132012
Storage injectionFigure 5 shows storage stocks for the last five years. The position in 2016 is close to the middle of this range. It is much higher than the low of 0.3 bcm in 2013, which
We will report on the implications for winter gas supplies in the Winter Outlook Report in October. Note that the historical storage injection shown in tables 1 and 2 is for the total injection over the summer. This includes fast cycle mid-range storage sites that might be expected to inject and withdraw many times throughout the summer.
followed a cold February and March, but lower than the values at the end of the milder 2012 and 2014 winters. The storage capacity at Rough is still reduced, similar to summer 2015. It was reduced in March 2015 from 3.3 bcm to between 2.6 and 2.9 bcm. The restriction is not expected to be lifted before December 2016. Taking this into account, the net injection over the summer is expected to be in line with last year.
20
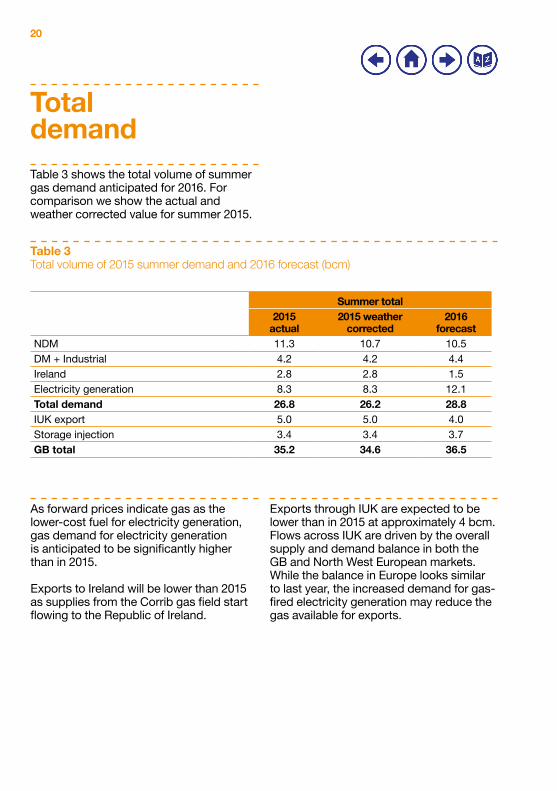
Total demand Table 3 shows the total volume of summer gas demand anticipated for 2016. For comparison we show the actual and weather corrected value for summer 2015.
Table 3Total volume of 2015 summer demand and 2016 forecast (bcm)
Summer total2015
actual2015 weather
corrected2016
forecastNDM 11.3 10.7 10.5DM + Industrial 4.2 4.2 4.4Ireland 2.8 2.8 1.5Electricity generation 8.3 8.3 12.1Total demand 26.8 26.2 28.8IUK export 5.0 5.0 4.0Storage injection 3.4 3.4 3.7GB total 35.2 34.6 36.5
As forward prices indicate gas as the lower-cost fuel for electricity generation, gas demand for electricity generation is anticipated to be significantly higher than in 2015.
Exports to Ireland will be lower than 2015 as supplies from the Corrib gas field start flowing to the Republic of Ireland.
Exports through IUK are expected to be lower than in 2015 at approximately 4 bcm. Flows across IUK are driven by the overall supply and demand balance in both the GB and North West European markets. While the balance in Europe looks similar to last year, the increased demand for gas-fired electricity generation may reduce the gas available for exports.

21Summer Outlook Report
Key messagesn There will be adequate gas supplies to meet demand this summern Gas supplies from the UK Continental Shelf, Norway and continental
imports are likely to be similar to summer 2015n With high global availability of LNG, we expect slightly higher volumes
to be delivered to GB this summer compared to 2015.
Gas supplyWith a range of supply sources, gas supplies to GB are expected to be sufficient to meet predicted summer demands. Supplies from the UK Continental Shelf and Norway are expected to be similar to last year. Remaining gas demand will be met by continental imports, storage withdrawals and LNG.
Key termsn UK Continental Shelf (UKCS): made up of the areas of the sea bed and
subsoil beyond the territorial sea over which the UK exercises sovereign rights of exploration and exploitation of natural resources
n BBL: this gas pipeline runs between Balgzand in the Netherlands and Bacton in the UK
n IUK: the Interconnector (UK) Limited is a gas pipeline connecting Bacton in the UK and Zeebrugge in Belgium.

22
Overview Supplies of gas through the summer for the last five years, and our forecast for 2016, are shown in figure 6 and table 4.
Figure 6Historic and forecast summer gas supplies
0
bcm
10
20
40
30
15
5
25
45
35
50
2011
2012
2013
2014
2015
2016
LNGIUKBBLNorwayUKCSStorage
Table 4Historic and forecast summer gas supplies
(bcm) UKCS Norway LNG Continent Storage Total2011 17.5 7.4 13.0 2.4 0.7 41.12012 15.1 9.8 7.5 2.1 1.4 35.92013 15.1 10.6 5.8 2.3 1.5 35.42014 15.3 7.6 7.6 2.2 1.3 34.02015 15.9 11.3 6.2 0.3 1.1 34.8
Average 15.8 9.3 8.0 1.9 1.2 36.22016 16.3 10.8 8.2 0.2 1.0 36.5

23Summer Outlook Report
UKCS and pipeline importsSupplies from the UK Continental Shelf (UKCS) and Norway are again expected to account for the majority of supply this summer, making up almost 75 per cent of the total.
Supplies from the UKCS are expected to be slightly higher than last year. This is because several new fields have started production, most notably Total’s Laggan in the West of Shetland area. These increases are partly offset by declines from existing fields. UKCS production this summer is expected to be 16.3 bcm or 89 mcm/d. This is approximately 0.4 bcm, or 2 mcm/d, higher than summer 2015.
Imports from Norway are expected to be 10.8 bcm, or 59 mcm/d, this summer. This is a similar level to that seen in 2015.
Imports via the BBL pipeline from the Netherlands are expected to be similar to last year. In 2015, levels of imports were approximately 2 bcm lower than those experienced in previous years. This was driven by increased demand from conversion facilities in the Netherlands to account for lower production from the Groningen field1. With the production cap2 for this year lower than that in place for 2015, there is little prospect of increased imports from the Netherlands. As a result, this summer we expect imports via BBL to total approximately 0.2 bcm, or just over 1 mcm/d. This is marginally lower than the 0.3 bcm imported in 2015. We anticipate there will be several days of zero imports.
The IUK pipeline, connecting GB to Belgium, has historically exported for most of the summer. We expect this to continue for 2016. Flows on IUK are sensitive to the differential between prices in GB and Belgian gas markets. This could lead to occasional periods of import if there is a surplus of supply in Europe, or if prices rise in the GB market due to other supplies being lower than expected.
Liquefied natural gasIn recent years it has become increasingly challenging to predict LNG supply, both for the summer and winter. Availability depends on a number of factors, the most important of which is the price of, and demand for, LNG in East Asia. This affects how much LNG is likely to be delivered to GB.
Historically there has been a peak in LNG deliveries to GB in the early summer. This is when more Middle Eastern cargoes become available due to declining demand in East Asia at the end of the winter. Typically this has been followed by a reduction in deliveries in mid-summer, partly due to increasing electricity demand for air conditioning in East Asia. However, over the previous two years, this mid-summer reduction in GB LNG deliveries has not been as noticeable. This is shown in figure 7.
1 A production cap of 16.5 bcm for the first half of the year was introduced at the Groningen field in February 2015 as a result of seismic activity. This was subsequently extended to 30 bcm for the calendar year.
2 The production cap for gas year 2015/16 has been set at 27 bcm.

24
Figure 7GB monthly LNG imports
0
Mon
thly
LN
G im
port
s (b
cm)
1.5
0.5
2.0
1.0
2.5
Jan
Feb
Mar
Apr
May
Jun
Jul
Aug
Sep Oct
Nov
Dec
2016201520142013
In 2015, a combination of lower demand in East Asia and steadily increasing supply in the Pacific basin, particularly from Australia, meant that more LNG was available for export to Europe.
Figure 8 shows that annual LNG deliveries to GB have increased since 2013. Current LNG deliveries for 2016 are following a similar profile to last year.

25Summer Outlook Report
Figure 8GB cumulative LNG imports
0
Ann
ual L
NG
impo
rts
(bcm
)
10
8
6
4
2
14
12
16
Jan
Feb
Mar
Apr
May
Jun
Jul
Aug
Sep Oct
Nov
Dec
2016 culmulative2015 culmulative2014 culmulative2013 culmulative
For summer 2016, the price of LNG in the East Asia market is still expected to be higher than European prices. However, lower demands in East Asia and higher overall global availability of LNG are expected to result in a surplus that should be available for other destinations. With a surplus of regasification capacity and an integrated downstream market, Europe and GB are expected to benefit from this available supply.
As a result of lower continental supplies, higher gas demands and greater LNG availability, we are anticipating that LNG supply over the summer will be slightly higher than last year.

26
Key messagesn We expect to see continued variability in supply and demand patterns
this summer, with rapid responses to within-day market conditionsn Increased variability and shorter notice periods require greater flexibility
in how we manage and operate the transmission systemn Timely provision of information allows us to optimise how the network
is configured, enabling us to meet customer requirements in an efficient and cost-effective way.
Gas system operabilityWith a diverse range of supply sources, we expect there to be sufficient gas to meet demand this summer. However, this diversity makes it challenging to predict where and when supply and demand will impact on the network. Understanding this variability will help us to plan the most efficient and cost-effective network configuration to meet the needs of our customers.
Key termsn Linepack: the amount of gas within the National Transmission System.
The more linepack in the system, the higher the gas pressure will ben Linepack swing: the difference between the amount of gas in the system
at the start of the day and at the lowest point during the day n Residual balancer: users of the transmission system (gas shippers) are required
to balance supply into and demand from the network. If this balance is not expected to be achieved on any given day then the System Operator, acting as residual balancer, will enter the market and undertake trades (buys or sells) to seek to resolve any imbalance while minimising the impact on the market.
27Summer Outlook Report
Overview The way the gas network is being used by our customers is changing. To meet their requirements, the network needs to be more flexible than ever before.
To ensure the network is configured to its optimum efficiency, there is a requirement to receive details of flows affecting the system in a timely manner. In recent years,
Supply and demand Gas supplies and demands are increasingly variable, with levels changing in response to availability of gas and within-day market conditions. Timely information helps to ensure that we can efficiently respond to these changes.
The supply of gas from the UKCS and Norway is expected to be reasonably predictable this summer. Other sources are likely to be more responsive to short-term market conditions. Storage sites are likely to only supply gas where a favourable commercial opportunity arises. Last year LNG supplies were between 5 and 30 per cent of the total demand (see figure 9). Although we anticipate that LNG supply will be slightly higher than last year, supply can vary as global availability and prices affect the destination of cargoes.
we have seen significant volumes of within- day requests for additional flexibility and shorter lead times for bringing gas on and off the transmission system. Short notice changes make it increasingly challenging to optimise both the configuration of the network and compressor running strategies. This can increase the costs that will ultimately be fed back into the industry. We are continuing to consult the industry to make sure that we meet our customers’ needs in delivering gas in the most efficient and cost-effective way.
Increasing demand variation is more noticeable during the summer, as commercially sensitive offtakes, such as storage sites, interconnectors and some power stations, quickly respond to fluctuating prices. Real-time demand forecasting is likely to be difficult this summer. This is because of the uncertainty of usage from marginal gas power stations and the increasing requirement for flexible gas-fired generation to support balancing.
As supplies and demands change within-day, predicting these changes is important to enable us to devise the most efficient operational strategies. Where changes occur, such as a site returning from outage, it is important that the information is made available in a timely manner. This allows the network to be configured to mitigate pressure fluctuations as the extra gas comes onto, or leaves, the system.

28
Figure 9LNG as a percentage of total demand for summer 2015
0%
Per
cent
age
of to
tal s
uppl
y
20%
15%
10%
5%
30%
25%
35%
1/4/
158/
4/15
15/4
/15
22/4
/15
29/4
/15
6/5/
1513
/5/1
520
/5/1
527
/5/1
53/
6/15
10/6
/15
17/6
/15
24/6
/15
1/7/
158/
7/15
15/7
/15
22/7
/15
29/7
/15
5/8/
1512
/8/1
519
/8/1
526
/8/1
52/
9/15
9/9/
1516
/9/1
523
/9/1
530
/9/1
5
LNG
StorageIn recent years, the behaviour of storage sites has changed as price differentials between summer and winter are much lower than in previous years. This results in commercial changes within-day as prices reflect short-term conditions. Therefore, we are likely to see some withdrawal during the summer, as has been the case for the previous three years. This trend can be seen in figure 10.
As well as the challenges in trying to forecast when storage sites may be refilled this summer, there are additional impacts
to consider if this occurs at numerous sites at the same time. There are a cluster of storage sites on the Yorkshire coast and around Cheshire. Should these react at the same time to a change in price, there is a potential for large supply or demand swings in this area of the network.
Changes in compressor strategies or network configurations may be required to meet local pressure commitments. This is particularly the case when maintenance or local construction activities are being carried out on the transmission system.

29Summer Outlook Report
Figure 10Storage withdrawal and injection summer 2013-2015
-100
mcm
20
0
-60
-20
-40
-80
60
40
80
1/4/
1319
/4/1
37/
5/13
25/5
/13
12/6
/13
30/6
/13
18/7
/13
5/8/
1323
/8/1
310
/9/1
328
/9/1
316
/4/1
44/
5/14
22/5
/14
9/6/
1427
/6/1
415
/7/1
42/
8/14
20/8
/14
7/9/
1425
/9/1
413
/4/1
51/
5/15
19/5
/15
6/6/
1524
/6/1
512
/7/1
530
/7/1
517
/8/1
54/
9/15
22/9
/15
2015 – Sum of withdrawal2015 – Sum of injection2014 – Sum of withdrawal2014 – Sum of injection2013 – Sum of withdrawal2013 – Sum of injection
LinepackWe are continuing to see increasing levels of within-day imbalance between supply and demand, with supply sources flowing less at the start of the day when demand is at its highest. On occasions, this has led to high levels of linepack depletion within day. If we continue to see high linepack swings during the summer period this will have an impact on the operation of the system, how we use the network and how we meet customer output requirements. The result may be an increase in the need for commercial actions to manage this.
If we do see large linepack depletion within day, we have a range of operational and commercial tools available to ensure the continued safety and security of operation. However, these may lead to associated costs or inefficiencies in managing the network.
BalancingThere is an ongoing trend towards later residual balancing as shippers appear to be using fast cycle, flexible storage sites and interconnectors to balance later in the day.
We believe low price differentials between summer and winter are resulting in shippers looking to balance their portfolios in response to short-term price triggers. Over the previous six months, we have seen a greater predominance of ‘buy’ actions from the System Operator. ‘Buys’ accounted for approximately 70 per cent of all actions seen this winter. As later balancing by the shippers has become more common, later actions are now being taken by the System Operator. If this trend continues we may continue to see marginal prices being set later in the day, when residual actions become unavoidable.

30
Electricity Summer Outlook
This chapter sets out our current view of the electricity system for summer 2016. It details our analysis of demand and generation, and outlines the tools and services we have to operate the network during the summer.
The chapter contains the following sections:
n Summer demand and generationn Operational viewn Operational toolbox
31Summer Outlook Report
Summer demand and generation
Key messagesn The peak demand forecast for high summer is the lowest on record,
at 35.7 GW. This compares with 37.5 GW in 2015n Daytime minimum demand is expected to be 23.5 GW, lower than the
2015 minimum of 25.8 GWn Minimum summer demand is forecast to be 18.1 GW. This is a slight
decrease from the 2015 demand of 18.4 GWn Generation capacity for the summer is expected be 67.43 GWn Based on forward prices, we expect there to be net imports of electricity on
the interconnectors from Continental Europe to GBn We expect there to be net exports of electricity on the interconnectors from
GB to Ireland during peak times, switching to imports overnight.
Our summer view presents our analysis of demand and generation for summer 2016. With demand expected to continue falling this summer, the impact on system operability remains the main focus of our analysis.
Key termsn Embedded generation: any generation that is connected directly to the local
distribution network, as opposed to the transmission network. It also includes combined heat and power schemes of any scale. The electricity generated by such schemes is typically used in the local system, rather than being transported across the UK. Generation that is connected to the distribution system is not directly visible to National Grid and therefore acts to reduce demand on the transmission system
n High summer period: the period between 1 June and 31 August or weeks 23 to 35. It is when we expect the greatest number of planned generator outages. At the same time, this is when we normally experience higher demand, predominantly driven by cooling systems
n Transmission system demand (TSD): demand that National Grid, as the System Operator, sees at grid supply points; these are the connections to the distribution networks. It includes demand from the power stations generating electricity (the station load) at 500 MW
n Underlying demand: demand varies from day to day, depending on the weather and the day of week. Underlying demand (also known as basic demand) is a measure of how much demand there is once the effect of the weather and the day of the week have been removed.

32
Overview For the last few years, we have seen levels of demand continuing to fall on the transmission network. As a result, we expect demand this summer to be lower than in 2015. This trend is largely due to an increase in embedded generation, particularly solar photovoltaic (PV). As embedded generation is connected to the distribution network, it is not directly visible to us and acts to reduce demand on the transmission system.
Demand In order to understand the levels of demand we can expect to see this summer, our analysis considers previous summers and longer-term trends.
Assumptions1. Underlying demand Underlying demand, which removes the impact of weather and the day of the week from demand, is expected to be broadly flat, similar to summer 2015.
2. Solar capacityOur current solar capacity assumption, as of February 2016, is 9.3 GW. Our forecasts assume a 200 MW increase in capacity per month to reflect continuing growth in solar generation.
3. Embedded wind capacityEmbedded wind generation is expected to remain broadly flat this summer at 4.1 GW.
ResultsPeak weather corrected demand for high summer 2016 is 35.7 GW. This is our lowest ever forecast. Both the summer and daytime minimum demands on the transmission network are continuing to fall each year.
Table 5 shows the weather corrected summer demands of the previous two years to provide a comparison to the forecast for summer 2016. This is the demand seen on the transmission system, with actual weather removed and the impact of normal weather added.
We regularly update our demand forecasts throughout the year. You can access the latest forecast on the BM Reports website.

33Summer Outlook Report
Table 5Historic and forecast summer demand
YearSummer min
(GW)High summer peak
(GW)Daytime min
(GW)2014 18.5 38.5 27.62015 18.4 37.5 25.82016 18.1 35.7 23.5
In order to inform our forecast for 2016, we examine monthly trends over the last 10 years. Figure 11 shows the monthly weather and seasonally corrected energy transmitted through the transmission system during 2005-2015. By weather and seasonally correcting this data, we can easily compare different months with each other and spot longer-term trends.
Figure 11 shows that there has been a reduction in the total energy use that we have seen on the transmission system over the last 10 years. This is primarily due to an increase in embedded generation, which acts to reduce demand on the transmission system, greater energy efficiency for technology and buildings, and changing consumer behaviour.
Figure 11Weather and seasonally corrected monthly energy 2005–2015
20
Mon
thly
ene
rgy
(GW
h)
25
35
30
40
Apr
05
Oct
05
Apr
06
Oct
06
Apr
07
Oct
07
Apr
08
Oct
08
Apr
09
Oct
09
Apr
10
Oct
10
Apr
11
Oct
11
Apr
12
Oct
12
Apr
13
Oct
13
Apr
14
Oct
14
Apr
15
Oct
15
Actual energyWeather correctedSeasonally & weather correctedSmooth trend

34
Daily demand To help us forecast the levels of daily demand we can expect to see this summer, we have examined the data from 2015. Figure 12 shows the half-hourly demand profile for high summer 2015.
It shows the low to high range of demand across the day, as well as the average.
In 2015, the daily minimum occurred at 5:30am. The demand then picks up, before remaining fairly flat through the working day. The daily demand is most likely to peak at midday or late afternoon. When the peak occurs is dependent on weather conditions.
Figure 12Half-hourly demand profile based on actual half-hourly GB demand for high summer 2015
16
Dem
and
(GW
) 32
28
24
20
36
40
1:00
2:00
3:00
4:00
5:00
6:00
7:00
8:00
9:00
10:0
011
:00
12:0
013
:00
14:0
015
:00
14:0
017
:00
18:0
019
:00
20:0
021
:00
22:0
023
:00
24:0
0
Demand rangeAverage demand
How is the daily demand profile changing?
Solar PV has an increasing impact on demand profiles, which is more pronounced in the summer months. The summer demand peak typically occurs in the late afternoon when solar PV output is greater. This reduces the levels of demand we see on the transmission system.
We have also seen a change in the shape of the daily demand profile. Maximum solar PV output often coincides with the post-lunch reduction in demand. This acts to further reduce demand, creating a new daytime minimum.

35Summer Outlook Report
Summer minimum demands It is becoming increasingly important to understand daytime minimum demands to support the operation of the system during the summer.
Figure 13 shows the weekly daytime minimum demands for the previous two summers, with a forecast for 2016. Our analysis uses normalised weather and applies weather correction.
The lowest daytime demand forecast for the high summer period is 23.5 GW. This is expected to occur during the last weekend of July. This forecast is 2.5 GW lower than the minimum demand experienced in 2015.
Figure 13Weather corrected weekly daytime summer minimum demand
22
Dem
and
(GW
)
ESI week number
28
26
24
32
30
34
13 15 17 19 21 23 25 27 29 31 33 35 37 39 41 43
2016 forecast20152014

36
Figure 14 shows the weekly minimum demands for the previous two summers and a forecast for 2016. We have applied weather correction to our analysis. This analysis helps us to understand when we can expect the summer minimum to occur. Based on normal weather, averaged over
Embedded solar generationLive metering is not available to the System Operator for embedded generation. As a result, it does not have the visibility of transmission connected generation. Embedded solar PV capacity in particular has continued to increase, from 5.0 GW in April 2015 to 9.3 GW in February 2016.
the previous 30 years, the minimum demand is expected to occur on a late July Sunday between 5.00 and 6.00am.
The minimum weather corrected forecast for 2016 is 18.1 GW.
Figure 15 shows the actual growth in the installed capacity of solar PV between 2012 and 2015 and the forecast growth for 2016/17. It also shows the estimated actual solar PV generation based on the actual weather.
Figure 14Weather corrected weekly summer minimum demand
17
Dem
and
(GW
)
ESI week number
22
21
20
19
18
24
23
25
13 15 17 19 21 23 25 27 29 31 33 35 37 39 41 43
2016 forecast20152014
37Summer Outlook Report
Embedded PV generation is a major contributor to the trend of decreasing transmission system demand. As a result, PV generation estimates are becoming an ever important component of our demand forecasts. As previously mentioned, we are assuming a 200 MW linear increase in installed capacity per month for the next 12 months. This equates to 12.0 GW
by the beginning of British Summer Time (BST) 2017. This increase has been factored into our summer demand forecasts for 2016.
In addition to our seasonal forecast, we publish a daily forecast of embedded generation for the next seven days. You can access this forecast on our website.
Figure 15Total PV/solar capacity (historic and forecast) and estimated historic generation April 2012 – February 2016
0
Sol
ar P
V (M
W) 8,000
6,000
4,000
10,000
2,000
12,000
Apr
il 20
12Ju
ly 2
012
Oct
ober
201
2Ja
nuar
y 20
13A
pril
2013
July
201
3O
ctob
er 2
013
Janu
ary
2014
Apr
il 20
14Ju
ly 2
014
Oct
ober
201
4Ja
nuar
y 20
15A
pril
2015
July
201
5O
ctob
er 2
015
Janu
ary
2016
Apr
il 20
16Ju
ly 2
016
Oct
ober
201
6Ja
nuar
y 20
17
Forecast PV capacityEstimated output at 12:00 noonInstalled PV capacity
Forecasting solar PV
National Grid has embarked on a number of projects to address two key challenges of forecasting solar PV; installation visibility and generation variability. One of these projects is in partnership with Sheffield Solar. The aim is to estimate total GB PV output in real time, based on third party metered data from a sample of live sites. Once operational, the project will deliver an estimate of PV generation in real time. This will be used to manage flows on the electricity network, ensuring we can continue to balance supply and demand on a second-by-second basis. You can access live PV generation on the Sheffield Solar website.
38
Generation Generation capacity Figure 16 shows the expected generation capacity available this summer. The total capacity available is 67.43 GW. This is the maximum technical capacity of generation available; we have not applied a de-rating factor to account for breakdowns, outages or any other operational issues that may result in a plant having a decreased ability to generate at its normal level. The capacity includes only the generation that is connected to the transmission system.
The capacity accounts for recent changes in generation, including the closures of Ferrybridge and Eggborough coal plants. These closures have been partially offset by the commissioning of the new Carrington power station, the Moyle interconnector returning to full capability, and an increase in wind capacity.
Figure 16Generation capacity for summer 2016
0
GW
Capacity
10
30
20
50
40
60
70
4.0
27.7
0.82.72.0
11.0
9.11.19.0
InterconnectorsCCGTOCGTPumped StorageBiomassCoalWindHydroNuclear

39Summer Outlook Report
Wind generation There is an increasing amount of wind generation connected to both the transmission and distribution networks. It is important that we account for this generation in our operational view analysis for the summer.
Figure 17 shows the mean load factor of wind generation by month and half-hourly settlement period between 2011 and 2015. This data has been taken from wind farms directly connected to operational metering.
Load factors are the proportion of output that we can reasonably expect to see for a given capacity. By comparing these load factors across a number of years, we are able to spot longer-term trends in the seasonal variability of wind output.
Figure 17 shows that wind generation is typically higher during the winter months, shown by the orange and red colours. July typically experiences the lowest wind generation, shown by the dark blue. There is no clear correlation between wind output and period of day.
Figure 17Wind load factors by month and settlement period 2011–2015
Jan
Mon
th
Half-hourly settlement period
JulAug
MayJun
MarApr
Feb
NovOctSep
Dec
0 12 24 36 48
0.0
0.6
0.5
0.4
0.3
0.2
0.1
Wind load factor

40
To determine a realistic wind output that we can apply to our operational view analysis, we plot the historic output of wind for both summer daytime and for periods of minimum demand.
Figure 18 shows the historic wind farm load factor distribution during the daytime in high summer. The median wind load factor is 16 per cent. As a result, we use 16 per cent as a reasonable expectation of wind output for the demand peak of a summer day.
Figure 18Summer daytime wind load factors
0%
Pro
babi
lity
of e
xcee
ding
Wind load factor
40%
20%
80%
60%
100%
0.0
0.1
0.2
0.3
0.4
0.5
0.6
0.7
0.8
0.9
1.0

41Summer Outlook Report
InterconnectorsInterconnectors link the GB transmission system to the systems of France, the Netherlands and Ireland. The interconnection capacity between GB and other markets is 4,000 MW.
During the summer, the lowest average load factors typically occur overnight between mid-June and mid-August. However, high winds do sometimes occur during these periods of low overnight demand, so we need to account for this in our analysis.
France and the NetherlandsBritned is a 1,000 MW capacity interconnector to the Netherlands. This summer we expect it to be at full capability, with the exception of two days in May and two days in September when it will be out of service for maintenance.
Interconnexion France-Angleterre (IFA) is a 2,000 MW interconnector between France and the UK. It is expected to be at full capability for most of this summer. Due to maintenance outages, capability will be reduced to 1,000 MW for 12 days in April and 19 days in October.
Figure 19 plots the probability of the wind output exceeding a given value during at least one of these periods of low demand. It shows a median load factor of 46 per cent. We use this load factor to create a realistic picture of wind output during periods of low demand in our operational view analysis.
Figure 19Wind load factors at minimum demand
0%
Pro
babi
lity
of e
xcee
ding
Wind load factor
40%
20%
80%
60%
100%
0.0
0.1
0.2
0.3
0.4
0.5
0.6
0.7
0.8
0.9
1.0

42
IrelandThe Moyle interconnector to Northern Ireland is expected to be back at its full capability of 500 MW this summer, following completion of the cable replacement project. The East West Interconnector (EWIC) to the Republic of Ireland is also expected to be at its full capability of 500 MW throughout the summer.
PricesInterconnector flows are closely correlated with price spreads.
The price spread between GB and continental wholesale prices for summer 2016 is similar to previous years. With the forward price in GB higher than prices in both the French and Dutch markets, full imports into GB from Continental Europe are expected this summer.
On the interconnectors with Ireland, it is expected that GB will export during peak times (daytime) and import during off-peak times (overnight). Imports will be more likely when there is high wind generation on the Irish electricity system.
500 MW
500 MW
1,000 MW
2,000 MW
500 MW
500 MW
1,000 MW
2,000 MW
Figure 20Projected interconnector flows for peak and off-peak times summer 2016
Peak times Off-peak times

43Summer Outlook Report
Operational view
Key messagesn We are able to meet normalised demand in all weeks across British
Summer Time under three interconnector scenarios with low, medium and full imports
n Wind generation may need to be curtailed this summer during minimum demand periods to help us balance the system
n There is a possibility that we may have to issue emergency instructions to inflexible generators to reduce their output during some weeks in order to balance supply and demand.
Our operational view is based on data provided to us by generators. We use this data to model levels of operational surplus. It is also used to determine the likelihood of actions we may ask generators to take in periods of low demand to balance the system. We currently expect there to be sufficient generation and interconnector imports to meet demand this summer. Based on current data, we may need to instruct generators to alter their generation output in periods of low demand.
Key termsn Operational Code 2 (OC2) data: information provided to National Grid
by generators. It includes their current generation availability and known maintenance plans
n Operational surplus: the difference between demand (including the amount of reserve held) and the generation expected to be available, modelled on a week by week basis. It includes both planned outages and assumed breakdown rates for each power station type.

44
The operational viewOur operational view is based on current generation availability data, otherwise known as Operational Code 2 (OC2) data. This is submitted weekly by generators and includes their known maintenance outage plans. As in previous summers, we expect there to be a large number of maintenance outages this year.
The data includes power stations that may require up to 48 hours notice before they can begin to generate. We may need to issue instructions to these generators to ensure that they are available if required.
In order to account for unexpected generator breakdowns, restrictions or losses close to real time, we apply a breakdown rate to the OC2 data. We then model this against forecast normalised transmission system demand plus a reserve requirement and a range of interconnector flows. The operational view does not take into account any market response by generators to high demand or tighter conditions.
It is possible to access the latest OC2 data throughout the summer on the BM Reports website. This data is updated weekly. Unlike the operational view presented here, the availability data presented on BM Reports is largely unadjusted, except for wind generation which is included at an assumed load factor. The forecast peak demand and a level of reserve are then compared to this to calculate the operational surplus. Data on BM Reports does not include interconnector imports or exports.
Assumptions1. DemandThe demand used for the operational view is normalised transmission system demand (TSD). This includes the demand we expect to see from power stations generating electricity (the station load) and interconnector exports. We have assumed 1,000 MW of export to Ireland.
2. Reserve assumptionsThere is a requirement to carry operating reserve to manage the second-by- second regulation of system frequency and respond to sudden changes in demand and supply. We have assumed a reserve requirement of 0.9 GW for each week of our analysis. This is shown in figure 21 as an orange bar above the normalised demand.
3. Generation breakdown assumptionsThe operational data provided to us by generators includes their known maintenance outages. Closer to real time, there may be unexpected generator breakdowns or availability reductions. To account for this in our analysis, we assume a breakdown rate for each fuel type, shown in table 6. These rates are based on historic summer breakdown rates, averaged over the last three years.
For wind generation we apply a load factor to determine how much output we could reasonably expect. This is calculated from the historic wind farm load factor distribution for summer daytimes, shown in the previous section in figure 18. We use the median wind load factor of 16 per cent in our analysis.

45Summer Outlook Report
4. Interconnector assumptionsOur analysis is based on three interconnector scenarios. All of the scenarios assume full export to Ireland, which adds 1,000 MW to expected demand. Each scenario assumes a varying level of import from Continental Europe:
nLow imports of 500 MW, resulting in a net export of 500 MW
nMedium base case of 1,800 MW, resulting in a net import of 800 MW
nFull interconnector imports of 3,000 MW, resulting in a net import of 2,000 MW.
Table 6Assumed breakdown rates for summer 2016
Power station type Assumed breakdown rateNuclear 12%
Interconnectors 0%Hydro generation 10%Wind generation 84%Coal & Biomass 14%Pumped storage 2%
OCGT 5%CCGT 12%

46
Results Figure 21 compares the expected weekly generation and interconnector scenarios against the weekly normalised demand forecast for the summer period. It is based on the OC2 data provided to us by generators on 31 March.
In the summer months maintenance outages reduce the amount of generation available. The lowest levels of generation are typically seen during the high summer period, between June and August. Based on current operational data, the minimum available generation is expected to be 39.9 GW in the week commencing 11 July.
We are able to meet normalised demand in this week, and throughout the high summer period, even with low interconnector imports.
Based on current information, demand and our reserve requirement can be met until the end of British Summer Time (BST) with low, medium or full interconnector imports.
As shown in figure 21, both the medium base case and full interconnector import scenarios are the same from the week commencing 10 October. This is due to planned maintenance on the Interconnexion France-Angleterre interconnector, which will reduce its capability for 19 days from 3 October.
Our operational view is based on the best data currently available to us. Changes to the notified generation and forecast demand will change this outlook, potentially increasing or decreasing the level of operational surplus. There is always a possibility that events, such as a plant returning late from outage or changing weather, can impact upon the level of surplus.
Figure 21Operational view summer 2016
GW
20
25
35
30
45
40
50
28/0
3/16
04/0
4/16
11/0
4/16
18/0
4/16
25/0
4/16
02/0
5/16
09/0
5/16
16/0
5/16
23/0
5/16
30/0
5/16
06/0
6/15
13/0
6/15
20/0
6/15
04/0
7/16
11/0
7/16
18/0
7/16
25/0
7/16
01/0
8/16
08/0
8/16
15/0
8/16
27/0
6/16
22/0
8/16
29/0
8/16
05/0
9/16
12/0
9/16
19/0
9/16
26/0
9/16
03/1
0/16
10/1
0/16
17/1
0/16
24/1
0/16
Frequency response reserve requirementMax normal demand (including full Ireland export)Assumed generation including low importsAssumed generation with medium base IC flowsAssumed generation with max IC imports

47Summer Outlook Report
System operability in periods of low demand In the summer we see a significant reduction in demand on the transmission system. As a result, we need to make sure that there is sufficient flexible generation available to meet demand while maintaining frequency response. This ensures that the system can respond to the largest generation or demand loss.
It is also necessary to maintain positive and negative regulating reserve levels, to account for forecasting errors and reductions in generator availability close to real time.
We have modelled inflexible generation against current expected minimum demands and then added flexible wind generation. This helps us to understand the actions we may need to take this summer to respond to low demand. The forecast is updated weekly throughout the summer and can be found on our website.
Flexible and inflexible generation
Different types of generation have varying levels of flexibility, impacting upon how quickly they can respond to changes in demand. Generation such as nuclear, combined heat and power (CHP) stations and some hydro generators and wind farms, are considered to be less flexible. They may require long notice periods to step down or ramp up their output, or have obligations that influence when they can generate. Inflexible generation also includes generation that is not part of the Balancing Mechanism, which requires emergency instructions to change their generation position.
The remaining generators are more flexible. Interconnectors provide a variety of frequency response services and, in some instances, limited System Operator to System Operator trading. Most large wind farms are now participating in the Balancing Mechanism and are therefore considered flexible generation. Some also provide frequency response and reactive power.
As generators regularly update their outage plans, it is difficult to model the expected operational surplus for the end of British Summer Time. This is particularly the case six months ahead for October.
We know that generators have greater flexibility in planning summer outages.
As market prices change to reflect the level of operational surplus, generators may take a commercial decision to move their planned maintenance programme. We encourage the industry to regularly view the latest OC2 data. The data is published each Thursday on the BM Reports website.

48
Modelling inflexible generation We have modelled the amount of inflexible generation that we can reasonably expect to be running at the time of the weekly minimum demand. This helps us to determine when we may need to request output reductions from less flexible generators, or emergency instruct them.
Assumptions1. Load factors In order to determine how much inflexible generation is likely to be available during periods of low demand, we apply a load factor to interconnectors and each generation type. These load factors, shown in table 7, are based on historic availability data over previous minimum demand periods.
The load factor for inflexible wind is determined from figure 19, shown in the previous section. To account for wind output during periods of low demand in our analysis, we assume a wind load factor of 46 per cent.
Table 7Inflexible load factor assumptions at minimum demand
Power station type Load factorNuclear 0.91
Inflexible BM units (CHP) 0.90Inflexible hydro 0.10Inflexible wind 0.46
Irish Interconnectors 0.50BritNed 0.50
Interconnector France-Angleterre 0.50

49Summer Outlook Report
Results Figure 22 shows a weekly view of the cumulative minimum output expected this summer from less flexible generators. This is based on the availability submitted to us by generators, multiplied by the load factors described above. It includes the synchronised plant required to meet our frequency response and reserve requirements. This output is compared to the weekly minimum demand profile, together with pumped storage demand at an assumed load factor of 66 per cent.
Based on current data, there is a risk that we may need to ask inflexible generators to reduce their output during the weeks commencing 20 June, 25 July and 29 August. This assumes 1.6 GW of pumping. As we approach real time, this requirement may change depending upon the weather, wind conditions and the generation available on the day. We will continue to update this forecast during the summer and will inform and engage with inflexible generators where necessary.
Figure 22Weekly minimum demand and generation profiles
GW
0
24
1821
1215
963
27
28/0
3/16
04/0
4/16
11/0
4/16
18/0
4/16
25/0
4/16
02/0
5/16
09/0
5/16
16/0
5/16
23/0
5/16
30/0
5/16
06/0
6/15
13/0
6/15
20/0
6/15
04/0
7/16
11/0
7/16
18/0
7/16
25/0
7/16
01/0
8/16
08/0
8/16
15/0
8/16
27/0
6/16
22/0
8/16
29/0
8/16
05/0
9/16
12/0
9/16
19/0
9/16
26/0
9/16
03/1
0/16
10/1
0/16
17/1
0/16
24/1
0/16
NuclearInflex BMUs (eg CHP)Inflex hydroI/C imports
Plant total providing requlating reserveInflex wind
Minimum demandMinimum demand including pumping

50
Flexible wind generation As the amount of installed wind capacity continues to increase, it has become economic to carry a proportion of regulating reserve on large wind farms in times of high wind. The flexibility of wind farms allows us to issue curtailment instructions, requesting their output to be reduced for a short period. The number of instructions we issue to wind farms is likely to increase, as we continue to see decreasing demand at the summer minimum and fewer flexible generators running overnight.
In figure 23 flexible wind farm output has been added to the cumulative minimum
output, assuming the same wind load factor of 46 per cent. It shows that, if flexible wind does not contribute to meeting the frequency response and regulating reserve requirements, it will need to be curtailed this summer to make sure that supply does not exceed demand.
Wind farms providing ancillary or balancing services, including negative regulating reserve or frequency response, would be considered temporarily inflexible.
To help us to manage periods of low demand in the most efficient and economic manner, we encourage wind farms and generators that currently do not meet their obligation to provide frequency response to do so. The submission of cost reflective prices for the provision of frequency response also enables us to make the appropriate economic decisions.
Figure 23Weekly minimum demand and generation profiles including flexible wind output
GW
0
24
1821
1215
963
27
28/0
3/16
04/0
4/16
11/0
4/16
18/0
4/16
25/0
4/16
02/0
5/16
09/0
5/16
16/0
5/16
23/0
5/16
30/0
5/16
06/0
6/15
13/0
6/15
20/0
6/15
04/0
7/16
11/0
7/16
18/0
7/16
25/0
7/16
01/0
8/16
08/0
8/16
15/0
8/16
27/0
6/16
22/0
8/16
29/0
8/16
05/0
9/16
12/0
9/16
19/0
9/16
26/0
9/16
03/1
0/16
10/1
0/16
17/1
0/16
24/1
0/16
NuclearInflex BMUs (eg CHP)Inflex hydroI/C imports
Plant total providing requlating reserveInflex windFlexible wind
Minimum demandMinimum demand including pumping

51Summer Outlook Report
Operational toolbox
Key messagesn Greater flexibility is required in the summer to manage the system during
periods of low demand and increased supply and demand variabilityn National Grid has access to a range of tools and services to make sure
that we can continue to operate the system securely and effectively.
Operating the transmission system during periods of low demand is becoming increasingly challenging. This is in part a reflection of the growth of intermittent power capacity and non-synchronous generation, both at the transmission system level and embedded within the distribution networks. This section of the report focuses on a selection of these challenges and the tools available to manage them in our role as System Operator.
Key termsn System inertia: a measure of how resilient the system is to changes due to
disturbances. Disturbances may be caused by a sudden drop in generation or demand that causes a system imbalance
n Reactive power: describes the movement of energy across the network and is measured in MVAR (mega volts amps reactive). Assets forming part of and connecting to the transmission system naturally generate or absorb reactive power depending on their own and the systems’ characteristics at the time. These flows of reactive power have a direct impact on the voltage levels seen across the network, which must be closely monitored and managed. Where voltage levels are too high or too low, National Grid takes actions, such as using ancillary services, to ensure that voltage levels stay within defined limits
n Head room and foot room: the ability of generation plant to alter its output. Head room is the operation of plant below its maximum to allow output to increase if necessary. Foot room describes the ability of plant to decrease its output without going below minimum output levels.

52
Overview Greater flexibility is required during periods of low demand, especially in the summer, to accommodate increased within-day supply and demand variability. Historically these requirements have been met with minimum intervention from the System Operator. The changing generation mix and demand profiles create an increasing reliance on direct System Operator intervention to keep the system secure. This may take the form of actions with conventional and wind generators. An assessment of the nature, scale and impact of these actions is detailed in this section.
Flexibility Negative reserve National Grid currently manages different types of reserve in order to preserve and maintain system security given a range of credible situations. In particular for low demand periods (overnight and weekend afternoons) sufficient negative reserve is required to account for demand forecasting errors or demand losses in the period from day ahead to real time.
This requirement is likely to increase as negative reserve for solar PV is required to specifically manage the additional variability in demand between four hours ahead and real time. This downward flexibility is usually provided by synchronised generation operating above its declared minimum operating level.
As a result, during low demand periods we may:
nCurtail or de-synchronise generation to maintain sufficient system foot room. At times of low demand, or in periods where inflexible generation represents a significant proportion of supply, this is likely to coincide with negative System Sell Prices (SSP). We encourage wind farms and generators to submit cost reflective prices to the Balancing Mechanism to manage low demand periods efficiently and economically, and to reduce wider wind curtailment
n Increase demand through demand side response services. This includes the newly introduced demand turn-up service and other demand side management contracts, which you can read more about in our Power Responsive spotlight on page 54
nTrade on the interconnectors to reduce total system supply. This may occur when an indication exists ahead of time that insufficient negative reserve is available, which coincides with high interconnector imports. Trading would only be considered when it is economically beneficial to do so
nIssue a Negative Reserve Active Power Management (NRAPM) system notification to the industry. This notification is designed to encourage inflexible generators to reduce their output where possible to create downward flexibility on the system. A NRAPM would only be issued if the negative reserve requirement could not be met through contracts, trading, System Operator to System Operator actions on the interconnectors or Balancing Mechanism activity.

53Summer Outlook Report
Positive reserve The combined requirement for regulating reserve and short term operating reserve (STOR) still exists during the summer. This helps to manage the variation between expected and actual generation and demand, as well as reserve for wind generation.
National Grid enters into contracts with standby generation or demand reduction services to manage variations in demand and generation away from its instructed position. Regulating reserve will be held on synchronised generation units that are not being used for frequency response. Where there is a market shortfall in the provision of available system head room, National Grid may take specific actions to synchronise generation units or run them at part-loaded levels to create upward flexibility.
Response Frequency is a continuously changing variable that is determined and controlled by the second-by-second balance between system demand and total generation. We therefore make sure that sufficient generation and/or demand is held in automatic readiness to manage all credible circumstances that might result in frequency variations3.
There are two types of frequency response: dynamic and non-dynamic. Dynamic frequency response is a continuously provided service used to manage the normal second-by-second changes on the system.
Non-dynamic frequency response is usually a discrete service triggered at a defined frequency deviation.
System inertia is a measure of how resilient the system is to change. These changes may be caused by disturbances, such as a sudden drop in generation or demand, leading to an underlying imbalance (i.e. mismatch between demand and supply).
We would anticipate an increase in response requirements during periods of low demand and limited synchronous generation. The growth in solar PV capacity is likely to lead to an increase in the absolute level of response held and an increase in the proportion of response held by dynamic providers on weekend afternoons.
In the short term, the procurement of these requirements will be facilitated through:
nMandatory frequency response in the Balancing Mechanism; or
nContracting in advance in the form of: a. firm frequency response (FFR) which
is the firm provision of dynamic or non-dynamic response to changes in frequency
b. frequency control by demand management (FCDM) which provides frequency response through interruption of demand customers.
In the longer term, a number of projects exist to secure a greater proportion of response through demand side providers4, on wind farms or highly flexible assets through enhanced frequency response.
3 More information on frequency response requirements and services (including enhanced frequency response) can be found at http://www2.nationalgrid.com/UK/Services/Balancing-services/Frequency-response/
4 Further information on work with demand side providers for wider balancing services can be found at http://www.powerresponsive.com/

54
Power Responsive
With the rapid pace of changes in the supply side of the energy market, the role that the demand side can play is becoming increasingly important. Demand side response brings with it a range of new opportunities for industrial and commercial businesses. In June 2015 we launched the Power Responsive campaign to bring together key stakeholders to address the challenges of and drive growth in demand side response on behalf of the whole energy industry.
What is the role of Power Responsive?
The role of Power Responsive is to make sure that barriers to achieving growth in demand side response are being addressed. We are focussing on:
n Awareness and understanding: for businesses of the opportunities available in demand side response. Power Responsive takes a lead role in delivering engagement activity and material to convey this message, in collaboration with other key stakeholders
n Financial incentives: ensuring the opportunities to take part in demand side response are clear and accessible to businesses, offering the right incentives to take part. Power Responsive takes an influencing role here, by supporting the organisations that own routes to market in developing solutions that facilitate growth in demand side response participation.
Demand side opportunities
Our product map highlights the potential routes to market for stakeholders interested in taking part in demand side response.
Nat
ion
al G
rid
and
via D
emand Aggregators*
BALANCINGSERVICES
Frequency Response
FrequencyControl Demand
Management(FCDM)
FirmFrequencyResponse
(FFR)
EnhancedFrequencyResponse
FFRBridging
s*
National Grid and via Dem
and Aggregator
BALANCINGSERVICES
Reserve
Short TermOperating
Reserve(STOR)
DemandTurn Up
FastReserve
STORRunway
Demand Side Balancing Reserve (DSBR)
(on behalf o
f DECC}
Nat
iona
l Grid
and via Demand Aggregators*
CAPACITY
TransitionalArrangements
Capacity Mechanism
Suppliers*
PEAKAVOIDANCE
Triad avoidance
avoids high TNUoS periods
Red zone management avoids high
DSUoS costs
Suppliers*
Distribution Networks
OTHEROPPORTUNITIES
Trials
Portfolio Management/Renewables
Balancing

55Summer Outlook Report
Demand turn-up service
National Grid’s demand turn-up (DTU) service has been developed to support system operability in periods of low demand on the transmission system. The service is aimed at businesses that can shift demand-intensive processes, such as pumping or heating, to times when there is lower demand on the transmission system. Businesses earn a revenue for shifting when they undertake these processes.
The Power Responsive campaign has been used to publicise the opportunity for interested stakeholders to get involved in the DTU service design. Over 100 stakeholders participated in the DTU service design webinar.
Get involved
You can sign up to the campaign distribution list via the Power Responsive website to receive all of the latest updates and opportunities to participate. You can also join the discussion on demand side response opportunities for industrial and commercial businesses on the Power Responsive LinkedIn page.
System security Managing voltage The ability to desynchronise generators to secure sufficient negative reserve is limited. This is because a number of flexible generators are currently required to maintain sufficient frequency response, the voltage profile across the country within specified limits, and sufficient system inertia. Flows of reactive power on the system affect voltage levels. Unlike system frequency, which is constant across the network, the voltage profile varies based on prevailing real and reactive supply and demand by location.
System Operator actions to manage high voltage have increased as reactive power demand continues to fall. The growth of embedded generation and energy efficiency measures, coupled with the increased use of cables in the distribution and transmission networks, have all contributed to falling reactive power demand. As demand requirements fall, periods of low demand and lightly loaded cables increase the likelihood of high voltage occurrences.
National Grid has put in place a number of long-term actions to manage occurrences of high voltage. These include a significant capital investment programme in reactive compensation assets, engagement with the distribution network operators, and Grid Code amendments for accessing MVARs (units of reactive power) on solar and wind generation.

56
In the short term, a number of tools exist that enable the running of machines to access their MVAR capability where forward indications of plant running indicate it is prudent and cost effective to do so. These actions are:
n The increased adoption of spread-indexed contracts. These seek to reflect the generation economics of conventional plant and ensure a minimum guaranteed profitability to run during periods where the machine would otherwise be uneconomic
nTrading actions within day, whereby National Grid purchases MW of units to make sure they are running
nBid-Offer Acceptances in the Balancing Mechanism.
We anticipate an increase in the volume of contracts and/or trading actions. This is because weak market prices for the critical low demand periods lead to less flexible plant being ‘mothballed’ and flexible plant avoiding running overnight.
Black Start Black Start is the procedure to recover from a total or partial shutdown of the transmission system, caused by a system disturbance such as an extensive lack of supply. The procedure involves isolated power stations being started individually and gradually being reconnected to the transmission system. In order to maintain this Black Start capability, and ensure restoration timescales can be met, some warming of units is required.
We are currently exploring a number of alternative providers, upgrades at existing sites and new technologies for the economic provision of Black Start services.
Rate of change of frequency (RoCoF) As previously discussed, system inertia acts to slow down the rate of frequency change when there is an instantaneous demand or in-feed loss, in the timescales before frequency response takes effect. A risk exists that a substantial in-feed loss could lead to the loss of further embedded generation.
Recommendations of the Joint Distribution and Grid Code working group to change the protection settings on relays for generators above 5 MW are expected to be fully implemented by August this year. In the meantime, some actions are anticipated while the requirements for smaller generators are examined and the programme of changes undertaken.
Actions to curtail the largest loss, or to increase system inertia, are forecast for overnight and weekend afternoon periods. These actions would include:
nTrading on the interconnectors to reduce them from full import or export to curtail the largest loss
n Taking bids on machines to reduce the largest loss
n Contracts or trades for additional synchronous machines.
57Summer Outlook Report
System operation None of the operability issues in this section can be considered in isolation, as actions taken with an individual generator may resolve more than one issue. For example, synchronising a generator may provide support to a local voltage profile while contributing to the system inertia requirement.
Given the tension between synchronising plant and maintaining downward flexibility on the system, units that are able to provide reactive power capability and system inertia, while maintaining low minimum running levels, are preferred to avoid possible wind curtailment. Conversely, the System Operator may avoid taking actions on some generators for this reason. Conventional generation may be left running overnight at a time when wind farms may be curtailed to resolve energy imbalances. This is because the conventional generators are providing frequency response, reactive power support or an inertia contribution. Actions to operate the system are undertaken on an economic basis.

58
Acronym Word Section Description BM Balancing
MechanismElectricity The Balancing Mechanism is a regulated market
framework used to balance supply and demand in each half hour trading period of every day. If National Grid predicts that there will be a discrepancy between the amount of electricity produced and that which will be in needed during a certain time period, they may accept a ‘bid’ or ‘offer’ to either increase or decrease generation or consumption.
Baseload Various The permanent minimum load that a system experiences.
BBL BBL Gas A gas pipeline between Balgzand in the Netherlands and Bacton in the UK. You can find out more at www.bblcompany.com
bcm billion cubic metres
Gas Unit of volume used in the gas industry. 1 bcm = 1,000,000,000 cubic metres.
BritNed Electricity BritNed Development Limited is a joint venture of Dutch TenneT and British National Grid that operates the electricity link between Great Britain and the Netherlands. It is a bi-directional interconnector with a capacity of 1,000 MW. You can find out more at www.britned.com
CCGT Combined cycle gas turbine
Various A power station that uses the combustion of natural gas or liquid fuel to drive a gas turbine generator to produce electricity. The exhaust gas from this process is used to produce steam in a heat recovery boiler. This steam then drives a turbine generator to produce more electricity.
CWV Composite weather variable
Gas A single measure of daily weather. It is the combination of temperature and other weather variables, including wind speed. The purpose of CWV is to define a linear relationship between the weather and non-daily metered gas demand.
Compressor Gas Compressors are used to move gas around the transmission network through high pressure pipelines. There are currently 68 compressors at 24 sites across the country. These compressors move the gas from entry points to exit points on the gas network. They are predominately gas driven turbines that are in the process of being replaced with electric units.
DM Daily metered Gas A classification of customers where gas meters are read daily. These are typically large scale consumers.
Glossary
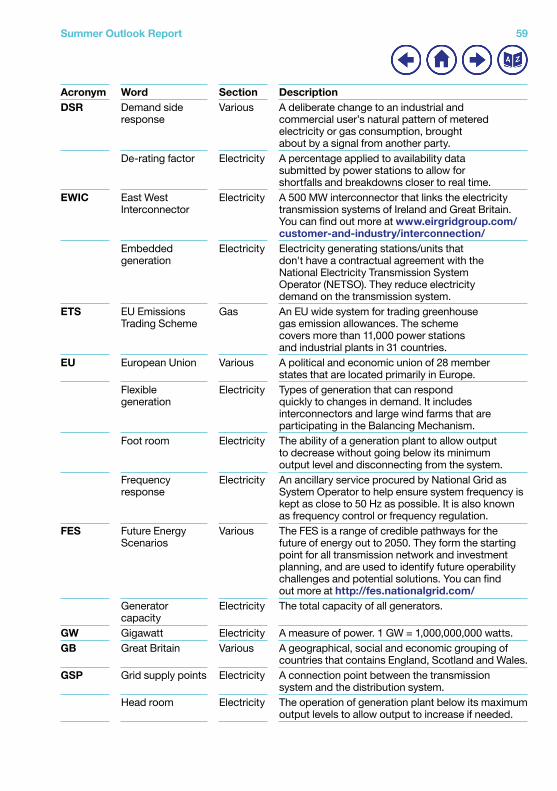
59Summer Outlook Report
Acronym Word Section Description DSR Demand side
responseVarious A deliberate change to an industrial and
commercial user’s natural pattern of metered electricity or gas consumption, brought about by a signal from another party.
De-rating factor Electricity A percentage applied to availability data submitted by power stations to allow for shortfalls and breakdowns closer to real time.
EWIC East West Interconnector
Electricity A 500 MW interconnector that links the electricity transmission systems of Ireland and Great Britain. You can find out more at www.eirgridgroup.com/customer-and-industry/interconnection/
Embedded generation
Electricity Electricity generating stations/units that don't have a contractual agreement with the National Electricity Transmission System Operator (NETSO). They reduce electricity demand on the transmission system.
ETS EU Emissions Trading Scheme
Gas An EU wide system for trading greenhouse gas emission allowances. The scheme covers more than 11,000 power stations and industrial plants in 31 countries.
EU European Union Various A political and economic union of 28 member states that are located primarily in Europe.
Flexible generation
Electricity Types of generation that can respond quickly to changes in demand. It includes interconnectors and large wind farms that are participating in the Balancing Mechanism.
Foot room Electricity The ability of a generation plant to allow output to decrease without going below its minimum output level and disconnecting from the system.
Frequency response
Electricity An ancillary service procured by National Grid as System Operator to help ensure system frequency is kept as close to 50 Hz as possible. It is also known as frequency control or frequency regulation.
FES Future Energy Scenarios
Various The FES is a range of credible pathways for the future of energy out to 2050. They form the starting point for all transmission network and investment planning, and are used to identify future operability challenges and potential solutions. You can find out more at http://fes.nationalgrid.com/
Generator capacity
Electricity The total capacity of all generators.
GW Gigawatt Electricity A measure of power. 1 GW = 1,000,000,000 watts.GB Great Britain Various A geographical, social and economic grouping of
countries that contains England, Scotland and Wales.GSP Grid supply points Electricity A connection point between the transmission
system and the distribution system. Head room Electricity The operation of generation plant below its maximum
output levels to allow output to increase if needed.

60
Acronym Word Section Description High summer Electricity The period between 1 June and 31 August, or weeks
23 to 35 of the year. This is when we typically see higher demand on the transmission system, caused predominantly by an increase in the use of cooling systems in the warmer months. It is also when most generators plan outages for maintenance.
Inflexible generation
Electricity Types of generation that are less able to respond quickly to changes in demand. This may be because they require long notice periods to step down or ramp up their output, or they have obligations that influence when they can generate. Examples include nuclear, combined heat and power stations, some hydro generators and most wind farms.
IUK Interconnector (UK) Limited
Gas A bi-directional gas pipeline between Bacton in the UK and Zeebrugge in Belgium. You can find out more at www.interconnector.com
Interconnector Gas Gas interconnectors connect gas transmission systems from other countries to the National Transmission System (NTS) in England, Scotland and Wales. There are currently three gas interconnectors that connect to the NTS. These are: IUK interconnector to BelgiumBBL to the NetherlandsMoffat to the Republic of Ireland, Northern Ireland and the Isle of Man
Interconnector Electricity Electricity interconnectors are transmission assets that connect the GB market to Continental Europe. They allow suppliers to trade electricity between these markets.
IFA Interconnexion France-Angleterre
Electricity The England-France Interconnector is a 2,000 MW link between the French and British transmission systems. Ownership is shared between National Grid and Réseau de Transport d'Electricité (RTE).
Linepack Gas The volume of gas within the National Transmission System (NTS) pipelines at any time.
Linepack swing Gas The difference between the amount of gas in the system at the start of the day and at the lowest point during the day.
LNG Liquefied natural gas
Gas Natural gas that has been converted to liquid form for ease of storage or transport. It is formed by chilling gas to -161˚C so that it occupies 600 times less space than in its gaseous form. You can find out more at www2.nationalgrid.com/uk/Services/Grain-lng/what-is-lng/
Load Various The energy demand experienced on a system.Load factor Electricity The proportion of output that we can reasonably
expect to see for a given capacity. MVAR Megavar Electricity Megavar or mega volts amps reactive
is a measure of reactive power.

61Summer Outlook Report
Acronym Word Section Description MW Megawatt Electricity A measure of power. 1 MW = 1,000,000 watts.mcm Million cubic
metersGas Unit of volume used in the gas industry.
1 mcm = 1,000,000 cubic metres.Moyle Electricity A 500 MW bi-directional interconnector between
Northern Ireland and Scotland. You can find out more at www.mutual-energy.com
NBP National balancing point (NBP) gas price
Gas Britain's wholesale NBP gas price is derived from the buying and selling of natural gas in Britain after it has arrived from offshore production facilities. The wholesale market in Britain has one price for gas, irrespective of where it has come from. It is usually quoted in pence per therm. You can find out more at https://www.ofgem.gov.uk/gas/wholesale-market/gb-gas-wholesale-market
NETS National Electricity Transmission System
Electricity High voltage electricity is transmitted on the transmission system from where it is produced to where it is needed throughout the country. The system is made up of high voltage electricity wires that extend across Britain and nearby offshore waters. It is owned and maintained by regional transmission companies, while the system as a whole is operated by a single System Operator (SO).
NTS National Transmission System
Gas A high pressure gas transportation system consisting of compressor stations, pipelines, multijunction sites and offtakes. Pipelines transport gas from terminals to offtakes and are designed to operate up to pressures of 94 barg.
NRAPM Negative reserve active power management system notification
Electricity A notification issued to the industry to encourage inflexible generators to reduce their output where possible. This creates downward flexiblity on the system.
NDM Non-daily metered
Gas A classification of customers where gas meters are read monthly or at longer intervals. These are typically residential, commercial or smaller industrial consumers.
Normalised demand
Electricity Demand assessed for each week of the year based on a 30 year average of each relevant weather variable. This is then applied to linear regression models to calculate what the demand would have been with standardised weather.
OC2 Operational Code 2 data
Electricity Information provided to National Grid by generators. It includes their current generation availability and known maintenance outage plans. You can access the latest OC2 data throughout the year on the BM Reports website.
OCGT Open cycle gas turbine
Various Gas turbines in which air is first compressed in the compressor element before fuel is injected and burned in the combustor.

62
Acronym Word Section Description Operational surplus
Electricity The difference between demand (including the amount of reserve held) and the generation expected to be available, modelled for each week of the year. It includes both planned outages and assumed breakdown rates for each power station type.
Peak Various The maximum requirement of a system at a given time, or the amount of energy required to supply customers at times when need is greatest. It can refer either to a given moment (e.g. a specific time of day) or to an average over a given period of time (e.g. a specific day or hour of the day).
Reactive power Electricity The movement of energy across the network. It is measured in megavar (MVAR). Assets forming part of and connecting to the transmission system naturally generate or absorb reactive power, depending on their own and the system’s characteristics at the time. These flows of reactive power have a direct impact on the voltage levels seen across the network.
Residual balancer Gas Users of the gas system are required to balance supply into, and demand from, the network. If this balance is not expected to be achieved on any given day, the System Operator (National Grid), as residual balancer, will enter the market and undertake trades (buys or sells) to seek to resolve any imbalance.
Seasonal normal demand
Gas The level of gas demand that would be expected on each day of the year. It is calculated using historically observed values that have been weighted to account for climate change.
STOR Short term operating reserve
Electricity Short term operating reserve (STOR) is a service for the provision of additional active power from generation and/or demand reduction.
Station load Electricity The onsite power station electricity requirement, for example for systems or start up.
Synchronised Electricity The condition where a generator or other source connected to the transmission system has an identical frequency and phase relationship to the system.
System inertia Electricity A measure of how resilient the system is to changes due to disturbances. Disturbances may be caused by a sudden drop in generation or demand, which results in a system imbalance.
SO System Operator Various An entity entrusted with transporting energy in the form of natural gas or electricity on a regional or national level, using fixed infrastructure. The SO may not necessarily own the assets concerned. For example, National Grid operates the electricity transmission system in Scotland, which is owned by Scottish Hydro Electricity Transmission and Scottish Power.

63Summer Outlook Report
Acronym Word Section Description TSD Transmission
system demandElectricity Demand that National Grid as System Operator
sees at grid supply points (GSPs), which are the connections to the distribution networks. It includes demand from the power stations generating electricity (the station load) at 500 MW.
Underlying demand
Electricity A measure of demand that removes the effect of weather and the day of the week.
UKCS UK Continental Shelf
Gas The UK Continental Shelf (UKCS) comprises those areas of the sea bed and subsoil beyond the territorial sea over which the UK exercises sovereign rights of exploration and exploitation of natural resources.
UK United Kingdom of Great Britain and Northern Ireland
Various A geographical, social and economic grouping of countries that contains England, Scotland, Wales and Northern Ireland.
Weather corrected demand
Electricity The demand expected or outturned with the impact of the weather removed. A 30 year average of each relevant weather variable is constructed for each week of the year. This is then applied to linear regression models to calculate what the demand would have been with this standardised weather.
Weather corrected demand
Gas The demand expected with the impact of weather removed. Actual demand is converted to demand at seasonally normal weather conditions, by multiplying the difference between actual CWV and expected CWV by a value that represents demand sensitivity to weather.

64
Summer Outlook Report 65
Legal NoticePursuant to their respective licences, National Grid Electricity Transmission plc operates the electricity transmission and National Grid Gas plc operates the gas transmission network.
For the purpose of this outlook document “National Grid” is used to refer to both licensed entities, whereas in practice their activities and sharing of information are governed by the respective licences.
National Grid has prepared this outlook document in good faith, and has endeavoured to prepare this outlook document in a manner which is, as far as reasonably possible, objective, using information collected and compiled by National Grid from users of the gas transportation and electricity transmission systems together with its own forecasts of the future development of those systems. While National Grid has not sought to mislead any person as to the contents of this outlook document and whilst such content represents National Grid’s best views as at the time of publication, readers of this document should not place any reliance on the contents of this outlook document. The contents of this outlook document must be considered as illustrative only and no warranty can be or is made as to the accuracy and completeness of such contents, nor shall anything within this outlook document constitute an offer capable of acceptance or form the basis of any contract. Other than in the event of fraudulent misstatement or fraudulent misrepresentation, National Grid does not accept any responsibility for any use which is made of the information contained within this outlook document.
CopyrightAny and all copyright and all other intellectual property rights contained in this outlook document belong to National Grid. To the extent that you re-use the outlook document, in its original form and without making any modifications or adaptations thereto, you must reproduce, clearly and prominently, the following copyright statement in your own documentation: © National Grid plc, all rights reserved.

National Grid plcNational Grid House, Warwick Technology Park, Gallows Hill, Warwick. CV34 6DA United KingdomRegistered in England and Wales No. 4031152
www.nationalgrid.com


![Whether Consent to Search Was Given Voluntarily: A ......December 2006] WHETHER CONSENT WAS GIVEN VOLUNTARILY 2195 Where a suspect, like Perea, faces tremendous pressure to comply](https://img.pdfslide.us/doc/110x75/5f44335d45bfa6285d4e9cf1/whether-consent-to-search-was-given-voluntarily-a-december-2006-whether.jpg)