Embed Size (px)
Citation preview
Summer Economic Statement | June 2018 Page |i
Summer Economic Statement
June 2018
Summer Economic Statement | June 2018 Page | i
Foreword
The public finances have been stabilised, unemployment continues to fall and we are the fastest growing economy in the EU. We have made excellent progress through much hard work. Following on from these efforts we need little reminding that the tenth anniversary of the most severe global financial crisis since the Great Depression is now approaching. The crisis inflicted major economic and social upheaval around the world and its effects linger today. Ireland is no different. The key message that I want to impart is that it is incumbent upon the Government to actively pursue policies that ensure an improvement in living standards for all and that Ireland is never again at the epicentre of such a crisis. We must be alert to all possibilities and vulnerabilities and formulate policy with this in mind. Only by doing this can we, firstly, maintain the progress we have made in recent years and, secondly, deliver steady and sustainable improvements in the welfare of Irish society. Our economy is in good shape at the moment and this is paying dividends in the labour market. The level of employment is close to its highest level ever and we are approaching what could reasonably be called ‘full employment’. This is a welcome development but it does create new challenges. Capacity constraints are increasingly becoming a feature of some sectors and this, in turn, could lead to overheating of the economy. Government policy should never add fuel to the fire. The Government is determined to ensure that our budgetary strategy is based on steady increases in public expenditure underpinned by stable and predictable tax revenue. A balanced budget is our minimum objective. Incremental and sustainable improvements in public services is always to be preferred over the ‘feast-or-famine’ alternative. Expectations have increased given the remarkable performance of our economy. However, I want to make it clear that not all demands can be met. In the first instance, expenditure continues to exceed revenue and we are still borrowing to meet the shortfall; if more resources are allocated, the deficit would be even larger. It is also not economically prudent to meet all demands. Excessive growth of expenditure in an economy at full employment entails risks. The provision of public services can be enhanced – within existing allocations – by reforming the way public services are delivered. This is why the Government has prioritised public sector reforms: by improving management and raising efficiency, through technological progress and other means, we can better align inputs with outputs and ensure better value for taxpayers’ money. Each year, central Government spends over €60 billion; I am convinced that there remains scope to improve the efficiency with which this is allocated. The spending review, which will be published in July, will be critical in this regard. We must maintain a broad tax base that generates a sustainable revenue stream necessary to fund public services. We cannot build permanent expenditure commitments on revenues that may not be sustainable. We do not need history to tell us this, it is common sense. This is why the Government is setting aside some of the historically high levels of Corporation Tax for the purpose of creating the Rainy Day Fund.
Summer Economic Statement | June 2018 Page | ii
Outside of Ireland there are probably greater levels of uncertainty than there has been in a long time. While our economy is performing well at present, continued economic expansion cannot be taken for granted. The bulk of our trade is undertaken with three regions – the euro area, UK and US – and all three are facing challenges. The pace of growth in the euro area has slowed in the first quarter. While it is not yet clear whether this was temporary or the beginning of a more prolonged slowdown, recent political developments in the region show that there are real vulnerabilities. In the UK, its post-exit trading relationship with the EU remains clouded in uncertainty, which is weighing on economic performance. The central scenario for fiscal and economic planning purposes in Ireland is that a transition arrangement will be agreed that will cover the period from end-March next year until end-2020; there may be additional clarity following the European Council meeting at end-June. Finally, the trading relationship between the EU and US has been strained of late, and any escalation could be problematic for Ireland. With all of these beyond our control, it highlights the importance of taking the measures that we can in order to enhance the resilience of our economy. From a budgetary perspective, there are several dimensions to this. Firstly, we must continue to be prudent in relation to management of the public finances. The fiscal rules are currently unhelpful in this regard. A full and literal application of the fiscal rules would involve the adoption of pro-cyclical policies not remotely appropriate to our position in the economic cycle. That is why fiscal space is increasingly an inappropriate concept. Rules have a role to play in the formulation of policy but when they result in increased borrowing in an economy at full employment there is something wrong. The most appropriate budget is one that has regard to the rules but tempers that with the judgement necessary to avoid such ill-advised outcomes. Accordingly, Government will frame budgetary policy in order to continue to reduce, rather than increase, borrowing and thereby support steady and sustainable improvements in employment and living standards. Second, we must balance the budget over the cycle and use windfall receipts to reduce public debt. The Government is also establishing a Rainy Day Fund, the objective of which is to build up our fiscal reserves so that we have room for manoeuvre in the event of a major shock to the economy. Thirdly, the Government will prioritise spending that mitigates risk, enhances the resilience of the economy and raises our growth capacity. In this context, the Government has set out its vision for Ireland over the medium term in Project Ireland 2040. This includes the National Development Plan (NDP) and is the blueprint for Ireland’s sustainable development – economically, socially and environmentally – for the future. Finally, in relation to the forthcoming budget, a headline deficit of 0.1 per cent was projected in the Stability Programme (published in April of this year). The Government will not adopt taxation and spending measures that result in a larger deficit than this.
Summer Economic Statement | June 2018 Page | iii
Pre-committed expenditure for next year amounts to €2.6 billion – that is to provide for:
An increase of €1.5 billion in capital expenditure as part of the NDP;
€0.3 billion carryover costs associated with measures introduced this year
€0.4 billion in public sector pay increases already agreed
€0.4 billion for demographic costs in order to maintain existing levels of service. The Stability Programme targeted a deficit of 0.1 per cent of GDP next year. This would accommodate a budgetary package of €3.4 billion, of which €2.6 billion has been pre-committed to expenditure measures leaving €0.8 billion for further allocation. Any unfunded taxation or expenditure measures that go beyond this will necessarily involve even more borrowing and will result in a subsequent increase in the deficit position. Targeting minimum compliance with the expenditure benchmark allows an additional €0.9 billion but this would increase the deficit by 0.3 per cent of GDP and be inappropriate at this stage of the cycle. Careful management of the public finances is needed in order to avoid the mistakes of the past and to chart our way forward through the uncertain economic times ahead. While there are risks ahead there are also opportunities; our goal is to position our economy to minimise the risk and to maximise the opportunity. The objective is to ensure the progressive and steady improvement of living standards in our Republic.
Paschal Donohoe T.D. Minister for Finance and Public Expenditure and Reform
Summer Economic Statement | June 2018 Page | iv
Contents
Page
Foreword Tables, Figures, Boxes and Annexes
i v
1. Economic Strategy 1 1.1. Background 1 1.2. Policy Strategy 2
2. Economic Outlook 6 2.1. Economic Background 6 2.2. Economic Outlook: 2018 8 2.3. Economic Outlook: 2019 and the medium term 9 3. Budgetary Strategy 13 3.1. Background 13 3.2. Fiscal developments to date in 2018 13 3.3. Fiscal Strategy 17 3.4. Debt developments 20 3.5. Rainy day fund update 21 4. Public Expenditure Strategy 22 4.1. Overview 22 4.2. Context for Public Expenditure 23 4.3. Expenditure Strategy 25 4.4. National Development Plan 28 4.5 Sustainable Improvements in Public Services and Social Supports 30 4.6 Summary 34
Summer Economic Statement | June 2018 Page | v
1 In line with the Government’s Open Data Initiative the data underpinning charts in this document are available on the Department of Finance website.
Tables, Figures, Boxes and Annexes
Tables Table 1 Macroeconomic forecasts (as set out in the Stability Programme Update 2018) 9 Table 2 Budgetary projections 2017-2021 16 Table 3 Expenditure benchmark approach to fiscal space 18 Table 4 Minimum compliance with the expenditure benchmark 19 Table 5 Public Capital Expenditure Split for 2018-2027 28
Figures1 Figure 1 Recovery in the domestic economy 6 Figure 2 Recovery in the external sector 7 Figure 3 Recovery in the labour market 7 Figure 4 Fiscal Developments 17 Figure 5 Minimum compliance with expenditure benchmark 19 Figure 6 General government debt comparisons, selected OECD countries 2017 20 Figure 7 Expenditure growth 1998 - 2018 by interval 24 Figure 8 Expenditure v revenue and economic growth 1998-2017 24 Figure 9 Long term trend in public service employment (FTE) and exchequer pay bill 31 Boxes Box 1 Other small open economies 5 Box 2 Ireland’s productivity potential 11 Annexes Annex 1 Assessment of expenditure benchmark 36 Annex 2 Brexit: Clock is ticking 37
Summer Economic Statement | June 2018 Page | vi
Executive Summary
A suite of economic indicators confirm the significant economic progress made in recent years. In the labour market, for instance, the unemployment rate has fallen below 6 per cent and the level of employment is close to its highest level ever. The rapid and substantial change in the economic landscape over the past decade – from the initial collapse in economic activity and the subsequent faster-than-assumed recovery – creates new challenges. At a macroeconomic-level, the challenges facing the Government are three-fold. Firstly, there is the need to manage budgetary policy to improve living standards in a way that does not contribute to overheating of the economy. With full-employment now in sight, the Government is conscious that budgetary policy is not pro-cyclical – that taxation and public expenditure policy does not add fuel to the fire when the capacity of the economy is constrained. A literal application of the fiscal rules would damage our economy; that is why policy will no longer be formulated on the basis of ‘fiscal space’. Instead, budgetary policy will be conducted in a manner that provides for steady and sustainable increases in public expenditure over time. Secondly, it is also necessary to improve public infrastructure to ensure that all can benefit from the fruits of economic growth. The Government has scaled-up capital investment – as set out in Project Ireland 2040 – with a view to addressing emerging capacity constraints. A considerable increase in resources has been provided to address supply constraints in the housing sector. Finally, while the economic situation is relatively healthy at present, it is clear that the external environment is becoming increasingly challenging. The UK’s imminent exit from the European Union, changes in the international corporate tax landscape, and the possibility of disruptions to the global trading system are just some of the issues that are confronting the Irish economy at present. A crucial policy response is to build up our fiscal capacity in order to respond to these challenges. This is why the Government is prioritising reducing public debt, establishing a Rainy Day Fund, and avoiding pro-cyclical budgetary policies. In terms of budgetary allocations, measures that enhance the resilience of the economy and boost our growth potential – such as those which raise productivity – will be prioritised. The scarring effects of the crisis will live long in the memory; avoiding repetition must be the overarching priority. Budgetary policy can, and will, play a role in enhancing the resilience of the economy; the Government’s approach will be ‘steady-as-she-goes’ so as not to jeopardise future living standards.
Summer Economic Statement | June 2018 Page | 1
Chapter 1 Economic Strategy
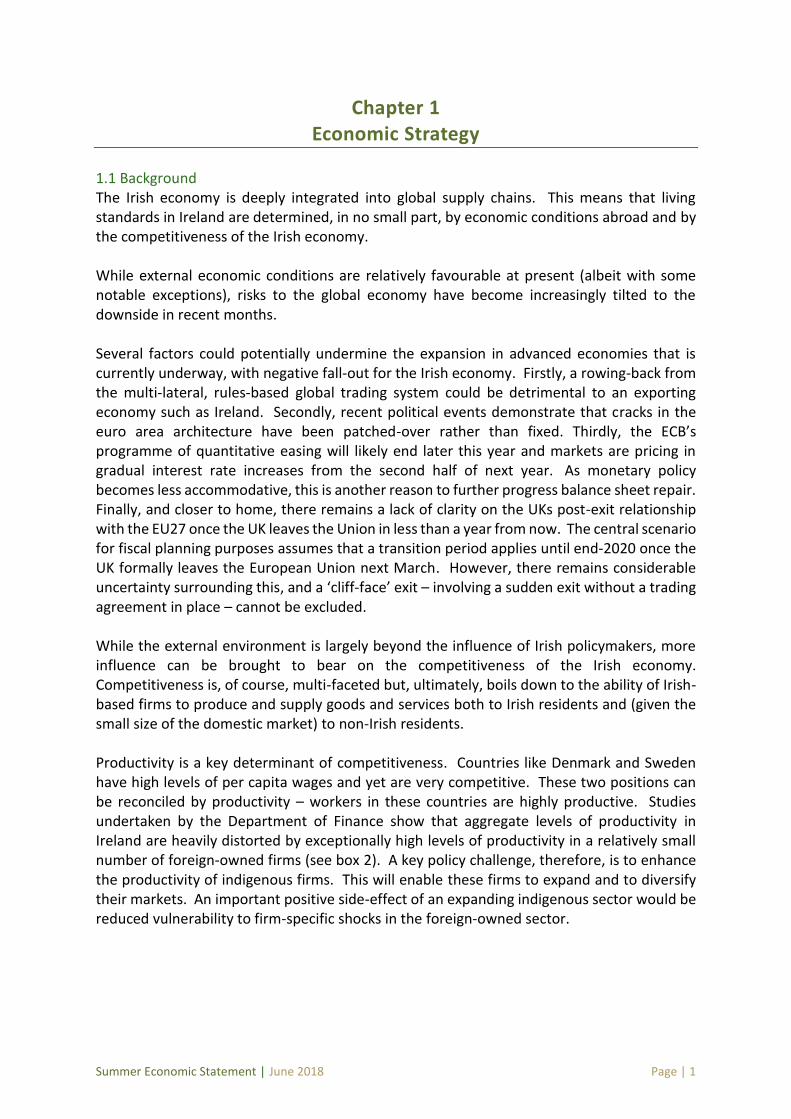
1.1 Background The Irish economy is deeply integrated into global supply chains. This means that living standards in Ireland are determined, in no small part, by economic conditions abroad and by the competitiveness of the Irish economy. While external economic conditions are relatively favourable at present (albeit with some notable exceptions), risks to the global economy have become increasingly tilted to the downside in recent months. Several factors could potentially undermine the expansion in advanced economies that is currently underway, with negative fall-out for the Irish economy. Firstly, a rowing-back from the multi-lateral, rules-based global trading system could be detrimental to an exporting economy such as Ireland. Secondly, recent political events demonstrate that cracks in the euro area architecture have been patched-over rather than fixed. Thirdly, the ECB’s programme of quantitative easing will likely end later this year and markets are pricing in gradual interest rate increases from the second half of next year. As monetary policy becomes less accommodative, this is another reason to further progress balance sheet repair. Finally, and closer to home, there remains a lack of clarity on the UKs post-exit relationship with the EU27 once the UK leaves the Union in less than a year from now. The central scenario for fiscal planning purposes assumes that a transition period applies until end-2020 once the UK formally leaves the European Union next March. However, there remains considerable uncertainty surrounding this, and a ‘cliff-face’ exit – involving a sudden exit without a trading agreement in place – cannot be excluded. While the external environment is largely beyond the influence of Irish policymakers, more influence can be brought to bear on the competitiveness of the Irish economy. Competitiveness is, of course, multi-faceted but, ultimately, boils down to the ability of Irish-based firms to produce and supply goods and services both to Irish residents and (given the small size of the domestic market) to non-Irish residents. Productivity is a key determinant of competitiveness. Countries like Denmark and Sweden have high levels of per capita wages and yet are very competitive. These two positions can be reconciled by productivity – workers in these countries are highly productive. Studies undertaken by the Department of Finance show that aggregate levels of productivity in Ireland are heavily distorted by exceptionally high levels of productivity in a relatively small number of foreign-owned firms (see box 2). A key policy challenge, therefore, is to enhance the productivity of indigenous firms. This will enable these firms to expand and to diversify their markets. An important positive side-effect of an expanding indigenous sector would be reduced vulnerability to firm-specific shocks in the foreign-owned sector.
Summer Economic Statement | June 2018 Page | 2
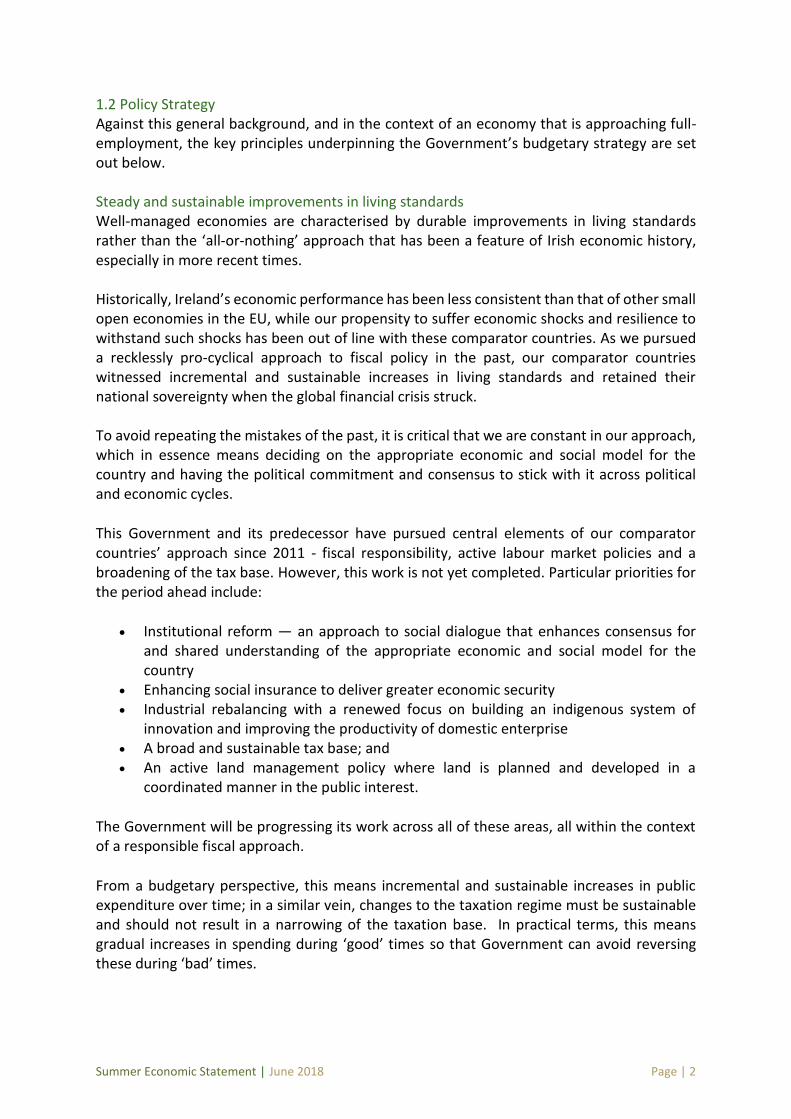
1.2 Policy Strategy Against this general background, and in the context of an economy that is approaching full-employment, the key principles underpinning the Government’s budgetary strategy are set out below. Steady and sustainable improvements in living standards Well-managed economies are characterised by durable improvements in living standards rather than the ‘all-or-nothing’ approach that has been a feature of Irish economic history, especially in more recent times. Historically, Ireland’s economic performance has been less consistent than that of other small open economies in the EU, while our propensity to suffer economic shocks and resilience to withstand such shocks has been out of line with these comparator countries. As we pursued a recklessly pro-cyclical approach to fiscal policy in the past, our comparator countries witnessed incremental and sustainable increases in living standards and retained their national sovereignty when the global financial crisis struck. To avoid repeating the mistakes of the past, it is critical that we are constant in our approach, which in essence means deciding on the appropriate economic and social model for the country and having the political commitment and consensus to stick with it across political and economic cycles.
This Government and its predecessor have pursued central elements of our comparator countries’ approach since 2011 - fiscal responsibility, active labour market policies and a broadening of the tax base. However, this work is not yet completed. Particular priorities for the period ahead include:
Institutional reform — an approach to social dialogue that enhances consensus for and shared understanding of the appropriate economic and social model for the country
Enhancing social insurance to deliver greater economic security Industrial rebalancing with a renewed focus on building an indigenous system of
innovation and improving the productivity of domestic enterprise A broad and sustainable tax base; and An active land management policy where land is planned and developed in a
coordinated manner in the public interest.
The Government will be progressing its work across all of these areas, all within the context of a responsible fiscal approach.
From a budgetary perspective, this means incremental and sustainable increases in public expenditure over time; in a similar vein, changes to the taxation regime must be sustainable and should not result in a narrowing of the taxation base. In practical terms, this means gradual increases in spending during ‘good’ times so that Government can avoid reversing these during ‘bad’ times.
Summer Economic Statement | June 2018 Page | 3
Rebuilding fiscal capacity Irish public debt remains high, with the debt-to-GNI* ratio at an estimated 100 per cent last year. Such elevated debt levels weigh on the capacity of the public finances to respond to any economic downturn in the future. Moreover, public expenditure remains in excess of revenue, with the difference being made up through continued borrowing, i.e. outstanding public debt continues to rise. In order to reduce this vulnerability, it is important to ‘fix the roof while the sun shines’. This means building up the capacity so that budgetary policy can respond during the inevitable downturn. The current highly unpredictable external environment illustrates the importance of ‘fixing the roof’. Indeed, the need to rebuild fiscal buffers and the current cyclical position of the economy suggest the appropriate strategy is to run budgetary surpluses for a number of years in order to alleviate pressure on the domestic economy and to prepare for the future challenges. Need for prioritisation and realism It is neither realistic nor prudent to address all expectations in the current climate. In the first instance, the resources are simply not available. But even if they were, it would be imprudent to implement a substantial budgetary package at this stage in the economic cycle. The impact would be to add fuel to the fire – to amplify the economic cycle in the short-term at the cost of greater pain down the road. So there is a need to prioritise. Providing for demographic changes is crucial – that is to maintain existing levels of service. In addition, it is important that capacity constraints are addressed. In weighing up the various options, it is important that appropriate cost-benefit analysis is undertaken ex ante and that value-for-money considerations are to the fore in all decisions. Need to avoid pro-cyclicality As already noted, the economy is approaching full employment, with capacity constraints beginning to emerge. In these circumstances, it is essential that budgetary policy is not pro-cyclical – that budgetary policy does not add to demand when the capacity of the economy is constrained. Moreover, complacency must be avoided. Ireland is a highly open and globalised economy, meaning that adverse international events can suddenly lead to a slowdown in our economic growth. The development of the Rainy Day Fund will help play a key role in smoothing the economic cycle, helping to maintain living standards and support the most vulnerable in our society. Additionally, the Rainy Day Fund is a way of mitigating the risk associated with the reliance on corporation tax receipts. As the Department of Finance has set out2, receipts are highly concentrated with, for instance, the top-10 taxpayers accounting for 40 per cent of receipts. This creates a vulnerability for the Irish economy; by setting aside money in the Rainy Day
2 https://www.finance.gov.ie/wp-content/uploads/2018/01/annual-taxation-report.pdf
Summer Economic Statement | June 2018 Page | 4
Fund the risk of permanently increasing expenditure on the basis of transient receipts is reduced.
Budgetary policy will focus on ensuring fiscal sustainability The full and literal application of the fiscal rules in recent years has led to a focus on what is available in terms of the fiscal space. This was appropriate in a period when the amounts were somewhat constrained and there was a need to bring about service improvements following many years of consolidation.
However, there are a number of reasons why utilisation of the fiscal space is not appropriate in the current circumstances.
Difficulty in measuring the cycle and the general pro-cyclicality of potential GDPestimates gives rise to inappropriate increases in spending being permitted under thefiscal rules. In other words, a full application of the fiscal rules would amplify theeconomic cycle.
Ireland’s elevated debt burden – with debt-to-GNI* at 100 per cent last year – needsto be addressed. The focus must be on balancing the books and reducing nominaldebt.
Risks to the global economy are increasingly tilted to the downside. In this context, the priority must be to rebuild fiscal buffers so that the Irish economy can best absorb economic shocks if and when they occur.
Instead, the Government will frame budgetary policy on the basis of what is right for the economy in order to ensure continued, steady improvements in Irish employment and living standards. The policy approach for 2019 will be to improve the deficit position with a fiscal balance appropriate to the cycle and the emerging risks we face. Such an approach will also support us in taking advantage of the opportunities which can also be expected to arise in the coming years.
Summer Economic Statement | June 2018 Page | 5
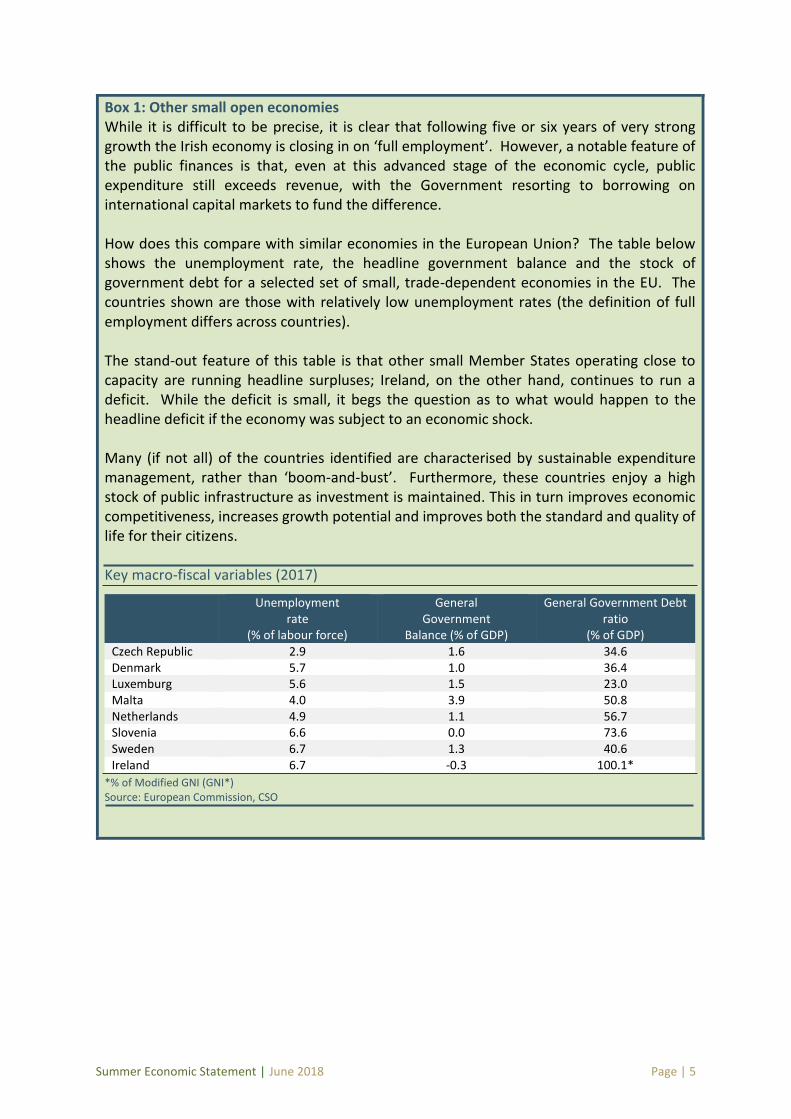
Box 1: Other small open economies While it is difficult to be precise, it is clear that following five or six years of very strong growth the Irish economy is closing in on ‘full employment’. However, a notable feature of the public finances is that, even at this advanced stage of the economic cycle, public expenditure still exceeds revenue, with the Government resorting to borrowing on international capital markets to fund the difference. How does this compare with similar economies in the European Union? The table below shows the unemployment rate, the headline government balance and the stock of government debt for a selected set of small, trade-dependent economies in the EU. The countries shown are those with relatively low unemployment rates (the definition of full employment differs across countries). The stand-out feature of this table is that other small Member States operating close to capacity are running headline surpluses; Ireland, on the other hand, continues to run a deficit. While the deficit is small, it begs the question as to what would happen to the headline deficit if the economy was subject to an economic shock. Many (if not all) of the countries identified are characterised by sustainable expenditure management, rather than ‘boom-and-bust’. Furthermore, these countries enjoy a high stock of public infrastructure as investment is maintained. This in turn improves economic competitiveness, increases growth potential and improves both the standard and quality of life for their citizens. Key macro-fiscal variables (2017)
Unemployment
rate (% of labour force)
General Government
Balance (% of GDP)
General Government Debt ratio
(% of GDP) Czech Republic 2.9 1.6 34.6 Denmark 5.7 1.0 36.4 Luxemburg 5.6 1.5 23.0 Malta 4.0 3.9 50.8 Netherlands 4.9 1.1 56.7 Slovenia 6.6 0.0 73.6 Sweden 6.7 1.3 40.6 Ireland 6.7 -0.3 100.1*
*% of Modified GNI (GNI*) Source: European Commission, CSO
Summer Economic Statement | June 2018 Page | 6
Chapter 2 Economic Outlook
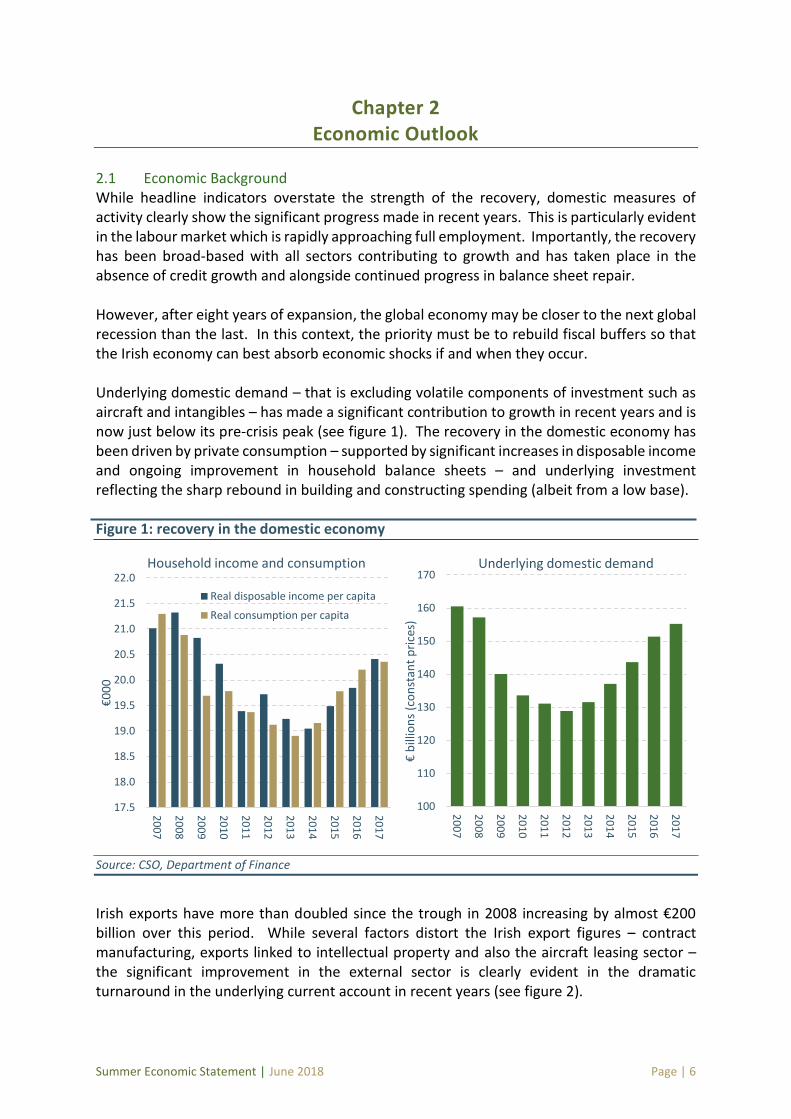
2.1 Economic Background While headline indicators overstate the strength of the recovery, domestic measures of activity clearly show the significant progress made in recent years. This is particularly evident in the labour market which is rapidly approaching full employment. Importantly, the recovery has been broad-based with all sectors contributing to growth and has taken place in the absence of credit growth and alongside continued progress in balance sheet repair. However, after eight years of expansion, the global economy may be closer to the next global recession than the last. In this context, the priority must be to rebuild fiscal buffers so that the Irish economy can best absorb economic shocks if and when they occur. Underlying domestic demand – that is excluding volatile components of investment such as aircraft and intangibles – has made a significant contribution to growth in recent years and is now just below its pre-crisis peak (see figure 1). The recovery in the domestic economy has been driven by private consumption – supported by significant increases in disposable income and ongoing improvement in household balance sheets – and underlying investment reflecting the sharp rebound in building and constructing spending (albeit from a low base). Figure 1: recovery in the domestic economy
Source: CSO, Department of Finance
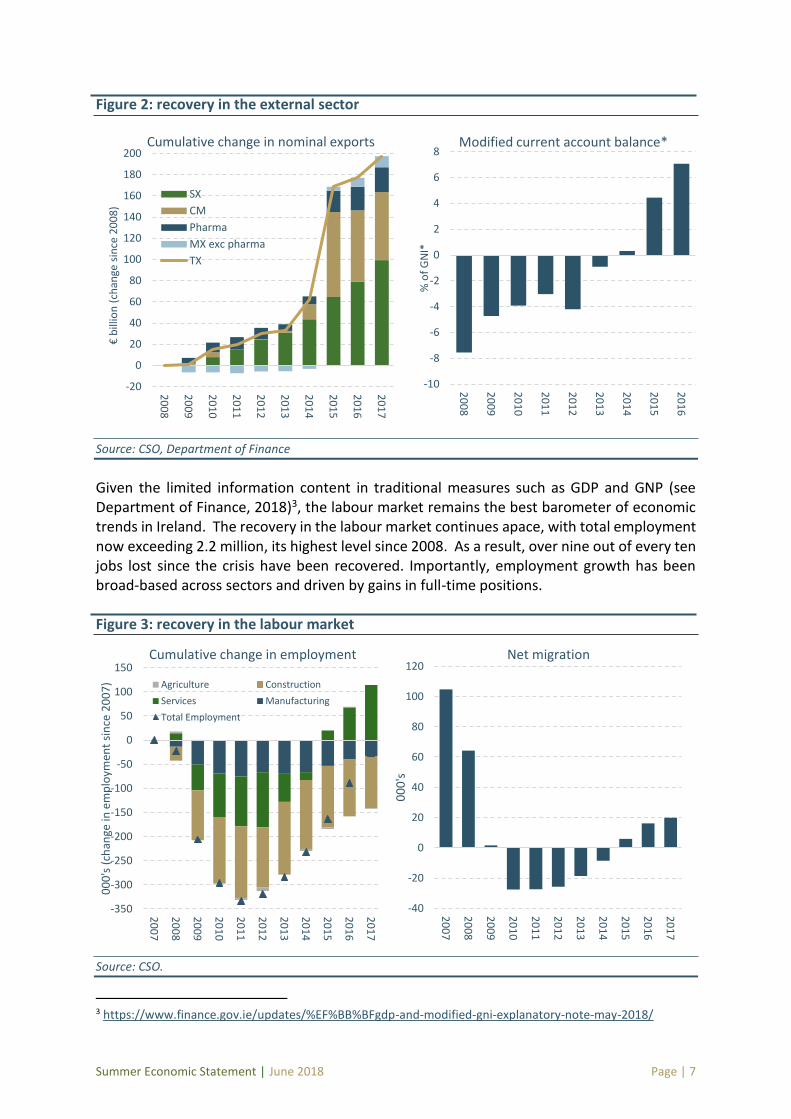
Irish exports have more than doubled since the trough in 2008 increasing by almost €200 billion over this period. While several factors distort the Irish export figures – contract manufacturing, exports linked to intellectual property and also the aircraft leasing sector – the significant improvement in the external sector is clearly evident in the dramatic turnaround in the underlying current account in recent years (see figure 2).
17.5
18.0
18.5
19.0
19.5
20.0
20.5
21.0
21.5
22.0
20
07
20
08
20
09
20
10
20
11
20
12
20
13
20
14
20
15
20
16
20
17
€0
00
Household income and consumption
Real disposable income per capita
Real consumption per capita
100
110
120
130
140
150
160
170
20
07
20
08
20
09
20
10
20
11
20
12
20
13
20
14
20
15
20
16
20
17
€b
illio
ns
(co
nst
ant
pri
ces)
Underlying domestic demand
Summer Economic Statement | June 2018 Page | 7
Figure 2: recovery in the external sector
Source: CSO, Department of Finance
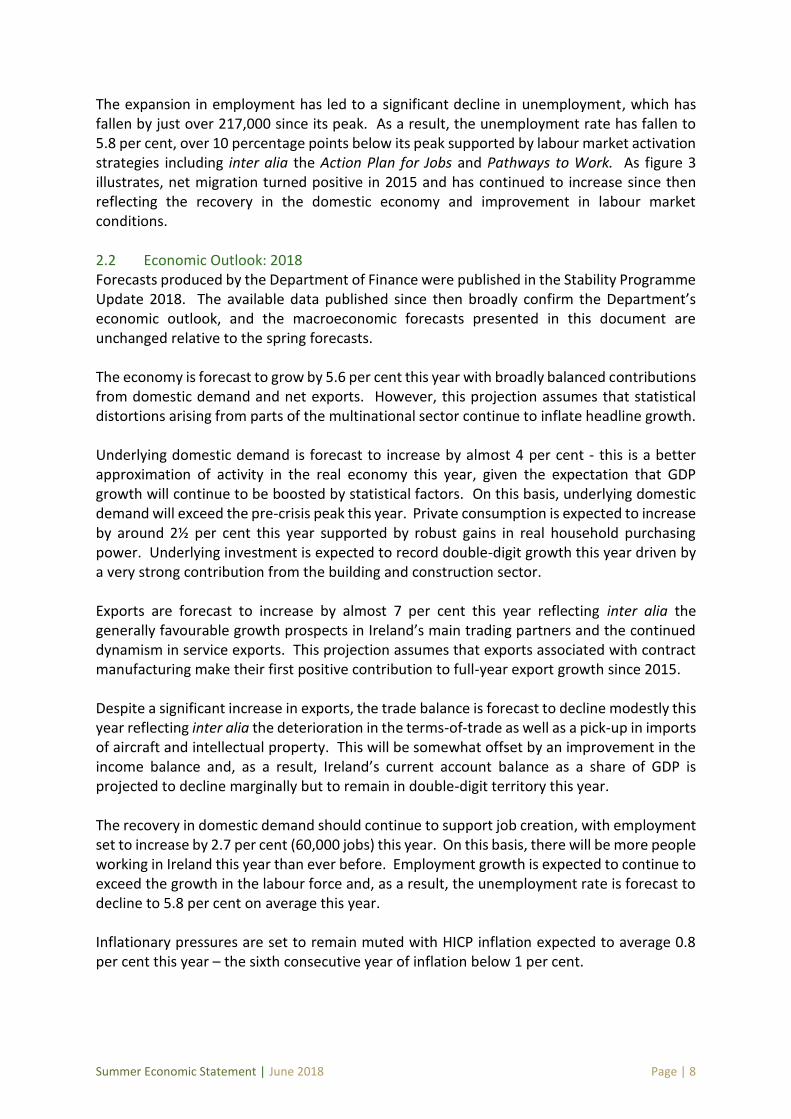
Given the limited information content in traditional measures such as GDP and GNP (see Department of Finance, 2018)3, the labour market remains the best barometer of economic trends in Ireland. The recovery in the labour market continues apace, with total employment now exceeding 2.2 million, its highest level since 2008. As a result, over nine out of every ten jobs lost since the crisis have been recovered. Importantly, employment growth has been broad-based across sectors and driven by gains in full-time positions. Figure 3: recovery in the labour market
Source: CSO.
3 https://www.finance.gov.ie/updates/%EF%BB%BFgdp-and-modified-gni-explanatory-note-may-2018/
-20
0
20
40
60
80
100
120
140
160
180
200
20
08
20
09
20
10
20
11
20
12
20
13
20
14
20
15
20
16
20
17
€b
illio
n (
chan
ge s
ince
20
08
)
Cumulative change in nominal exports
SX
CM
Pharma
MX exc pharma
TX
-10
-8
-6
-4
-2
0
2
4
6
8
20
08
20
09
20
10
20
11
20
12
20
13
20
14
20
15
20
16
% o
f G
NI*
Modified current account balance*
-350
-300
-250
-200
-150
-100
-50
0
50
100
150
20
07
20
08
20
09
20
10
20
11
20
12
20
13
20
14
20
15
20
16
20
17
00
0's
(ch
ange
in e
mp
loym
ent
sin
ce 2
00
7)
Cumulative change in employment
Agriculture Construction
Services Manufacturing
Total Employment
-40
-20
0
20
40
60
80
100
120
20
07
20
08
20
09
20
10
20
11
20
12
20
13
20
14
20
15
20
16
20
17
00
0's
Net migration
Summer Economic Statement | June 2018 Page | 8
The expansion in employment has led to a significant decline in unemployment, which has fallen by just over 217,000 since its peak. As a result, the unemployment rate has fallen to 5.8 per cent, over 10 percentage points below its peak supported by labour market activation strategies including inter alia the Action Plan for Jobs and Pathways to Work. As figure 3 illustrates, net migration turned positive in 2015 and has continued to increase since then reflecting the recovery in the domestic economy and improvement in labour market conditions. 2.2 Economic Outlook: 2018 Forecasts produced by the Department of Finance were published in the Stability Programme Update 2018. The available data published since then broadly confirm the Department’s economic outlook, and the macroeconomic forecasts presented in this document are unchanged relative to the spring forecasts.
The economy is forecast to grow by 5.6 per cent this year with broadly balanced contributions from domestic demand and net exports. However, this projection assumes that statistical distortions arising from parts of the multinational sector continue to inflate headline growth. Underlying domestic demand is forecast to increase by almost 4 per cent - this is a better approximation of activity in the real economy this year, given the expectation that GDP growth will continue to be boosted by statistical factors. On this basis, underlying domestic demand will exceed the pre-crisis peak this year. Private consumption is expected to increase by around 2½ per cent this year supported by robust gains in real household purchasing power. Underlying investment is expected to record double-digit growth this year driven by a very strong contribution from the building and construction sector.
Exports are forecast to increase by almost 7 per cent this year reflecting inter alia the generally favourable growth prospects in Ireland’s main trading partners and the continued dynamism in service exports. This projection assumes that exports associated with contract manufacturing make their first positive contribution to full-year export growth since 2015. Despite a significant increase in exports, the trade balance is forecast to decline modestly this year reflecting inter alia the deterioration in the terms-of-trade as well as a pick-up in imports of aircraft and intellectual property. This will be somewhat offset by an improvement in the income balance and, as a result, Ireland’s current account balance as a share of GDP is projected to decline marginally but to remain in double-digit territory this year. The recovery in domestic demand should continue to support job creation, with employment set to increase by 2.7 per cent (60,000 jobs) this year. On this basis, there will be more people working in Ireland this year than ever before. Employment growth is expected to continue to exceed the growth in the labour force and, as a result, the unemployment rate is forecast to decline to 5.8 per cent on average this year. Inflationary pressures are set to remain muted with HICP inflation expected to average 0.8 per cent this year – the sixth consecutive year of inflation below 1 per cent.
Summer Economic Statement | June 2018 Page | 9
Short-term risks to the baseline scenario are tilted to the downside. This mainly reflects the possibility of a ‘cliff-edge’ Brexit – in the event of a transitional arrangement not being agreed between the EU and the UK. Increasing trade protectionism and an intensification in geopolitical uncertainty are also prominent downside risks facing the Irish economy. However, on the other hand, statistical factors – including exports linked to contract manufacturing and intellectual property – could provide a stronger than anticipated boost to headline growth4.
2.3 Economic Outlook: 2019 and the medium term The baseline forecast for next year is growth of 4 per cent driven primarily by growth in domestic demand. Over the medium-term, the economy is projected to grow in line with its potential growth rate of around 3 per cent per annum. The central scenario assumes that a transition period will be agreed until end-2020, during which the status quo will continue to apply i.e. the UK is assumed to remain in the single market and customs union during this period. From 2021 onwards, the EU and the UK are assumed to conclude a free trade agreement; there is, of course, considerable uncertainty in relation to the post-exit nature of the trading arrangements between the EU and the UK.
Table 1: Macroeconomic forecasts (as set out in the Stability Programme Update 2018)5
% change (unless stated) 2017 2018 2019 2020 2021
Economic Activity
Real GDP 7.8 5.6 4.0 3.4 2.8 Real GNP 6.6 5.6 3.7 3.1 2.6
Prices
HICP 0.3 0.8 1.0 1.4 2.6 Core HICP 0.0 0.7 1.2 1.5 2.6 GDP deflator -0.3 0.0 1.3 1.3 1.5
Balance of Payments
Trade balance (per cent of GDP) 32.1 31.6 31.1 30.8 30.2 Current account (per cent of GDP) 12.5 12.2 11.4 10.9 10.2
Labour Market
Total Employment (‘000)^ 2,194 2,254 2,307 2,350 2,389 Employment 2.9 2.7 2.3 1.9 1.7 Unemployment (per cent) 6.7 5.8 5.3 5.3 5.4
^ Nearest 1,000. Source: CSO and Department of Finance.
The domestic economy is set to be the main source of growth over the medium-term. Consumption is expected to grow by around 2 per cent on average over the 2019-2021 period while underlying investment as a share of modified GNI is projected to revert to more normal levels reflecting the pick-up in residential investment. Export growth is expected to soften
4 While statistical factors have in general inflated growth in recent years, these factors also have the potential to lower measured output over the forecast horizon. 5 Updated macroeconomic forecasts will be published with Budget 2019 in October.
Summer Economic Statement | June 2018 Page | 10
somewhat over the forecast horizon but to remain in excess of external demand reflecting the favourable composition of Irish exports. The level of employment is expected to grow by 2 per cent on average over the 2019-2021 period. If achieved there will be almost 2.4 million people at work by 2021. This is consistent with productivity growth of almost 1 ½ per cent on average over the medium-term (Box 2 discusses Ireland’s productivity potential). The unemployment rate is expected to fall below the 5 ½ per cent mark next year and remain broadly at this level over the medium term. Demographic factors – the ‘natural’ increase in the working age population and net inward migration – and a pick-up in the participation rate should continue to support solid labour force growth over the forecast horizon. Over the medium-term the balance of risk is firmly tilted to the downside and principally on the external side. First and foremost is the potential fallout from a more adverse-than-expected outcome of the Brexit discussions currently under way (Annex 2 outlines the very tight Brexit timeline). Secondly, given the importance of the traded sector in the Irish economy, any disruption to world trade and in particular a tit-for-tat trade war would have a disproportionate impact on Irish growth prospects. In addition, a faster-than-expected normalisation of monetary policy (especially in the euro area), changes in other jurisdictions that affect the competitiveness of Ireland’s corporate tax regime and rising geopolitical uncertainty all have the potential to derail the recovery6. Domestically, the principal risk relates to potential overheating as the economy approaches full-employment. While this is likely to boost growth initially, overheating pressures could generate significant imbalances over the medium-term. From a policy perspective, given the stage of the economic cycle, it is essential that budgetary policy ‘leans against the wind’ and does not contribute to overheating pressures. This is one of the defining economic challenges facing the Government over the coming years.
6 A more comprehensive assessment of risks is set out in chapter 6 of the Stability Programme Update 2018. http://www.finance.gov.ie/wp-content/uploads/2018/04/spu-final-final.pdf
Summer Economic Statement | June 2018 Page | 11
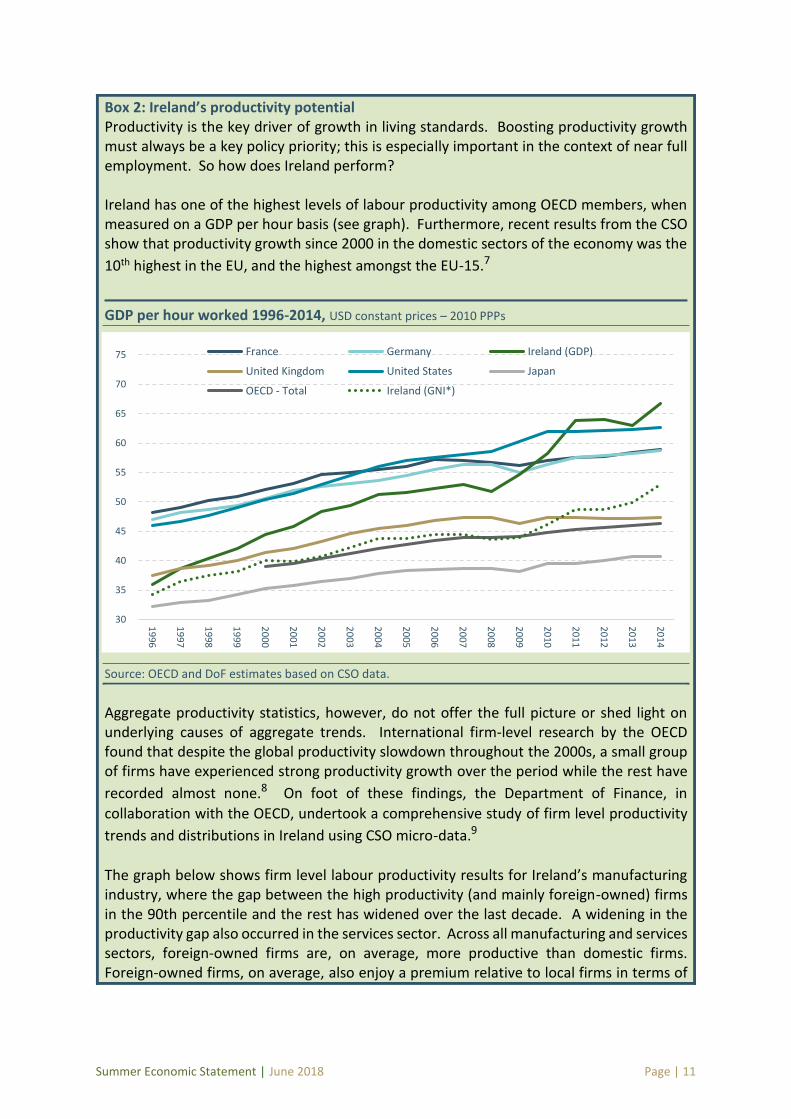
Box 2: Ireland’s productivity potential Productivity is the key driver of growth in living standards. Boosting productivity growth must always be a key policy priority; this is especially important in the context of near full employment. So how does Ireland perform? Ireland has one of the highest levels of labour productivity among OECD members, when measured on a GDP per hour basis (see graph). Furthermore, recent results from the CSO show that productivity growth since 2000 in the domestic sectors of the economy was the
10th highest in the EU, and the highest amongst the EU-15.7
GDP per hour worked 1996-2014, USD constant prices – 2010 PPPs
Source: OECD and DoF estimates based on CSO data.
Aggregate productivity statistics, however, do not offer the full picture or shed light on underlying causes of aggregate trends. International firm-level research by the OECD found that despite the global productivity slowdown throughout the 2000s, a small group of firms have experienced strong productivity growth over the period while the rest have
recorded almost none.8 On foot of these findings, the Department of Finance, in
collaboration with the OECD, undertook a comprehensive study of firm level productivity
trends and distributions in Ireland using CSO micro-data.9
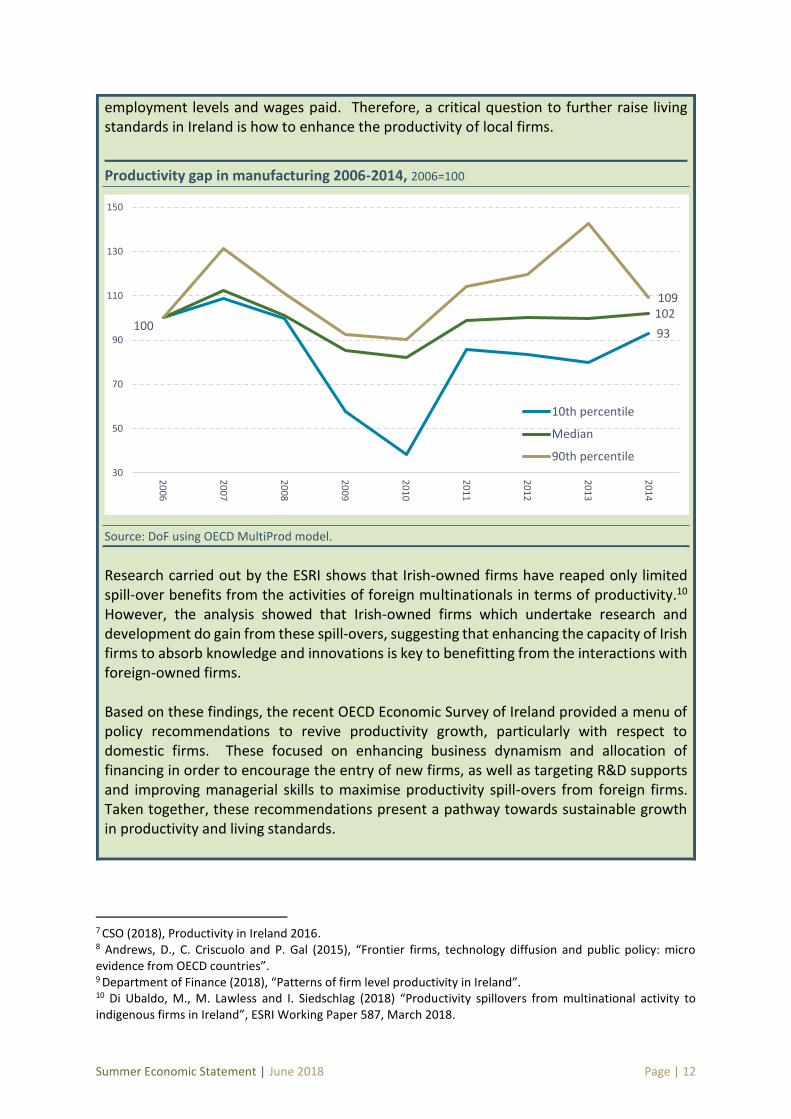
The graph below shows firm level labour productivity results for Ireland’s manufacturing industry, where the gap between the high productivity (and mainly foreign-owned) firms in the 90th percentile and the rest has widened over the last decade. A widening in the productivity gap also occurred in the services sector. Across all manufacturing and services sectors, foreign-owned firms are, on average, more productive than domestic firms. Foreign-owned firms, on average, also enjoy a premium relative to local firms in terms of
30
35
40
45
50
55
60
65
70
75
19
96
19
97
19
98
19
99
20
00
20
01
20
02
20
03
20
04
20
05
20
06
20
07
20
08
20
09
20
10
20
11
20
12
20
13
20
14
France Germany Ireland (GDP)
United Kingdom United States Japan
OECD - Total Ireland (GNI*)
Summer Economic Statement | June 2018 Page | 12
employment levels and wages paid. Therefore, a critical question to further raise living standards in Ireland is how to enhance the productivity of local firms.
Productivity gap in manufacturing 2006-2014, 2006=100
Source: DoF using OECD MultiProd model.
Research carried out by the ESRI shows that Irish-owned firms have reaped only limited spill-over benefits from the activities of foreign multinationals in terms of productivity.10 However, the analysis showed that Irish-owned firms which undertake research and development do gain from these spill-overs, suggesting that enhancing the capacity of Irish firms to absorb knowledge and innovations is key to benefitting from the interactions with foreign-owned firms. Based on these findings, the recent OECD Economic Survey of Ireland provided a menu of policy recommendations to revive productivity growth, particularly with respect to domestic firms. These focused on enhancing business dynamism and allocation of financing in order to encourage the entry of new firms, as well as targeting R&D supports and improving managerial skills to maximise productivity spill-overs from foreign firms. Taken together, these recommendations present a pathway towards sustainable growth in productivity and living standards.
7 CSO (2018), Productivity in Ireland 2016. 8 Andrews, D., C. Criscuolo and P. Gal (2015), “Frontier firms, technology diffusion and public policy: micro evidence from OECD countries”. 9 Department of Finance (2018), “Patterns of firm level productivity in Ireland”. 10 Di Ubaldo, M., M. Lawless and I. Siedschlag (2018) “Productivity spillovers from multinational activity to indigenous firms in Ireland”, ESRI Working Paper 587, March 2018.
93
102100
109
30
50
70
90
110
130
150
20
06
20
07
20
08
20
09
20
10
20
11
20
12
20
13
20
14
10th percentile
Median
90th percentile
Summer Economic Statement | June 2018 Page | 13
Chapter 3 Budgetary Strategy
3.1 Background
Achieving the medium term budgetary objective (MTO) of a balanced budget in structural terms is the anchor for budgetary policy. While measuring the economic cycle is difficult in Ireland, it is clear nonetheless that the public finances are benefitting from the strong cyclical upswing. Accordingly, in these relatively good times it is important that fiscal policy target an improvement in the headline position (as the underlying, structural position is undoubtedly in deficit). Other European countries at an advanced stage of the economic cycle are already running headline surpluses (see box 1). This prudent approach will facilitate the building-up of buffers for when times are less favourable and one that will help mitigate against potential future shocks. The pursuit of prudent fiscal policy over the past decade has helped put the public finances on a more sustainable footing. The Government is committed to ensuring that the pro-cyclical policy mistakes of the past will not be repeated and jeopardise our hard won gains. Looking to the medium term, in order to ensure fiscal policy does not contribute to overheating risks, it will be important to ensure that budgetary policy focuses on adopting the appropriate fiscal stance. Essentially this will ensure that while we meet the demands for enhanced public service delivery as well as investment in key infrastructure, we do so in a manner which ‘leans against the wind’. Given a range of potentially negative political and economic risks on the horizon including inter alia the impact of Brexit, policy uncertainty in a number of our key trading partners and possible disruption to global trade we need to seize this current opportunity to rebuild fiscal capacity through eliminating budget deficits and targeting the reduction of our stock of debt. This will complement other initiatives such as developing a fiscal cushion through putting aside some of the historically high levels of corporation tax for the purpose of creating the Rainy Day Fund.
3.2 Fiscal developments to date in 2018 Exchequer tax revenues, including the revenue measures introduced as part of Budget 2018, are forecast to increase by 5.7 per cent this year11. In the first five months of the year, taxation receipts were 5 per cent (€973 million) higher than in the same period last year and broadly in line with expectations. May is a key collection month for Exchequer tax receipts, the second largest of the year. Receipts for this period came in ahead of target, boosted in part by strong corporation tax performance, standing us in good stead to hit overall targets for the year. In terms of individual tax headings, income tax receipts to end-May recorded a robust performance, up 6.1 per cent (€466 million) in annual terms, reflecting positive labour market developments. Receipts were broadly in-line with their cumulative target. The other direct
11 Local Property Tax is now paid into the Local Government Fund (LGF) and Motor Tax receipts are now paid directly into the Exchequer instead of the LGF. Therefore, all tax revenue year-on-year comparisons are provided on a like-for-like basis.
Summer Economic Statement | June 2018 Page | 14
tax heading – corporation tax – rose by 25 per cent (€414 million) in annual terms. The bulk of this over-performance largely relates to the impact of implementing changes in relation to IFRS15 accounting standard. Turning to indirect taxes, VAT performed slightly below expectations, by 1.5 per cent (€105 million), in the year to end-May with receipts amounting to €6,916 million. In annual terms, VAT recorded growth of 1.3 per cent (€88 million) in the period to end-May. Excise duties were 3.2 per cent (€68 million) lower than expectations. Relative to the first five months of last year, excise duties were down by 7.8 per cent (€175 million), as the temporary effect arising from the introduction of the domestic plain packaging initiative on tobacco products continues to weigh on receipts. An annual decline of 1.8 per cent in excise duty receipts is factored into the current fiscal arithmetic. In terms of the outlook for the year as a whole, total tax receipts are projected at €54.2 billion. This is unchanged from Budget 2018, once the technical re-classification impact of motor and local property taxation are taken into account. The estimate for non-tax revenue remains unchanged from the SPU. Non-tax revenue has benefited this year from an increase in the surplus income from the Central Bank as the disposal of the floating rate notes has accelerated. Surplus income from the Central Bank is expected to fall from its current elevated levels over the forecast horizon as the Central Bank’s holding of floating rate notes continues to decline. The forecast for non-voted expenditure remains in-line with the recently published SPU forecast, while non-voted expenditure is broadly on-profile in the year-to-date. Turning to voted expenditure developments, estimated total gross voted expenditure for 2018, as set out in the Revised Estimates Volume is €61.8 billion. Of this, €55.9 billion relates to gross voted current expenditure and €5.8 billion relates to gross voted capital expenditure. In year-on-year terms, this is an overall increase of 5.5 per cent. This reflects a significant technical adjustment relating to the funding of domestic water services. Following the enactment of the Water Services Act 2017, all motor tax receipts are to be paid into the Exchequer rather than the Local Government Fund and all State funding for domestic water services will now come from voted expenditure through the Department of Housing, Planning and Local Government. This results in an increase in gross voted expenditure by the Department of Housing, Planning and Local Government of €500 million in capital and €292 million in current. Excluding this adjustment, gross voted expenditure for 2018 would be €60.9 billion, or an increase on 2017 of 4.2 per cent. In the main, Departments are managing their expenditure within profile. To end-May, total gross voted expenditure of €24 billion was €276 million, or 1.1 per cent below profile. Of this, gross voted current expenditure of €22.6 billion was on profile, while gross voted capital of €1.4 billion was €285 million, or 16.6 per cent below profile. While gross voted expenditure is broadly on profile at this stage, in year-on-year terms expenditure has increased by 7.1 per cent versus the same period in 2017. While this increase is partially due to certain timing issues, a key element of the year-on-year growth is expenditure on Health.
Summer Economic Statement | June 2018 Page | 15
Given the scale of overall expenditure in the health sector, and the additional resources allocated over the last four years, it is crucial that the Health allocation of over €15 billion is managed effectively by the Department of Health and the HSE. At end-May Health expenditure was 1 per cent above profile but up 10 per cent in year-on-year terms. This indicates that managing health expenditure over the rest of the year will be particularly challenging. The Mid-Year Expenditure Report will review the expenditure position, outline further details of emerging trends at that stage, and also examine the scope for the provision of additional funding, with a view that such additional funding would support improved service delivery including Sláinte Care.
Summer Economic Statement | June 2018 Page | 16
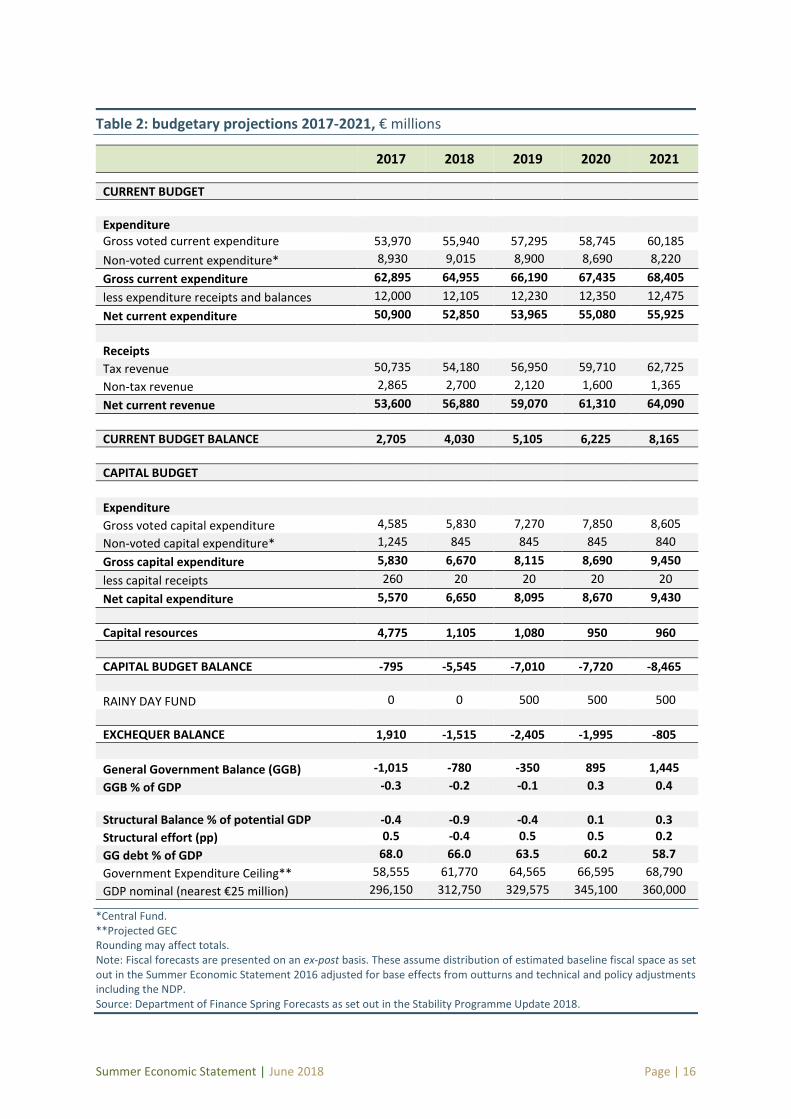
Table 2: budgetary projections 2017-2021, € millions
2017 2018 2019 2020 2021
CURRENT BUDGET
Expenditure Gross voted current expenditure 53,970 55,940 57,295 58,745 60,185
Non-voted current expenditure* 8,930 9,015 8,900 8,690 8,220
Gross current expenditure 62,895 64,955 66,190 67,435 68,405
less expenditure receipts and balances 12,000 12,105 12,230 12,350 12,475
Net current expenditure 50,900 52,850 53,965 55,080 55,925
Receipts
Tax revenue 50,735 54,180 56,950 59,710 62,725
Non-tax revenue 2,865 2,700 2,120 1,600 1,365
Net current revenue 53,600 56,880 59,070 61,310 64,090
CURRENT BUDGET BALANCE 2,705 4,030 5,105 6,225 8,165
CAPITAL BUDGET
Expenditure
Gross voted capital expenditure 4,585 5,830 7,270 7,850 8,605
Non-voted capital expenditure* 1,245 845 845 845 840
Gross capital expenditure 5,830 6,670 8,115 8,690 9,450
less capital receipts 260 20 20 20 20
Net capital expenditure 5,570 6,650 8,095 8,670 9,430
Capital resources 4,775 1,105 1,080 950 960
CAPITAL BUDGET BALANCE -795 -5,545 -7,010 -7,720 -8,465
RAINY DAY FUND 0 0 500 500 500
EXCHEQUER BALANCE 1,910 -1,515 -2,405 -1,995 -805
General Government Balance (GGB) -1,015 -780 -350 895 1,445
GGB % of GDP -0.3 -0.2 -0.1 0.3 0.4
Structural Balance % of potential GDP -0.4 -0.9 -0.4 0.1 0.3
Structural effort (pp) 0.5 -0.4 0.5 0.5 0.2
GG debt % of GDP 68.0 66.0 63.5 60.2 58.7
Government Expenditure Ceiling** 58,555 61,770 64,565 66,595 68,790
GDP nominal (nearest €25 million) 296,150 312,750 329,575 345,100 360,000
*Central Fund. **Projected GEC Rounding may affect totals. Note: Fiscal forecasts are presented on an ex-post basis. These assume distribution of estimated baseline fiscal space as set out in the Summer Economic Statement 2016 adjusted for base effects from outturns and technical and policy adjustments including the NDP. Source: Department of Finance Spring Forecasts as set out in the Stability Programme Update 2018.
Summer Economic Statement | June 2018 Page | 17
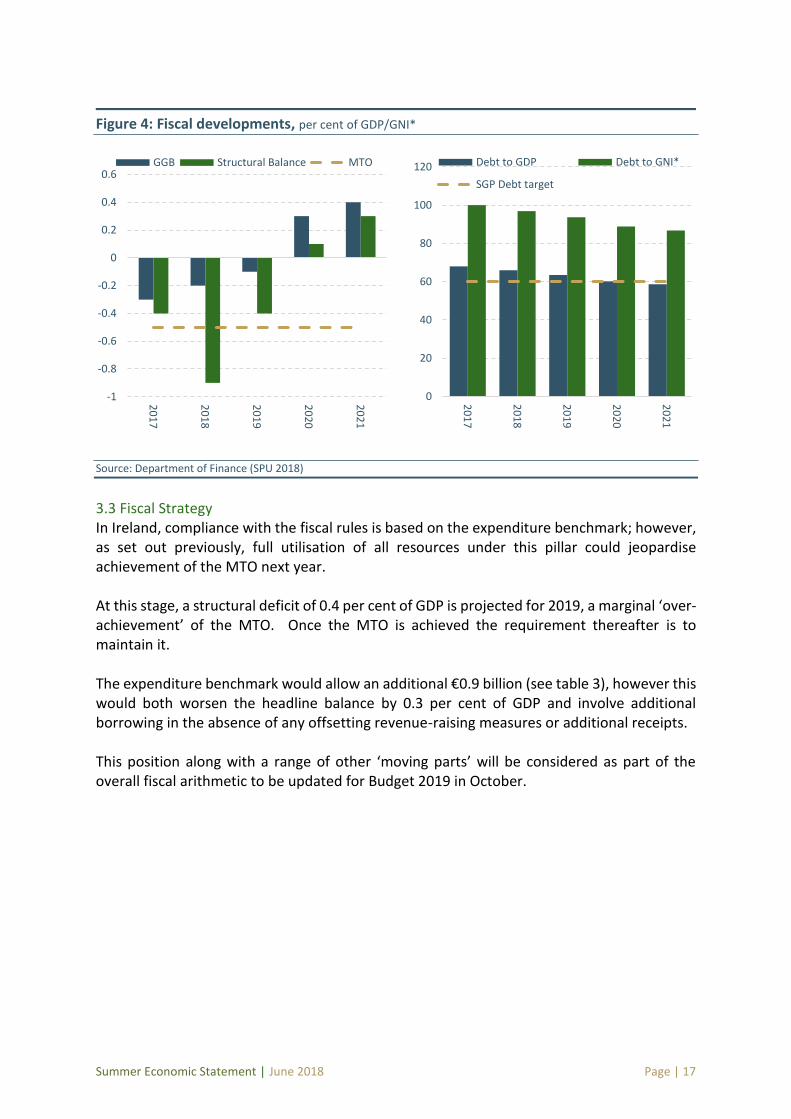
Figure 4: Fiscal developments, per cent of GDP/GNI*
Source: Department of Finance (SPU 2018)
3.3 Fiscal Strategy In Ireland, compliance with the fiscal rules is based on the expenditure benchmark; however, as set out previously, full utilisation of all resources under this pillar could jeopardise achievement of the MTO next year. At this stage, a structural deficit of 0.4 per cent of GDP is projected for 2019, a marginal ‘over-achievement’ of the MTO. Once the MTO is achieved the requirement thereafter is to maintain it. The expenditure benchmark would allow an additional €0.9 billion (see table 3), however this would both worsen the headline balance by 0.3 per cent of GDP and involve additional borrowing in the absence of any offsetting revenue-raising measures or additional receipts. This position along with a range of other ‘moving parts’ will be considered as part of the overall fiscal arithmetic to be updated for Budget 2019 in October.
0
20
40
60
80
100
120
20
17
20
18
20
19
20
20
20
21
Debt to GDP Debt to GNI*
SGP Debt target
-1
-0.8
-0.6
-0.4
-0.2
0
0.2
0.4
0.6
20
17
20
18
20
19
20
20
20
21
GGB Structural Balance MTO
Summer Economic Statement | June 2018 Page | 18
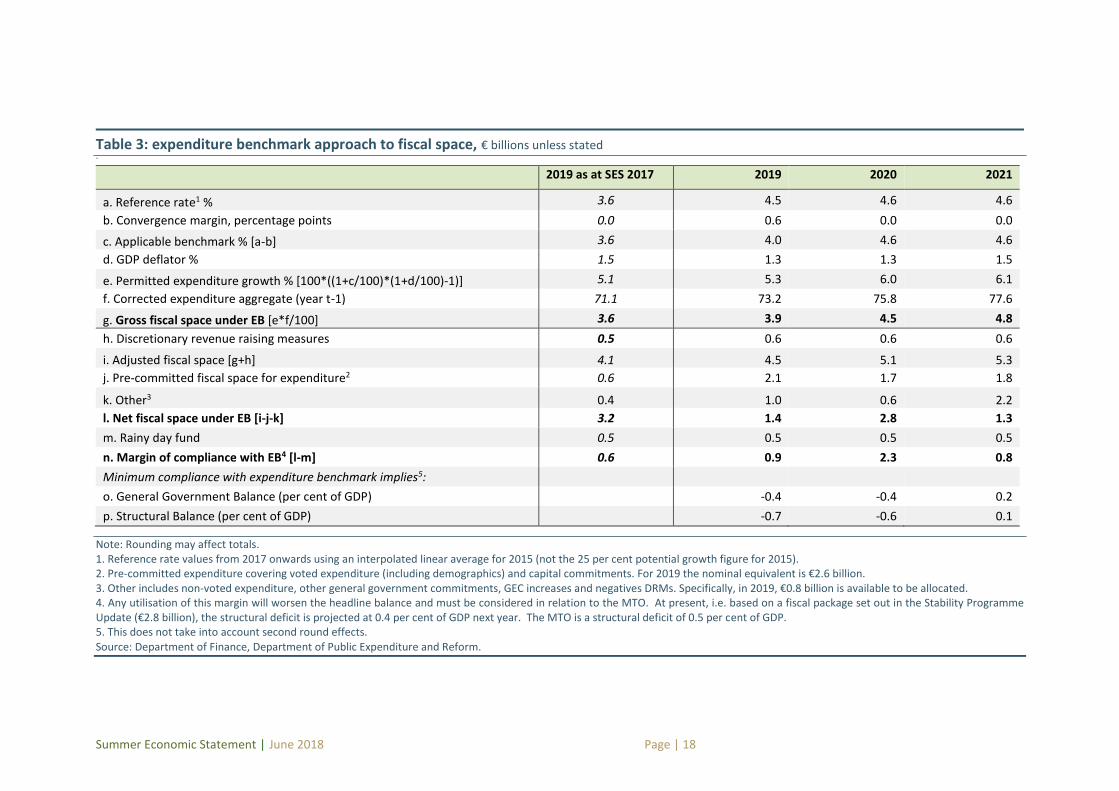
Table 3: expenditure benchmark approach to fiscal space, € billions unless stated `
2019 as at SES 2017 2019 2020 2021
a. Reference rate1 % 3.6 4.5 4.6 4.6
b. Convergence margin, percentage points 0.0 0.6 0.0 0.0
c. Applicable benchmark % [a-b] 3.6 4.0 4.6 4.6
d. GDP deflator % 1.5 1.3 1.3 1.5
e. Permitted expenditure growth % [100*((1+c/100)*(1+d/100)-1)] 5.1 5.3 6.0 6.1
f. Corrected expenditure aggregate (year t-1) 71.1 73.2 75.8 77.6
g. Gross fiscal space under EB [e*f/100] 3.6 3.9 4.5 4.8
h. Discretionary revenue raising measures 0.5 0.6 0.6 0.6
i. Adjusted fiscal space [g+h] 4.1 4.5 5.1 5.3
j. Pre-committed fiscal space for expenditure2 0.6 2.1 1.7 1.8
k. Other3 0.4 1.0 0.6 2.2
l. Net fiscal space under EB [i-j-k] 3.2 1.4 2.8 1.3
m. Rainy day fund 0.5 0.5 0.5 0.5
n. Margin of compliance with EB4 [l-m] 0.6 0.9 2.3 0.8
Minimum compliance with expenditure benchmark implies5:
o. General Government Balance (per cent of GDP) -0.4 -0.4 0.2
p. Structural Balance (per cent of GDP) -0.7 -0.6 0.1
Note: Rounding may affect totals. 1. Reference rate values from 2017 onwards using an interpolated linear average for 2015 (not the 25 per cent potential growth figure for 2015). 2. Pre-committed expenditure covering voted expenditure (including demographics) and capital commitments. For 2019 the nominal equivalent is €2.6 billion. 3. Other includes non-voted expenditure, other general government commitments, GEC increases and negatives DRMs. Specifically, in 2019, €0.8 billion is available to be allocated. 4. Any utilisation of this margin will worsen the headline balance and must be considered in relation to the MTO. At present, i.e. based on a fiscal package set out in the Stability Programme Update (€2.8 billion), the structural deficit is projected at 0.4 per cent of GDP next year. The MTO is a structural deficit of 0.5 per cent of GDP. 5. This does not take into account second round effects. Source: Department of Finance, Department of Public Expenditure and Reform.
Summer Economic Statement | June 2018 Page | 19
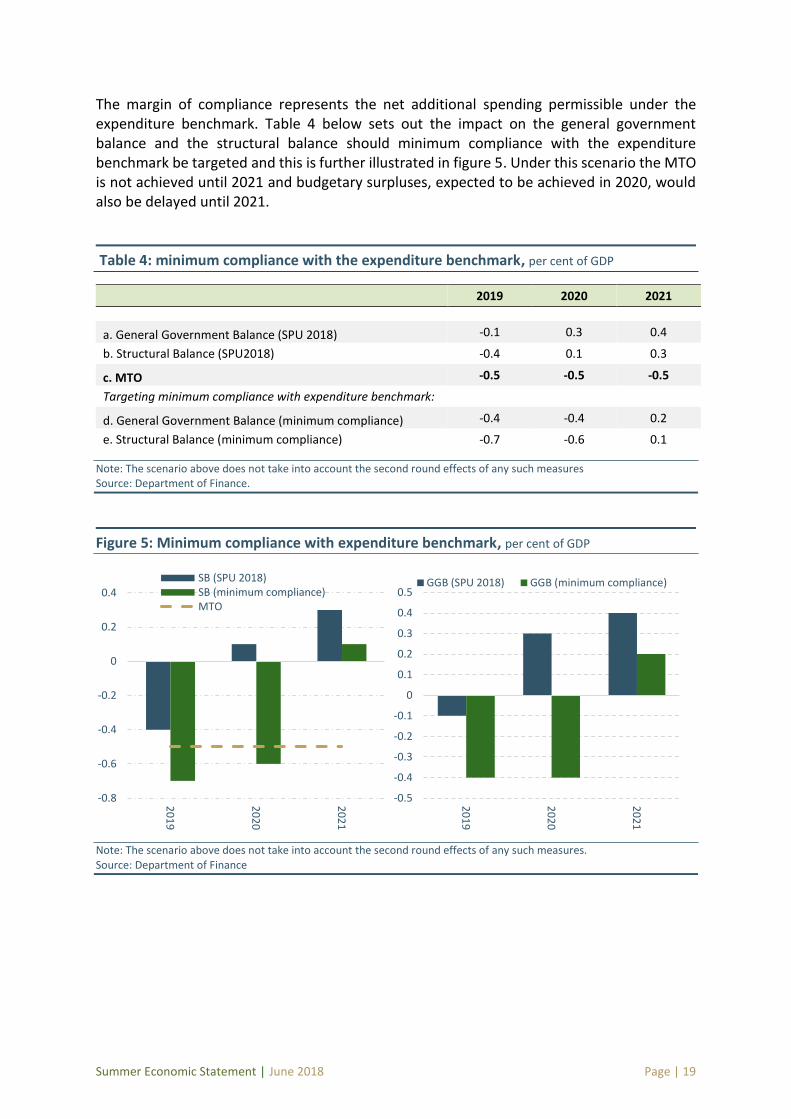
The margin of compliance represents the net additional spending permissible under the expenditure benchmark. Table 4 below sets out the impact on the general government balance and the structural balance should minimum compliance with the expenditure benchmark be targeted and this is further illustrated in figure 5. Under this scenario the MTO is not achieved until 2021 and budgetary surpluses, expected to be achieved in 2020, would also be delayed until 2021.
Table 4: minimum compliance with the expenditure benchmark, per cent of GDP
Note: The scenario above does not take into account the second round effects of any such measures Source: Department of Finance.
Figure 5: Minimum compliance with expenditure benchmark, per cent of GDP
Note: The scenario above does not take into account the second round effects of any such measures. Source: Department of Finance
-0.8
-0.6
-0.4
-0.2
0
0.2
0.4
20
19
20
20
20
21
SB (SPU 2018)SB (minimum compliance)MTO
-0.5
-0.4
-0.3
-0.2
-0.1
0
0.1
0.2
0.3
0.4
0.5
20
19
20
20
20
21
GGB (SPU 2018) GGB (minimum compliance)
2019 2020 2021
a. General Government Balance (SPU 2018) -0.1 0.3 0.4
b. Structural Balance (SPU2018) -0.4 0.1 0.3
c. MTO -0.5 -0.5 -0.5
Targeting minimum compliance with expenditure benchmark:
d. General Government Balance (minimum compliance) -0.4 -0.4 0.2
e. Structural Balance (minimum compliance) -0.7 -0.6 0.1
Summer Economic Statement | June 2018 Page | 20
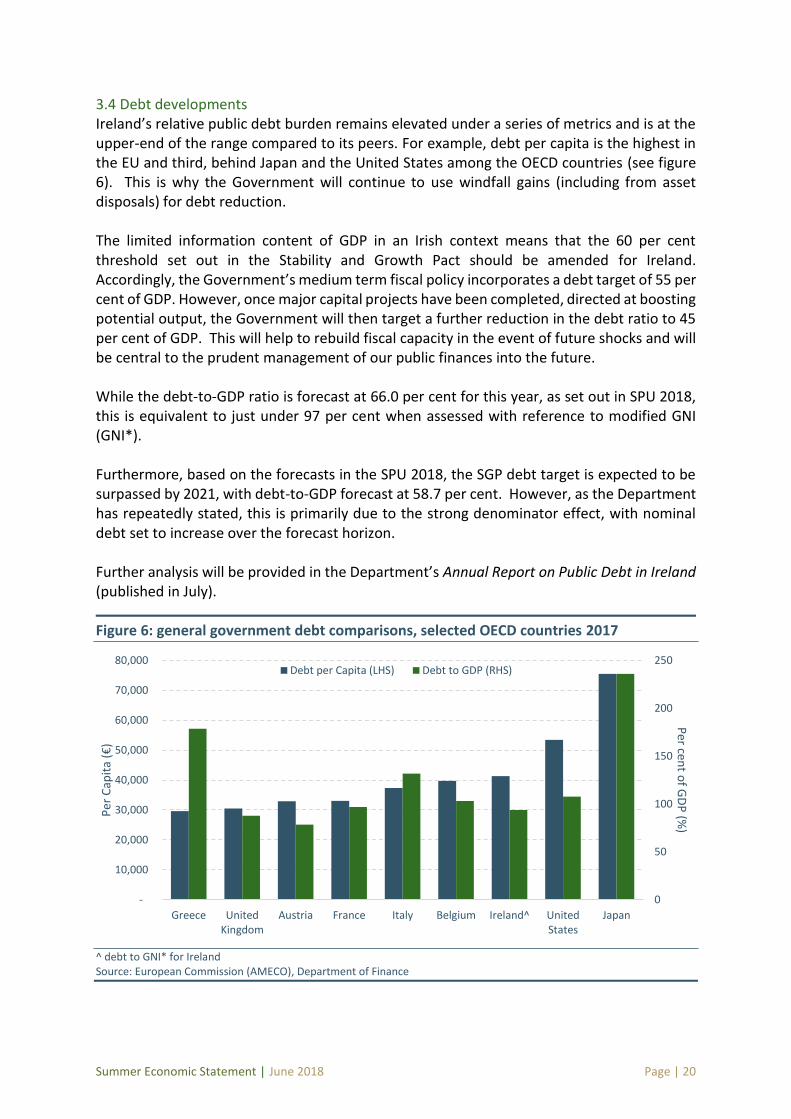
3.4 Debt developments Ireland’s relative public debt burden remains elevated under a series of metrics and is at the upper-end of the range compared to its peers. For example, debt per capita is the highest in the EU and third, behind Japan and the United States among the OECD countries (see figure 6). This is why the Government will continue to use windfall gains (including from asset disposals) for debt reduction. The limited information content of GDP in an Irish context means that the 60 per cent threshold set out in the Stability and Growth Pact should be amended for Ireland. Accordingly, the Government’s medium term fiscal policy incorporates a debt target of 55 per cent of GDP. However, once major capital projects have been completed, directed at boosting potential output, the Government will then target a further reduction in the debt ratio to 45 per cent of GDP. This will help to rebuild fiscal capacity in the event of future shocks and will be central to the prudent management of our public finances into the future. While the debt-to-GDP ratio is forecast at 66.0 per cent for this year, as set out in SPU 2018, this is equivalent to just under 97 per cent when assessed with reference to modified GNI (GNI*). Furthermore, based on the forecasts in the SPU 2018, the SGP debt target is expected to be surpassed by 2021, with debt-to-GDP forecast at 58.7 per cent. However, as the Department has repeatedly stated, this is primarily due to the strong denominator effect, with nominal debt set to increase over the forecast horizon. Further analysis will be provided in the Department’s Annual Report on Public Debt in Ireland (published in July).
Figure 6: general government debt comparisons, selected OECD countries 2017
^ debt to GNI* for Ireland Source: European Commission (AMECO), Department of Finance
0
50
100
150
200
250
-
10,000
20,000
30,000
40,000
50,000
60,000
70,000
80,000
Greece UnitedKingdom
Austria France Italy Belgium Ireland^ UnitedStates
Japan
Per cen
t of G
DP
(%)
Per
Cap
ita
(€)
Debt per Capita (LHS) Debt to GDP (RHS)
Summer Economic Statement | June 2018 Page | 21
3.5 Rainy day fund update The establishment of a rainy day fund will play an important role in enhancing the resilience of the public finances. The principal purpose of the Fund is to mitigate future external economic shocks, including by setting aside some of the historically high levels of corporation tax receipts which can be drawn on in the event of such a shock. It is a prudent measure being taken at a time when our public finances are relatively strong, intended to increase our economic resilience. The Minister for Finance conducted an Oireachtas consultation on the proposal to the establishing a rainy day fund, commencing with the publication of an Oireachtas consultation paper at the time of Budget 2018, which was subsequently followed by the Minister’s appearance at the Budgetary Oversight Committee on 31 January 2018, to discuss design and operational issues around the establishment of this important budgetary management mechanism. Legislation to establish the rainy day fund is currently being prepared. The Government has approved the general scheme of the Bill providing for its establishment, and the draft legislation is now proceeding to pre-legislative scrutiny. As announced in Budget 2018, it is proposed to capitalise the fund in the coming year with €1.5 billion from the Ireland Strategic Investment Fund which is both Exchequer and general government neutral. Annual transfers of €500 million from the Exchequer will commence in 2019, so that by 2021 the rainy day fund will amount to €3 billion.
Summer Economic Statement | June 2018 Page | 22
Chapter 4 Public Expenditure Strategy
4.1 Overview Over the period 1998 to 2018, on average gross voted expenditure on delivering public services and investing in public infrastructure grew broadly in line with economic growth as measured by modified GNI (GNI*). However, this period was also characterised by significant expenditure growth in the run up to 2008 that proved to be unsustainable, expenditure reductions from 2009 to 2014, and more recently moderate growth in public expenditure. The high levels of expenditure growth experienced in the run up to the fiscal and economic crisis necessitated significant expenditure reductions over the period 2009 to 2014. During this period, fiscal consolidation was accompanied by a programme of public service reform in order to help maintain public service delivery in the face of a necessary reduction in staff numbers and increased demand for public services. As the economy has recovered, it has been possible to provide for increases in public expenditure in recent years. While increases in expenditure have impacted broadly across all sectors, a particular focus has been placed on ensuring the areas of Health, Housing, Education and Social Protection are sufficiently funded to support the Government’s social goal for a fairer and more inclusive society. In order to support targeted sustainable growth in expenditure, considerable reforms have been implemented to improve Ireland’s budgetary framework. To ensure better value for the taxpayer, the Spending Review process has been embedded in the budgetary framework. This process supports an evidence based approach to policy and ensures the consistent evaluation of existing expenditure commitments through systematic reviews of expenditure programmes across all sectors of Government. The process ensures that a significant stock of relevant analysis and evaluation is carried out across all Departments and Offices, thus helping to identify areas of existing expenditure that could be spent more efficiently and provide a greater benefit to citizens. In addition to this, improved Public Service reform has consistently been a key priority both during and following the economic downturn, with a comprehensive series of reforms having been implemented since the first Public Service Reform Plan was published in November 2011. The current plan, Our Public Service 2020 (OPS2020), builds on the achievements of the previous reform plans and sets a path for improvements beyond 2020. Earlier this year the Government launched Project Ireland 2040, an ambitious and strategic vision for Ireland’s investment in critical infrastructure in the future. It consists of two core elements: a National Planning Framework and a €116 billion investment plan covering the next 10 years. With this plan, investment levels in Ireland will continue to increase at a sustainable rate and, very importantly, our infrastructure investment will be strictly guided by the National Planning Framework which creates a single vision for our country as a whole, both rural and urban. This will deliver modern public infrastructure over the coming years which will improve the lives of people throughout Ireland and allow our companies and economy to continue to thrive in a globalised world.
Summer Economic Statement | June 2018 Page | 23
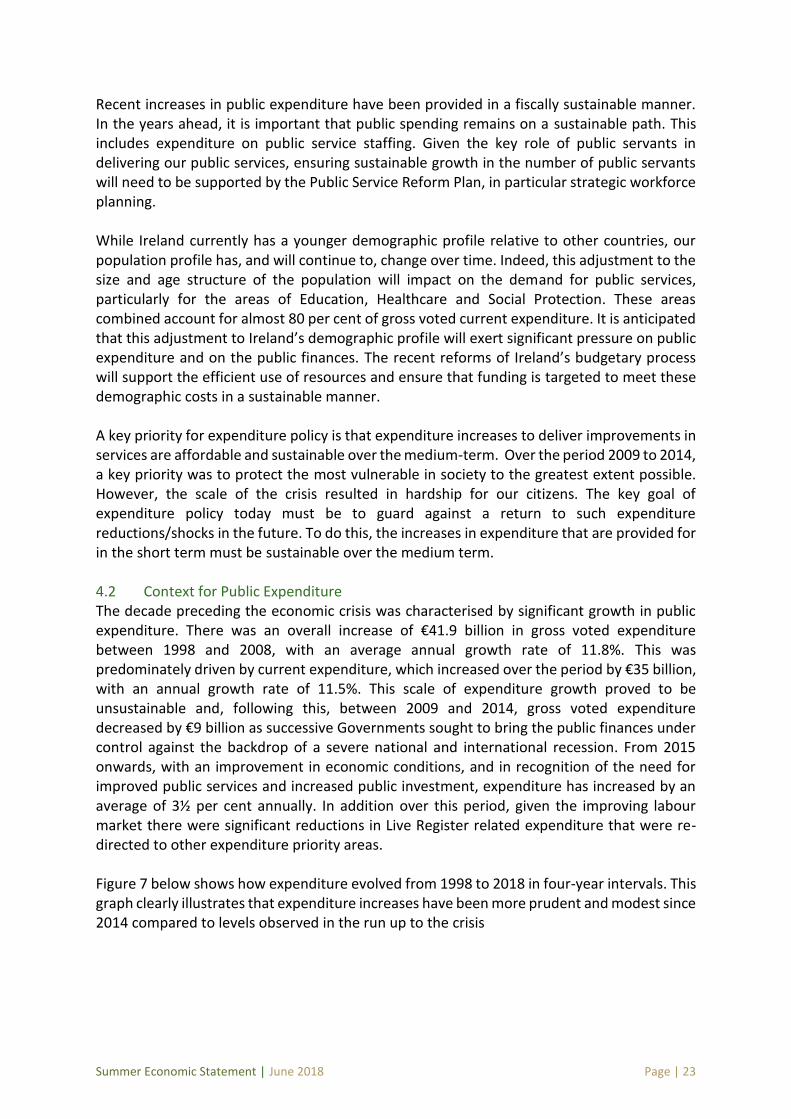
Recent increases in public expenditure have been provided in a fiscally sustainable manner. In the years ahead, it is important that public spending remains on a sustainable path. This includes expenditure on public service staffing. Given the key role of public servants in delivering our public services, ensuring sustainable growth in the number of public servants will need to be supported by the Public Service Reform Plan, in particular strategic workforce planning. While Ireland currently has a younger demographic profile relative to other countries, our population profile has, and will continue to, change over time. Indeed, this adjustment to the size and age structure of the population will impact on the demand for public services, particularly for the areas of Education, Healthcare and Social Protection. These areas combined account for almost 80 per cent of gross voted current expenditure. It is anticipated that this adjustment to Ireland’s demographic profile will exert significant pressure on public expenditure and on the public finances. The recent reforms of Ireland’s budgetary process will support the efficient use of resources and ensure that funding is targeted to meet these demographic costs in a sustainable manner. A key priority for expenditure policy is that expenditure increases to deliver improvements in services are affordable and sustainable over the medium-term. Over the period 2009 to 2014, a key priority was to protect the most vulnerable in society to the greatest extent possible. However, the scale of the crisis resulted in hardship for our citizens. The key goal of expenditure policy today must be to guard against a return to such expenditure reductions/shocks in the future. To do this, the increases in expenditure that are provided for in the short term must be sustainable over the medium term. 4.2 Context for Public Expenditure The decade preceding the economic crisis was characterised by significant growth in public expenditure. There was an overall increase of €41.9 billion in gross voted expenditure between 1998 and 2008, with an average annual growth rate of 11.8%. This was predominately driven by current expenditure, which increased over the period by €35 billion, with an annual growth rate of 11.5%. This scale of expenditure growth proved to be unsustainable and, following this, between 2009 and 2014, gross voted expenditure decreased by €9 billion as successive Governments sought to bring the public finances under control against the backdrop of a severe national and international recession. From 2015 onwards, with an improvement in economic conditions, and in recognition of the need for improved public services and increased public investment, expenditure has increased by an average of 3½ per cent annually. In addition over this period, given the improving labour market there were significant reductions in Live Register related expenditure that were re-directed to other expenditure priority areas. Figure 7 below shows how expenditure evolved from 1998 to 2018 in four-year intervals. This graph clearly illustrates that expenditure increases have been more prudent and modest since 2014 compared to levels observed in the run up to the crisis
Summer Economic Statement | June 2018 Page | 24
Figure 7: expenditure growth 1998 - 2018 by interval
Source: DPER databank
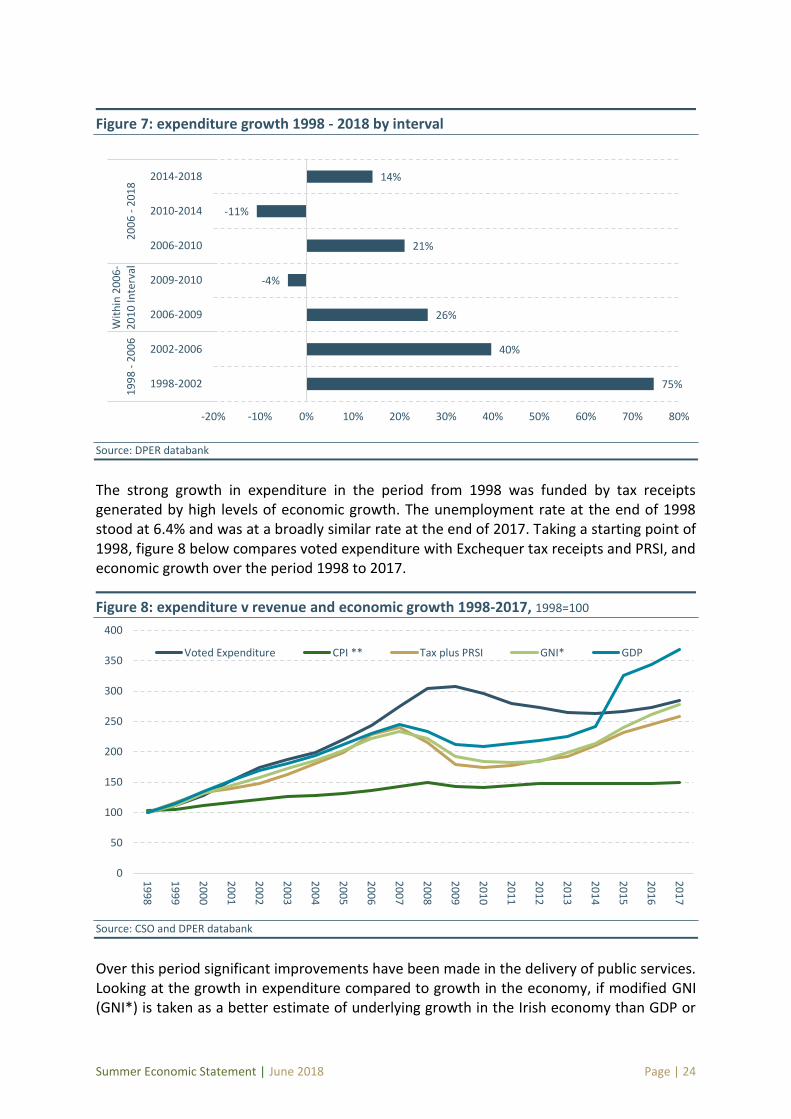
The strong growth in expenditure in the period from 1998 was funded by tax receipts generated by high levels of economic growth. The unemployment rate at the end of 1998 stood at 6.4% and was at a broadly similar rate at the end of 2017. Taking a starting point of 1998, figure 8 below compares voted expenditure with Exchequer tax receipts and PRSI, and economic growth over the period 1998 to 2017.
Figure 8: expenditure v revenue and economic growth 1998-2017, 1998=100
Source: CSO and DPER databank
Over this period significant improvements have been made in the delivery of public services. Looking at the growth in expenditure compared to growth in the economy, if modified GNI (GNI*) is taken as a better estimate of underlying growth in the Irish economy than GDP or
75%
40%
26%
-4%
21%
-11%
14%
-20% -10% 0% 10% 20% 30% 40% 50% 60% 70% 80%
1998-2002
2002-2006
2006-2009
2009-2010
2006-2010
2010-2014
2014-2018
19
98
- 2
00
6W
ith
in 2
00
6-
20
10
Inte
rval
20
06
- 2
01
8
0
50
100
150
200
250
300
350
4001
99
8
19
99
20
00
20
01
20
02
20
03
20
04
20
05
20
06
20
07
20
08
20
09
20
10
20
11
20
12
20
13
20
14
20
15
20
16
20
17
Voted Expenditure CPI ** Tax plus PRSI GNI* GDP
Summer Economic Statement | June 2018 Page | 25
GNP, then overall voted expenditure, with a compound annual growth rate of 5.7 per cent, has grown broadly in line with the average growth rate in the economy over this period at 5.5 per cent. The pattern of unsustainable growth funded by high levels of economic and tax growth, followed by significant expenditure reductions impacted on delivery of public services and made it difficult for Departments to plan for long-term developments in public services and infrastructure. In the last number of years, a key focus has been on ensuring ongoing, sustainable improvements in public services and infrastructure. This policy is aimed at ensuring that the core functions of the State are sufficiently funded and that sustainable improvements to public services are delivered. A policy of sustainable incremental improvements in the delivery of public services works towards ensuring that the pattern of unsustainable growth in the run up to the economic crisis, and subsequent necessity for expenditure reductions will not be repeated. This policy also facilitates Departments in planning for long-term developments in public services and infrastructure. 4.3 Expenditure Strategy In recent years, significant reforms have been implemented to Ireland’s budgetary framework to embed sound expenditure management practice that maintains a focus on the results being achieved across the public service and the extent to which public spending is delivering on key policy objectives. Key elements within this suite of expenditure reform measures include Performance Budgeting, increased resourcing of the Irish Government Economic and Evaluation Service (IGEES), which is tasked with promoting and embedding evidence in the policy making process, and the Spending Review process which also enhances the evidence base to inform the prioritisation of expenditure. These reforms operate within the wider expenditure framework that is focused on seeking to ensure that growth in public expenditure is sustainable. However, the level of increasing and competing public service demands in areas such as Health, Social Protection and Education means that managing expenditure within these parameters is challenging. In this context, the focus must be on examining the totality of public expenditure including in particular the rationale/objectives, effectiveness, efficiency and impact of public spending. The challenge is to ensure that, in practice, all expenditure decisions and ongoing expenditure programmes are based on clear objectives and deliver real value-for-money in terms of their impact and efficiency. Spending Review 2018 The 2017 Summer Economic Statement outlined the approach taken to carrying out the Spending Review 2017-2019. The purpose of carrying out a review of spending is to shift the emphasis away from the incremental nature of the annual Estimates process, with focus instead on assessing the effectiveness of the totality of existing programmes. This review differs from the 'comprehensive' reviews of expenditures carried out post-crisis, with the introduction of a 'rolling' system of selective reviews. The objective is that a significant portion of current expenditure will be examined over the three year period from 2017 to 2019. One of the key objectives for this review is to embed an ongoing evaluation culture across the Public Service, which will consist of efficiency reviews of pre-selected programme areas to
Summer Economic Statement | June 2018 Page | 26
bolster the existing stock of analysis. The rolling three-year nature of the current spending review allows for the build-up of expertise and awareness of the process and allow analysts to revisit key topics if issues are emerging. As a result of the revised approach, this series of analysis can more directly impact on the budgetary discussions that take place as part of the estimates process. Last year’s spending review culminated in the publication of over 20 analytical papers, most alongside the Mid-Year Expenditure Report in July, with the remainder following the completion of Budget 2018 in October. Some significant outcomes resulted from this review, including forming a key part of the estimates negotiations that took place prior to the Budget and in highlighting an additional body of analysis to be carried forward in the Spending Review 2018. For the Spending Review in 2018, one of the key aims is to further encourage greater input of policy departments into the Spending Review and to enhance the role for Irish Government Economic and Evaluation Service (IGEES) staff throughout the Civil Service. The intention is that this work will then promote the use of an analytical approach to evaluating expenditure and should provide the Government with a stronger evidence based approach to allocating resources in the Budget. It is of key importance that expenditure decisions have a strong evidence based backing due to the significant internal and external risks that are evident. There is a requirement for Ireland to ensure the public finances are in a strong position to support sustainable economic growth and to make improvements in the living conditions of citizens. The spending review is a tool that can assist us in allocating Government resources in the most efficient and effective way to achieve these aims. Public Service Reform Reform of the Public Service remains a key priority for this Government. Starting with the first Public Service Reform Plan, published in November 2011, a comprehensive series of reforms have been implemented in recent years. The current framework, Our Public Service 2020 (OPS2020), launched in December 2017, builds on the achievements of the previous reforms and sets a path for improvements beyond 2020. Fiscal adjustment was a key driver of the first Public Service Reform Plan 2011 - 2013, which focused mainly on efficiency and cost containment. While maintaining a focus on efficiency, the second Public Service Reform Plan 2014-2016, had an overarching objective of better outcomes for stakeholders. These two successive plans enabled the maintenance and improvement of public services in the face of a necessary reduction in staff numbers and budgets. The reforms were implemented at a time of increased demand for many essential public services such as welfare payments, medical cards, school places and pensions. OPS2020 focuses on supporting sustainable, continuous progress to build a stronger public service and to deliver better quality services to the Irish public. The framework is designed to promote and support a citizen centric approach to public service delivery. It has been developed with input from the public and from the Public Service and informed by the
Summer Economic Statement | June 2018 Page | 27
recommendations of an assessment of the 2014-16 Reform Plan carried out by the OECD in 2017. The 2017 OECD assessment identified a need for committed senior leadership to ensure that there is firstly, a strategic prioritisation of OPS2020 actions across sectors; and secondly, that momentum is sustained throughout the lifetime of the framework. The assessment further recommended that, in developing strengthened governance arrangements for public service reform, the role of the centre and the sectors needed to be better defined. This has been reflected in the design of OPS2020. The OPS2020 framework is made up of 18 key actions across three pillars. These actions include both new initiatives and actions that expand on and embed reforms already in place. The three pillars are:
Delivering for our public, which includes for example, the continued development of digital services under the Public Service ICT Strategy to deliver improved public services;
Innovating for our future to support and encourage new thinking, innovative solutions and an emphasis on collaborative working; and
Developing our people and organisations to improve strategic human resource management to ensure the right mix of skills and tools are there to support public servants in delivering quality services.
There is an increased focus on achieving real change and outcomes, with a Reform Evaluation Unit being established in the Department of Public Expenditure and Reform to support this. This unit will work collaboratively with stakeholders to identify appropriate indicators to measure the successful implementation of actions in the framework in an effective and proportionate manner for each sector in the public service. A strengthened model of governance is being put in place to oversee implementation of the actions in OPS2020, with responsibility for achieving the actions being shared by leaders across the civil and public service. This notably involves the establishment of a Public Service Leadership Board, to be made up of representative Secretaries General of Government Departments and CEO/equivalent of public service organisations. The intention is to move to a stronger networked governance structure that delegates responsibility and ownership for outcomes to designated owners across the sectors while ensuring continuing strong direction from the centre. In the Civil Service, the new phase of Civil Service Renewal will focus on consolidating and embedding the changes that have been made under the Civil Service Renewal Plan and on aligning with OPS 2020. It will also focus on implementing a refreshed set of actions to improve the Civil Service. In addition to progress in public service reform, the Government continues to pursue a wide ranging reform programme aimed at delivering an open, accountable and ethical Government underpinned by a transparent and effective public system. Delivery of the Public Sector Standards Bill and the Data Sharing and Governance Bill are key priorities. The Department of Public Expenditure and Reform is also leading on Ireland’s Open Data initiative, which is a
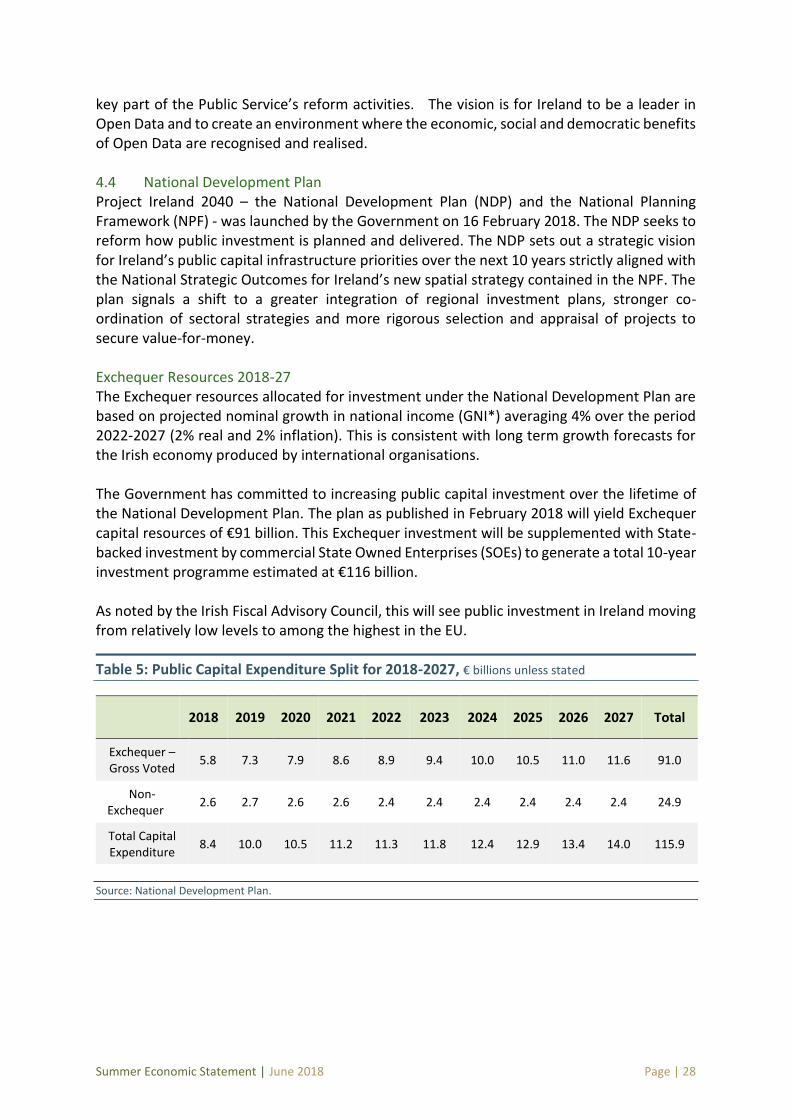
Summer Economic Statement | June 2018 Page | 28
key part of the Public Service’s reform activities. The vision is for Ireland to be a leader in Open Data and to create an environment where the economic, social and democratic benefits of Open Data are recognised and realised.
4.4 National Development Plan Project Ireland 2040 – the National Development Plan (NDP) and the National Planning Framework (NPF) - was launched by the Government on 16 February 2018. The NDP seeks to reform how public investment is planned and delivered. The NDP sets out a strategic vision for Ireland’s public capital infrastructure priorities over the next 10 years strictly aligned with the National Strategic Outcomes for Ireland’s new spatial strategy contained in the NPF. The plan signals a shift to a greater integration of regional investment plans, stronger co-ordination of sectoral strategies and more rigorous selection and appraisal of projects to secure value-for-money.
Exchequer Resources 2018-27 The Exchequer resources allocated for investment under the National Development Plan are based on projected nominal growth in national income (GNI*) averaging 4% over the period 2022-2027 (2% real and 2% inflation). This is consistent with long term growth forecasts for the Irish economy produced by international organisations.
The Government has committed to increasing public capital investment over the lifetime of the National Development Plan. The plan as published in February 2018 will yield Exchequer capital resources of €91 billion. This Exchequer investment will be supplemented with State-backed investment by commercial State Owned Enterprises (SOEs) to generate a total 10-year investment programme estimated at €116 billion.
As noted by the Irish Fiscal Advisory Council, this will see public investment in Ireland moving from relatively low levels to among the highest in the EU.
Table 5: Public Capital Expenditure Split for 2018-2027, € billions unless stated
Source: National Development Plan.
2018 2019 2020 2021 2022 2023 2024 2025 2026 2027 Total
Exchequer – Gross Voted
5.8 7.3 7.9 8.6 8.9 9.4 10.0 10.5 11.0 11.6 91.0
Non-Exchequer
2.6 2.7 2.6 2.6 2.4 2.4 2.4 2.4 2.4 2.4 24.9
Total Capital Expenditure
8.4 10.0 10.5 11.2 11.3 11.8 12.4 12.9 13.4 14.0 115.9
Summer Economic Statement | June 2018 Page | 29
Changes to the Capital Expenditure Framework A new funding model for Exchequer funded public investment has been put in place to ensure that resources are allocated to projects and programmes that support the achievement of the objectives set out in the new National Planning Framework. To this end, the NDP features a number of major new innovations in terms of how public capital investment is allocated by Government:
It takes a long-term (10 year) strategic approach to investment, with funding allocations closely aligned with the 10 National Strategic Outcomes (NSOs) of the NPF.
It provides for a sustained increase in public capital investment as a share of national income, to meet infrastructural needs. These needs were identified in the Review of the Capital Plan 2016-2021 and the Strategic Public Infrastructure: Capacity and Demand Analysis published by the Irish Government Economic and Evaluation Service in 2017. One of the primary purposes of setting out 10 year Exchequer Gross Voted Capital Ceilings and 5 year Departmental ceilings is to provide greater certainty to all those involved in the planning of infrastructure delivery. While economic forecasts may fluctuate, it is envisaged that the ceilings in the NDP will remain relatively constant over the remainder of the plan, subject to the mid-term review of the NDP which is currently due to take place in 2022.
All Departments' capital programmes are now fully funded for a 5-year period covering 2018-2022, which will facilitate Departments in planning their investment programmes over the medium term. These will be rolling 5-year capital ceilings, so for example in Budget 2019 a new fifth year will be included- i.e. 2023.
Longer term key Strategic Investment Priorities identified by Departments are funded beyond this 5 year period, to their completion or to 2027 if funding for more than 10 years is involved e.g. Metro Link and the M20.
Four new Funds have been initiated, with a combined allocation of €4 billion, to be allocated on a competitive basis for projects which meet the criteria of the funds – targeting urban and rural renewal, climate action and ‘disruptive technologies’ respectively.
The addition of a fifth year to the multi-annual ceilings, and the adjustment to the ceilings for 2019- 2021, brings to €38.5 billion the amount of the €91 billion overall Exchequer allocation that has now been committed by Government. The Departmental allocations for 2018 to 2022 are set out in Annex 1 of the National Development Plan. This leaves a further €52.5 billion for the remaining five years of the National Development Plan. This represents a transformation in the volume of resources available for public capital investment compared to the last ten years. Of this €52.5 billion, €45.1 billion is allocated under the NDP for major strategic investment priorities of Government across all of the NSOs in the period 2023 to 2027. This demonstrates the Government’s commitment to the delivery of the Strategic Investment Priorities identified in the NDP. The remaining €7.4 billion has been retained to meet other ongoing capital expenditure requirements over the second half of the period and as a contingency reserve to meet unanticipated funding requirements and/or new emerging priorities that may
Summer Economic Statement | June 2018 Page | 30
arise as the National Development Plan is implemented. This reserve will be allocated through the annual Estimates process, as the rolling five-year multi-annual ceilings are updated. This funding reform was introduced to encourage Departments to develop investment proposals directly targeted at the achievement of NPF priorities and which contribute to the clear articulation of a strategic 10-year vision for Ireland’s public capital infrastructure. The identification of this destination can then guide and inform the design and implementation of their investment spending from 2018 onwards. Implementation of the NDP A high-level Project Ireland 2040 Delivery Board has been established and met for the first time on 1st May 2018. The board is jointly chaired by the Secretaries-General of the Department of Public Expenditure and Reform (DPER) and the Department of Housing, Planning and Local Government (DHPLG) to ensure that there is a strongly co-ordinated and whole of Government approach to NDP and NPF delivery. Initial priorities identified by the Board include:
Updating and further developing the Major Projects Capital Tracker;
Establishing a Construction Sector Group;
The development of a Lands Agency; and,
The implementation of the four funds in the National Development Plan.
4.5 Sustainable Improvements in Public Services and Social Supports The Exchequer pay bill is a key component of overall Government expenditure. When Social Protection expenditure is excluded, it accounts for approximately 50 per cent of gross voted current expenditure. There are two key elements that make up the Exchequer pay bill – the number of public servants employed and the rates at which they are remunerated. Budgetary decisions aimed at enhancing the delivery of public services, and the requirement to meet the need arising from a growing population, lead to increases in the level of public service staffing and this is reflected in the long term trend in public service employment. Given the key role of public servants in the delivery of our public services, it is important that all elements of the pay bill are managed to ensure sustainable levels of growth in numbers with corresponding increases and improvements in services that are supported by workforce planning. The areas of Health, Social Protection and Education combined account for 80 per cent of overall gross voted current expenditure. In addition, these sectors are exposed to demographic pressures that require careful planning and that will impact on expenditure over the coming years. Need to ensure sustainable growth in Exchequer pay bill Since 1997, the number of public servants employed by the State has increased by nearly half from 222,013 FTEs to 317,495 FTEs in 2017. By far the largest increases in staffing over this period have come in the Education (+40,727 FTEs or +64.3 per cent) and Health (42,900 FTEs or +63.2 per cent) sectors. Combined, these two sectors now account for nearly 70 per cent of all public service staffing, a share which has increased from 60 per cent in 1997. This increasing share is also reflected in the recent increase in frontline public service staffing
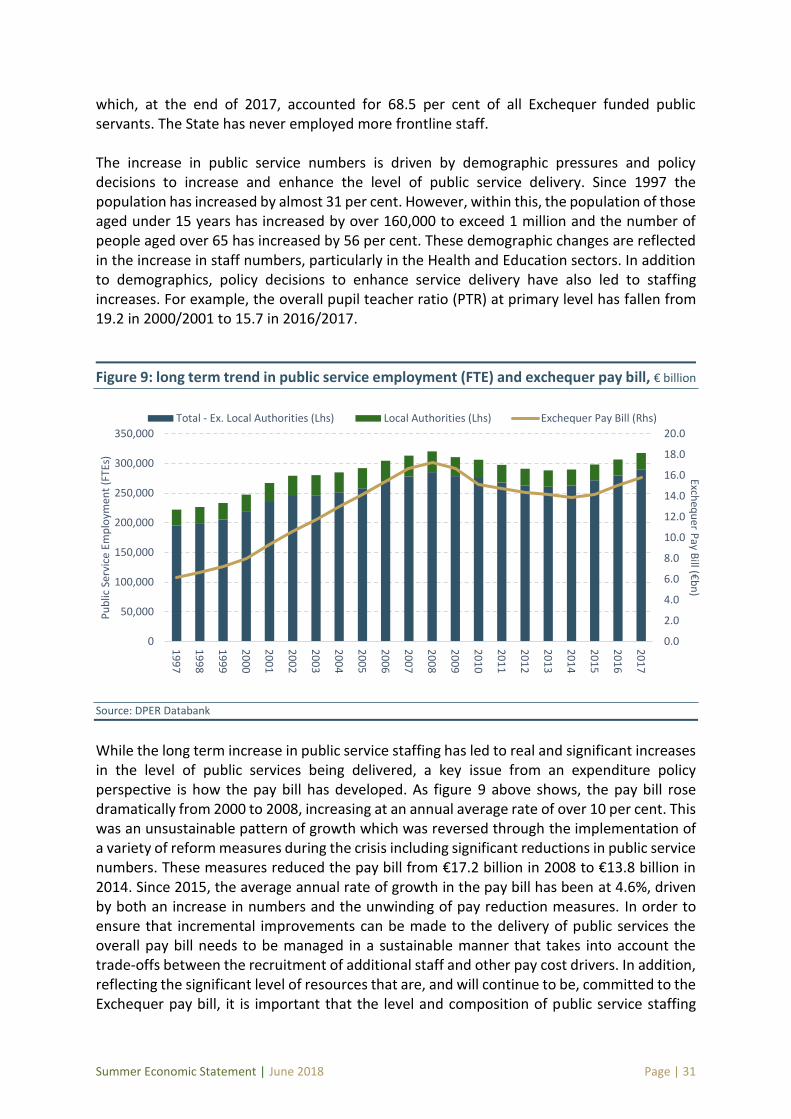
Summer Economic Statement | June 2018 Page | 31
which, at the end of 2017, accounted for 68.5 per cent of all Exchequer funded public servants. The State has never employed more frontline staff. The increase in public service numbers is driven by demographic pressures and policy decisions to increase and enhance the level of public service delivery. Since 1997 the population has increased by almost 31 per cent. However, within this, the population of those aged under 15 years has increased by over 160,000 to exceed 1 million and the number of people aged over 65 has increased by 56 per cent. These demographic changes are reflected in the increase in staff numbers, particularly in the Health and Education sectors. In addition to demographics, policy decisions to enhance service delivery have also led to staffing increases. For example, the overall pupil teacher ratio (PTR) at primary level has fallen from 19.2 in 2000/2001 to 15.7 in 2016/2017.
Figure 9: long term trend in public service employment (FTE) and exchequer pay bill, € billion
Source: DPER Databank
While the long term increase in public service staffing has led to real and significant increases in the level of public services being delivered, a key issue from an expenditure policy perspective is how the pay bill has developed. As figure 9 above shows, the pay bill rose dramatically from 2000 to 2008, increasing at an annual average rate of over 10 per cent. This was an unsustainable pattern of growth which was reversed through the implementation of a variety of reform measures during the crisis including significant reductions in public service numbers. These measures reduced the pay bill from €17.2 billion in 2008 to €13.8 billion in 2014. Since 2015, the average annual rate of growth in the pay bill has been at 4.6%, driven by both an increase in numbers and the unwinding of pay reduction measures. In order to ensure that incremental improvements can be made to the delivery of public services the overall pay bill needs to be managed in a sustainable manner that takes into account the trade-offs between the recruitment of additional staff and other pay cost drivers. In addition, reflecting the significant level of resources that are, and will continue to be, committed to the Exchequer pay bill, it is important that the level and composition of public service staffing
0.0
2.0
4.0
6.0
8.0
10.0
12.0
14.0
16.0
18.0
20.0
0
50,000
100,000
150,000
200,000
250,000
300,000
350,000
19
97
19
98
19
99
20
00
20
01
20
02
20
03
20
04
20
05
20
06
20
07
20
08
20
09
20
10
20
11
20
12
20
13
20
14
20
15
20
16
20
17
Excheq
uer P
ay Bill (€
bn
)P
ub
lic S
ervi
ce E
mp
loym
ent
(FTE
s)
Total - Ex. Local Authorities (Lhs) Local Authorities (Lhs) Exchequer Pay Bill (Rhs)
Summer Economic Statement | June 2018 Page | 32
supports the effective and efficient delivery of public services. A key consideration within this is the need to develop a public service that is outcome focused and can respond to and embrace demographic and technology change. One of the main ways this can be achieved is through embedding workforce planning across the public service with these workforce plans fully aligned to the available resources. Health Health spending amounts to over €15 billion in 2018 and accounts for almost 27 per cent of gross voted current spending. Significant funding has been provided to the healthcare system over the last 20 years. In 1996, Government spending on health was €865 per person but by 2009 this had more than tripled to €3,277. As with total expenditure, per capita spend declined for a period after 2009 but has been growing again since 2013 and will surpass the previous peak in 2018. As health expenditure has increased over the past two decades, Irish health outcomes improved. This is illustrated by the growth in life expectancy that has been witnessed since 1996. That year, Irish life expectancy at birth was 75.9 years, which was around a year and a half less than the average for the rest of the EU15 of 77.3 years. By 2010, however, Irish life expectancy at birth had grown by almost five years to 80.8, and this was virtually the same as the EU15 average of 80.9. The provision of quality healthcare is a key Government priority and this has been reflected in budgetary policy over the last four years, with the Government committing an additional 20 per cent in resources to running the day to day operations of the healthcare system on a like for like basis (this is against 12% growth in overall current expenditure in the same period). Reflecting this increase in the level of resources, since the beginning of 2015 to the end of Q1 2018, health staff numbers have increased by over 12,000 FTEs (12 per cent) to 112,526 FTEs. This growth represents nearly half of the increase in total public service staffing in the same period. Social Protection Expenditure on Employment Affairs and Social Protection, at €20 billion, accounts for 36% of total gross voted current expenditure in 2018. In 1998, expenditure in this area amounted to €6 billion. This growth in expenditure is driven by real increases in rates for benefits and substantial increases in recipients. During the 10 year period leading up to the economic and fiscal crisis there was significant growth in rates for weekly pension, disability and unemployment income supports that were well above the increase on the Consumer Price Index (CPI). Further to this, following an increase in the State Pension rate in Budget 2009, this payment was protected from reductions during the period of consolidation. Following reductions in earlier years, all other core weekly rates, including Jobseekers and Disability payments, were maintained in the period 2012 to 2015. Since this point, improvements in incomes have resumed in, with the weekly pension rate increasing by €3 in 2016 followed by a €5 increase in all weekly rates in 2017 and 2018. Taking the period 1997 to 2016, the largest increase in recipients has been in relation to older people, with an increase of over 300,000 or 180% in the number of weekly pension payments. In 2018, €7.6 billion or 38 per cent, of total Social Protection expenditure is allocated to
Summer Economic Statement | June 2018 Page | 33
pensions reflecting the demographic pressures in this area. Between 2017 and 2020, an average increase of approximately 21,000 additional pension recipients per annum is projected. While changes to the eligible pension age in 2021, discussed below, will mean a reduction in the number of people becoming eligible in 2021 and 2022, between 2023 and 2027 the trend is expected to turn positive again, with an average annual increase in pension recipients of 23,000. This trend reflects an ageing population, with an increasing proportion of adults within the eligible age band. Challenge of State Pensions In order to address the issue of affordability of the State Pension, the age of eligibility was raised from 65 to 66 in 2014, and is set to raise to 67 in 2021 and then 68 in 2028. The recently published “Roadmap for Pension Reform 2018-2023” includes a commitment that from 2035 onwards changes in the age of eligibility will be linked to changes in life expectancy. The “Roadmap” also includes a key reform with the proposed introduction of the ‘Total Contributions Approach’ (TCA) for the State Pension (Contributory) from 2020. The TCA is seen as a fairer and more transparent system, whereby the benefit received will be more directly linked to the contributions that have been made. The TCA can be seen as a more sustainable system, as it will more directly reward people for working, and offers a clearer path to adequate pension income for those who wish to increase their entitlements. The Department of Employment Affairs and Social Protection will shortly publish a design proposal for public consultation and it is intended that the TCA design will be finalised by Q4 this year for enactment in 2019, taking effect from 2020. The “Roadmap” is clear that the proposals with regard to changes to pension structures and payment rates cannot proceed unless they are balanced by changes to the funding of the pension system. Accordingly, the plan indicates that the Government will consider the establishment of a transparent actuarial basis for the setting of Social Insurance contribution rates and commits the Government to publish a consultation paper in late 2018 on an appropriate approach to funding the social insurance system. The plan also includes a commitment to examine proposals to set a formal benchmark of 34% of average earnings for State pension payments. Education Expenditure on Education amounts to over €10 billion in 2018, and represents the third largest element of government spending, with this sector accounting for almost 17 per cent of gross voted current expenditure. The scale and composition of expenditure on Education and Skills has changed over time due to a variety of factors including demographics, increases in special needs education expenditure, the need for capital investment and skills development. Gross current expenditure on education increased by approximately €1 billion between 2014 and 2018 with the prioritisation of first and second level provision, which accounted for the majority of the increase. There are a number of challenges facing the Education sector over the short and long term, including the shift of demographic pressures from primary level to second level, increasing
Summer Economic Statement | June 2018 Page | 34
demand in the third level sector and other structural challenges. Demographics for primary school are expected to peak in 2018 when the pressures shift to second level which is projected to peak in 2025. As the demographic needs shift, there will be a need to reprioritise existing resources towards second level which will require careful workforce planning for the entire sector. An important recent development in addressing the future funding needs of the Higher Education sector was the Budget 2018 measure to increase the rate of the National Training Fund levy by 0.1 per cent in 2018 to 0.8 per cent, which provided c. €47.5m in additional investment for higher education and further education and training this year. Further increases to bring the levy up to a rate of 1.0 per cent by 2020 will also be considered subject to the reform of the Fund, with an independent review of the Fund to be finalised in mid-2018 informing this process. Expected increase in student numbers will further drive the need for capital investment in the Irish education system, specifically at third level. This is reflected within the resource allocations set out in the NDP for the Higher/Further Education Sectors. Within the FET sector, the medium-term priority is to secure the consolidation of FET provision in modern fit for purpose facilities, and for expansion, upgrade and renewal of facilities and equipment. Two priorities are envisaged for the higher education sector. The first priority envisages a significant increase in the funding available to support refurbishment, maintenance and equipment renewal across the higher education system. The second priority is the establishment of a clearly prioritised Exchequer-supported higher education building programme.
4.6 Summary The Budgetary strategy outlined in Chapter 1 would allow for prudent increases in public expenditure. The adoption of this approach is targeted at ensuring that fiscal policy supports sustainable improvements in public services and social supports while avoiding the unsustainable increases in expenditure that were experienced in the run up to the crisis. Notwithstanding the need for a sustainable and incremental approach, there are many expenditure funding requirements in the medium term, these include:
Meeting demographic related costs in particular in Health, Education and Social Protection; and
Funding the National Development Plan to ensure that the necessary infrastructure is in place to support economic and social objectives.
The allocation of resources to these areas will require that there is an ongoing focus on ensuring the delivery of effective and efficient public services. The budgetary reforms, including the spending review process, will facilitate this through the consistent evaluation of existing expenditure commitments, thus, helping to identify areas of existing expenditure that could be spent more efficiently and have greater benefit to citizens. Ensuring that the number of public servants employed by the State is appropriate to ensure effective service delivery, and also affordable, requires an approach that is compatible with the economic conditions of the State, national competitiveness and available revenues over
Summer Economic Statement | June 2018 Page | 35
the medium-term. Further embedding public service reform and workforce planning across the public service will support this approach. The overall budgetary strategy is designed to support sustainable growth in expenditure that will allow Departments to plan service improvements and investments over the medium term.
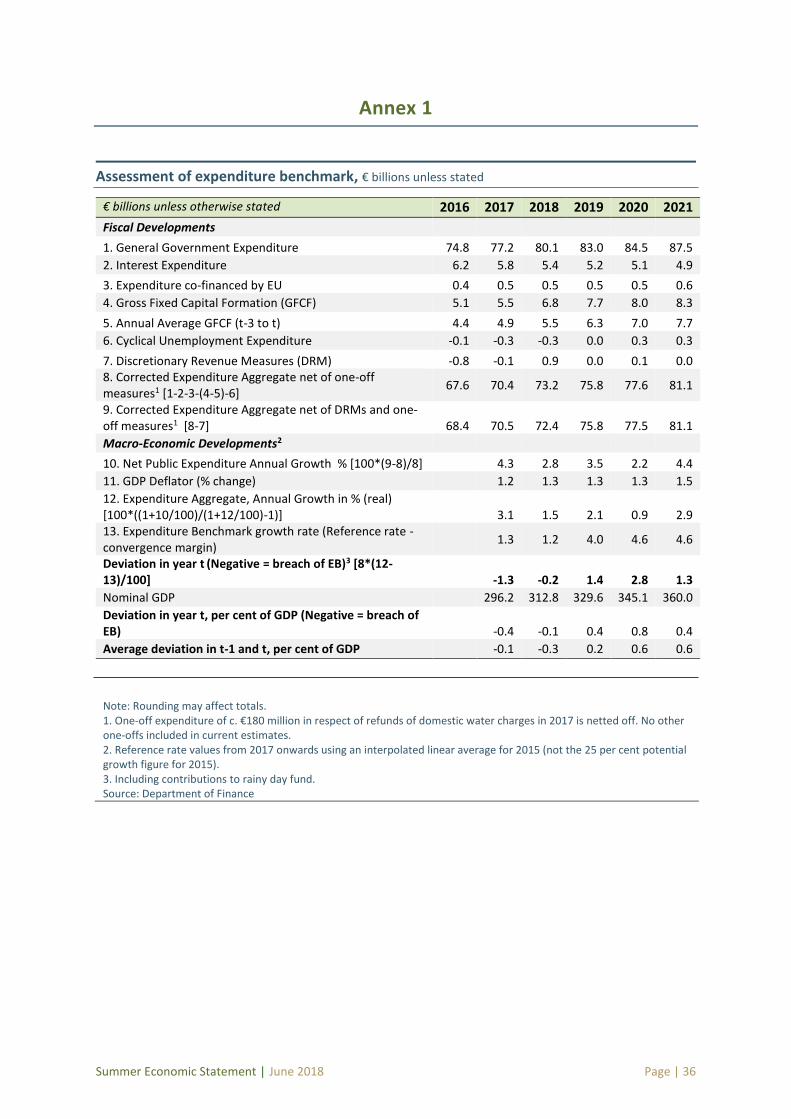
Summer Economic Statement | June 2018 Page | 36
Annex 1
Assessment of expenditure benchmark, € billions unless stated
€ billions unless otherwise stated 2016 2017 2018 2019 2020 2021
Fiscal Developments
1. General Government Expenditure 74.8 77.2 80.1 83.0 84.5 87.5
2. Interest Expenditure 6.2 5.8 5.4 5.2 5.1 4.9
3. Expenditure co-financed by EU 0.4 0.5 0.5 0.5 0.5 0.6
4. Gross Fixed Capital Formation (GFCF) 5.1 5.5 6.8 7.7 8.0 8.3
5. Annual Average GFCF (t-3 to t) 4.4 4.9 5.5 6.3 7.0 7.7
6. Cyclical Unemployment Expenditure -0.1 -0.3 -0.3 0.0 0.3 0.3
7. Discretionary Revenue Measures (DRM) -0.8 -0.1 0.9 0.0 0.1 0.0 8. Corrected Expenditure Aggregate net of one-off measures1 [1-2-3-(4-5)-6]
67.6 70.4 73.2 75.8 77.6 81.1
9. Corrected Expenditure Aggregate net of DRMs and one-off measures1 [8-7] 68.4 70.5 72.4 75.8 77.5 81.1
Macro-Economic Developments2
10. Net Public Expenditure Annual Growth % [100*(9-8)/8] 4.3 2.8 3.5 2.2 4.4
11. GDP Deflator (% change) 1.2 1.3 1.3 1.3 1.5
12. Expenditure Aggregate, Annual Growth in % (real) [100*((1+10/100)/(1+12/100)-1)] 3.1 1.5 2.1 0.9 2.9 13. Expenditure Benchmark growth rate (Reference rate - convergence margin)
1.3 1.2 4.0 4.6 4.6
Deviation in year t (Negative = breach of EB)3 [8*(12-13)/100] -1.3 -0.2 1.4 2.8 1.3
Nominal GDP 296.2 312.8 329.6 345.1 360.0
Deviation in year t, per cent of GDP (Negative = breach of EB) -0.4 -0.1 0.4 0.8 0.4
Average deviation in t-1 and t, per cent of GDP -0.1 -0.3 0.2 0.6 0.6
Note: Rounding may affect totals. 1. One-off expenditure of c. €180 million in respect of refunds of domestic water charges in 2017 is netted off. No other one-offs included in current estimates. 2. Reference rate values from 2017 onwards using an interpolated linear average for 2015 (not the 25 per cent potential growth figure for 2015). 3. Including contributions to rainy day fund. Source: Department of Finance
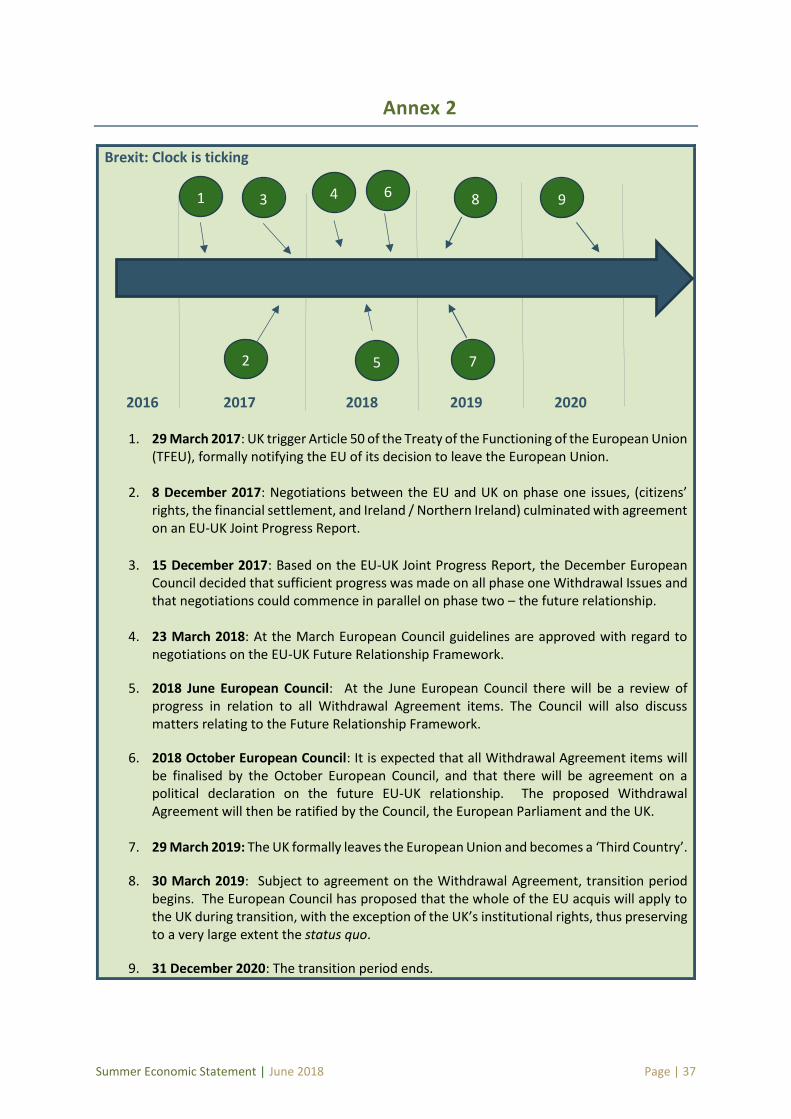
Summer Economic Statement | June 2018 Page | 37
Annex 2
Brexit: Clock is ticking
2016 2017 2018 2019 2020
1. 29 March 2017: UK trigger Article 50 of the Treaty of the Functioning of the European Union (TFEU), formally notifying the EU of its decision to leave the European Union.
2. 8 December 2017: Negotiations between the EU and UK on phase one issues, (citizens’
rights, the financial settlement, and Ireland / Northern Ireland) culminated with agreement on an EU-UK Joint Progress Report.
3. 15 December 2017: Based on the EU-UK Joint Progress Report, the December European Council decided that sufficient progress was made on all phase one Withdrawal Issues and that negotiations could commence in parallel on phase two – the future relationship.
4. 23 March 2018: At the March European Council guidelines are approved with regard to
negotiations on the EU-UK Future Relationship Framework.
5. 2018 June European Council: At the June European Council there will be a review of progress in relation to all Withdrawal Agreement items. The Council will also discuss matters relating to the Future Relationship Framework.
6. 2018 October European Council: It is expected that all Withdrawal Agreement items will be finalised by the October European Council, and that there will be agreement on a political declaration on the future EU-UK relationship. The proposed Withdrawal Agreement will then be ratified by the Council, the European Parliament and the UK.
7. 29 March 2019: The UK formally leaves the European Union and becomes a ‘Third Country’.
8. 30 March 2019: Subject to agreement on the Withdrawal Agreement, transition period begins. The European Council has proposed that the whole of the EU acquis will apply to the UK during transition, with the exception of the UK’s institutional rights, thus preserving to a very large extent the status quo.
9. 31 December 2020: The transition period ends.
1
2
3 4
5
6
7
9 8
Summer Economic Statement | June 2018 Page | 38