Embed Size (px)
Citation preview

Summary Report Submitted for HCS Approach Peer Review Process
HCS Study Project Title:
HCS Identification in PT Karya Makmur Abadi
Company/Organisation:
PT Karya Makmur Abadi
Contact person:
Stephen Tiong Mee Ing
Date:
September 2017

Contents 1. Project description ................................................................................................................... 4
1.1 Location and size of study area ............................................................................................... 4
1.2 Overview of proposed plantation development .................................................................... 5
1.3 Description of surrounding landscape .................................................................................... 7
1.4 Map of the site within the region ......................................................................................... 10
1.5 Relevant data sets available.................................................................................................. 10
1.6 List of any reports/assessments used in the HCS assessment .............................................. 11
2. HCS assessment team and timeline ......................................................................................... 11
2.1 Names and qualifications ...................................................................................................... 11
2.2 Time period for major steps in the study ............................................................................. 11
3. Community engagement/ FPIC ............................................................................................... 12
3.1 Summary of community engagement, FPIC, participatory mapping .................................... 12
3.2 Summary of Social Impact Assessment (if any) .................................................................... 14
3.4 Details of meetings held and findings ................................................................................... 15
4. High Conservation Value assessment ...................................................................................... 16
4.1 Summary and link to public summary report ....................................................................... 16
5. Environmental Impact Assessment ......................................................................................... 20
5.1 Summary ............................................................................................................................... 20
6. Land cover image analysis ...................................................................................................... 21
6.1 Area of Interest and how it was defined .............................................................................. 21
6.2 Description of images used for classification ........................................................................ 22
6.3 Sample image ........................................................................................................................ 23
6.4 Method of stratification and software used ......................................................................... 26
6.5 Map of initial vegetation classes, with legend ...................................................................... 26
6.6 Table of total hectares per vegetation class ......................................................................... 27
6.7 Summary of which areas are potential HCS forest, subject to further analysis ................... 27
7. Forest inventory results .......................................................................................................... 27
7.1 Inventory sample design and plot rational ........................................................................... 28
7.3 Forest inventory team members and roles .......................................................................... 29
7.4 Methodology used for forest sampling ................................................................................ 29
7.5 Methodology used for carbon calculations .......................................................................... 30
7.6 Indicative photos of each vegetation class ........................................................................... 30
7.7 Statistical analysis (allometric used, confidence tests, justification) .................................... 32
7.8 Summary of statistical analysis of carbon stock results per vegetation class ...................... 32
7.9 Forest inventory results ........................................................................................................ 32
8. Land Cover Classification ........................................................................................................ 33
8.1 Refined land cover map with title, date, legend and any HCS forest patches identified ..... 33
9. Patch Analysis Result .............................................................................................................. 34
9.1 Results of Decision Tree ........................................................................................................ 34
9.2 Comments on Decision Tree outcome .................................................................................. 34
10. Indicative Land Use Plan ....................................................................................................... 34
10.1 Summary of results of final ground verification (if any) ....................................................... 34
10.2 Final HCS map ....................................................................................................................... 35
10.3 Overview of forest conservation management and monitoring activities to be included in
the Conservation and Development (land use) Plan ........................................................................ 36
10.4 List of activities still to be carried out before Conservation and Development Plan can be
finalised ............................................................................................................................................. 36

1. Project description
1.1 Location and size of study area High carbon stock approach study was carried out in the Permitted Area of PT Karya Makmur Abadi (herein after will be referred to as PT KMA), located in two Districts (Kecamatan) namely Bukit Santuai District and Mentaya Hulu District, Kotawaringin Timur Regency, Central Kalimantan Province (Figure 1). Geographically, the concession is located at 2038’02.06”- 2042’28.63” South Latitude and East Longitude 110055’39.12”- 111003’57.39”. PT KMA obtain it’s permitted area (Izin Lokasi) in 2013 according to the Provision of The Kotawaringin Timur Regent (Bupati) No. 118.45/359/Huk-BPN/2013. The size of the permitted area, according to the legal document, is 13,148.0 ha. There is a 233.3 ha difference between the size of the permitted area according the legal document and the available shapefile used in this study. The size of the permitted area (will be referred to as concession) according to the GIS analysis is 13,380.3 ha. Management of the concession is divided into three divisions, namely, North KMA Division, Central KMA Division and South KMA Division. The size of the area of each division is 4,042.9 ha (30.2 %), 4,849.6 ha (36.2 %) and 4,487.9 ha (33.5 %), respectively. There are ten settlements located along the Kuayan and Mentaya Rivers at the East Side from the PT KMA Concession. However, only seven of them were identified as the related communities to the land within the PT KMA Concession, based on the land tenure study.The relation between the communities and the concession can be classified as shown in the following table:
Table 1. Relation between communities and the land within PT KMA concession
No Village Name PT KMA Division Area
1 Tumbang Kaminting North KMA
2 Tumbang Tilap
3 Tumbang Sapiri Central KMA
4 Pemantang
5 Pahirangan
South KMA 6 Tangka Robah
7 Kapuk
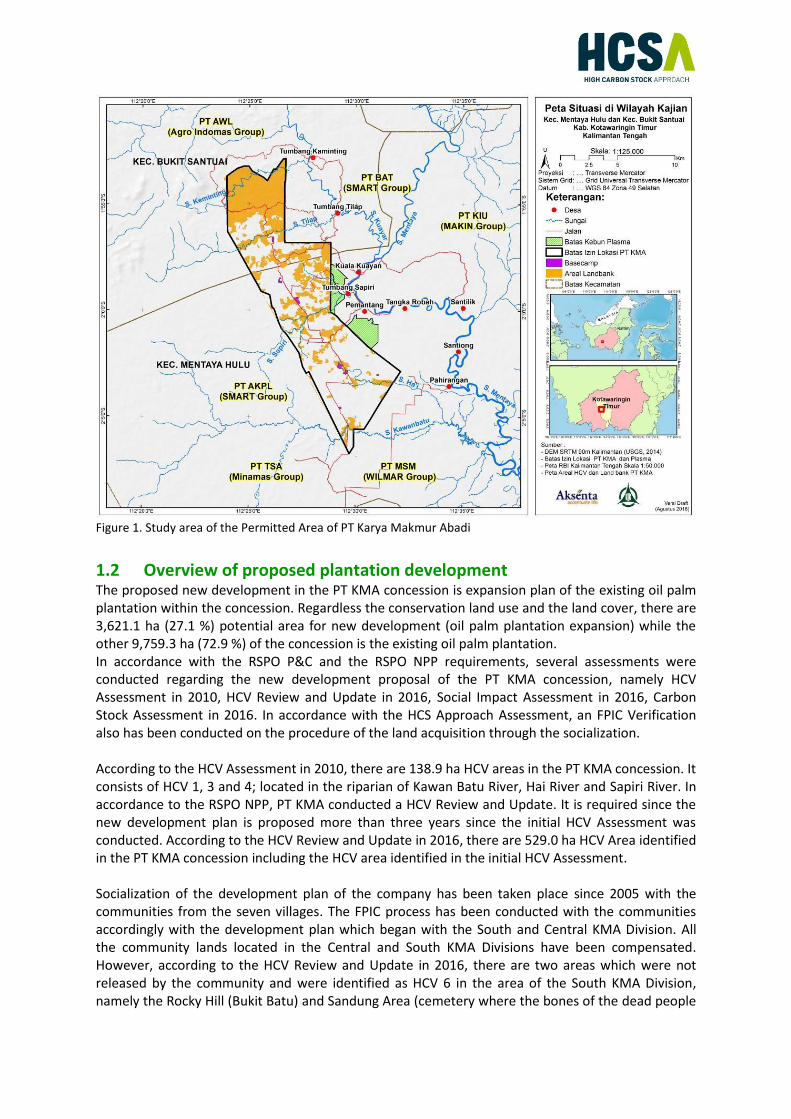
Figure 1. Study area of the Permitted Area of PT Karya Makmur Abadi
1.2 Overview of proposed plantation development The proposed new development in the PT KMA concession is expansion plan of the existing oil palm plantation within the concession. Regardless the conservation land use and the land cover, there are 3,621.1 ha (27.1 %) potential area for new development (oil palm plantation expansion) while the other 9,759.3 ha (72.9 %) of the concession is the existing oil palm plantation. In accordance with the RSPO P&C and the RSPO NPP requirements, several assessments were conducted regarding the new development proposal of the PT KMA concession, namely HCV Assessment in 2010, HCV Review and Update in 2016, Social Impact Assessment in 2016, Carbon Stock Assessment in 2016. In accordance with the HCS Approach Assessment, an FPIC Verification also has been conducted on the procedure of the land acquisition through the socialization. According to the HCV Assessment in 2010, there are 138.9 ha HCV areas in the PT KMA concession. It consists of HCV 1, 3 and 4; located in the riparian of Kawan Batu River, Hai River and Sapiri River. In accordance to the RSPO NPP, PT KMA conducted a HCV Review and Update. It is required since the new development plan is proposed more than three years since the initial HCV Assessment was conducted. According to the HCV Review and Update in 2016, there are 529.0 ha HCV Area identified in the PT KMA concession including the HCV area identified in the initial HCV Assessment. Socialization of the development plan of the company has been taken place since 2005 with the communities from the seven villages. The FPIC process has been conducted with the communities accordingly with the development plan which began with the South and Central KMA Division. All the community lands located in the Central and South KMA Divisions have been compensated. However, according to the HCV Review and Update in 2016, there are two areas which were not released by the community and were identified as HCV 6 in the area of the South KMA Division, namely the Rocky Hill (Bukit Batu) and Sandung Area (cemetery where the bones of the dead people

were kept) at the area of Kawan Batu River. Whereas, the FPIC process has not been completed regarding the communities’ land in the North KMA Division. The communities have been informed about the development plan and are willing to give their consent on their land to the company’s proposal. However, there is an area which the communities decide not to give their consent in the North KMA Division, namely the Sacred House (Rumah Keramat) which is also identified as HCV 6 according to the HCV Review and Update in 2016.
Figure 2. Map showing proposed plantation development in PT KMA Concession
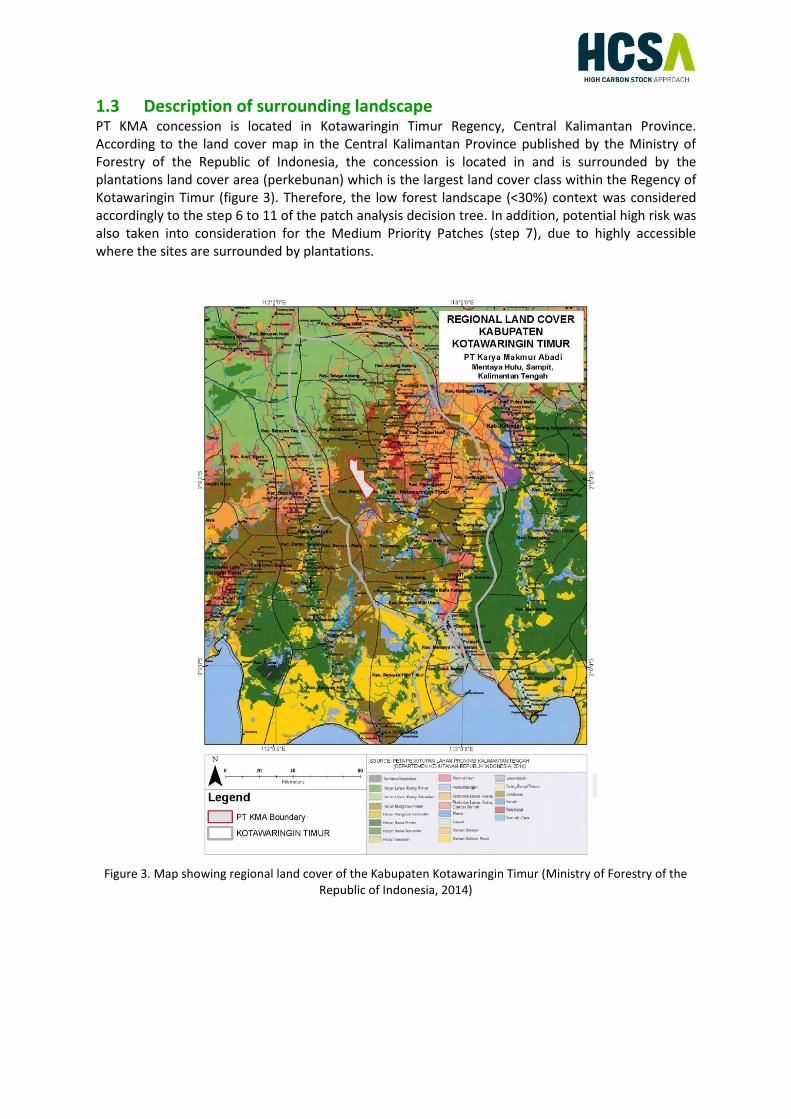
1.3 Description of surrounding landscape PT KMA concession is located in Kotawaringin Timur Regency, Central Kalimantan Province. According to the land cover map in the Central Kalimantan Province published by the Ministry of Forestry of the Republic of Indonesia, the concession is located in and is surrounded by the plantations land cover area (perkebunan) which is the largest land cover class within the Regency of Kotawaringin Timur (figure 3). Therefore, the low forest landscape (<30%) context was considered accordingly to the step 6 to 11 of the patch analysis decision tree. In addition, potential high risk was also taken into consideration for the Medium Priority Patches (step 7), due to highly accessible where the sites are surrounded by plantations.
Figure 3. Map showing regional land cover of the Kabupaten Kotawaringin Timur (Ministry of Forestry of the
Republic of Indonesia, 2014)

The nearest protected areas (Hutan Lindung) with the PT KMA concession is located in a larger patch of Hutan Lahan Kering Sekunder in the northern part of the Kotawaringin Timur Regency (figure 4). This protected forest areas are located approximately 50 km from the PT KMA concession. In the context of the regional landscape forest, according to the land cover condition, there is no presence of forested area connecting the PT KMA concession to the protected areas.
Figure 4. Map showing protected areas in the Kabupaten Kotawaringin Timur Region (Ministry of Forestry of
the Republic of Indonesia, 2015)

In the smaller scope (figure 5), with high-resolution imagery and ground checking, most of the surrounding area of the PT KMA concession is covered by oil palm. However, forest corridors connecting forested areas within the concession and outside the concession were identified. The forest patch in the riparian of Kaminting River located in the northern part of the PT KMA concession is connecting the riparian forest of Kuayan River located at the North East from the PT KMA concession and the forested area at the North West from the PT KMA concession (yellow mark in Figure 5). In addition, the riparian forest of the Tilap River is connected with the forested area at the West side from the PT KMA concession (purple mark in Figure 5).
Figure 5. High resolution satellite imagery of the PT KMA Concession (Google earth satellite imagery, 2015)

1.4 Map of the site within the region
Figure 6. Map showing PT KMA concession within the region
1.5 Relevant data sets available Relevant data sets used in the assessment are:
• Carbon stock (Carbon Stock Assessment)
• Community consent (FPIC Verification)
• Satellite imageries
• HCV area (HCV Assessment)
• Social impact information (Social Impact Assessment)

1.6 List of any reports/assessments used in the HCS assessment • HCS Identification Report
• Carbon Stock Assessment Report
• HCV Review and Update Report
• Social Impact Assessment Report
• FPIC Verification Report
2. HCS assessment team and timeline 2.1 Names and qualifications High Carbon Stock Identification was conducted by three experts specializing in HCS Approach Practice, Carbon Stock Estimation, FPIC, Social Studies, and HCV. Table 2. Team conducting the HCS Assessment
Name Relevant Expertise
Bias Berlio Pradyatma Forestry, biodiversity conservation, GIS, remote sensing, carbon stock estimation, HCS Approach Practice (Team leader)
Afwan Afwandi Community Forestry, Social Impact Assessment, Social Survey, Community Socio-economic, FPIC, Participatory Mapping
2.2 Time period for major steps in the study Table 3. Relevant studies for HCS Identification
Assessment Timeline (Field Visit-Reporting) Assessor
High Conservation Value Assessment 2010 Jump Consulting
High Conservation Value Review and Update*
November, 2016-January, 2017 Aksenta Led by: Iwan Setiawan (ALS15039IS)
Social Impact Assessment November, 2016-January, 2017 Aksenta
Carbon Stock Assessment June-August, 2016 Aksenta
FPIC Verification June-August, 2016 Aksenta
HCS Identification June, 2016-January, 2017 Aksenta
According to the RSPO New Planting Procedure (2015), HCV review and update is required when the HCV assessment is older than three years at the time of NPP Submission.

3. Community engagement/ FPIC 3.1 Summary of community engagement, FPIC, participatory mapping Communities related to the company’s proposal were engaged by Aksenta as an independent assessor to verify the compliance of the agreement making with the FPIC principles. It is acknowledged that most of the land in the concession has been compensated and developed. However, verifications were also carried out in the process of land acquisition related to the new development plan as well. In order to verify the overall process of the land acquisition, two activities were undertaken, which are the examination on the land acquisition procedures toward the FPIC principles and verification on the actual land acquisition process towards the procedures and FPIC principles. Verifications were conducted through the documents checking and interviews with the communities. “Free, Prior and Informed Consent Guide for RSPO Members (2015) and HCS Approach Toolkit (2015) were used as the reference in the verification process. Three documents were checked to verify the compliance of the company’s land acquisition procedures towards the FPIC principles, namely, “The Standard Operating Procedures in Land Dispute Countermeasure” (SOP PT KMA No. 26), “The Standard Operating Procedures in Land Acquisition” (SOP PT KMA No. 27) and examples of “The Land Compensation Documents”. The Standard Operating Procedures (herein after will be referred to as SOP) consist of detailed list and flowchart of actions to be taken for each subject, whereas the land compensation document contains information of the land owner identity, the location and the size of the land (with coordinates and map), the foregoing utilization on the land, the agreements and the receipts of the compensation. The land dispute countermeasure SOP were designed to address the situation of building agreements regarding stakeholder’s consent on their land and when a concerned party filed an objection against agreements agreed upon. Discussion with the concerned parties will be taken in the first place to address the problem and involvement of independent surveyor will be taken as well if the necessity is considered. Furthermore, negotiation to obtain agreement will be taken when the information gathered regarding the objection from the three sides of the parties are sufficient. It is mentioned that agreement should be reached with free, prior and informed consent basis and the parties should attend the on field participatory mapping and demarcation when agreement is obtained. The information of the land location and size would be needed for the further process if the concerned party give their consent or withhold their consent for the company’s proposal as well. Otherwise, if the negotiation failed to develop agreement and the information gathered are not sufficient to support the objection, the company will propose involvement of the government, specifically the Department of Agrarian under the National Land Agency of the Republic of Indonesia, de jure procedures will be taken thenceforth and the concerned party are free to choose their representative for this process. However, negotiation will still be acceptable for the company when the concerned party choose to. Sufficient time will be given for the concerned party to make up consent regarding the process. The land acquisition SOP were designed to address overall process including the preliminary survey regarding the status of the land and land tenure, engagement with the community including initial socialization to the agreement and application of the development proposal to the government. The activities relevant with FPIC context in this SOP is the company must engage the communities related to the proposed area for the development plan and identify the community land ownership. Furthermore, the company must organize meetings with stakeholders including the communities to

socialize and obtain recommendations on the proposal. The further process of land acquisition regarding the community’s ownership is referred to the land dispute countermeasure SOP. Once the agreement between company and the land owner is reached, both parties will document the agreement and proceed with the compensation process. The land compensation document contains the agreements and information regarding the land and the owner as mentioned above. It includes the coordinates of the land to define the size and the location. In context of the FPIC verification, according to the interviews with the communities which their lands have been compensated and developed, they acknowledged that they have been informed about the development plan of the company before, it includes the information that the development must follows certain regulations regarding the RSPO certification schemes, compliance to the legal aspect and the impacts of the development to the communities. The community were given time to consider their consent. According to the interview with the communities, the process of socialization and negotiation to obtain agreement took approximately three years. The communities acknowledged that the time period of socialization and negotiation was sufficient for them to decide their consent and it also covers the chance for them to negotiate to obtain the agreed compensation for their lands. According to the interview with the communities which their land is still under the development plan, the communities gave positive response for the company’s proposal on their land. They have been informed that the development must be halt due to certain regulations that must be fulfilled by the company and the potential impact from the development to the communities. However, they are waiting and willing to give their consent for the proposal since they acknowledged that the development would bring them the improvement on their livelihoods. In addition, most of the communities currently are working as workers in oil palm companies around their villages. The communities have started leaving the traditional land utilization such as hunting and shifting land cultivation since 1950’s. They shifted their livelihoods to conventional gold mining after 1950’s and then to log productions since 1971 to 2000. In 1998, the first oil palm company began its operation in this area. According to the information from the communities, traditional shifting cultivation have been totally left in 2010 and replaced with settled field/farm because of the land fire prohibition. Land clearing with fire is the most efficient way that hereditary done by the communities in their traditional shifting cultivation. Limited source of the community to replace fire to clear land to open new field brought the communities to leave their shifting cultivation. Hence, in order to maintain and gain their livelihoods, the communities gave their consent on their lands to company’s proposal for development beside working in the oil palm companies in that area, working in government agencies and doing grocery business. The communities also acknowledged that they have left their fields since they job opportunities are offered. Make living by working brought them better livelihood, especially since their rubber field is no longer profitable because of the declining price. Legally certified land ownership was not found in the study area. The existing community land ownership was formed by the traditional land cultivation in the past. Land owned by a person expands as the shifting cultivation goes on. The land ownership is not pass off when the owner has their seasonal crops harvested and move to another area to open new field, instead, the ownership still occur. Presence of rubber and fruit trees and/or field hut indicates that a land is owned and have been cultivated by someone.

Most of the cultivated lands are located along the river. According to the interview, the community shifting cultivation is done in the range of 100-150 meter from the river. River was the main transportation means in that time. River was still used as the main transportation when the conventional gold mining occurred in this area. The use of river as main transportation started to decline when log production taken place and roads were built and expanded in that area. The communities acknowledged that using road access is more efficient in cost and time as compared to river. All of the villages are located along the river at the East side of the concession. The land ownership based on the villages the land owner lives can be classified according to the company’s management unit. According to the company’s management unit location, following are the locations of communities’ land of each village (Table 3).
Table 4. Community relation to the land within the PT KMA operational division
No Village Management Area of PT KMA
1 Tumbang Kaminting North KMA
2 Tumbang Tilap
3 Tumbang Sapiri Central KMA
4 Pemantang
5 Pahirangan
South KMA 6 Tangka Robah
7 Kapuk
3.2 Summary of Social Impact Assessment (if any) There are ten villages located around PT KMA concession, namely Kuala Kuayan, Tumbang Sapiri, Pemantang, Tangka Robah, Santilik, Sationg, Pahirangan, Kapuk, Tumbang Tilap and Tumbang Kaminting. Though land ownership were not identified from the communities of all ten villages, the location of the ten villages are relatively near to the concession, along the rivers that the upstream are passing through the concession. Therefore, the social impact assessment covers all ten villages as the scope of the study. In accordance with the condition, the potential impact from the existing plantation operation and the new development plan are divided into two types of impact, namely the social impacts and the environmental impact for the communities. However, this section will explain the social impacts while the environmental impact will be explained in section 5. Status of the operations in PT KMA concession can be divided into two different status, namely the existing oil palm plantation which is located in the Central KMA Division and South KMA Division and the proposed development plan which is located in the North KMA Division. The social impact studies identified different conditions of the communities and the potential impacts as well, in which area/division the communities are related to. Accordingly, with the situation of the new development in North KMA Division, following are the important points:
- The community from Tumbang Tilap and Tumbang Kaminting villages are waiting for the development, since they are related to the area of North KMA where the new development is proposed.
- New development plantation will contribute to the communities’ financial capital from the job opportunity, especially for Tumbang Tilap and Tumbang Kaminting communities.

- Potential social conflicts regarding the negotiation and land compensation should be addressed. The company should preserve the transparency and fairness through the whole process.
- Potential social conflicts regarding the workers requirements and quota in the recruitments should be addressed.
- Asset loss from the monetary land compensation is also a significant potential risk to the communities if their financial management is not proper.
Accordingly, with the other communities related to the existing oil palm plantation, following are the important points:
- The communities have welcomed the presence of PT KMA in their area. - The communities acknowledged that the operations of PT KMA have contribution in gaining
their livelihoods especially through the partnership plantation (plasma), job opportunity and CSR. However, the three programs could also bring in potential social conflicts through social discrepancy. The company have to maintain the fairness and the system in implementing the CSR and workers recruitment.
- Conflicts between workers are also a potential risk to be addressed since the workers come from different background with different ethnics.
3.4 Details of meetings held and findings Interviews, Focused group discussions and field visits were held with the staff of PT KMA as internal potential impact receiver, the local communities around PT KMA and the local government (Kepala Desa, Lurah dan Camat) (Table 5).
Table 5. Details of meetings held
Date Description
Wednesday, 23-08-2016
• Discussion with PT KMA field management
• Field visit with staff of PT KMA and local communities
Thursday, 24-08-2016
• Meeting and field visit with representatives of the community of Desa Tumbang Tilap
• Meeting and field visit with representatives of the community of Desa Tumbang Keminting
• Meeting with staff of PT KMA
Friday, 25-08-2016
• Meeting with local government of Kecamatan Mentaya Hulu
• Meeting and field visit with representatives of the community of Desa Tumbang Sapiri
Saturday, 2-08-2016
• Meeting with local government and representatives of the community of Desa Pahirangan and Desa Kapuk
• Meeting with local government and representatives of the community of Desa Tangka Robah and Desa Pemantang
• Meeting with local government of Kelurahan Kuala Kuayan and representatives of the community of Desa Santilik
Sunday, 27-08-2016
• Field visit and meeting with staff of PT KMA

4. High Conservation Value assessment
4.1 Summary and link to public summary report HCV assessment in PT KMA concession was conducted in 2010 by Jump Consulting. According to the new development plan (oil palm plantation expansion) in the concession in 2016, HCV Review and Update was carried out and conducted by Aksenta. HCV Review and Update is a requirement from RSPO NPP to make sure that the new development does not eliminate new potential HCV area and to review the existing HCV area and to update if the necessity is considered. The HCV Review and Update report will be submitted as part of the RSPO NPP requirements.
The initial HCV Assessment was using the “Panduan Identifikasi Kawasan Bernilai Konservasi Tinggi di Indonesia” published by the Consortium of the Indonesia HCV Toolkit Revision in 2008. Several differences were found between the toolkit used in this assessment and the Common Guidance for the Identification of HCV published by HCVRN in 2013. However, HCV Review and Update according to the RSPO NPP requirement have been conducted as well to guarantee the new development plan will not cause any threat and/or eliminate potential new HCV area.
The initial HCV Assessment identified 136.68 ha of HCV area, consists of HCV 1.2, HCV 1.3, HCV 3, HCV 4.1 and HCV 4.2. According to the report, each types of the identified HCV represents presence of endangered species, habitat of endangered or protected species or species with limited distribution; presence of rare ecosystem of endangered ecosystem; unique water source for daily use; important area to prevent erosion and sedimentation. Detailed information of the identified HCV areas and the map are presented in Table 6 and Figure 7.
Table 6. Details of the HCV Areas according to the initial HCV Assessment in 2010 No HCV Location Area (Ha)
1.
HCV 1
HCV 1.2 Presence of endangered species
Enclaved Area of Kawan Batu River
136.86 Area of Hai River 91,86 Ha
Riparian of Sapiri River 30,00 Ha
HCV 1.3 Habitat of endangered or protected species or species with limited distribution
Pada kawasan enclave Sungai Kawan Batu 15,00 Ha
136.86 Pada Kawasan Sungai Hai 91,86 Ha
Pada kawasan sepanjang sempadan Sungai Sapiri 30,00 Ha
2.
HCV 2 Large landscape level forest where viable population of the natural species occur
0
3. HCV 3 Presence of rare ecosystem or endangered ecosystem
Enclaved area of Kawan Batu River 15,00 Ha 15
4.
HCV 4
0
HCV 4.1 Unique water source for daily use
Pada kawasan enclave Sungai Kawan Batu 15,00 Ha
136.86 Pada Kawasan Sungai Hai 91,86 Ha
Pada kawasan sepanjang sempadan Sungai Sapiri 30,00 Ha
HCV 4.2 Important area to prevent erosion and sedimentation
Pada kawasan enclave Sungai Kawan Batu 15,00 Ha 15
5. HCV 5 Important area to fulfil community’s fundamental needs
0
6. HCV 6 Important area related to social cultural identity
0
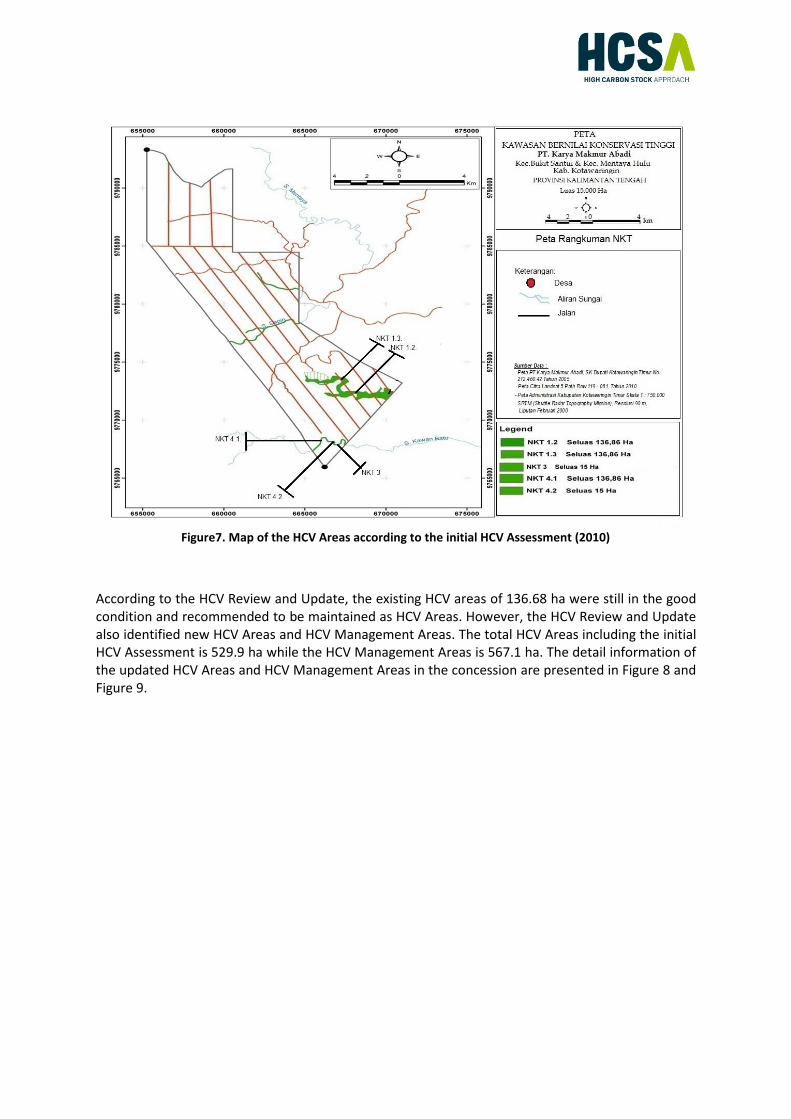
Figure7. Map of the HCV Areas according to the initial HCV Assessment (2010)
According to the HCV Review and Update, the existing HCV areas of 136.68 ha were still in the good condition and recommended to be maintained as HCV Areas. However, the HCV Review and Update also identified new HCV Areas and HCV Management Areas. The total HCV Areas including the initial HCV Assessment is 529.9 ha while the HCV Management Areas is 567.1 ha. The detail information of the updated HCV Areas and HCV Management Areas in the concession are presented in Figure 8 and Figure 9.
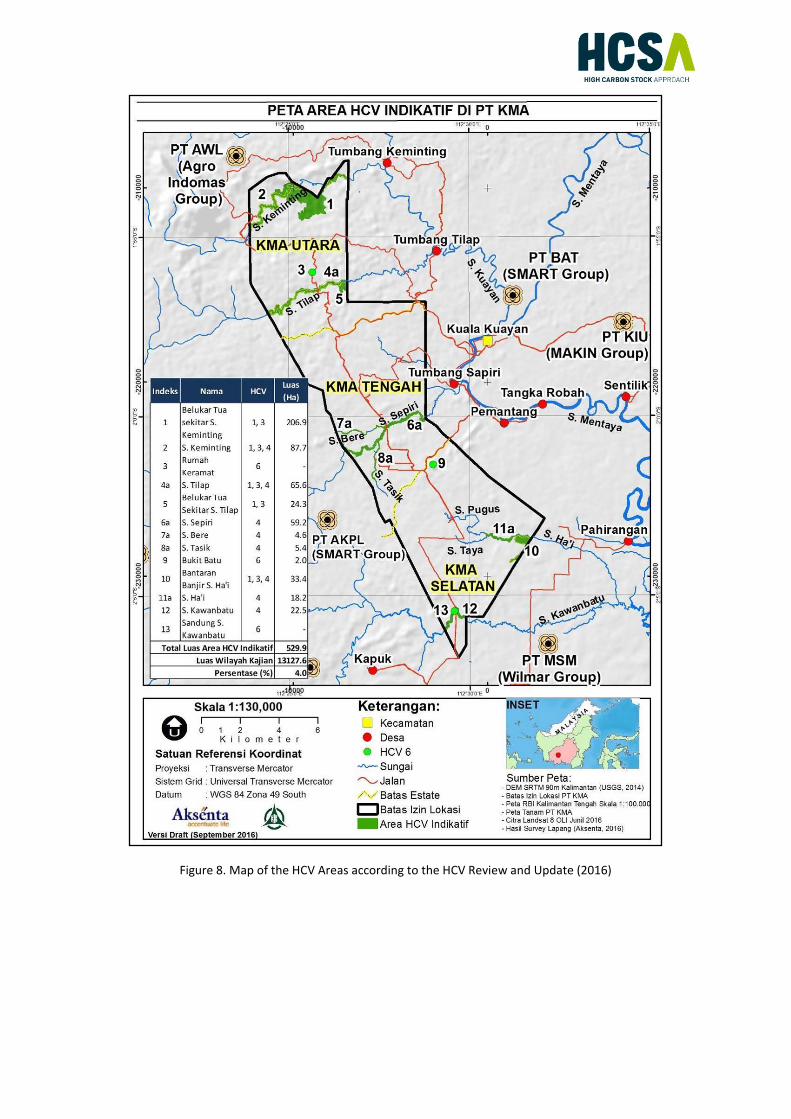
Figure 8. Map of the HCV Areas according to the HCV Review and Update (2016)

Figure 9. Map of the HCV Management Areas according to the initial HCV Assessment

5. Environmental Impact Assessment 5.1 Summary Environmental impact assessment in PT KMA was reported in “Dokumen Pengelolaan dan Pemantauan Lingkungan (DPPL)” in 2009. The document is one of the regulation from the Ministry of Environment of the Republic of Indonesia No. 12, 2007 and the provision of the Kotawaringin Timur Regent No. 660/21/BLH.ADH/I/2009. There are three stages of oil palm plantation operation occurred in the management of the PT KMA oil palm plantation, namely pre-construction stage, construction stage and operation stage. Accordingly, the pre-construction stage and the construction stage occurred in the new development plan while the operation stage occurs in the existing plantation in the concession. The environmental impact from the management of PT KMA were divided accordingly into three stages. Following are the details of the identified environmental impact and the monitoring plan of each impact from the operation of PT KMA: Table 7. Identified environmental impact from the operation of PT KMA and the management of the impact
Stage Activity Impact Aim Indicator to be monitored
Pre-construction
Socialization and land compensation
Social conflicts and claim
Optimal socialization and reduce impact
Number of claims and conflict occur during socialization and land compensation process
Construction
Labour recruitment
Social conflicts and claim
Optimal labour recruitment
Number of claims and conflict
Heavy equipment and material mobilization
Traffic accident and road degradation
Mobilization process improvement
Number of accident and road degradation during the mobilization process
Infrastructure building
Job opportunity for the community around the plantation
To ensure the process become the job opportunity to the community
Number and type of job will be open for recruitment
Land Clearing Land fire and erosion
Effectiveness of the environmental management to prevent erosion and land fire
Level of land fire and erosion
Nursery Eutrophication To ensure the amount of fertilizer use is optimal
Amount of fertilizer used in the nursery
Operation
Planting Land clearing and planting in riparian area
To ensure the planting process not taken place in riparian area
Land clearing in riparian area and other water resources
Pre-productive crop nursing
Eutrophication To ensure the amount of fertilizer use is optimal
Amount of fertilizer used for productive crop
Productive crop nursing
Eutrophication To ensure the amount of fertilizer use is optimal
Amount of fertilizer used for productive crop
FFB harvesting No significant impact
FFB mobilization
Business opportunity and fatality
To ensure the compliance of health and safety principles and to evaluate the business opportunity
Number of fatality, number and type of business opportunity
Infrastructure Pollution of To ensure the optimal Volume of the waste and

Stage Activity Impact Aim Indicator to be monitored
maintenance hazardous waste
management of the hazardous waste
criteria of the hazardous waste containment
Community development
Community perception
To improve the community development program
Number of claim and social issue
Health and safety
Staff productivity improvement
Evaluation and to improve the acknowledgement of the staff about health and safety at work
Number of fatality at work
6. Land cover image analysis 6.1 Area of Interest and how it was defined The area of interest of the assessment covers the concession of PT KMA and additional 1 km buffer beyond the concession boundary. There are seven land cover classes identified in the AOI. The HCS land cover classes identified are secondary forest which was only identified in the 1 km buffer and thickets (Young Regenerating Forest) which was found in the 1 km buffer and in the concession. The first planting in the concession was taken place in 2010 and the development was halt in 2015. Oil palm plantation is the largest land cover in the concession. The existing oil palm plantation in each division respectively is 60.6% in North KMA Division, 65.8% in Central KMA Division and 90.7% in South KMA Division. However, the development and management of the oil palm plantation in North KMA Division was halt due to company’s policy since 2015. The condition of the oil palm plantation in the North KMA Division at the time of the assessment was covered by bushes. Abandoned rubber trees were also found in several undeveloped patches in the AOI. Though the presence of rubber trees indicates that these areas were fields cultivated by community in the past, these areas were classified as shrubs because the areas were already overgrown by pioneer trees such as macaranga. The HCS land cover in the AOI consists of secondary forest (Low Density Forest) which was found outside the concession and thickets (Young Regenerating Forest) which was found in the concession and in the 1 km buffer. In addition, wider forest connectivity was also identified located at the Riparian of Kaminting River (yellow mark in figure 8) and the Tilap River (purple mark in Figure 10). These forest corridors are the potential high priority forest patch for conservation. In addition, some part of the both patches were also identified as HCV Areas according to the HCV Review and Update.

Figure 10. Potential HCS land cover corridor and connectivity in PT KMA concession (Google earth satellite
imagery, 2015)
6.2 Description of images used for classification Land cover classification was conducted based on landsat 8 satellite images path 119 and row 61 acquired on April 22nd and July 27th, 2016. In addition, the result of final classification was verified with google earth imagery (2016) and above ground carbon stock distribution (Carbon Stock Assessment in 2016). These imageries were used as the basis of the analysis during the assessment period. However, land cover classification was revised using the latest available landsat 8 imagery acquired on March 24th, 2017. The image used for the final stratification has clear cloud and haze cover. Therefore, image correction was not conducted during the image preparation.

6.3 Sample image
Figure 11. Landsat 8 Satellite Imagery of the AOI on April 22nd , 2016 in PT KMA Concession

Figure 12. Landsat 8 Satellite Imagery of the AOI on July 27th, 2016 in PT KMA Concession

Figure 13. Google earth imagery of the AOI in 2016 in PT KMA Concession

6.4 Method of stratification and software used Land cover stratification during the initial analysis was conducted using manual visual interpretation based on the satellite imageries. ArcMAP 10.1 was used in conducting the land cover stratification. Land cover stratification was conducted again during the analysis process to produce the final stratification using supervised classification method and corrected with manual visual interpretation. ArcMap 10.1 was also used for the final stratification.
6.5 Map of initial vegetation classes, with legend
Figure 14. Initial land cover classification in PT KMA Concession

6.6 Table of total hectares per vegetation class Table 8. Size of each land cover class in the PT KMA concession
Land cover class Number of Hectares % of total concession
Potential HCS classes:
High Density Forest - -
Medium Density Forest - -
Low Density Forest (Secondary Forest) - -
Young Regenerating Forest (Thicket) 1,708.4 12.8
Sub-total 1,708.4 12.8
Non-HCS classes, e.g.:
Shrubs 979.4 7.3
Bushes 490.7 3.7
Open Land 441.0 3.3
Oil Palm 9,759.3 72.9
Water 1.5 0.0
Sub-total 11,671.9 87.2
TOTAL 13,380.3 100
hectares of the analysis are according to GIS Analysis
6.7 Summary of which areas are potential HCS forest, subject to further analysis Thickets (young regenerating forest) is the potential HCS land cover in the PT KMA concession. Small patch of secondary forest was also identified in the 1 km buffer outside the concession and it is connected to HCV area located at the South part of the concession. The largest patches of thicket (young regenerating forest) were found in the riparian area of Kaminting River and Tilap River. Both are connected to thickets (young regenerating forest) located outside the concession. According to the size of the patch and the function of connectivity, thickets (young regenerating forest) in both riparian areas are potential high priority conservation area. Other thickets (young regenerating forest) patches were found sporadically. All of them consists of the medium and low priority patches according to the size of the patch core. However, some of the medium and low priority patches were potential conservation by reason of connectivity function (connectivity analysis) and presence of water stream (Pre RBA step). The other smaller patches with no connectivity and impediments for development will proceed for RBA check.
7. Forest inventory results

7.1 Inventory sample design and plot rational Sampling plots are randomly distributed in each land cover type. However, it is acknowledged that the number of sampling points were not proportional to the land cover types. The sampling determination was focusing on the thickets as the high carbon stock land cover such as secondary forest and thickets. Forest inventory took place in June, 2016.
Table 9. Number of the forest inventory plots per each land cover class
Land Cover Number of Sample Plots
Thicket 22
Shrubs 6
Rubber Area 3
Bushes 2
Total 31
7.2 Map indicating plots
Figure 115. Forest inventory sampling plot in PT KMA Concession

7.3 Forest inventory team members and roles Risa Desiana Syarif. Bachelor of forestry. Experienced in remote sensing and spatial analysis, land use change analysis and carbon stock estimation.
Role: Vegetation measurement, land cover analysis
Pramitama Bayu Saputro. Bachelor of forestry. Experienced in biodiversity research, forest ecology, land use change analysis and remote sensing.
Role: Vegetation measurement, vegetation analysis
Heidei PH. Bachelor of agriculture science, majoring in Agroclimatology. Experienced in land use change analysis, soil physical properties research with remote sensing and carbon stock estimation.
Role: Vegetation measurement, carbon stock modeling and extrapolation and GIS analysis.
Bias Berlio P. Bachelor of forestry. Experienced in carbon stock estimation and plant identification.
Role: Vegetation measurement, vegetation analysis
7.4 Methodology used for forest sampling Nested square plots sampling was used in the forest inventory. It is acknowledged that the sampling technique used is different with what is suggested in the HCS Approach Toolkit. However, the nested square plots were considered more practical to be used in the forest inventory, especially due to the variation of the tree DBH in sampling site. This technique is considered adequate to be used because it has the same principle in context of the data interpolation with the circular plots as suggested in the toolkit. The subtle difference between both is instead of measuring all trees in one sample plot, trees from each class of certain DBH range were measured in different plots in the nested square plots sampling. The sampling plots specialization aims to avoid poor accuracy due to the variance of the tree density in each DBH class while the practicality is improved.
Figure 16. Forest inventory sampling plot design

Table 10. Details of the measured trees in each square subplot
Sub-plot Size Tree DBH to Measure
5 x 5 m2 Bushes-Shrub and sapling vegetation stage with 5-10 cm of DBH
10 x 10 m2 Thicket and pole vegetation stage with 10-20 cm of DBH 20 x 20 m2 Thicket and tree with 20-35 cm of DBH 40 x 40 m2 Trees with > 35 cm DBH
7.5 Methodology used for carbon calculations Vegetation carbon stock is calculated with tree carbon stock-biomass ratio, the carbon stock-biomass ratio is 0.47 (IPCC, 2006).
7.6 Indicative photos of each vegetation class
Figure 17. Secondary forest
Figure 18. Thicket

Figure 19. Shrubs
Figure 20. Bushes
Figure 21. Rubber area
Figure 22. Open land and oil palm

7.7 Statistical analysis (allometric used, confidence tests, justification) The tree biomass was calculated with allometric equations according to “Monograf Alometrik untuk Pendugaan Biomassa Pohon pada Berbagai Tipe Ekosistem Hutan di Indonesia” (Krisnawati et al, 2012). This book contains collection of allometric equations based on several researches in Indonesia. This book presents collection of tree biomass allometric equation for several species, region and ecosystem. This reference was used in consideration to improve the accuracy of the biomass calculation since it has specified allometric equation for certain species. For the species that the allometric equation is not provided in the book, the allometric equation of another species from the same genus or family with the highest accuracy was used.
7.8 Summary of statistical analysis of carbon stock results per vegetation class Table 11. Summary of statistical analysis of carbon stock results per vegetation class
Land cover class Number of
Plots Stems per
hectare
Basal Area
(m2/ha)
Average Carbon Stocks
Standard error of the
mean
Confidence limits (90%)
Lower Upper
Rubber Area 3 1,117 487.08 25.84 5.01 17.59 34.08
Shrubs 6 2,913 598.75 13.63 2.06 10.31 17.77
Young Regenerating Forest/Thickets
22 1,910 627.11 42.58 19.05 35.90 49.26
7.9 Forest inventory results
Table 12. Forest inventory class (Carbon stock and description of each land cover class)
Land cover class
Average carbon value (ton/ha)
Physical description of the land cover, e.g. species mix, forest type (pioneer, regenerating, primary etc.), diameter distribution, structural indices, maturity indices, etc.
Rubber Area 25.48
These areas are used to cultivated as monoculture rubber plantation by the community in the past. Most of the trees found in these areas are rubber (Hevea brasiliensis), but already overgrown by bushes as natural vegetation succession. Found as sporadic small patches, therefore, these areas are classified in shrubs land cover classification. The 10-20 cm DBH class trees have the most basal area. There is no trees with DBH greater than 35 cm in these land cover class.
Shrubs 13.69
Early step of the vegetation succession. These areas once were cleared in the past but were not followed with any development. Macaranga species are dominant in these areas, while according to the DBH class, the 5-10 cm trees have the greatest basal area. There is no trees with DBH greater than 35 cm in this land cover class.
Young Regenerating Thickets (YRF)
42.58
Found as logged over areas. This land cover is dominated with macaranga trees, however, there are also forest trees species found in this land cover class such as dipterocarpaceae and Myrtaceae species. 5-10 cm DBH class trees are dominating with the largest basal area, however the greater DBH class trees up to >35 cm DBH are also found in this land cover class.

8. Land Cover Classification 8.1 Refined land cover map with title, date, legend and any HCS forest patches identified
Figure 23. Refined land cover classification

9. Patch Analysis Result 9.1 Results of Decision Tree Attached at the end of this document
9.2 Comments on Decision Tree outcome There are 1,799.6 ha (13.4%) indicative area for conservation consists of HCS and HCV, conservation with mitigation and RBA check areas. However, these hectares may be changed as the results of the RBA check and the final boundary adjustment. Most of the HCS conservation areas are the high priority HCS patches that are overlapping with HCV areas and connected with the HCS land cover outside the concession. Both of those high priority patches are located in the Riparian of Keminting River and Tilap River. The HCS conservation with risk mitigation were sporadic smaller HCS patches that were found near and/or crossed by river. The presence of river in those patches were considered as the urgencies to determine the patches to be conserved to protect the quality of the river. However, since the entirety of the study area is highly accessible, these patches were considered to be conserved with risk mitigation. The RBA patches are the medium and low priority patches found sporadically spread in the Central and South KMA Divisions. These patches need further field visit to determine the land use plan of these patches. Low density forest/secondary forest were only found outside the PT KMA boundary. However, these areas were included within the AOI by the 1km extension buffer of the study area. Though these areas were not within the company’s boundary and not under the management of the company, the current condition of these secondary forests are considered as HCS areas, and all the HCS patches that are connected with these secondary forests were determined to be conserved.
10. Indicative Land Use Plan 10.1 Summary of results of final ground verification (if any) Final ground verification has not been carried out yet. This activity will be carried out once the RBA check is done and the decision on RBA patches has been made. However, further adjustment may be occurred and may results slight change on the land use plan due to the actual forest condition on the field (e.g. the forest patch edges).

10.2 Final HCS map
Figure 24. Land use plan in PT KMA Concession

10.3 Overview of forest conservation management and monitoring activities to be included in the Conservation and Development (land use) Plan HCS conservation management and monitoring plan will be developed and integrated in accordance with the HCV and the Environment Management and Monitoring Plan (RKL and RPL). Most of the conservation areas are located in the same places and occurred in the same forest patches. Therefore, to integrate the management and monitoring plan of each conservation areas will enable more practical and efficient implementation. List of activities to be included are:
- Field demarcation of the conservation area - Setting up information board of the conservation areas including the warning and
prohibition - Frequent monitoring of the conservation area - Prevention and management of conflicts - Fire prevention and fire fighting - Special monitoring at the conservation with risk mitigation
10.4 List of activities still to be carried out before Conservation and Development Plan can be finalised
- RBA Check - Socialization of the indicative land use plan to the communities - Final ground verification - Field delineation and demarcation of the definitive land use plan
Results of Decision Tree
FID Luas Tuplah HCSLC Priority Decision
0 88.3 Belukar YRF High Risk MP, Presence of River Conserve with risk mitigation
1 3.1 Belukar YRF High Risk MP, Presence of River Conserve with risk mitigation
2 600.1 Belukar YRF HCS Patches with connectivity Conserve
3 9.5 Belukar YRF High Risk MP, Presence of River Conserve with risk mitigation
4 6.3 Belukar YRF High Risk MP, Presence of River Conserve with risk mitigation
5 3.8 Belukar YRF High Risk MP, Presence of River Conserve with risk mitigation
6 8.0 Belukar YRF MP and LP RBA Check RBA Check
7 171.8 Belukar YRF High Risk MP, Presence of River Conserve with risk mitigation
8 50.6 Belukar YRF MP and LP RBA Check RBA Check
9 8.5 Belukar YRF MP and LP RBA Check RBA Check
10 19.1 Belukar YRF MP and LP RBA Check RBA Check
11 1.8 Belukar YRF MP and LP RBA Check RBA Check
12 2.9 Belukar YRF HCS Patches with connectivity Conserve
13 2.6 Belukar YRF MP and LP RBA Check RBA Check
14 14.6 Belukar YRF MP and LP RBA Check RBA Check
15 0.9 Belukar YRF MP and LP RBA Check RBA Check

FID Luas Tuplah HCSLC Priority Decision
16 7.3 Belukar YRF MP and LP RBA Check RBA Check
17 12.9 Belukar YRF MP and LP RBA Check RBA Check
18 3.7 Belukar YRF High Risk MP, Presence of River Conserve with risk mitigation
19 15.1 Belukar YRF MP and LP RBA Check RBA Check
20 2.9 Belukar YRF MP and LP RBA Check RBA Check
21 31.3 Belukar YRF HCS Patches with connectivity Conserve
22 3.5 Belukar YRF MP and LP RBA Check RBA Check
23 12.5 Belukar YRF MP and LP RBA Check RBA Check
24 2.6 Belukar YRF MP and LP RBA Check RBA Check
25 11.2 Belukar YRF MP and LP RBA Check RBA Check
26 5.0 Belukar YRF MP and LP RBA Check RBA Check
27 4.3 Belukar YRF MP and LP RBA Check RBA Check
28 1.8 Belukar YRF MP and LP RBA Check RBA Check
29 5.0 Belukar YRF MP and LP RBA Check RBA Check
30 1.8 Belukar YRF MP and LP RBA Check RBA Check
31 24.7 Belukar YRF HCS Patches with connectivity Conserve
32 8.5 Belukar YRF MP and LP RBA Check RBA Check
33 14.8 Belukar YRF MP and LP RBA Check RBA Check
34 10.3 Belukar YRF MP and LP RBA Check RBA Check
35 2.5 Belukar YRF MP and LP RBA Check RBA Check
36 10.6 Belukar YRF MP and LP RBA Check RBA Check
37 0.0 Belukar YRF MP and LP RBA Check RBA Check
38 51.7 Belukar YRF High Risk MP, Presence of River Conserve with risk mitigation
39 9.1 Belukar YRF High Risk MP, Presence of River Conserve with risk mitigation
40 7.2 Belukar YRF MP and LP RBA Check RBA Check
41 6.7 Belukar YRF MP and LP RBA Check RBA Check
42 9.2 Belukar YRF MP and LP RBA Check RBA Check
43 5.4 Belukar YRF MP and LP RBA Check RBA Check
44 47.9 Belukar YRF HCS and HCV overlapping area Conserve
45 0.1 Belukar YRF HCS and HCV overlapping area Conserve
46 0.2 Belukar YRF HCS and HCV overlapping area Conserve
47 40.4 Belukar YRF HCS and HCV overlapping area Conserve
48 16.6 Belukar YRF HCS and HCV overlapping area Conserve
49 83.3 Belukar YRF HCS and HCV overlapping area Conserve
50 0.0 Belukar YRF HCS and HCV overlapping area Conserve
51 1.8 Belukar YRF HCS and HCV overlapping area Conserve
52 2.0 Belukar YRF HCS and HCV overlapping area Conserve
53 4.5 Belukar YRF HCS and HCV overlapping area Conserve
54 0.0 Belukar YRF HCS and HCV overlapping area Conserve
55 18.5 Belukar YRF HCS and HCV overlapping area Conserve
56 4.5 Belukar YRF HCS and HCV overlapping area Conserve
57 23.2 Belukar YRF HCS and HCV overlapping area Conserve
58 7.0 Belukar YRF HCS and HCV overlapping area Conserve
FID Luas Tuplah HCSLC Priority Decision
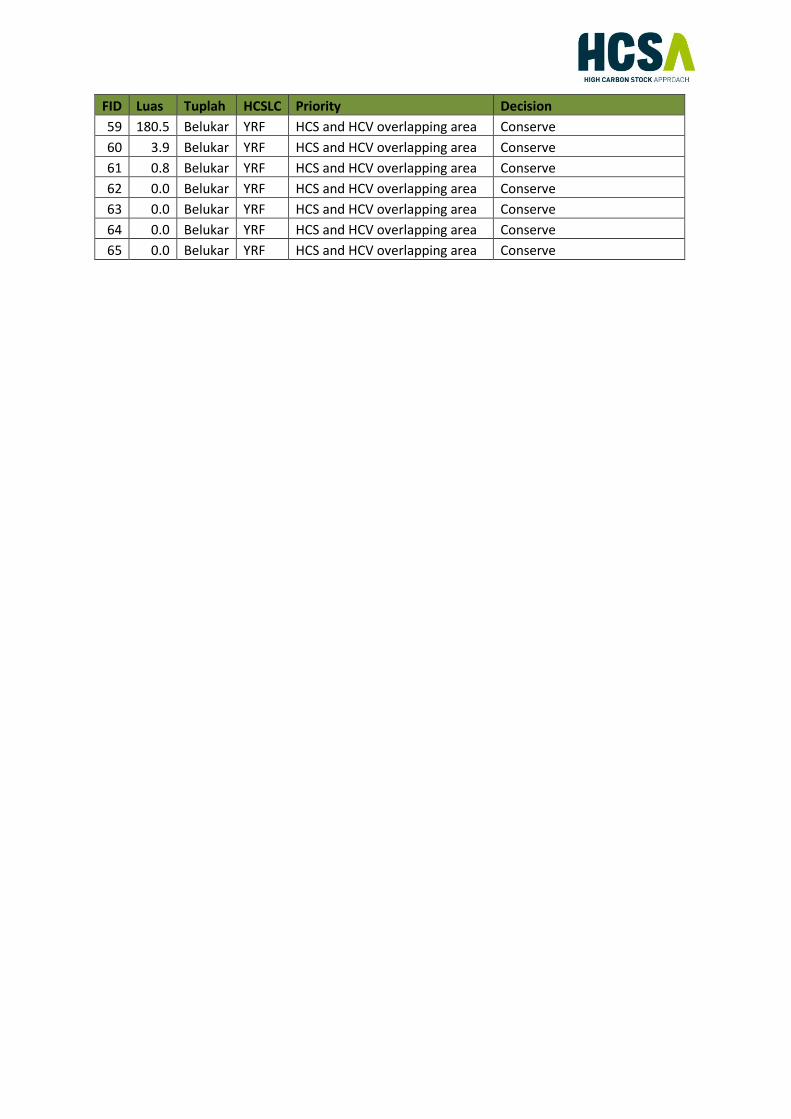
59 180.5 Belukar YRF HCS and HCV overlapping area Conserve
60 3.9 Belukar YRF HCS and HCV overlapping area Conserve
61 0.8 Belukar YRF HCS and HCV overlapping area Conserve
62 0.0 Belukar YRF HCS and HCV overlapping area Conserve
63 0.0 Belukar YRF HCS and HCV overlapping area Conserve
64 0.0 Belukar YRF HCS and HCV overlapping area Conserve
65 0.0 Belukar YRF HCS and HCV overlapping area Conserve


![Tumbang Powpint.ppt [Autosaved]](https://img.pdfslide.us/doc/110x75/577c82101a28abe054af487a/tumbang-powpintppt-autosaved.jpg)