Embed Size (px)
Citation preview
Summary
Quality and the future
Sustainability outlook

Summary
Quality and the future
Sustainability outlook
Netherlands Environmental Assessment Agency
RIVM
This is the summary of the publication Kwaliteit en Toekomst (Quality and the Future),made in the year 2004 by the Netherlands Environmental Assessment Agency, a partof the National Institute for Public Health and the Environment (RIVM). From an ecological perspective, this agency supports the political and societal debateon economical, ecological, spatial and social qualities of society.
The complete publication Kwaliteit en Toekomst (in Dutch) can be obtained from Sdupublishers (www.sdu.nl), ISBN 9012107148.
For more information, see the website www.rivm.nl.
© RIVM Bilthoven, The Netherlands 2005Cover photo: M.C. Escher’s “Rimpeling” © 2004 The M.C. Escher Company B.V. - Baarn- Holland. All rights reserved.
All rights reserved. No part of this book may be reproduced in any form by any elec-tronic or mechanical means (including photocopying, recording, or information stora-ge and retrieval) without permission in writing from the publisher.
4
QUALITY AND THE FUTURE MAIN CONCLUSIONS
5
MAIN CONCLUSIONS
Sustainability: societal values and scientific insightsIn essence, sustainability is about the quality of life and the possibilities for maintai-ning this quality in future. What sustainability is, therefore, depends on public opi-nions about the quality of life, the distribution of this quality across the globe, and thescientific understanding of the functioning of humans and natural systems.
Little support for the high-performance societyA public opinion survey revealed that less than 10% of the Dutch population is com-fortable with a society moving in the direction of progressive globalisation and indivi-dualisation. Many Dutch people, from all political parties, would rather belong to asociety in which regional development and solidarity continue to play a role. Howe-ver, denial of the high-performance society carries a price tag, considering that theaverage European in-come may only rise by a modest 40% from the present up to2040, whereas most official projections aim at and expect up to 140% rise in income by2040.
However, people are only prepared to change their behaviour if others do so as well.Seventy per cent of the population view the question of sustainability as a ‘socialdilemma’ and think that the government should find a way to resolve such dilemmas.This outcome is diametrically opposed to the idea that people want further govern-ment deregulation.
Sustainability of the Netherlands declined up to 1990, remaining stable there-afterThis Outlook contains four answers to the question of sustainability, presented in theform of four ‘world views’. Each world addresses the quality of life and the way thisquality should be realised from its own specific perspective. These worlds differ prima-rily in the extent to which they have an international dimension (globalisation versusregionalisation) and in the balance between efficiency and solidarity.
Sustainability is measured in this Outlook using indicators based on societal valuesand scientific insights. The trends in these indicators over the last 30 years reveal apicture of decreasing sustainability in the Netherlands up to 1990, followed by aperiod in which the situation has remained more or less stable. These trends reflectthe considerable weight society (and science) attach to regional and global ecologicalissues, the relative decline in the number of people suffering hunger and poverty andin the number of armed conflicts. The indicators can also be used to evaluate the con-tribution that proposed policies can make to promoting sustainability.
Risks inherent in single-perspective and partial solutionsEach world view has a particular perspective on sustainable development. This one-sidedness of how sustainability is perceived and should be realised is also a drawback,
as revealed in an exploration of future trends in mobility, energy and food supply.More particularly, these risks are rooted in a, sometimes, optimistic focus on technolo-gy, in a (great) belief in behavioural change or in (great) confidence in political andadministrative capabilities. So far, the solutions that have been found for emergingproblems have been partial, which, in turn, have given rise to new problems on a lar-ger scale and over a longer period. These have manifested themselves in the furtherdisruption of global biogeochemical cycles (carbon and nitrogen) and ecosystems. Thegreatest ecological risks are found in the world views with a bias towards efficiency, inwhich either consumption or global population continues to grow. For instance, ifenergy consumption increases fourfold, the risk of drastic climate change will be veryhigh, despite some of this energy being generated from renewable sources.
SolutionsTo avoid the risk of taking a single-perspective approach, the quest for sustainability–and thus sustainable development– must be based on the following elements:• credible governance with respect to both the setting of explicit goals and the
means to achieve them;• simultaneous management of the key factors of technology development and
behavioural change;• contribution to further ‘modernisation’ of the world and thus stabilisation of the
world population (preventing the formation of cultural blocks);• support for global agreements to resolve the ‘social dilemma’ associated with glo-
bal ecological problems (e.g. the Kyoto Protocol);• weighing regional (ecological or social and cultural) interests in making global
trade agreements.
If the public’s low opinion of the high-performance society and people’s preferencefor more solidarity and regional coherence were to determine the choice of solutions,the European scale would provide the elements listed above to a reasonable degree.Technologies for reducing pressures on the environment, such as renewable energy,can be deployed to an optimal effect on this scale. However, Europe would still have toparticipate in global agreements and help prevent the formation of overly powerfulblocks. In addition to the available means, the choice of goals (the chosen quality oflife) also determines the degree of sustainability. These societal goals could be basedon a conscious decision to uphold certain specifically European values. Given theobserved public preference, these goals could incorporate solidarity, good public ser-vices, and attention to ecology and the regional scale.
This Sustainability Outlook was prepared at the request of the state secretary for the Netherlands Ministry of Housing, Spatial Planning and the Environment. It is meant as acontribution to the public debate on sustainable development –and is surely not the lastword.
6
QUALITY AND THE FUTURE MAIN CONCLUSIONS
SUMMARY
Quality of life: here and now, elsewhere and laterIn essence, sustainability is about the quality of life and the possibilities for maintai-ning this quality in future. What sustainability is, therefore, depends on: • the public opinion about the quality of life,• the distribution of this quality of life across the globe, and• the scientific understanding of the functioning of humans and natural systems.
Is inequality in the world seen as a problem? Are the available collective resources sufficient? Should they be allocated fairly via the public sector, or on the basis of effi-ciency via the market? Scientific knowledge on the availability of resources can beused to estimate the future risks associated with maintaining this quality. Sustainabili-ty, therefore, is as much about social values as scientific insights.
World views on structuring the sustainability issueTo obtain a picture of societal values for this Outlook, TNS-NIPO, a polling agency,conducted a survey of the Dutch population. The survey indicated that both the choice for a certain quality of life and people’s opinions on how this quality should beallocated were derived from the same value orientations. Those who rate performan-ce highly are more likely to prefer free trade. Those who consider equity and worldpeace to be the highest goals are more likely to support strong international gover-nance. The chosen quality of life, the way it should be realised and on what scale can,therefore, be combined. These combinations can be seen as world views.
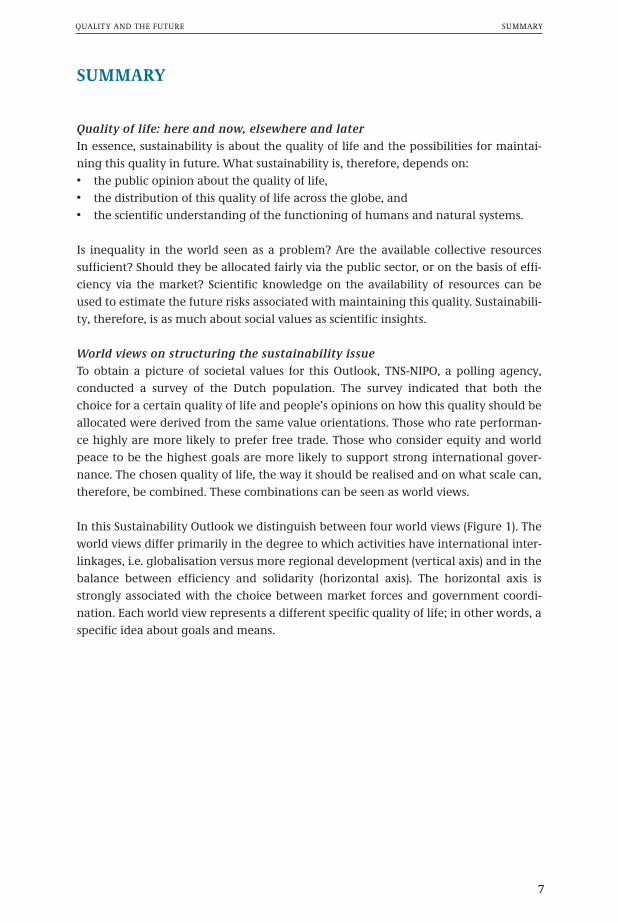
In this Sustainability Outlook we distinguish between four world views (Figure 1). Theworld views differ primarily in the degree to which activities have international inter-linkages, i.e. globalisation versus more regional development (vertical axis) and in thebalance between efficiency and solidarity (horizontal axis). The horizontal axis isstrongly associated with the choice between market forces and government coordi-nation. Each world view represents a different specific quality of life; in other words, aspecific idea about goals and means.
QUALITY AND THE FUTURE SUMMARY
7
GLOBAL MARKET (A1)Increasing globalisation and individualisation lead to the A1 world view, GLOBAL MAR-KET: the high-performance society. Fukuyama (1992) saw this trend towards a market-oriented, globalising society as the best solution for maximum economic growth andsocial progress, and therefore ‘the end of history’. In this liberal, individualising andefficiency-seeking world economic growth is indeed high: per capita income in theEU-15 in 2040 is more than 2.4 times the 2000 level (CPB, 2003). However, the ecologi-cal risks (particularly climate change) are high. In this world view, the world’s popula-tion will stabilize at 9 billion people by the middle of the century. The Dutch popula-tion will continue to grow to about 20 million in 2050, of which 6 to 7 million will beof non-Dutch origin.
From the perspective of the A1 world view, positive trends during recent decades wereseen in the drop in the level of the national debt, the rise in life expectancy and reduc-tion of the tax burden. Negative trends from the A1 position are the drop in Dutchcompetitiveness, increasing unemployment and crime, traffic congestion, the decli-ning security of energy supply and the comparative drop in investment in education.
QUALITY AND THE FUTURE SUMMARY
8
Characteristics of the world views
Efficiency Solidarity
Regionalisation
GlobalisationExtentofinterlinking
Distribution
'End of history'Free trade, Hi-techBerlin, 1989
Global Market
'Clash of civilisations'Cultural differencesNew York, 11-09-2001
Safe Region'Small is beautiful'
Self-sufficiencySeattle, 1999
Caring Region
'Our common future'UN coordination
Rio de Janeiro, 1992
Global Solidarity
Figure 1 Characteristics of the four world views
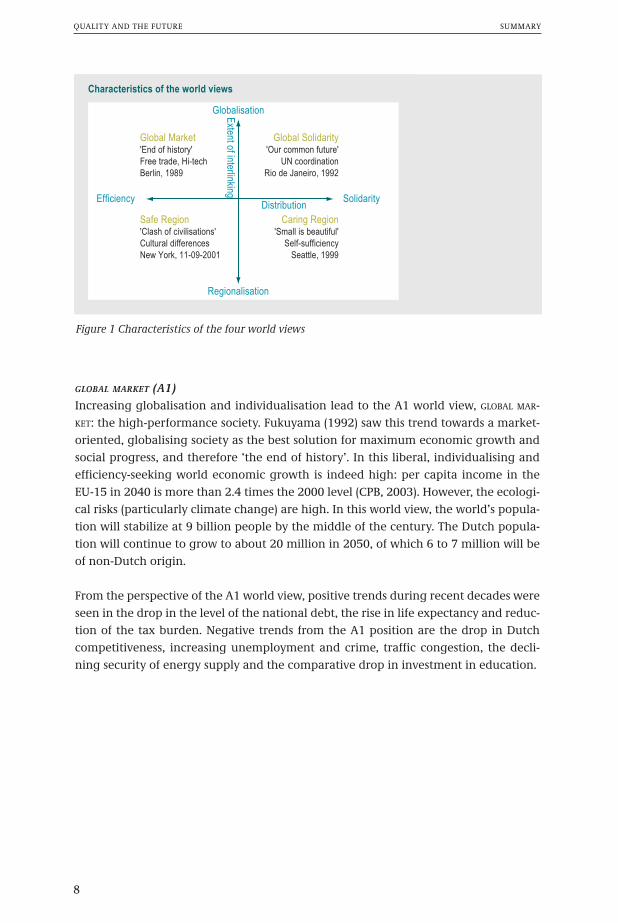
The main risk of failure in the A1 world view, GLOBAL MARKET, is the optimistic relianceon technological advance. In addition, the rapid growth of global trade and commu-nication entails a number of societal and cultural risks, causing:• loss of social cohesion, evoking the opposite world view, namely, the CARING REGION
(B2),• breakdown of cultural identity, which can lead to sections of the population retre-
ating into their own SAFE REGION (A2), which, in turn, can lead to the formation ofcultural blocks,
QUALITY AND THE FUTURE SUMMARY
9
1980 2000 2020 2040
0
20
40
60
80
100
12010
12 US$
Global Market
Gross World Product
1980 2000 2020 2040
0
20
40
60
80
100
120
Global Solidarity
1980 2000 2020 2040
0
20
40
60
80
100
120
Other World
Other OECD
Western and Eastern Europe
Safe Region
1980 2000 2020 2040
0
20
40
60
80
100
120
Caring Region
1012
US$
1012
US$ 1012
US$
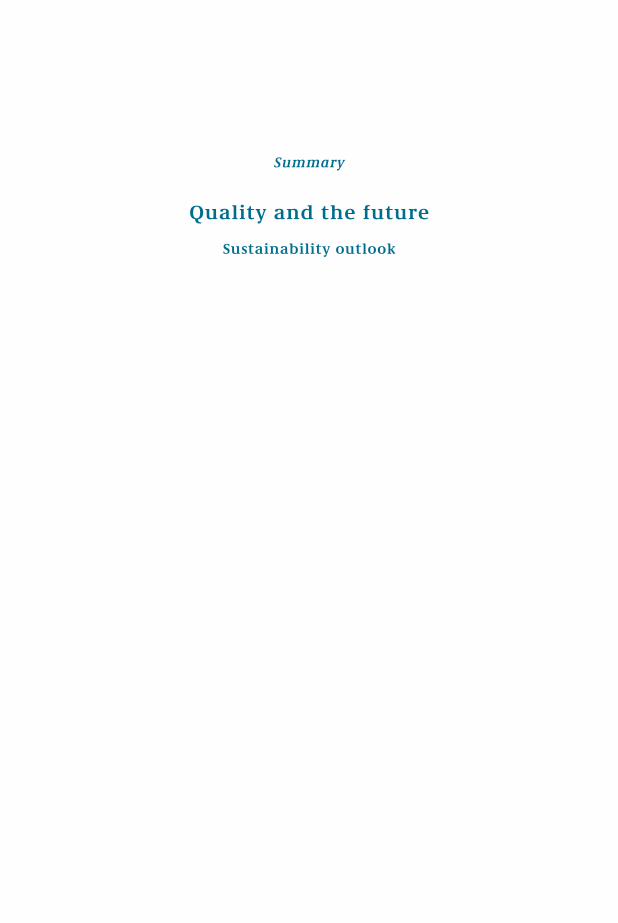
Figure 2 Economic growth in Europe and the world, 1970–2040 (CPB, 2003)
• loss of solidarity and collective goods goods (e.g. a stable climate), shifting opinionstowards the GLOBAL SOLIDARITY world view (B1).
CARING REGION (B2)From their world view based on solidarity and ‘small is beautiful’, anti-globalists haveconstantly warned about the risks inherent in the A1 world view. Community spirit,civic duty, and social and cultural diversity, are valued highly in the CARING REGION
world view, and immaterial goods like free time and community identity are impor-tant: money does not bring happiness. And this is a good thing, too, because in thisworld view per capita income in Europe in 2040 is ‘only’ 40% higher than in 2000, Bycomparison, in the A1 world it is 140% higher. Regional and local products are prefer-red, and people have considerable faith in local government (self-sufficiency).
SAFE REGION (A2)The global market (A1) does indeed evoke opposing reactions. There is considerableopposition to major new free trade agreements and a growing desire to protect cul-tural and economic interests. This leads to the A2 world view, with sharply opposedcultural blocks (Huntington’s The Clash of Civilizations, 1997). In the SAFE REGION worldview the trend towards hedonism and individualism continues. Adherents to thisworld view are highly concerned with national safety, and law and order. Free trade isseen as a threat to employment.
In the A2 world view, the exclusion of vulnerable areas will prevent ‘modernisation’;as a result, the total global population will rise to 11 billion in 2050. The highly une-qual division of wealth in this world view will increase the likelihood of global tensionand conflicts. The A2 answer to this is fewer immigrants and more security. The size ofthe Dutch population will rise slightly to 17 million, of which 5 million are immi-grants.
From the perspective of the A2 world view, positive trends during recent decades havebeen the reduction in the tax burden and longer life expectancy. Negative trends inthis world view are the increase in cultural diversity (number of residents of non-Dutch origin), rise in crime, smaller pensions and lower security of energy supply.
GLOBAL SOLIDARITY (B1)Sustainable development has been a goal since the late 1980s, because in manyrespects globalisation is already in an advanced stage and because ecological limitsare being reached on a global scale (climate change and biodiversity loss). In 1987 theBrundtland Commission laid the basis for sustainable development at the UnitedNations level in its report ‘Our Common Future’. This world view geared to GLOBAL SOLI-DARITY attempts to steer progressive globalisation in the right direction, ecologicallyand socially, by means of rules and conventions. An example is the Kyoto Protocol onclimate change. Institutions affiliated to the UN are given greater legitimacy and aneffective, worldwide government coordination is achieved. Social justice is consideredindispensable for resolving the tensions between ecology and economy: no intergene-
QUALITY AND THE FUTURE SUMMARY
10
rational solidarity without international solidarity. The associated lower economicgrowth in Europe is accepted in this world view, and brings income levels in 2040 upto 1.8 times the level in 2000.
The B1 world view attaches great importance to reducing hunger and poverty. Thedevelopments considered most negative in this world view are violations of humanrights, the loss of global biodiversity, climate change, shortage of drinking water andthe disruption of global biogeochemical cycles (e.g. the nitrogen cycle).
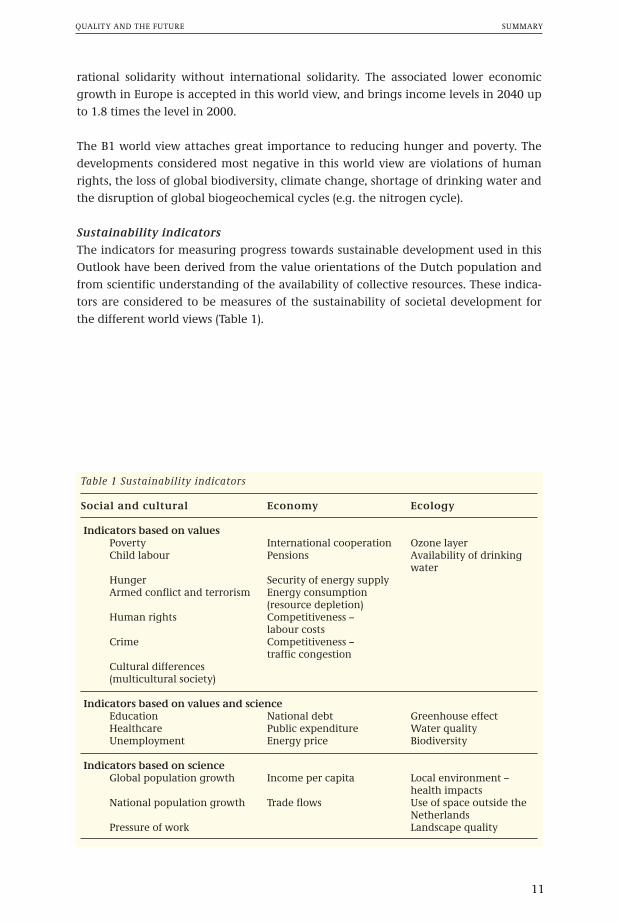
Sustainability indicatorsThe indicators for measuring progress towards sustainable development used in thisOutlook have been derived from the value orientations of the Dutch population andfrom scientific understanding of the availability of collective resources. These indica-tors are considered to be measures of the sustainability of societal development forthe different world views (Table 1).
QUALITY AND THE FUTURE SUMMARY
11
Table 1 Sustainability indicators
Social and cultural Economy Ecology
Indicators based on valuesPoverty International cooperation Ozone layerChild labour Pensions Availability of drinking
waterHunger Security of energy supplyArmed conflict and terrorism Energy consumption
(resource depletion)Human rights Competitiveness –
labour costsCrime Competitiveness –
traffic congestionCultural differences (multicultural society)
Indicators based on values and science Education National debt Greenhouse effectHealthcare Public expenditure Water qualityUnemployment Energy price Biodiversity
Indicators based on science Global population growth Income per capita Local environment –
health impactsNational population growth Trade flows Use of space outside the
NetherlandsPressure of work Landscape quality
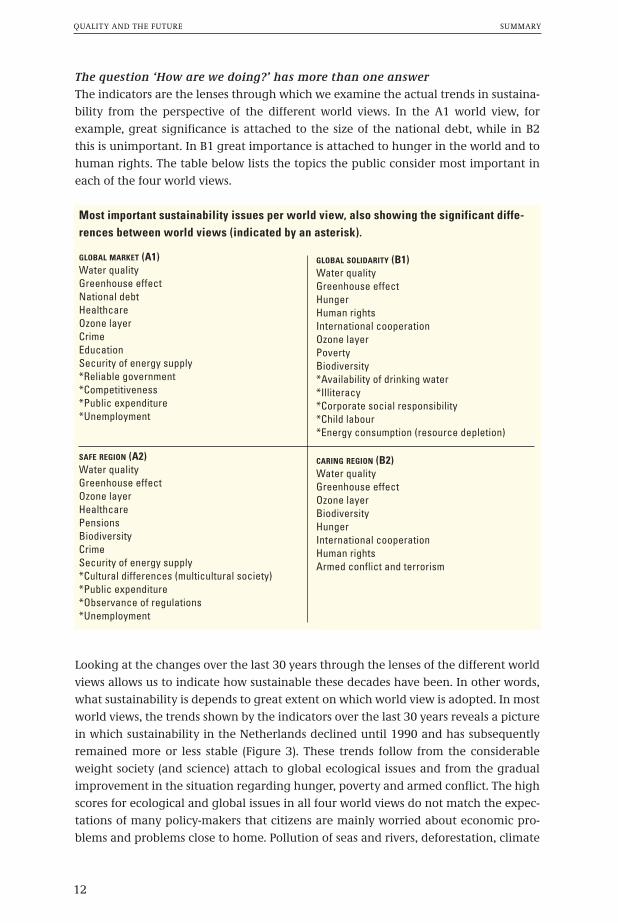
The question ‘How are we doing?’ has more than one answerThe indicators are the lenses through which we examine the actual trends in sustaina-bility from the perspective of the different world views. In the A1 world view, for example, great significance is attached to the size of the national debt, while in B2this is unimportant. In B1 great importance is attached to hunger in the world and tohuman rights. The table below lists the topics the public consider most important ineach of the four world views.
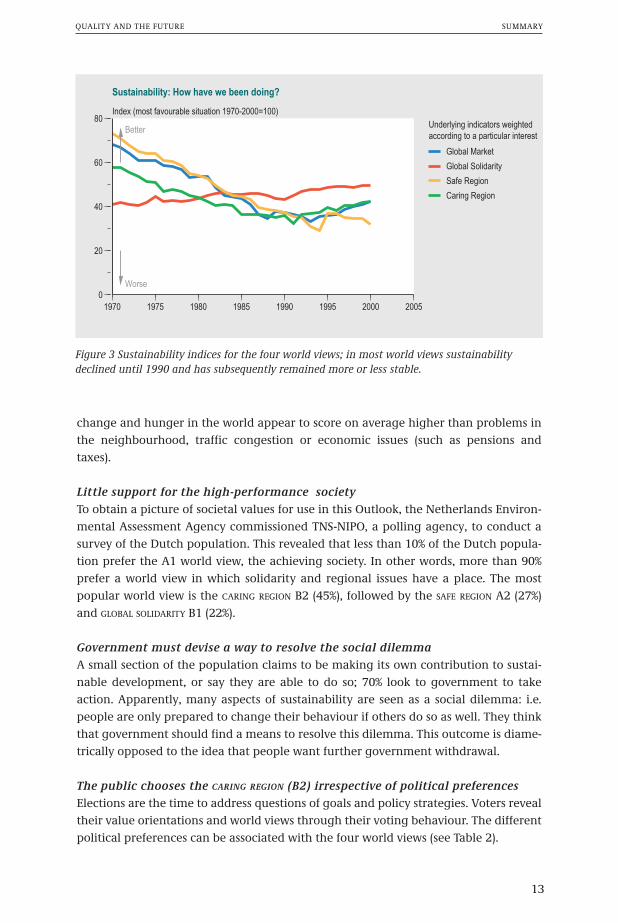
Looking at the changes over the last 30 years through the lenses of the different worldviews allows us to indicate how sustainable these decades have been. In other words,what sustainability is depends to great extent on which world view is adopted. In mostworld views, the trends shown by the indicators over the last 30 years reveals a picturein which sustainability in the Netherlands declined until 1990 and has subsequentlyremained more or less stable (Figure 3). These trends follow from the considerableweight society (and science) attach to global ecological issues and from the gradualimprovement in the situation regarding hunger, poverty and armed conflict. The highscores for ecological and global issues in all four world views do not match the expec-tations of many policy-makers that citizens are mainly worried about economic pro-blems and problems close to home. Pollution of seas and rivers, deforestation, climate
QUALITY AND THE FUTURE SUMMARY
12
Most important sustainability issues per world view, also showing the significant diffe-rences between world views (indicated by an asterisk).
GLOBAL MARKET (A1)Water qualityGreenhouse effectNational debtHealthcareOzone layerCrimeEducationSecurity of energy supply*Reliable government*Competitiveness*Public expenditure*Unemployment
SAFE REGION (A2)Water qualityGreenhouse effectOzone layerHealthcarePensionsBiodiversityCrimeSecurity of energy supply*Cultural differences (multicultural society)*Public expenditure*Observance of regulations*Unemployment
GLOBAL SOLIDARITY (B1)Water qualityGreenhouse effectHungerHuman rightsInternational cooperationOzone layerPovertyBiodiversity*Availability of drinking water*Illiteracy*Corporate social responsibility*Child labour*Energy consumption (resource depletion)
CARING REGION (B2)Water qualityGreenhouse effectOzone layerBiodiversityHungerInternational cooperationHuman rightsArmed conflict and terrorism
change and hunger in the world appear to score on average higher than problems inthe neighbourhood, traffic congestion or economic issues (such as pensions andtaxes).
Little support for the high-performance societyTo obtain a picture of societal values for use in this Outlook, the Netherlands Environ-mental Assessment Agency commissioned TNS-NIPO, a polling agency, to conduct asurvey of the Dutch population. This revealed that less than 10% of the Dutch popula-tion prefer the A1 world view, the achieving society. In other words, more than 90%prefer a world view in which solidarity and regional issues have a place. The mostpopular world view is the CARING REGION B2 (45%), followed by the SAFE REGION A2 (27%)and GLOBAL SOLIDARITY B1 (22%).
Government must devise a way to resolve the social dilemmaA small section of the population claims to be making its own contribution to sustai-nable development, or say they are able to do so; 70% look to government to takeaction. Apparently, many aspects of sustainability are seen as a social dilemma: i.e.people are only prepared to change their behaviour if others do so as well. They thinkthat government should find a means to resolve this dilemma. This outcome is diame-trically opposed to the idea that people want further government withdrawal.
The public chooses the CARING REGION (B2) irrespective of political preferences Elections are the time to address questions of goals and policy strategies. Voters revealtheir value orientations and world views through their voting behaviour. The differentpolitical preferences can be associated with the four world views (see Table 2).
QUALITY AND THE FUTURE SUMMARY
13
1970 1975 1980 1985 1990 1995 2000 2005
0
20
40
60
80Index (most favourable situation 1970-2000=100)
Global Market
Underlying indicators weightedaccording to a particular interest
Global Solidarity
Safe Region
Caring Region
Sustainability: How have we been doing?
Better
Worse
Figure 3 Sustainability indices for the four world views; in most world views sustainabilitydeclined until 1990 and has subsequently remained more or less stable.
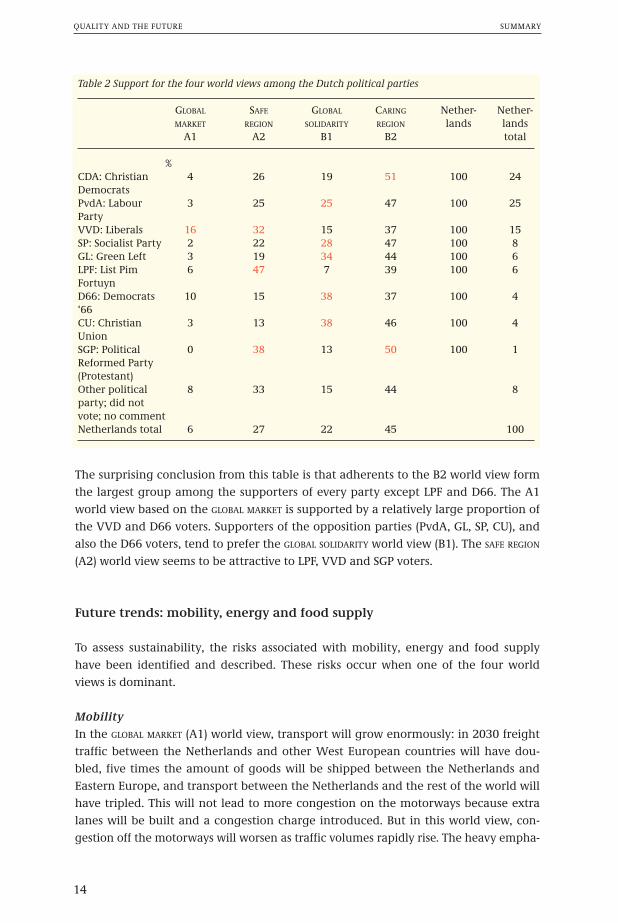
The surprising conclusion from this table is that adherents to the B2 world view formthe largest group among the supporters of every party except LPF and D66. The A1world view based on the GLOBAL MARKET is supported by a relatively large proportion ofthe VVD and D66 voters. Supporters of the opposition parties (PvdA, GL, SP, CU), andalso the D66 voters, tend to prefer the GLOBAL SOLIDARITY world view (B1). The SAFE REGION
(A2) world view seems to be attractive to LPF, VVD and SGP voters.
Future trends: mobility, energy and food supply
To assess sustainability, the risks associated with mobility, energy and food supplyhave been identified and described. These risks occur when one of the four worldviews is dominant.
MobilityIn the GLOBAL MARKET (A1) world view, transport will grow enormously: in 2030 freighttraffic between the Netherlands and other West European countries will have dou-bled, five times the amount of goods will be shipped between the Netherlands andEastern Europe, and transport between the Netherlands and the rest of the world willhave tripled. This will not lead to more congestion on the motorways because extralanes will be built and a congestion charge introduced. But in this world view, con-gestion off the motorways will worsen as traffic volumes rapidly rise. The heavy empha-
QUALITY AND THE FUTURE SUMMARY
14
Table 2 Support for the four world views among the Dutch political parties
GLOBAL SAFE GLOBAL CARING Nether- Nether-MARKET REGION SOLIDARITY REGION lands lands
A1 A2 B1 B2 total
%CDA: Christian 4 26 19 51 100 24DemocratsPvdA: Labour 3 25 25 47 100 25PartyVVD: Liberals 16 32 15 37 100 15SP: Socialist Party 2 22 28 47 100 8GL: Green Left 3 19 34 44 100 6LPF: List Pim 6 47 7 39 100 6FortuynD66: Democrats 10 15 38 37 100 4‘66CU: Christian 3 13 38 46 100 4UnionSGP: Political 0 38 13 50 100 1Reformed Party(Protestant)Other political 8 33 15 44 8party; did not vote; no commentNetherlands total 6 27 22 45 100
sis on efficiency leads to a decline in the quality of public transport. If the governmentwere to completely deregulate public transport, fares can be expected to rise by 60%and performance levels fall to about half the present levels. This combination of a con-gestion charge and poorer public transport services will mean reduced mobility forlower income groups. In this world view, freedom of choice for the consumer is animportant principle. One of the consequences of this is that while technologicalimprovements have made car engines much more efficient during the last few deca-des, any environmental gains have been negated by a shift towards heavier cars (suchas four-wheel drive vehicles). Technological development is geared primarily to cut-ting costs and reducing congestion, and not to resolving environmental and sustaina-ble development issues.
In GLOBAL SOLIDARITY (B1), solving environmental and sustainability problems is indeedthe aim. As a result of the large-scale adoption of biofuels, hydrogen and fuel cells,CO2 emissions from transport will fall sharply (by percentages of 20-30% more in 2030compared to 2000 levels). However, technical solutions geared towards increasingsustainability are expensive and risky, and any solutions they may provide will onlybecome apparent in the long term. So far, the use of hydrogen and biofuels simplyshifts a large proportion of the CO2 reductions from the transport sector to the energysector. Policy instruments like pricing and standards for new vehicles can be used tomake the cars on the roads more fuel efficient in a relatively short period, but thisrequires effective governing at the right level. The mobility and environmental poli-cies pursued at the European level have proven to be successful. Air pollution fromtraffic has already been considerably reduced by tightening up EU emission standardsand will decline so sharply over the next few decades that permitted levels will hardlyever be exceeded.
In administrative terms, the European scale has proved to be effective in pursuing amobility policy, and so the more regionally oriented world views, A2 and B2, are lesssuccessful in achieving mobility targets and avoiding negative environmental andother impacts. In the SAFE REGION world view (A2) no congestion charges are introduced:queues on motorways, expressed as vehicle hours lost, increase to about 30% above2000 levels in 2030. Here, too, public transport never really takes off. At the same time
QUALITY AND THE FUTURE SUMMARY
15
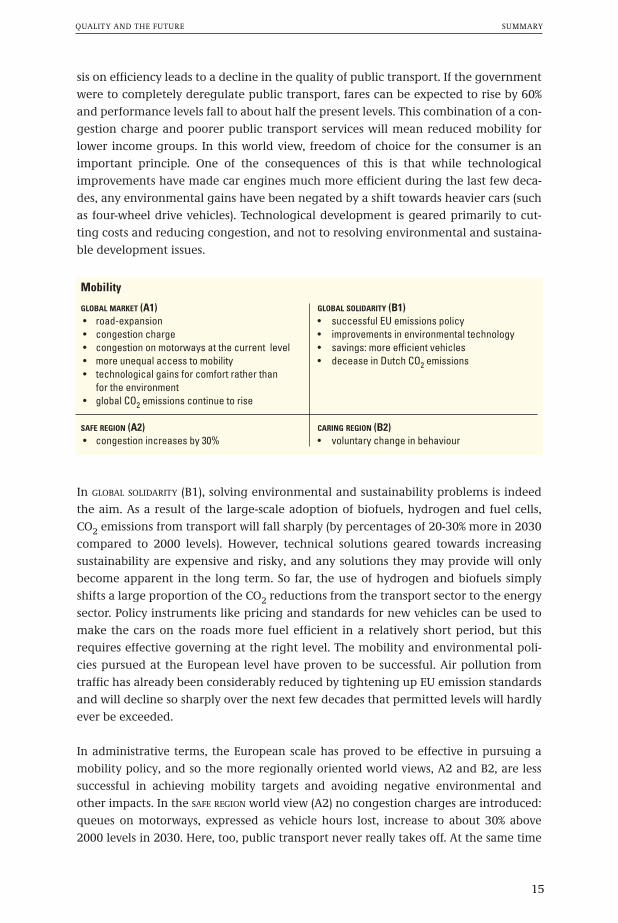
Mobility
GLOBAL MARKET (A1) GLOBAL SOLIDARITY (B1)• road-expansion • successful EU emissions policy• congestion charge • improvements in environmental technology• congestion on motorways at the current level • savings: more efficient vehicles• more unequal access to mobility • decease in Dutch CO2 emissions• technological gains for comfort rather than
for the environment• global CO2 emissions continue to rise
SAFE REGION (A2) CARING REGION (B2)• congestion increases by 30% • voluntary change in behaviour
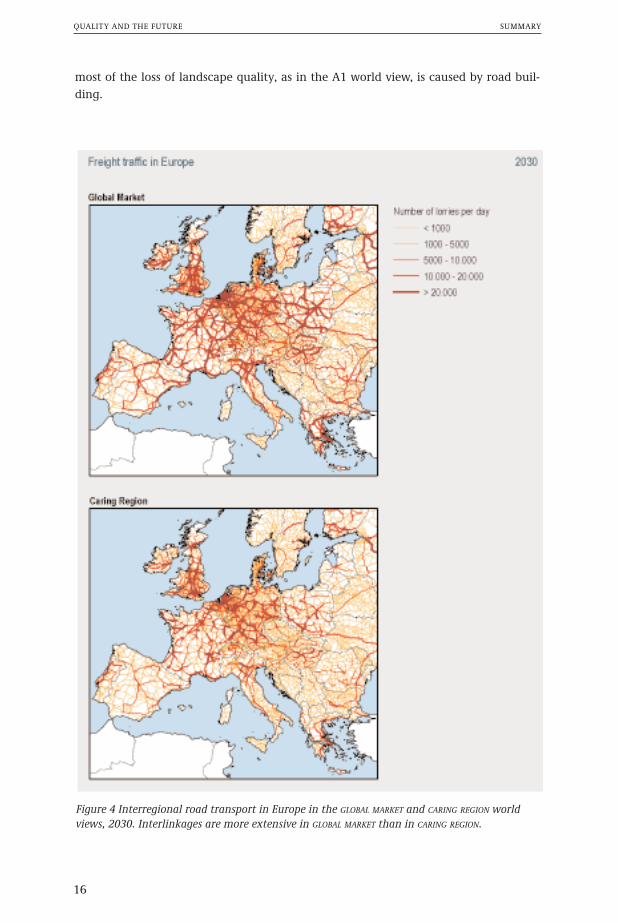
most of the loss of landscape quality, as in the A1 world view, is caused by road buil-ding.
QUALITY AND THE FUTURE SUMMARY
16
Figure 4 Interregional road transport in Europe in the GLOBAL MARKET and CARING REGION worldviews, 2030. Interlinkages are more extensive in GLOBAL MARKET than in CARING REGION.
In the CARING REGION world view (B2) mobility, and consequently congestion, increaseto a much lesser extent. The contrast with A1 is illustrated in Figure 4. Air pollu-tion,noise nuisance and landscape degradation remain limited. To keep the goal of sustai-nability within reach, people are encouraged to change their behaviour. In recentyears, though, this policy line – which includes a public information campaign underthe current traffic and transport policy – has not been successful. Attitudes have chan-ged, but people’s behaviour has not. It has not proven possible to resolve the socialdilemma of mobility on a voluntary basis.
We can conclude that the European scale is effective in finding a compromisebetween the demand for mobility and the sustainability aspects of mobility.
EnergyThe market-oriented world views (A1, A2) entail the greatest risks of climate change.In these world views, global energy consumption will rise by 75 to 100% between nowand 2030. By the end of the century energy consumption and CO2 emissions will be 3to 4 times higher than at present, with considerable risks to climate stability (Figure5). Both of these market-oriented world views offer few incentives to reduce emissions.Technology development is strongest in the globally oriented world view, GLOBAL MAR-KET, but is geared primarily to cost reduction (cheaper energy), with less emphasis onreducing emissions. This could trigger a ‘lock-in’ situation, in which more and more isinvested in the current energy system based on fossil energy. The currently foresee-able technologies in an environment dominated by the market are insufficient toreduce emissions and bring the climate problem under control.
In a market-oriented environment the scale of the climate problem can be reduced byintroducing a form of emissions trading. Just such a CO2 emissions trading system iscurrently being set up within the EU for the industry and energy sectors. This ap-proach can be seen as a compromise between the A1 ideas and the line of reasoningin GLOBAL SOLIDARITY (B1).
QUALITY AND THE FUTURE SUMMARY
17
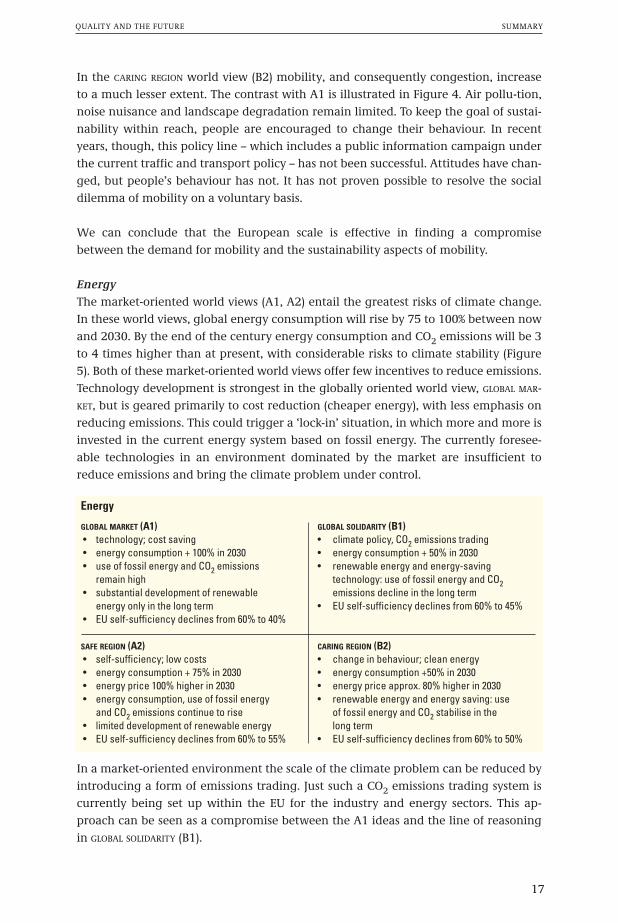
Energy
GLOBAL MARKET (A1) GLOBAL SOLIDARITY (B1)• technology; cost saving • climate policy, CO2 emissions trading• energy consumption + 100% in 2030 • energy consumption + 50% in 2030• use of fossil energy and CO2 emissions • renewable energy and energy-saving
remain high technology: use of fossil energy and CO2• substantial development of renewable emissions decline in the long term
energy only in the long term • EU self-sufficiency declines from 60% to 45%• EU self-sufficiency declines from 60% to 40%
SAFE REGION (A2) CARING REGION (B2)• self-sufficiency; low costs • change in behaviour; clean energy• energy consumption + 75% in 2030 • energy consumption +50% in 2030• energy price 100% higher in 2030 • energy price approx. 80% higher in 2030• energy consumption, use of fossil energy • renewable energy and energy saving: use
and CO2 emissions continue to rise of fossil energy and CO2 stabilise in the • limited development of renewable energy long term• EU self-sufficiency declines from 60% to 55% • EU self-sufficiency declines from 60% to 50%
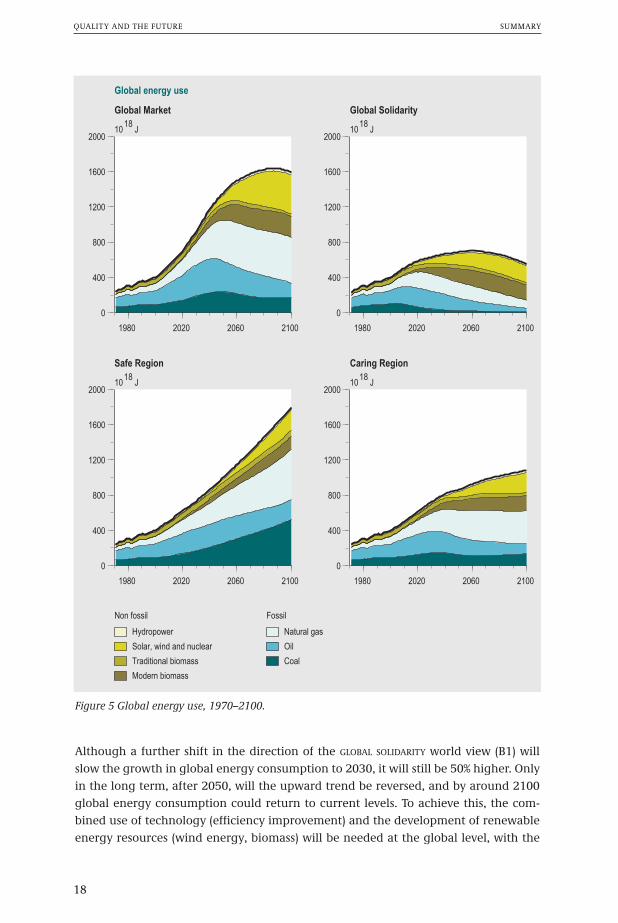
Although a further shift in the direction of the GLOBAL SOLIDARITY world view (B1) willslow the growth in global energy consumption to 2030, it will still be 50% higher. Onlyin the long term, after 2050, will the upward trend be reversed, and by around 2100global energy consumption could return to current levels. To achieve this, the com-bined use of technology (efficiency improvement) and the development of renewableenergy resources (wind energy, biomass) will be needed at the global level, with the
QUALITY AND THE FUTURE SUMMARY
18
1980 2020 2060 2100
0
400
800
1200
1600
200010
18 J
1018
J 1018
J
1018
J
Global Market
Global energy use
1980 2020 2060 2100
0
400
800
1200
1600
2000
Non fossil
Hydropower
Solar, wind and nuclear
Traditional biomass
Modern biomass
Fossil
Natural gas
Oil
Coal
Safe Region
1980 2020 2060 2100
0
400
800
1200
1600
2000
Global Solidarity
1980 2020 2060 2100
0
400
800
1200
1600
2000
Caring Region
Figure 5 Global energy use, 1970–2100.
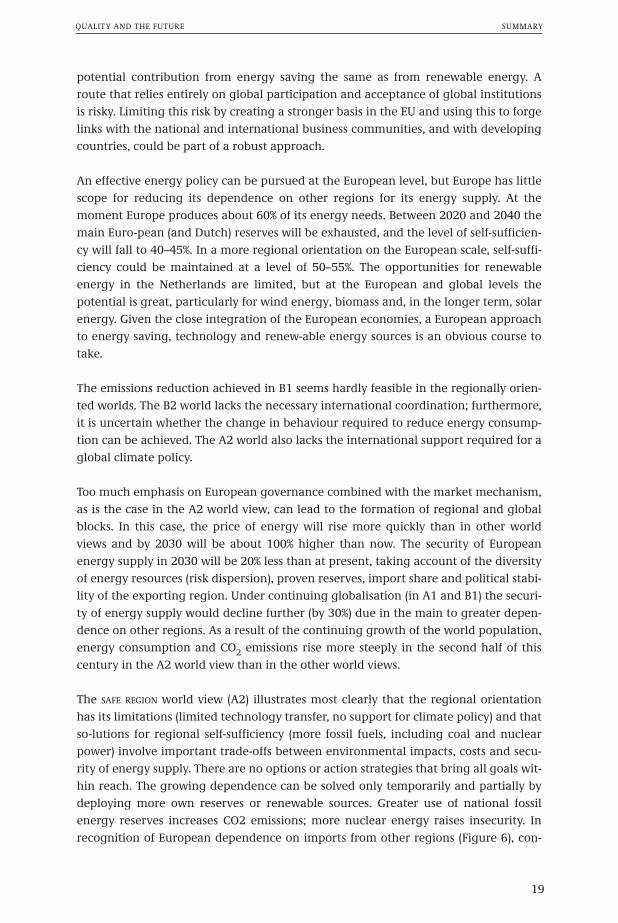
potential contribution from energy saving the same as from renewable energy. Aroute that relies entirely on global participation and acceptance of global institutionsis risky. Limiting this risk by creating a stronger basis in the EU and using this to forgelinks with the national and international business communities, and with developingcountries, could be part of a robust approach.
An effective energy policy can be pursued at the European level, but Europe has littlescope for reducing its dependence on other regions for its energy supply. At themoment Europe produces about 60% of its energy needs. Between 2020 and 2040 themain Euro-pean (and Dutch) reserves will be exhausted, and the level of self-sufficien-cy will fall to 40–45%. In a more regional orientation on the European scale, self-suffi-ciency could be maintained at a level of 50–55%. The opportunities for renewableenergy in the Netherlands are limited, but at the European and global levels thepotential is great, particularly for wind energy, biomass and, in the longer term, solarenergy. Given the close integration of the European economies, a European approachto energy saving, technology and renew-able energy sources is an obvious course totake.
The emissions reduction achieved in B1 seems hardly feasible in the regionally orien-ted worlds. The B2 world lacks the necessary international coordination; furthermore,it is uncertain whether the change in behaviour required to reduce energy consump-tion can be achieved. The A2 world also lacks the international support required for aglobal climate policy.
Too much emphasis on European governance combined with the market mechanism,as is the case in the A2 world view, can lead to the formation of regional and globalblocks. In this case, the price of energy will rise more quickly than in other worldviews and by 2030 will be about 100% higher than now. The security of Europeanenergy supply in 2030 will be 20% less than at present, taking account of the diversityof energy resources (risk dispersion), proven reserves, import share and political stabi-lity of the exporting region. Under continuing globalisation (in A1 and B1) the securi-ty of energy supply would decline further (by 30%) due in the main to greater depen-dence on other regions. As a result of the continuing growth of the world population,energy consumption and CO2 emissions rise more steeply in the second half of thiscentury in the A2 world view than in the other world views.
The SAFE REGION world view (A2) illustrates most clearly that the regional orientationhas its limitations (limited technology transfer, no support for climate policy) and thatso-lutions for regional self-sufficiency (more fossil fuels, including coal and nuclearpower) involve important trade-offs between environmental impacts, costs and secu-rity of energy supply. There are no options or action strategies that bring all goals wit-hin reach. The growing dependence can be solved only temporarily and partially bydeploying more own reserves or renewable sources. Greater use of national fossilenergy reserves increases CO2 emissions; more nuclear energy raises insecurity. Inrecognition of European dependence on imports from other regions (Figure 6), con-
QUALITY AND THE FUTURE SUMMARY
19
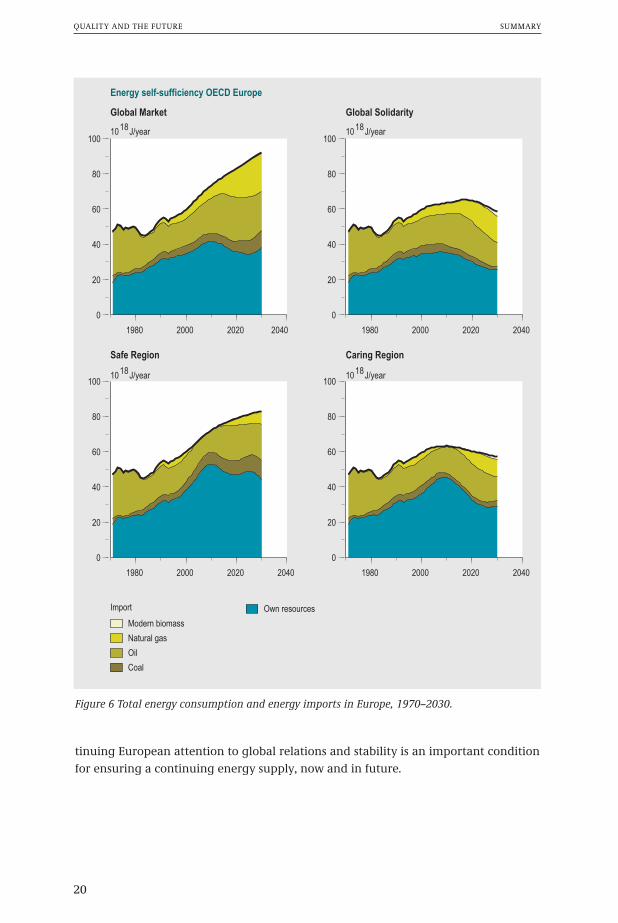
tinuing European attention to global relations and stability is an important conditionfor ensuring a continuing energy supply, now and in future.
QUALITY AND THE FUTURE SUMMARY
20
1980 2000 2020 2040
0
20
40
60
80
10010
18J/year
1018
J/year 1018
J/year
1018
J/year
Global Market
Energy self-sufficiency OECD Europe
1980 2000 2020 2040
0
20
40
60
80
100
Global Solidarity
1980 2000 2020 2040
0
20
40
60
80
100
Import
Modern biomass
Natural gas
Oil
Coal
Own resources
Safe Region
1980 2000 2020 2040
0
20
40
60
80
100
Caring Region
Figure 6 Total energy consumption and energy imports in Europe, 1970–2030.
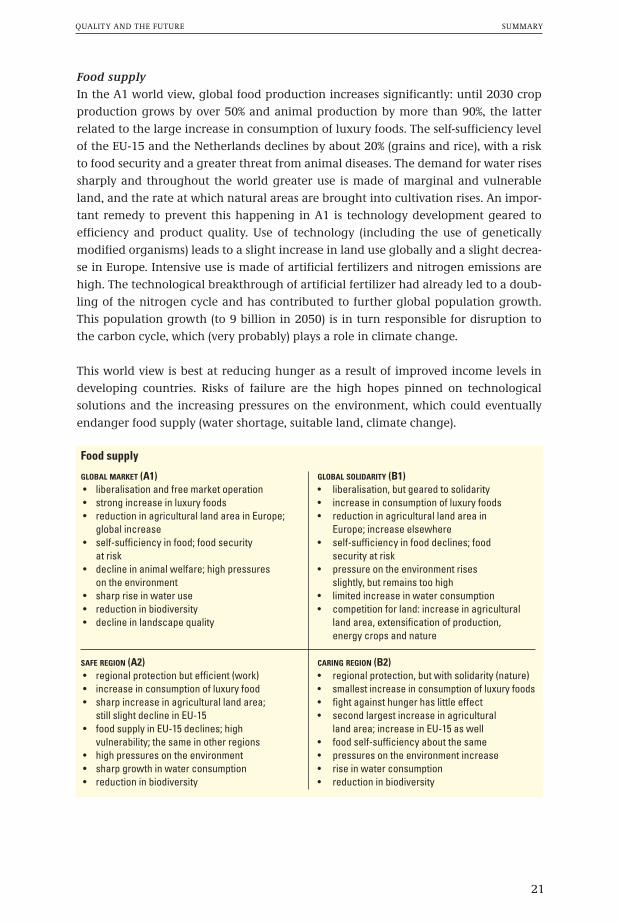
Food supplyIn the A1 world view, global food production increases significantly: until 2030 cropproduction grows by over 50% and animal production by more than 90%, the latterrelated to the large increase in consumption of luxury foods. The self-sufficiency levelof the EU-15 and the Netherlands declines by about 20% (grains and rice), with a riskto food security and a greater threat from animal diseases. The demand for water risessharply and throughout the world greater use is made of marginal and vulnerableland, and the rate at which natural areas are brought into cultivation rises. An impor-tant remedy to prevent this happening in A1 is technology development geared toefficiency and product quality. Use of technology (including the use of geneticallymodified organisms) leads to a slight increase in land use globally and a slight decrea-se in Europe. Intensive use is made of artificial fertilizers and nitrogen emissions arehigh. The technological breakthrough of artificial fertilizer had already led to a doub-ling of the nitrogen cycle and has contributed to further global population growth.This population growth (to 9 billion in 2050) is in turn responsible for disruption tothe carbon cycle, which (very probably) plays a role in climate change.
This world view is best at reducing hunger as a result of improved income levels indeveloping countries. Risks of failure are the high hopes pinned on technologicalsolutions and the increasing pressures on the environment, which could eventuallyendanger food supply (water shortage, suitable land, climate change).
QUALITY AND THE FUTURE SUMMARY
21
Food supply
GLOBAL MARKET (A1) GLOBAL SOLIDARITY (B1)• liberalisation and free market operation • liberalisation, but geared to solidarity• strong increase in luxury foods • increase in consumption of luxury foods• reduction in agricultural land area in Europe; • reduction in agricultural land area in
global increase Europe; increase elsewhere• self-sufficiency in food; food security • self-sufficiency in food declines; food
at risk security at risk• decline in animal welfare; high pressures • pressure on the environment rises
on the environment slightly, but remains too high• sharp rise in water use • limited increase in water consumption• reduction in biodiversity • competition for land: increase in agricultural • decline in landscape quality land area, extensification of production,
energy crops and nature
SAFE REGION (A2) CARING REGION (B2)• regional protection but efficient (work) • regional protection, but with solidarity (nature)• increase in consumption of luxury food • smallest increase in consumption of luxury foods• sharp increase in agricultural land area; • fight against hunger has little effect
still slight decline in EU-15 • second largest increase in agricultural • food supply in EU-15 declines; high land area; increase in EU-15 as well
vulnerability; the same in other regions • food self-sufficiency about the same• high pressures on the environment • pressures on the environment increase• sharp growth in water consumption • rise in water consumption• reduction in biodiversity • reduction in biodiversity
In B1 food production tends grow less sharply and the consumption of luxury foodsincreases at a lower rate. The level of self-sufficiency in Europe remains somewhat lar-ger than in A1. As a result of the intensification of agriculture and international agree-ments on the environment and food security, water consumption and nitrogen emis-sions increase only slightly. The goal of preventing hunger is brought closer in the B1world view, but raising food production also requires political stability. One problemis that various goals in this world view compete for land: agricultural production,agricultural intensification (to benefit the environment), nature and landscape con-
QUALITY AND THE FUTURE SUMMARY
22
1980 2020 2060 2100
0
4
8
12
16billion
A1
Global population
1980 2020 2060 2100
0
4
8
12
16billion
B1
1980 2020 2060 2100
0
4
8
12
16billion
Africa, Latin America andMiddle East
Asia
Eastern Europe andformer USSR
OECD
A2
1980 2020 2060 2100
0
4
8
12
16billion
B2
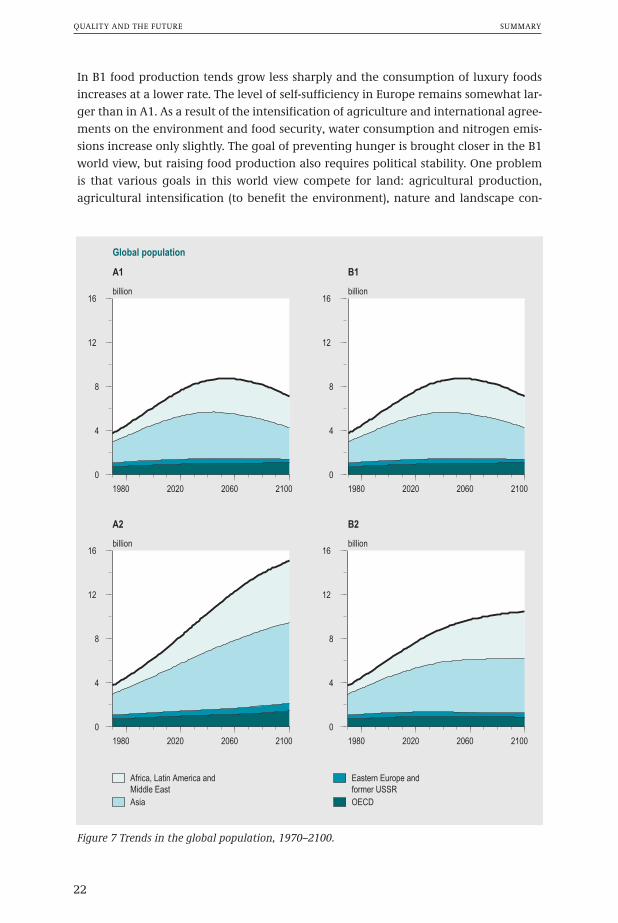
Figure 7 Trends in the global population, 1970–2100.
servation and the extra demand for land for the production of biomass for energy.There are risks of failure in this world view in non-compliance with internationalagreements and failure to allocate land uses soon enough.
In the B2 world, trade blocks are formed, partly in the interests of nature and the envi-ronment, but problems elsewhere also receive attention. This results in the lowestgrowth of food production (although still 50%). The increase in meat consumptionfoods in this world view is very small (3%). Self-sufficiency in food (grains and rice)increases slightly and is in line with the objectives. The fight against hunger is as inef-fective as in the A2 world view and for the same reasons. The agricultural land area inthe world rises slightly, also in Europe. Water consumption and nitrogen emissionsrise more than in B1, but less than in the A world views. This world view (B2) is vul-nerable with respect to human behaviour. It is expected that voluntary changes inbehaviour (eating less meat) will resolve a number of difficulties, but should this notbe the case, the goals will remain out of reach.
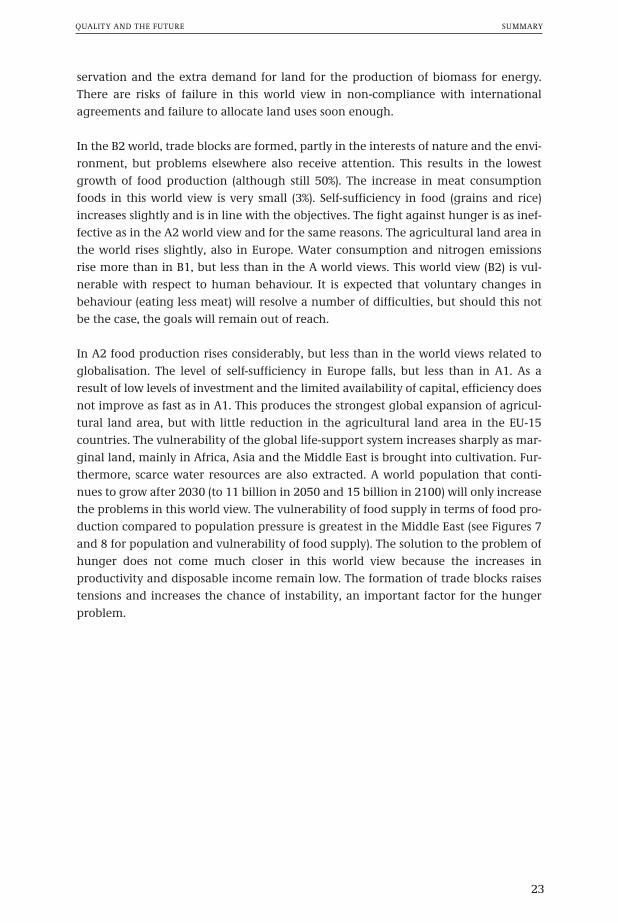
In A2 food production rises considerably, but less than in the world views related toglobalisation. The level of self-sufficiency in Europe falls, but less than in A1. As aresult of low levels of investment and the limited availability of capital, efficiency doesnot improve as fast as in A1. This produces the strongest global expansion of agricul-tural land area, but with little reduction in the agricultural land area in the EU-15countries. The vulnerability of the global life-support system increases sharply as mar-ginal land, mainly in Africa, Asia and the Middle East is brought into cultivation. Fur-thermore, scarce water resources are also extracted. A world population that conti-nues to grow after 2030 (to 11 billion in 2050 and 15 billion in 2100) will only increasethe problems in this world view. The vulnerability of food supply in terms of food pro-duction compared to population pressure is greatest in the Middle East (see Figures 7and 8 for population and vulnerability of food supply). The solution to the problem ofhunger does not come much closer in this world view because the increases in productivity and disposable income remain low. The formation of trade blocks raisestensions and increases the chance of instability, an important factor for the hungerproblem.
QUALITY AND THE FUTURE SUMMARY
23
How does the Dutch population influence global sustainability?The Netherlands uses an area of land elsewhere that is 2.5 times the size of theNetherlands itself for the consumption of forest and agricultural products. TheNetherlands contains 0.3% of the world’s population and contributes to 0.3% of the lossof global biodiversity. The Dutch population uses 0.2% of all the cultivated land in theworld (and 0.1% of the total land area). The use of highly productive land makes theglobal landuse of the Dutch people smaller than average.
Almost 4% of the European population lives in the Netherlands. The Dutch people con-tribute to 2% of the loss of biodiversity in Europe. Within the Netherlands, 60% of theloss of biodiversity is caused by consumers in the Netherlands; the remainder is cau-sed by production for export. Apparently, the Netherlands allows foreign consumers’footprints on its own land area, despite the already high population density.
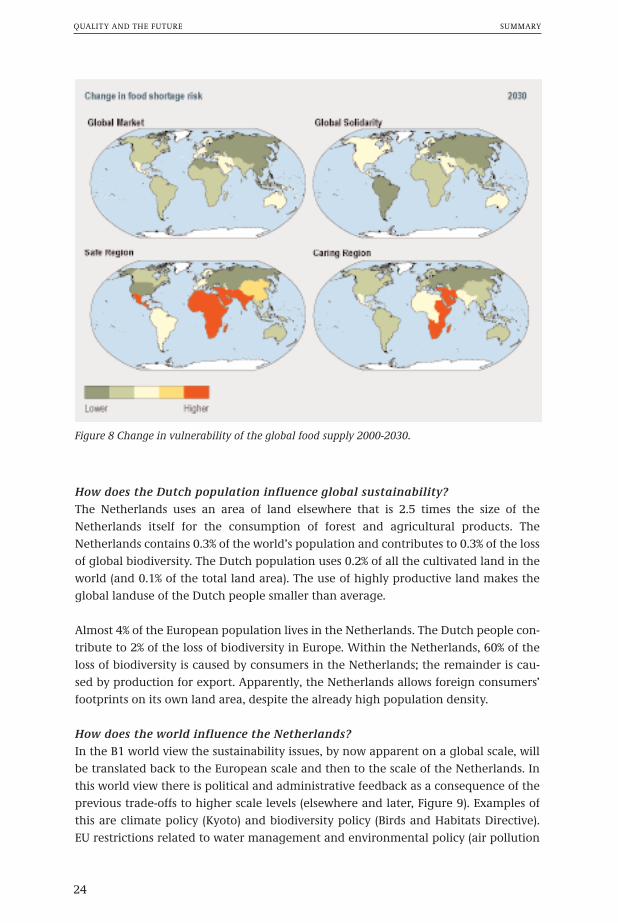
How does the world influence the Netherlands?In the B1 world view the sustainability issues, by now apparent on a global scale, willbe translated back to the European scale and then to the scale of the Netherlands. Inthis world view there is political and administrative feedback as a consequence of theprevious trade-offs to higher scale levels (elsewhere and later, Figure 9). Examples ofthis are climate policy (Kyoto) and biodiversity policy (Birds and Habitats Directive).EU restrictions related to water management and environmental policy (air pollution
QUALITY AND THE FUTURE SUMMARY
24
Figure 8 Change in vulnerability of the global food supply 2000-2030.
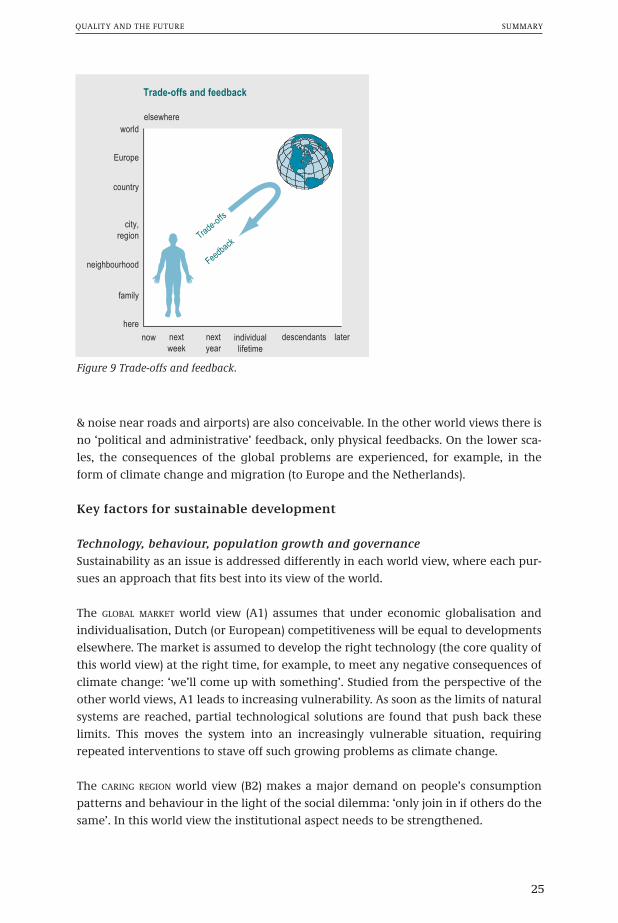
& noise near roads and airports) are also conceivable. In the other world views there isno ‘political and administrative’ feedback, only physical feedbacks. On the lower sca-les, the consequences of the global problems are experienced, for example, in theform of climate change and migration (to Europe and the Netherlands).
Key factors for sustainable development
Technology, behaviour, population growth and governanceSustainability as an issue is addressed differently in each world view, where each pur-sues an approach that fits best into its view of the world.
The GLOBAL MARKET world view (A1) assumes that under economic globalisation andindividualisation, Dutch (or European) competitiveness will be equal to developmentselsewhere. The market is assumed to develop the right technology (the core quality ofthis world view) at the right time, for example, to meet any negative consequences ofclimate change: ‘we’ll come up with something’. Studied from the perspective of theother world views, A1 leads to increasing vulnerability. As soon as the limits of naturalsystems are reached, partial technological solutions are found that push back theselimits. This moves the system into an increasingly vulnerable situation, requiringrepeated interventions to stave off such growing problems as climate change.
The CARING REGION world view (B2) makes a major demand on people’s consumptionpatterns and behaviour in the light of the social dilemma: ‘only join in if others do thesame’. In this world view the institutional aspect needs to be strengthened.
QUALITY AND THE FUTURE SUMMARY
25
Trade-offs and feedback
elsewhere
now later
here
family
nextweek
nextyear
individuallifetime
descendants
neighbourhood
city,region
country
Europe
world
FeedbackTrade-offs
Figure 9 Trade-offs and feedback.
The SAFE REGION world view (A2) shields itself from the threatening environment (‘clashof civilizations’). It seeks security and certainty through reduced dependence on areasoutside the Netherlands (fewer imports), employment protection, less immigrationand more security measures. The attempt to limit population growth by closing theborders, however, is counterproductive because the formation of blocks prevents‘modernisation’ in some parts of the world. As a consequence the levels of populationgrowth and poverty elsewhere remain high, which in turn leads to greater pressureon the borders.
The GLOBAL SOLIDARITY world view (B1) relies heavily on the increasing ability of interna-tional institutions and international agreements to manage all the factors that collec-tively influence the pressure on collective goods: population, consumption patternsand technology development. The risk of failure in the B1 world view is the capacity,or lack of it, to manage these political and administrative processes at the global levelwithout lapsing into the creation of an enormous bureaucracy.
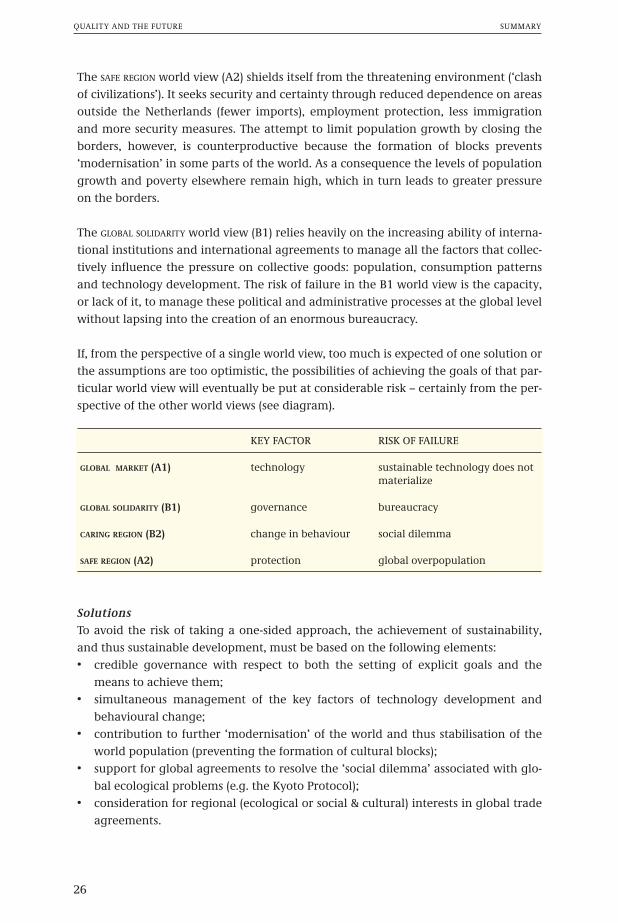
If, from the perspective of a single world view, too much is expected of one solution orthe assumptions are too optimistic, the possibilities of achieving the goals of that par-ticular world view will eventually be put at considerable risk – certainly from the per-spective of the other world views (see diagram).
Solutions To avoid the risk of taking a one-sided approach, the achievement of sustainability,and thus sustainable development, must be based on the following elements:• credible governance with respect to both the setting of explicit goals and the
means to achieve them;• simultaneous management of the key factors of technology development and
behavioural change;• contribution to further ‘modernisation’ of the world and thus stabilisation of the
world population (preventing the formation of cultural blocks);• support for global agreements to resolve the ‘social dilemma’ associated with glo-
bal ecological problems (e.g. the Kyoto Protocol);• consideration for regional (ecological or social & cultural) interests in global trade
agreements.
QUALITY AND THE FUTURE SUMMARY
26
KEY FACTOR RISK OF FAILURE
GLOBAL MARKET (A1) technology sustainable technology does not materialize
GLOBAL SOLIDARITY (B1) governance bureaucracy
CARING REGION (B2) change in behaviour social dilemma
SAFE REGION (A2) protection global overpopulation
The GLOBAL SOLIDARITY world view (B1) provides starting points for blunting the sharpedges of the A1 strategy. The increasing power of international organisations such asthe UN and the WTO makes international rules more effective. There is a risk thatexpectations of the effectiveness of international decision making are too high. Underthe subsidiarity principle, this would mean that decisions are better taken at a lowerlevel, for example, at the EU level, or by individual countries (a shift in the direction ofthe B2 world). This analysis demonstrates a European scale that seems to be reasona-bly effective for a mode of governance geared to achieving sustainability through thedeployment of technical solutions, such as the distribution of ecological pressures andoptimisation of (sustainable) energy production.
A sustainability strategy based entirely on the B2 world is, however, in some respectsrather risky. In the 2000–2040 period this world shows a significantly lower incomegrowth. In addition, adherents to other world views find the expectations for volunta-ry behavioural change unrealistically high.
In addition, there is a risk that the open Dutch economy will be sidelined if the econo-my ‘goes it alone’. In principle, this risk can be reduced by placing the choice of socie-tal goals within a European framework. As an economic block, the EU is less open andin a better position to make a conscious choice for specifically European values, towhich solidarity, good public services, and attention to ecology and the non-materialaspects of life might belong.
QUALITY AND THE FUTURE SUMMARY
27
Literature
Brundtland Commission (1987). Our CommonFuture. World Commission on Environ-ment and Development, Oxford UniversityPress, Oxford.
CPB (2003). Four Futures for Europe. CentraalPlanbureau, The Hague.
Fukuyama, F. (1992). The end of history andthe last man. Free Press.
Huntingdon, S. (1997). The clash of civiliza-tions and the remaking of world order. Si-mon & Schuster, New York
QUALITY AND THE FUTURE LITERATURE
28