Embed Size (px)
Citation preview

Summary of Natural Catastrophe Events 2020
Willis Re eVENTTM Update
Insured losses and economic impact due to natural disasters
Volume 9

Natural Catastrophes in 2020 i

Natural Catastrophes in 2020 ii
Table of contents Major natural catastrophes in 2020 per region based on insured losses ..................................................... iii
Contact us ..................................................................................................................................................... iv
Introduction.................................................................................................................................................... 1
1. In focus .................................................................................................................................................. 3
2. Major natural catastrophes in 2020 ....................................................................................................... 8
3. Other natural catastrophe events by peril and location ....................................................................... 51
Abbreviations ............................................................................................................................................ 65
Sources ...................................................................................................................................................... 65

Natural Catastrophes in 2020 iii
Major natural catastrophes in 2020 per region based on insured losses
*The man-made explosion at Beirut port is included in the map due to its impact.

Natural Catastrophes in 2020 iv
Contact us
John E. Alarcon, Ph.D., M.Sc.
Executive Director
Catastrophe Analytics, Willis Re International
Willis Re
Willis Ltd I 51 Lime Street I London EC3M 7DQ
D +44 (0) 20 3124 8678
Prasad Gunturi, M.Sc.
Executive Vice President
Catastrophe Analytics, Willis Re North America
Willis Re
8400 Normandale Lake Blvd, Suite 1700 I
Bloomington, MN 55437
D +1 952 841 6641
Yingzhen Chuang
Regional Director
Catastrophe Analytics, Willis Re International
Willis Re
Willis Ltd I 51 Lime Street I London EC3M 7DQ
D +44 (0) 20 7558 9340
Vaughn Jensen
Executive Vice President
Catastrophe Analytics, Willis Re North America
Willis Re
8400 Normandale Lake Blvd, Suite 1700 I
Bloomington, MN 55437
D +1 952 841 6641
With special thanks to the eVENT™ summary response team:
Roy Cloutier (NA, Minneapolis) | Natasha Denn (APAC, Ipswich) | Charlie Mariner (APAC, Ipswich) |
Alexander Paul (EMEA N/E, Ipswich) | Laura Lin (EMEA N/E, Ipswich) | Ricarda Linz (EMEA N/E,
Munich) | Marc Beeg (EMEA N/E, Munich) | Nigel Moreira (EMEA N/E, Mumbai) | Satish Sharma
(EMEA N/E, Mumbai) | Sarah Lochhead (EMEA W/S, London) | Sophie Barratt (EMEA W/S, London) |
Matt Day (EMEA W/S, London) | Bethany Young (LAC, London) | Nikil Pujari (NA, Mumbai)
willistowerswatson.com I willisre.com
January 2021
Natural Catastrophes in 2020 1
Introduction
This report summarizes economic and insured losses from the most relevant natural catastrophe
events that occurred during 2020. The loss values presented herein include those reported by
Willis Re, catastrophe model vendors, reinsurance companies and third-party organizations. Loss
estimates are presented in U.S. dollars (USD), for which rates of exchange at December 1, 2020,
have been used.
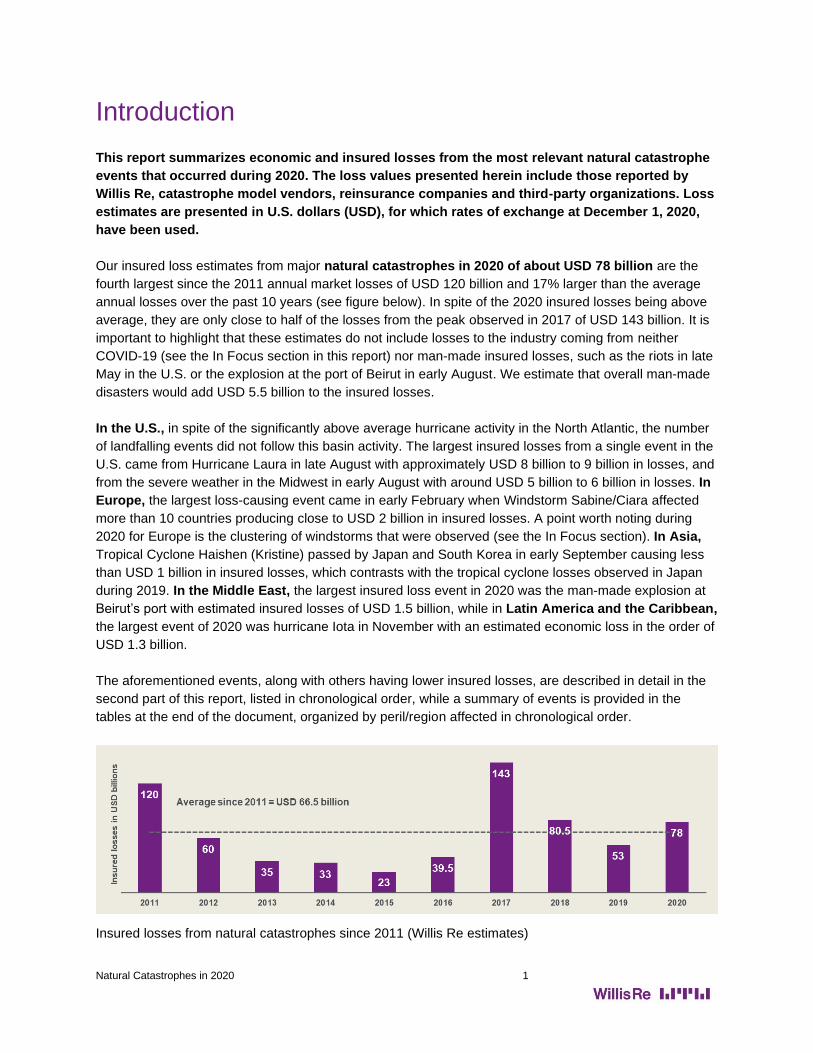
Our insured loss estimates from major natural catastrophes in 2020 of about USD 78 billion are the
fourth largest since the 2011 annual market losses of USD 120 billion and 17% larger than the average
annual losses over the past 10 years (see figure below). In spite of the 2020 insured losses being above
average, they are only close to half of the losses from the peak observed in 2017 of USD 143 billion. It is
important to highlight that these estimates do not include losses to the industry coming from neither
COVID-19 (see the In Focus section in this report) nor man-made insured losses, such as the riots in late
May in the U.S. or the explosion at the port of Beirut in early August. We estimate that overall man-made
disasters would add USD 5.5 billion to the insured losses.
In the U.S., in spite of the significantly above average hurricane activity in the North Atlantic, the number
of landfalling events did not follow this basin activity. The largest insured losses from a single event in the
U.S. came from Hurricane Laura in late August with approximately USD 8 billion to 9 billion in losses, and
from the severe weather in the Midwest in early August with around USD 5 billion to 6 billion in losses. In
Europe, the largest loss-causing event came in early February when Windstorm Sabine/Ciara affected
more than 10 countries producing close to USD 2 billion in insured losses. A point worth noting during
2020 for Europe is the clustering of windstorms that were observed (see the In Focus section). In Asia,
Tropical Cyclone Haishen (Kristine) passed by Japan and South Korea in early September causing less
than USD 1 billion in insured losses, which contrasts with the tropical cyclone losses observed in Japan
during 2019. In the Middle East, the largest insured loss event in 2020 was the man-made explosion at
Beirut’s port with estimated insured losses of USD 1.5 billion, while in Latin America and the Caribbean,
the largest event of 2020 was hurricane Iota in November with an estimated economic loss in the order of
USD 1.3 billion.
The aforementioned events, along with others having lower insured losses, are described in detail in the
second part of this report, listed in chronological order, while a summary of events is provided in the
tables at the end of the document, organized by peril/region affected in chronological order.
Insured losses from natural catastrophes since 2011 (Willis Re estimates)

Natural Catastrophes in 2020 2
Largest insured losses from single Natural Catastrophe events during 2020. Note the top eight are USA
related though it is key to note their losses are significantly lower than those from recent past years such
as Hurricanes Harvery, Irma or Maria in 2017 or the California Wildfires in 2018.

Natural Catastrophes in 2020 3
1. In focus
Seasonality: TC activity can be measured in multiple
ways; these can include activity in the WNP basin as a
whole or landfalls. The number of TCs in the WNP
basin so far (23) is close to the seasonal average
(approximately 25) while the zero-landfall count for
Japan during 2020 highlights that landfalls are not
wholly correlated to basin activity.
The absence of landfalls in Japan (Figure 1) highlights
that general seasonality and weather-related steering
conditions still form a part of how a TC season can
impact a given country.
Figure X: Tropical cyclone activity in the WNP basin,
recorded as tracks (Kinetic Corp.) observed 7 TCs
bypass Japan to the west and to the south.
The 2020 Japan tropical cyclone season
2018 – 2019: The zero landfall season for Japan in 2020
comes as a stark contrast to the activity in 2018 and 2019.
Historical landfall observations (Figure 2) indicate that 2018
and 2019 were not exceptional compared with historical
averages, and that zero landfalls do occur (2020, 2008 and
1988).
The tropical cyclone (TC) season within the Western North Pacific (WNP) basin came to an end in 2020
just below the historical average in terms of TC frequency after a slow start to the year. In Japan no
TCs made landfall, in contrast to recent seasons where activity was close to or slightly above average.
0
1
2
3
4
5
6
7
8
19
51
19
52
19
53
19
54
19
55
19
56
19
57
19
58
19
59
19
60
19
61
19
62
19
63
19
64
19
65
19
66
19
67
19
68
19
69
19
70
19
71
19
72
19
73
19
74
19
75
19
76
19
77
19
78
19
79
19
80
19
81
19
82
19
83
19
84
19
85
19
86
19
87
19
88
19
89
19
90
19
91
19
92
19
93
19
94
19
95
19
96
19
97
19
98
19
99
20
00
20
01
20
02
20
03
20
04
20
05
20
06
20
07
20
08
20
09
20
10
20
11
20
12
20
13
20
14
20
15
20
16
20
17
20
18
20
19
20
20
Num
ber
of la
ndfa
lls
Categorization of historical landfalls in Japan by central pressureCat1
Cat2
Cat3
Cat4
One of the key learnings from previous seasons with events such as Typhoon Jebi is that loss experience is
not exclusively driven by the landfalling TC intensity but is heavily dependent on where the TC makes landfall;
but first, landfall must take place.
Figure 1. Tropical cyclone activity in the WNP
basin, recorded as tracks (Kinetic Corp.),
observed seven TCs bypass Japan to the west
and to the south
Figure 2. Willis Re landfall analysis of IBTrACS observed activity by equivalent Saffir-Simpson hurricane scale and view of
average annual landfall (black dotted line)

Natural Catastrophes in 2020 4
Latin America and Caribbean: Highest number of storms on record
In the Latin America and
Caribbean region, the losses
and impacts of natural
catastrophes were notably low
in 2020. The largest losses
may not be from natural
catastrophes but from COVID-
19, which were intensified by
the hurricane season.
For the 2020 season, the
National Oceanic and
Atmospheric Administration
(NOAA) recorded 30 named
storms, of which 13 became
hurricanes, including six major
hurricanes. This is the most storms on record, surpassing the 28 from 2005, and the second-highest
number of hurricanes recorded.
Considering the number of storms during 2020, only a few notable hurricanes in the 2020 season affected
the Latin America and Caribbean region, in particular, hurricanes Eta and Iota, which caused catastrophic
flooding over Central America. Iota made landfall in Nicaragua on November 17 as a powerful Category 4
and affected an area that had been hit by Eta, also a Category 4, less than two weeks before, with
hundreds of casualties. It was the first time on record the Atlantic has had two major hurricane formations
in November at a time of year when the season is normally winding down. In Central America, Eta and
Iota caused unprecedented chaos in the region, which was already affected by COVID-19 conditions,
creating a humanitarian crisis that has left thousands of people without homes and at a constant risk of
contracting the virus.
In the lead-up to January 1, 2021 renewals, one of the main discussion points in the industry has been
the reinsurance market’s reactions to COVID-19. From a life perspective, COVID-19 has been a
challenge for many companies in the region. Pandemic is often excluded from life treaties; generally,
legislation across Latin America requires that the cover is interpreted in favor of the insured with the onus
on insurers to prove the application of any exclusions; however, depending on the country, death rates for
people under age 60 have been higher than the expected. This has resulted in more life insurance claims
in the insured population compared with other regions. Additionally, we will see COVID-19 continue to
play a role in renewal discussions, as many portfolios in the region have had difficulties quantifying the
final impact due to a delay in the reporting of losses because of extended lockdowns.
Figure 3. 2020 activity versus average activity for the years 1950 – 2011 (Source: Willis Re eVENT Report)

Natural Catastrophes in 2020 5
The U.S. in 2020: A year that broke many records
In the U.S., 2020 industry losses were well above average annual loss (2010 to 2020), with at least
19 events exceeding USD 1 billion and two events exceeding USD 5 billion. In contrast, 2019 had
only four events greater than USD 1 billion, whereas 2018 and 2017 had not more than 12 events
each exceeding USD 1 billion.
The year’s most significant severe thunderstorm insured loss
event was an outbreak across the northern Midwest regions of
the U.S. producing multiple rounds of thunderstorms between
August 8 and 11 (Figure 4). A powerful derecho (a particular
kind of storm) swept across the region bringing strong wind
from Nebraska through the Ohio Valley. Some locations
reported wind gusts over 100 mph. In addition, there were 15
tornadoes across northeastern Illinois, several affecting the
Chicago metropolitan area. Economic losses for this event are
estimated to be between USD 5 billion to 10 billion (NOAA).
The 2020 Atlantic hurricane season was the most active with 30
named storms, including 13 hurricanes and six major hurricanes.
This makes 2020 the most active season on record, breaking the
previous record of 28 storms set back in 2005 (NOAA). Among
the year’s most significant insured loss events for U.S. regions
are Hurricane Laura, Hurricane Sally, Hurricane Delta, Hurricane
Zeta and Tropical Storm Isaias. Total insured losses for these
five events exceeded USD 15 billion. Hurricane Laura made
landfall as a Category 4 hurricane near Cameron, Louisiana
(Figure 5) with maximum sustained winds of 150 mph and a
minimum central pressure of 938 mb. All the other mentioned
hurricanes made landfall as Category 2 on the U.S. coastlines.
2020 was only the second year in history that Greek letter names
were used as storm names after exhausting the usual rotating list
of 21 names (2005 is the only other year this has been done), and
it marked a record fifth consecutive year with at least one
Category 5 hurricane. It was also the fifth consecutive above-
average Atlantic hurricane season from 2016 onward.
The 2020 wildfire season was highly active in comparison with
2019. There were as many as 17 wildfire events this year (PCS).
Severe thunderstorms in the month of August ignited wildfires
across California, Oregon and Washington. Of the 17 wildfire
events, four of them (LNU Lighting, CZU Lighting, Beachie Creek
and Glass Fire) caused insured losses exceeding $7 billion. In
total, these four events burned more than 600,000 acres of land. The LNU Lighting Complex Fire (Figure
6), August 17 to September 16, is believed to have been caused by nearly 11,000 lightning strikes that
occurred within a 72-hour span. According to CalFire, the 2020 wildfire season saw around 10,488
structures destroyed and more than 31 fatalities.
Figure 5. Hurricane Laura’s path as of August 28, 2020 (Source: NOAA)
Figure 4. Thunderstorm reported on August 10, 2020 (Source: SPC, NOAA)
Figure 6. FEMA extent of the LNU Lighting Wildfire (source: FEMA Geospatial Resource Center)

Natural Catastrophes in 2020 6
Pan-European windstorms drive 2020 EMEA NatCat insured losses
The main driver of Europe, Middle East and Africa (EMEA) NatCat losses in 2020 was extratropical
cyclone activity (ETC), notably storms Ciara and Dennis. However, the year was also
characterized by exceptional subtropical storms, particularly Alpha and Ianos, affecting Portugal
and Greece during the summer season.
Reflections on potential European windstorm clustering
At the peak of the 2019/2020 storm
season in February, Northwestern
Europe experienced several significant
windstorms in short succession, with
storms Ciara, Ines, Dennis and Jorge
all occurring within a two-week period.
Clusters of this type have the potential
to cause large economic and insured
losses as a result of accumulated
precipitation and wind damage. This
was demonstrated in 2020 by the U.K.
experiencing its wettest February on
record, partially due to the impact of
Storm Ciara, followed by a series of
smaller low-pressure frontal systems and culminating with impacts from Storm Dennis. Heavy rainfall
persisted within the two-week period, which caused severe flooding from otherwise moderate events.
Regulators are increasingly showing interest over the material impact of windstorm clustering for capital
requirements. The February succession of windstorms this year acts as a reminder of the importance of
efficient insurer systems to manage and distinguish concurrent peak events, for both claim handling and
regulatory reporting.
Evolving windstorm risk in Southern Europe?
While much focus in the European windstorm market is
generally placed on extratropical systems, 2020 has also
highlighted the potential impacts of strong subtropical
storms in Southern Europe. The 2020 windstorm season
saw two notable but rare subtropical events, Storm Alpha
and Medicane Ianos. Storm Alpha was the most easterly
for the formation of an Atlantic named storm and the first
tropical or subtropical cyclone recorded to have hit
Portugal. Medicane Ianos was a particularly strong
tropical-like system that skirted southern Italy and peaked
just prior to landfall in Greece.
While these systems did not lead to significant insured
losses of the likes of Ciara or Dennis, they do highlight
the potential damaging impacts of powerful subtropical
storms affecting Mediterranean regions. While future climate models predict a reduction in the frequency
of medicane events specifically, their severity is expected to increase, making these an important
consideration for the Southern European insurance market.
Figure 8. Subtropical Storm Alpha impacting Portugal (EOSDIS)
Figure 7. U.K. winter 2020 rainfall rates (Met Office)

Natural Catastrophes in 2020 7
COVID-19 pandemic The ongoing COVID-19 pandemic has dominated the global news throughout 2020. The
coronavirus was first identified in Wuhan, China, before the World Health Organization (WHO) was
notified of the outbreak on December 31, 2019. Government interventions, including national
lockdowns, have been seen across the globe, with many countries implementing different levels
of restrictions.
COVID-19
COVID-19 is the disease caused by a new
coronavirus called SARS-CoV-2, which causes
respiratory illness. Global government
interventions have tried to curb the spread of the
virus, most commonly national lockdowns, work-
from-home orders, and the closures of
nonessential businesses and schools.
Variants of the strain have been reported in
multiple countries, including the U.K. when the
SARS-CoV-2 variant was announced on
December 14, 2020.
As of today, multiple countries have approved several vaccines against the COVID-19 disease. In the
West, the U.K. was first to do this on December 2, 2020, when the Pfizer vaccine was approved for mass
use, while currently the AstraZenca and Moderna vaccines have also been approved in Western
countries.
Global economic effects
The COVID-19 pandemic escalated worldwide only a few short weeks after the WHO was notified. Many
sources were predicting the global economy would suffer its worst recession since World War II.
Government restrictions to minimize the risk caused by COVID-19 have triggered steep downturns in
economic growth.
The pandemic is still ongoing, and thus the full scale of the effects will not be seen for years to come due
to the impact seen across a wide number of global industries.
Insured losses so far
Willis Re has published multiple
reports covering the ongoing
pandemic, which are available online.
To date, the actual losses booked in
2020 amount to 23 billion, and the
average industry loss estimate is 68
billion, assuming full development
of losses, which may take years.
Specific details on these numbers
can be found through your Willis
Re account executive or our
website.
Figure 2. Booked losses and industry loss estimates Source: Company disclosures, Dowling & Partners, Barclays Research, Autonomous Research, BofA Global Research, Lloyd’s, Berenberg, Moody’s, Willis Towers Watson
1: Willis Towers Watson’s $32 billion to $80 billion estimate corresponds to its Moderate to Severe scenarios. Willis Towers Watson has also published Optimistic and Limited Success scenarios. These
are represented by the hashed portions of the WTW bar and widen the range to $11 - $140 billion.
Figure 1. Timeline of COVID-19 responses (Brookings)

Natural Catastrophes in 2020 8
2. Major natural catastrophes in 2020
ST Midwest U.S.A. January 10 to 12, 2020
Midwest & Southern U.S.A.
Insured losses
(in USD millions)
▪ <1,000 (PCS)
Timeline and meteorology
▪ An upper level trough positioned over the western-
central U.S. moved eastward, an area of low
pressure at the surface began to organize and
strengthen over the central-southern Plains.
▪ Thunderstorms when severe, formed a squall line,
producing hail (1-1.75 inches in diameter) and 50-
60+ mph wind gusts across much of the southern
Plains.
Impact
▪ Tornadoes were reported in Missouri, Arkansas,
Oklahoma and Texas and had caused damage to
property and power lines.
▪ In total during the two-day span, over 550 wind and
at least 12 tornado reports were submitted to the
National Weather Service’s Storm Prediction
Center.
▪ Close to 70,000 properties were affected by power
outages.
Thunderstorm reported on January 11 (source:
SPC, NOAA)

Natural Catastrophes in 2020 9
EQ Turkey January 24, 2020
Turkey
Magnitude: 6.7
Depth: 11.9 km
Insured losses
(in USD million)
▪ Unknown
Economic Losses
(in USD million)
▪ 40% probability of losses between 100 and 1000 (USGS)
Fatalities
▪ 41 (AFAD)
Timeline and Seismology
▪ On 24th January 2020 at 20:55 (local time), a Mw 6.7 earthquake struck eastern Turkey. The earthquake was felt widely across eastern Turkey, with significant damage caused in the immediate surroundings of the epicenter (USGS).
▪ The epicenter was located approximately 9km northeast of Doganyol district, at a depth of 11.9km, and occurred on the East Anatolian Fault (USGS).
▪ A number of aftershocks were detected, some having a magnitude greater than 4.0, with the largest being 5.1 that occurred on 25th January at 16:30 (local time) (Daily Sabah).
▪ The region has seen significant historical seismic activity with the last destructive earthquake being a Mw 6.1 in 2010, located ~100 km north east of the 24th January 2020 event.
Impact
▪ There were 41 fatalities and over 1,600 injured following the event (AFAD).
▪ Structural damage was reported up to 40 km from the epicenter, 19 towns and 200 villages were affected (Relief Web).
▪ During surveys following the earthquake, 81 buildings were found to be heavily damaged and 53 partially damaged while 30 structures had collapsed (Anadolu Agency).
USGS shaking intensity (MMI) footprint for the 24/01/20 Mw6.7 event

Natural Catastrophes in 2020 10
ST Southern U.S.A. February 5 to 8, 2020
South and Northeast U.S.A.
Insured losses
(in USD millions)
<1,000 (PCS)
Timeline and meteorology
▪ An upper level trough was located over the central U.S. and an area of low pressure at the surface, and its associated frontal boundaries began to strengthen over the lower Mississippi Valley.
▪ Hail measuring 1 to 1.75 inches in diameter and winds gusting to 50-60+ mph was observed across Arkansas, Louisiana, Mississippi, and Alabama.
▪ Localized areas of Louisiana, Mississippi, Alabama, Georgia, South Carolina, North Carolina, Tennessee, Kentucky, and Virginia received upwards of 3 to 5+ inches of rain throughout the day.
▪ A Winds gusting to 50-60+ mph was recorded across northern and central Florida, Alabama, Georgia, the Carolinas, and Virginia.
▪ The system moved fully into New England by the morning-afternoon hours on February 7th, bringing heavy rainfall and strong wind gusts (40-50+ mph) to Rhode Island and Massachusetts.
Impact
▪ Several tornadoes were reported in Mississippi and Alabama, which caused damage to buildings and power lines.
▪ Many properties were without electricity across the Southeast, Mid-Atlantic, and areas of the Northeast.
▪ Several other southern states were also hit hard by flooding, including Kentucky, South Carolina, and Tennessee. Flash flood emergencies were declared in Pickens County, South Carolina, where people had to be rescued from swamped homes and buildings.
Thunderstorm reported on February 6 (source:
SPC, NOAA)
Thunderstorm reported on February 7 (source:
SPC, NOAA)

Natural Catastrophes in 2020 11
WS Ciara/Sabine February 8 to 11, 2020
Austria, Belgium, Czech Republic, Denmark, France, Great Britain, Germany, Ireland, Netherlands, Norway, Switzerland
Insured losses
(in USD millions)
▪ 1,100 (Munich Re)
▪ 1,900 (PERILS)
▪ 2,200– 2,400 (Willis Re estimate)
Economic losses
(in USD millions)
▪ 1,800 (Munich Re)
Fatalities
▪ 14 (Insurance Journal)
Timeline and Meteorology ▪ On February 8th, 2020, an extratropical cyclone formed
in the Atlantic and developed into a powerful European windstorm.
▪ From February 9th to February 11th, the centre of the cyclone tracked eastward across the north of the UK with a minimum pressure of 950mb, and subsequently moved up the coast of Norway.
▪ Unusually high wind speeds inland of up to 130 km/h affected the UK, Germany, Denmark, northern France, Belgium and the Netherlands causing damage to buildings and power disruptions.
▪ Some regions including the UK and Netherlands were also hit by heavy rain with rainfall totals reaching 179.8 mm during the period, causing severe flooding (Met Office).
▪ Damaging winds were also experienced in Poland, Czech Republic and southern regions of Norway and Sweden.
Impact ▪ At least 13 fatalities were reported with three deaths in
the UK and Poland, two in Sweden and one in France, Germany, Italy, Slovenia and Switzerland (Insurance Journal).
▪ A wide area across the British Isles and Continental Europe was impacted by damaging wind gusts. Additionally, the conditions persisted unusually long for an extended period of over 48 hours in many countries (PERILS).
▪ >200 flights and several events were cancelled. Severe restrictions in the train traffic also occurred (NY Times).
▪ The city center of Hamburg and the Altona fish market were flooded by 2.6 m of water (Federal Maritime and Hydrographic Agency).
▪ Windstorm Ciara/Sabine represents the largest loss from a European Windstorm since Friederike in 2018. The majority of insurance losses (>600mn USD) were reported in Germany (PERILS).
Storm Ciara/Sabine, Peak Wind Gust
Footprint 9th Feb (source: Euro Tempest)

Natural Catastrophes in 2020 12
WS Dennis February 15 to 17, 2020
Belgium, Germany, Denmark, France, Luxembourg, United Kingdom, Republic of Ireland, Iceland, Norway, Sweden, Netherlands
Insured losses
(in USD millions)
▪ 372 (PERILS)
Fatalities
▪ 13 (PERILS)
Timeline and Meteorology ▪ 13th named storm in the 2019-2020 season ▪ Struck less than a week after storm Ciara ▪ Originating over the US, the storm was named by the
Met Office on the 11th of Feb (PERILS). ▪ The system underwent explosive cyclogenesis where
the system dropped rapidly to a low pressure of 920hPa and accelerated rapidly towards Europe (PERILS).
Impact ▪ Red warnings issued in the United Kingdom by the
Met Office ▪ 60,000 homes without power in France, 45,000 in the
UK, 3,500 in Ireland and 17,000 in Sweden (Perils) ▪ Travel disruptions and flight cancellations were seen
in all affected countries, mainly flights travelling to the UK were affected (PERILS).
▪ Severe flooding in the UK and Ireland, due to storm Ciara and Dennis being only 1 week apart.
▪ Record breaking number of Environment Agency flood warnings (Met Office).
Market Loss per CRESTA (PERILS)

Natural Catastrophes in 2020 13
FL UK February 2020
UK – Northern England, Wales, Ireland and Scotland
Industry Loss
(in GBP millions)
▪ 375 (PERILS)
Fatalities
▪ At least 2 deaths were reported as a result of flooding (Copernicus)
Timeline and Meteorology
▪ Record breaking rainfall on saturated grounds led to extensive river flooding across the UK, impacting Northern England, parts of Wales, Ireland and Scotland (PERILS).
▪ The heavy rainfall was associated with the storms: Ciara, Dennis and Jorge which all hit the UK successively in February 2020.
Impact
▪ It was the wettest February on record for England (Met Office) and the costliest flood event in the UK since the December 2015 winter floods (Copernicus).
▪ Properties, business and schools were flooded with widespread disruption to travel including flights, ferries and trains (JBA).
▪ Over 200 flood warnings were issued over England by the Environment Agency (JBA) with a deployment of over 6km of flood barriers and 90 mobile pumps (Environment Agency).
▪ Rivers in Wales and the West Midlands burst their banks, prompting immediate evacuations and left some communities cut off (Copernicus).
▪ Parts of Cumbria received nearly three quarters of February’s rainfall in 24 hours with approximately 550 properties affected (Floodlist).
▪ In Scotland, the River Nith burst its banks in areas of Dumfries causing widespread flooding (Floodlist).
▪ Coastal flooding in areas surrounding Dublin were recorded due to high waves and high tides (Floodlist).
Accumulated rainfall in mm for the UK Floods
of February 2020

Natural Catastrophes in 2020 14
ST Midwest U.S.A. March 2 to 4, 2020
Midwest & Southern U.S.A.
Insured losses
(in USD millions)
▪ >1,000 (PCS)
Timeline and meteorology
▪ A cold frontal boundary extended from the Great Lakes southwestward through the southern Plains, advancing eastward, brought some rain showers and thunderstorms for the state of Missouri, Illinois, Kentucky, Tennessee, Mississippi, and Alabama.
▪ Hail measuring upwards of 2 to 2.5 inches in diameter was recorded in parts of Missouri and Tennessee.
▪ Strong wind gusts (50 to 60+ mph) were also recorded across parts of Missouri, Tennessee, and Kentucky.
Impact
▪ A few tornadoes were reported from the greater Nashville, TN area and caused numerous fatalities.
▪ Extensive damage to property and power lines occurred in localized areas.
▪ The National Weather Service in Birmingham said an EF0 tornado hit Hale County, south of downtown Greensboro.
▪ A State of Emergency was declared in Tennessee.
▪ Approximately, more than 100 buildings were damages.
▪ Close to 300,000 properties were affected by power outages.
Thunderstorm reported on March 2 (source:
SPC, NOAA)
Thunderstorm reported on March 4 (source:
SPC, NOAA)

Natural Catastrophes in 2020 15
EQ Zagreb March 22, 2020
Croatia
Magnitude: 5.3
Depth: 10 km
Insured losses
(in USD million)
▪ 64-80 (Croatian Insurance Bureau)
Economic Losses
(in USD million)
▪ 1,100 (Munich Re)
Fatalities
▪ 1 (The Guardian)
Timeline and Seismology
▪ On 22nd March 2020 at 06:24 (local time), a Mw 5.3 earthquake struck northern Croatia (USGS). The earthquake was felt widely within Zagreb, which was biggest in last 140 years (The Guardian).
▪ The epicenter was located approximately 7km north of Zagreb, at a depth of ~10 km (USGS).
▪ A number of aftershocks were detected, with the largest being Mw 4.9 that occurred on 22nd January at 07:00 (local time) (Geosciences).
▪ The region has not seen significant recent seismic activity with the last destructive earthquake being a Mw 6.9 in 1880, located in the vicinity of the 22nd March 2020 event (Geosciences).
Impact
▪ There was 1 fatality and over 16 individuals were injured as a result of the event (The Guardian).
▪ Structural damage was reported in an area of 165 km by 56 km, covering Zagreb and the surrounding region (Geosciences).
▪ During post-event surveys, 266,197 buildings were found to be damaged and 1,900 were designated as uninhabitable due to earthquake damage (Geosciences).
USGS shaking intensity (MMI) footprint for the 22/03/20 Mw5.4 event

Natural Catastrophes in 2020 16
ST Midwest U.S.A. March 27 to 30, 2020
Midwest & Southern U.S.A.
Insured losses
(in USD millions)
▪ >1,000 (PCS)
Timeline and meteorology
▪ A low-pressure system developed over the central
plains, created an unstable environment across
portions of central Plains and middle Mississippi
Valley
▪ Hails up to 1.75-inches were reported in regions of
Iowa, Illinois, Indiana, Kansas, Massachusetts and
Mississippi. Whereas, more than 2-inch hail were
reported in regions of Missouri, Ohio, Oklahoma,
Pennsylvania and West Virginia.
▪ Wind speeds up to 60, 70, 90 were reported in few in
regions of Kansas, Iowa, Kentucky.
Impact
▪ High winds were reported downing trees and power lines in many areas in the state of Illinois, Indiana, Kansas, Louisiana, New York, West Virginia.
Thunderstorm reported on March 28 (source:
SPC, NOAA)

Natural Catastrophes in 2020 17
FL Central and East Africa
March - May 2020
Rwanda, Uganda, Kenya, Somalia, Sudan, South Sudan, Democratic Republic of the Congo, Ethiopia, Tanzania and Burundi.
Overall losses in Rwanda, Uganda and Kenya
(in USD millions)
▪ >US$70 mn (Munich Re)
Fatalities in Rwanda, Uganda and Kenya
▪ Approx. 281 (Munich Re)
Timeline and Meteorology
▪ Floods lasted between March through to May 2020, the wettest period the region had seen since 1981 (OCHA).
▪ Heavier and widespread rainfall during the “long-rains” season lead to transboundary flooding across multiple countries (NASA).
▪ The 2019 October to December rains over East Africa were one of the wettest seasons on record (Wainwright et al., 2020).
▪ This was then followed by above average rainfall in January and February (Wainwright et al., 2020).
Impact
▪ The rising water levels caused overflow of rivers and mudslides, impacting vulnerable settlements along the riverbanks.
▪ Houses, roads and bridges were damaged or destroyed and crops were washed away.
▪ Above average rainfall promoted the breeding of locusts and caused an outbreak across the region, threatening the main season crops (OCHA).
▪ Over 200 people died in Kenya, impacting 29 of the country’s 47 counties. (Floodlist).
▪ Torrential rain caused flash flooding and landslides in Rwanda, killing over 60 people (Floodlist).
▪ 86,000 people were made homeless in the Democratic Republic of the Congo (OCHA).
▪ Uganda was impacted by several major flash flood events, with over 10,000 people affected in the district of Kasese by severe flooding in early May (Floodlist).
▪ Lake Victoria, Eastern Uganda, reached record breaking water levels due to the above average long rains and caused an evacuation of over 3,800 people (Floodlist/Wainwright et al., 2020).
▪ The heavy rain also causes landslides, one of which buried a two-story house, killing at least 10 people in Ethiopia (Floodlist).
Watersheds in Africa that experienced a flood watch (red), warning (orange), or advisory (green) conditions on May 5th and 6th as determined by model outputs from the ROSES A.37 “Advancing Access to Global Flood Modeling and Alerting” project.

Natural Catastrophes in 2020 18
ST Northeast U.S.A. April 7 to 9, 2020
Northeast & Midwest U.S.A.
Insured losses
(in USD millions)
▪ >1,000 (PCS)
Timeline and meteorology
▪ An upper level trough moving southeastward from the
Canadian Prairies towards the
Midwest region and at the surface, a low-pressure
system began to strengthen to the west of the Great
Lakes created severe thunderstorm produced hail
measuring upwards of 2-2.5 inches in diameter
across portions of Wisconsin and Michigan.
▪ Hail and strong wind gusts impacted West Virginia,
Virginia, North Carolina, Kentucky,
Tennessee, Ohio, Indiana, Illinois, Iowa and Missouri.
▪ Total rainfall from April 7th through the 9th reached 1
to 2+ inches in some areas of the impacted states
Impact
▪ Strong wind gusts also impacted parts of West
Virginia and Virginia.
▪ There were multiple reports of trees being knocked
down and causing damage to vehicles.
▪ Winds caused damage to residential structures and
commercial buildings.
▪ Strong wind up to 70 mph were experienced in New
Jersey also, leading to multiple reports of trees being
knocked down and leading to some isolated power
outages.
▪ Close to 80,000 properties were affected by power outages.
April 7 to 9, 2020
Thunderstorm reported on April 7 (source:
SPC, NOAA)
Thunderstorm reported on April 8 (source:
SPC, NOAA)

Natural Catastrophes in 2020 19
ST Northeast U.S.A. April 10 to April 14, 2020
Midwest & Southern U.S.A.
Insured losses
(in USD millions)
▪ >1,000 (PCS)
Fatalities: 16
Timeline and meteorology
▪ An upper level low over the Southwest slowly
progressed eastward and at the surface, moisture
moved into western Texas.
This combined with daytime heating helped create an
unstable airmass.
▪ Storms produced hail over portions of west Texas,
where golf ball size hail and larger fell over some
areas.
▪ Several strong tornadoes were observed in Louisiana,
Texas, Mississippi, Georgia, Tennessee, South
Carolina, and North
Carolina and produced extensive damage.
Impact
▪ Damaging wind gusts (50-60+ mph) also
occurred across all states in the Southeast and
southern Mid-Atlantic.
▪ Hail was mainly concentrated in northeastern Texas,
southern Oklahoma, Arkansas, northern Louisiana,
Arkansas, Mississippi, and Alabama and measured
upwards of 1-2 inches in diameter.
▪ Heavy rainfall produced flooding in several areas
across the Southeast
▪ Close to 1,400,000 properties were affected by power outages.
Thunderstorm reported on April 12 (source:
SPC, NOAA)
Thunderstorm reported on April 13 (source:
SPC, NOAA)

Natural Catastrophes in 2020 20
ST Southern U.S.A. April 18 to 20, 2020
Southern U.S.A.
Insured losses
(in USD millions)
▪ >1,000 (PCS)
Timeline and meteorology
▪ An upper level trough moving southeastward from the
Canadian Prairies towards the
Midwest region and a low-pressure system at surface,
lead to strengthening of storm to the west of the Great
Lakes.
▪ Severe thunderstorms produced hail measuring
upwards of 2-2.5 inches
in diameter across portions of Wisconsin and
Michigan.
Impact
▪ A Hail and strong wind gusts impacted West Virginia, Virginia, North Carolina, Kentucky, Tennessee, Ohio, Indiana, Illinois, Iowa and Missouri.
▪ Large hail (2 to 2.5+ inches) and 40 to 60+ mph winds were recorded in parts of Arkansas, Alabama, Mississippi and Georgia.
▪ Close to 75,000 properties were affected by power outages.
Thunderstorm reported on April 19 (source:
SPC, NOAA)

Natural Catastrophes in 2020 21
ST Southern U.S.A. April 21 to 24, 2020
Southern U.S.A.
Insured losses
(in USD millions)
▪ >1,000 (PCS)
Fatalities: 1
Timeline and meteorology
▪ An area of low pressure formed near the Texas Panhandle and several discrete thunderstorms cells formed during this time and moved southeastward across Oklahoma and northern Texas.
▪ Hail up to 1.75 inches was reported in regions of Arkansas, Georgia and Louisiana.
▪ Hail up to 2 to 2.75 inches was reported in regions of Oklahoma and Texas.
▪ Wind gust up to 70 mph were reported in Florida. Impact
▪ Many reports of shingles blown off roofs, windows blown out, and damage to home and vehicles according to NWS.
▪ Close to 20,000 properties were affected by power outages.
Thunderstorm reported on April 22 (source:
SPC, NOAA)
Thunderstorm reported on April 23 (source:
SPC, NOAA)

Natural Catastrophes in 2020 22
ST Southern U.S.A. April 24 to 26, 2020
Southern U.S.A.
Insured losses
(in USD millions)
▪ >1,000 (PCS)
Timeline and meteorology
▪ Low-pressure system took shape over the southern plains on as an upper-level trough was set up over the Plains region.
▪ Strong winds, large hail and a couple tornadoes primarily impacted areas from eastern Texas and eastern Oklahoma into northern Louisiana and Arkansas.
Impact
▪ Wind gust up to 70 mph were reported in these few regions of Florida and Oklahoma.
▪ Large hail of greater than 2 inches were significantly reported in Oklahoma, Colorado, Illinois, Nebraska and Pennsylvania, Indiana.
▪ Strong to severe storms again developed within the warm sector of this system, impacted areas from the Mid-South into the Carolinas.
Thunderstorm reported on April 24 (source:
SPC, NOAA)
ST Southern U.S.A. April 27 to 30, 2020
South and Northeast U.S.A.
Insured losses
(in USD millions)
▪ >1,000 (PCS)
Timeline and meteorology
▪ A system moved across the western U.S. towards the Central Plains and a dry line developed across central/western Texas, resulted in severe thunderstorms in the region.
▪ The storms resulted in scattered, large hail across north-central Texas.
▪ Heavy rainfall resulted in flash flooding across areas of lower Mississippi Valley.
▪ There were multiple reports of hail greater than 2 inches across central and eastern Oklahoma.
Impact
▪ Damaging wind gusts and heavy rainfall continued across the region and one tornado was reported near Gretna, Florida.
▪ High winds of up to 70 mph knocking down trees and power lines were reported in several cities including Benton, Cabot, Greenwood, Hope, Jacksonville, Jonesboro, Little Rock and Russellville.
Thunderstorm reported on April 28 (source:
SPC, NOAA)

Natural Catastrophes in 2020 23
ST Southern U.S.A. May 2 to 3, 2020
Southern U.S.A.
Insured losses
(in USD millions)
▪ >1,000 (PCS)
Timeline and meteorology
▪ A strengthening storm system gradually moved southeastward into northwestern Kansas resulted in rain showers and thunderstorms over central-eastern Kansas.
▪ There were multiple reports of trees being knocked down including Huntsville, Florence, and Athens.
Impact
▪ Hail up to 2 to 2.75 inches were reported in regions of Arkansas and up to 1.75 inches in region of Tennessee and Missouri.
▪ Close to 130,000 properties were affected by power outages.
▪ Damages have also been caused by downed trees and power lines in these regions.
Thunderstorm reported on May 3 (source:
SPC, NOAA)
ST Southern U.S.A. May 4 to 5, 2020
Southern U.S.A.
Insured losses
(in USD millions)
▪ >1,000 (PCS)
Timeline and meteorology
▪ A frontal system moved out of the central Rockies and into the northern Plains which produced isolated thunderstorms across the northern and central Plains.
▪ Storms resulted in strong wind gusts as high as 70 mph and widespread, large hail, with some reports of hail up to 2” in regions of Kansas damaged many property and vehicles.
Impact
▪ Hail ranging from 1 to 1.75 were reported in Missouri, South Carolina and Tennessee.
▪ Winds brought down trees in multiple locations causing damage to vehicles and property.
▪ Reports of significant damage to roofs and siding on residential and commercial buildings throughout the areas have been received.
Thunderstorm reported on May 4 (source:
SPC, NOAA)

Natural Catastrophes in 2020 24
ST Southern U.S.A. May 16 to 21, 2020
South and Northeast U.S.A.
Insured losses
(in USD millions)
▪ >1,000 (PCS)
Timeline and meteorology
▪ An upper level trough positioned over the central US helped to produced multiple areas of severe weather across the Great Plains and Midwest.
▪ The severe thunderstorm brought heavy rainfall, hail, and strong wind gusts to southern Oklahoma and central-eastern Texas.
▪ Flooding occurred throughout the Midwest, particularly for areas of Michigan.
Impact
▪ Heavy rainfall and some scattered thunderstorms also began to impact Virginia and the Carolinas by May 18, resulting in additional flooding.
▪ Large hail greater than 2 inches in diameter impacted portions of central Florida overnight, as well as some stronger wind gusts.
▪ EF-0, EF-1 tornado was reported in states of Texas with wind speed of 85 to 95 mph.
▪ Reports of significant damage to roofs and siding on residential and commercial buildings throughout the areas have been received.
Thunderstorm reported on May 16 (source:
SPC, NOAA)

Natural Catastrophes in 2020 25
ST Southern U.S.A. May 20 to 24, 2020
Southern U.S.A.
Insured losses
(in USD millions)
▪ >1,000 (PCS)
Timeline and meteorology
▪ A small area of upper-level energy moved into northern Texas combined with strong daytime heating resulted in some severe thunderstorms which developed over northern central Texas by the afternoon.
▪ Thunderstorm spread into central Texas, bringing more hail, strong wind gusts, and heavy rainfall.
▪ Additional storms progressed from the low-pressure area along a stationary frontal boundary positioned into the Southeast.
Impact
▪ Hail and strong wind gusts were reported from Illinois and Indiana. Several tornadoes were also reported from northern-central Illinois.
▪ A weak frontal boundary extended eastward from the upper-central Ohio River Valley to the Carolinas, resulting in some strong wind gusts in those areas.
▪ Hails up to 1.75 inches in diameter were reported in regions of Arkansas, Georgia, Indiana, and Texas, whereas about up to 2.75 inches were reported in Oklahoma and South Carolina and a maximum of 4 inches hail was reported in regions of Texas.
▪ A Local media has reported that repair shops and roofing companies are busy due to the hail activity.
▪ Reports of significant damage to roofs and siding on residential and commercial buildings throughout the areas have been received.
Thunderstorm reported on May 22 (source:
SPC, NOAA)
Thunderstorm reported on May 24 (source:
SPC, NOAA)
Natural Catastrophes in 2020 26
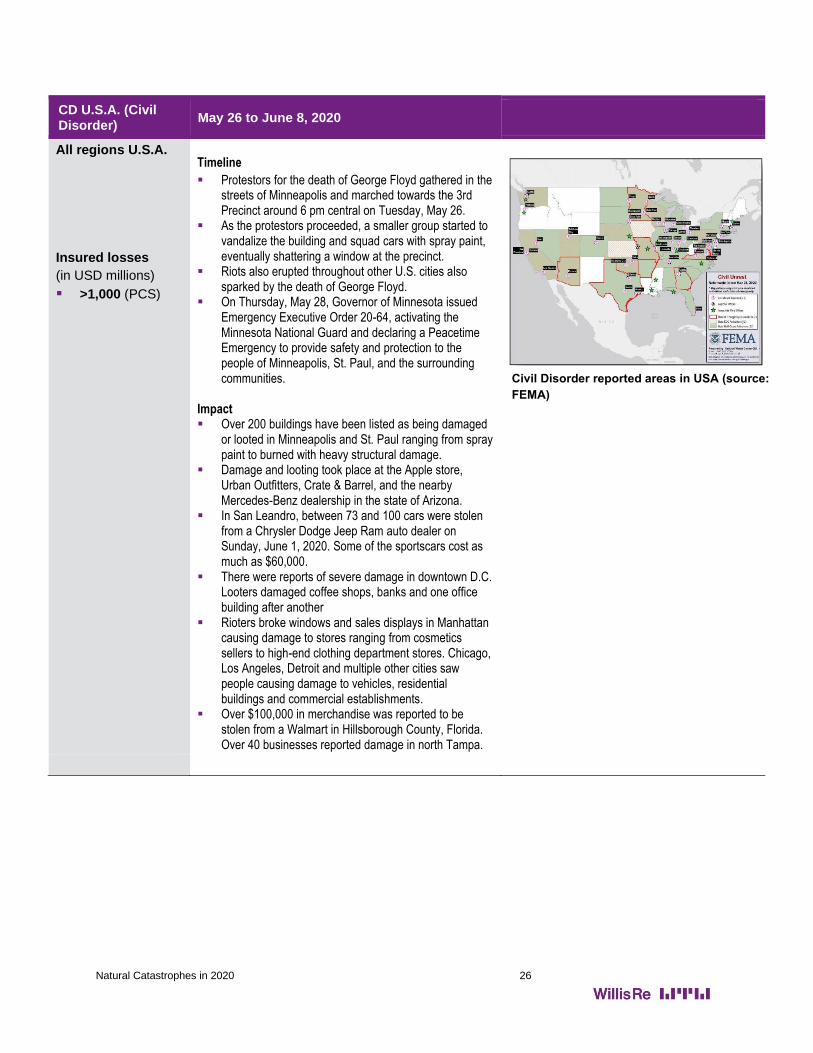
CD U.S.A. (Civil Disorder)
May 26 to June 8, 2020
All regions U.S.A.
Insured losses
(in USD millions)
▪ >1,000 (PCS)
Timeline
▪ Protestors for the death of George Floyd gathered in the streets of Minneapolis and marched towards the 3rd Precinct around 6 pm central on Tuesday, May 26.
▪ As the protestors proceeded, a smaller group started to vandalize the building and squad cars with spray paint, eventually shattering a window at the precinct.
▪ Riots also erupted throughout other U.S. cities also sparked by the death of George Floyd.
▪ On Thursday, May 28, Governor of Minnesota issued Emergency Executive Order 20-64, activating the Minnesota National Guard and declaring a Peacetime Emergency to provide safety and protection to the people of Minneapolis, St. Paul, and the surrounding communities.
Impact ▪ Over 200 buildings have been listed as being damaged
or looted in Minneapolis and St. Paul ranging from spray paint to burned with heavy structural damage.
▪ Damage and looting took place at the Apple store, Urban Outfitters, Crate & Barrel, and the nearby Mercedes-Benz dealership in the state of Arizona.
▪ In San Leandro, between 73 and 100 cars were stolen from a Chrysler Dodge Jeep Ram auto dealer on Sunday, June 1, 2020. Some of the sportscars cost as much as $60,000.
▪ There were reports of severe damage in downtown D.C. Looters damaged coffee shops, banks and one office building after another
▪ Rioters broke windows and sales displays in Manhattan causing damage to stores ranging from cosmetics sellers to high-end clothing department stores. Chicago, Los Angeles, Detroit and multiple other cities saw people causing damage to vehicles, residential buildings and commercial establishments.
▪ Over $100,000 in merchandise was reported to be stolen from a Walmart in Hillsborough County, Florida. Over 40 businesses reported damage in north Tampa.
Civil Disorder reported areas in USA (source:
FEMA)

Natural Catastrophes in 2020 27
ST Texas U.S.A. May 27 to 28, 2020
Texas U.S.A.
Insured losses
(in USD millions)
▪ >1,000 (PCS)
Timeline and meteorology
▪ A low-pressure system intensified over the southern Plains and lower Mississippi Valley aiding in increased instability over central Texas and widespread thunderstorms.
▪ The stronger storm cells also resulted in high wind gusts to the northwest of near Houston
Impact
▪ A total of 188 high wind and large hails were reported in Texas.
▪ Large hail up to 2.75 inches in diameter were reported in the region.
▪ Wind gust up to 80 mph were reported causing downed trees and power lines.
ST Northeast U.S.A. June 2 to 3, 2020
Northeast U.S.A.
Insured losses
(in USD millions)
▪ >1,000 (PCS)
Timeline and meteorology
▪ An area of low pressure and its associated frontal boundaries extended across the Great Lakes region.
▪ Hail measuring upwards of 2-2.5 inches in diameter, 50-60+ mph wind gusts, and localized heavy rainfall were observed in central-southern portions of the state.
▪ A strong wind gusts and localized heavy rainfall impacted Pennsylvania and New Jersey.
Impact
▪ Reports of significant damage to roofs and siding on residential and commercial buildings throughout the areas have been received.
▪ Damages have also been caused by downed trees and power lines.
▪ Vehicle damages include broken windshields, mirrors and extensive body damage.
▪ Close to 250,000 properties were affected by power outages throughout the region.
Thunderstorm reported on May 27 (source:
SPC, NOAA)
Thunderstorm reported on June 3 (source:
SPC, NOAA)

Natural Catastrophes in 2020 28
ST Midwest U.S.A. June 5 to 11, 2020
Midwest U.S.A.
Insured losses
(in USD millions)
▪ >1,000 (PCS)
Timeline and meteorology
▪ An a broad upper-level trough moved ▪ over the western US, extending inland leading to
strong wind gusts (50-60+ mph) impacting parts of the Great Basin-Intermountain West region.
▪ Some scattered showers and thunderstorms also formed over parts of Utah, Colorado, and Wyoming.
▪ A Widespread strong wind gusts and hail measuring 1-1.75 inches impacted Utah, Colorado, Wyoming, the Dakotas, and Nebraska.
Impact
▪ Localized heavy rainfall caused flash flooding in some areas, and a few tornadoes were also reported from South Dakota.
▪ Wind speeds up to 110 mph were reported in state of Colorado, whereas up to 80 mph were recorded in Indiana, North and South Dakota.
▪ Major hail affected region were, Minnesota, North and South Dakota, Nebraska and Utah reporting up to 2.5 inches of hail.
▪ Close to 100,000 properties were affected by power outages throughout the region
Thunderstorm reported on June 6 (source:
SPC, NOAA)

Natural Catastrophes in 2020 29
ST Midwest U.S.A. July 10 to 12, 2020
Midwest U.S.A.
Insured losses
(in USD millions)
▪ >1,000 (PCS)
Timeline and meteorology
▪ An area of low pressure and its associated frontal boundaries advanced from the northern-central Plains into the Midwest during the afternoon and evening hours.
▪ A line of severe thunderstorms impacted parts ▪ of the Dakotas into Nebraska, resulting in large
hail up to 3 inches in diameter in parts of southwestern South Dakota and central Northeast.
Impact
▪ Largest hail up to 3.25 inches in diameter were reported in South Dakota and 2.75 inches in Iowa. In other regions hails ranging from 1.75 to 1.25 inches were reported in Illinois and Indiana.
▪ Two tornadoes of maximum wind speed of 110 mph touched down in the state of South Dakota.
▪ Close to 40,000 properties were affected by power outages throughout the region.
Thunderstorm reported on July 11 (source:
SPC, NOAA)

Natural Catastrophes in 2020 30
STS Isaias July 30 to August 05, 2020
South & Northeast U.S.A.
Insured losses
(in USD millions)
▪ >1000 (PCS) ▪ 3000-5000
(RMS) Fatalities: 1
Timeline and Meteorology ▪ Tropical Cyclone Nine was declared by the National
Hurricane Center (NHC) on Tuesday, July 28th, nearly 600 miles east of the Leeward Islands. Later on, July 29th, the system was declared Tropical Storm Isaias.
▪ On 30th the system strengthened and officially became hurricane, but next day despite Isaias reaching its maximum intensity of 85 mph sustained winds Isaias ultimately began to weaken, becoming a tropical storm by the evening hours, prior to tropical storm force winds reaching southern Florida.
▪ Tropical storm conditions impacted the east coast of Florida, including gusty winds, heavy rainfall, flash flooding, and storm surge.
▪ On 3rd August by the evening hours, Isaias had regained hurricane strength and made landfall near Ocean Isle Beach, North Carolina.
▪ Tropical storm-force winds, heavy rainfall, flash flooding, and storm surge impacted the Mid-Atlantic region, and several tornadoes were also reported from North Carolina, Virginia, Maryland, Delaware, and New Jersey.
▪ Post-tropical Cyclone Isaias shifted to the north of New England and into Eastern Canada during the overnight hours into August 5th.
Impact ▪ The large amount debris not only slowed traffic, it also
led to power outages in Connecticut. ▪ Torrential rain and damaging winds have buffeted South
Carolina leading to flooding in multiple locations. ▪ The Florida Governor stated the state is anticipating
power outages from Isaias while officials are working to prepare shelters for people to be safe while being mindful of social distancing.
▪ New Jersey Governor Phil Murphy issued a state of emergency for New Jersey starting at 5 am on Tuesday, 2nd August.
▪ Broken trees and wind led to power outages throughout the state, while falling branches and debris also damaged vehicles and homes in across affected regions.
▪ Close to 1,000,000 properties were affected by power outages throughout the affected regions.
Wind speed and path of Tropical Storm Isaias (source: NASA, NHC)
Tropical storm Isaias’s path as of August 2 (source: NOAA)

Natural Catastrophes in 2020 31
Beirut Explosion 4 Aug 2020
Lebanon
Economic losses
(in USD millions)
▪ $4.6 - 7.5bn
(WBG / ACAL)
Insured losses
(in USD millions)
▪ $1.5bn (ACAL)
Fatalities
▪ 220 (OCHA)
The Port of Beirut explosion was a notable man-made
event and is included here due to the significant impact
on property and marine insurance.
Timeline
▪ On Tuesday 4th August 2020 at 18:07 local
time a fire was closely followed by an
explosion at the Port of Beirut.
▪ The explosion was caused by 2,750 tonnes
of ammonium nitrate improperly stored in a
warehouse since 2013.
▪ A state of emergency was declared in Beirut
for two weeks following the event.
Impact
▪ The explosion destroyed the port creating a
125-meter-wide crater.
▪ Reports indicate the blast caused >6,500
injuries and >300,000 homeless (WBG).
▪ The port is the critical link in the supply chain
for Lebanon handling 60% of Lebanon’s
imports and storing both food and medical
reserves. It is also one of the top 10 seaports
in the Mediterranean handling approximately
1,300,000 containers a year (POB) with the
explosion causing supply-chain losses and
loss of cargo.
▪ The explosion exacerbated ongoing civil
unrest, socio-economic crisis and the
COVID-19 pandemic.
▪ Property insurers bore the brunt of insured
losses (ACAL) with additional significant
marine and cargo losses.
Aftermath of the Port of Beirut explosion (Insurance
Journal)
Damage Proxy Map (ARIA/EOS) – damage grades
from dark red (severe damage or total collapse) to
yellow (moderate or partial damage).
1km N

Natural Catastrophes in 2020 32
ST Midwest U.S.A. August 8 to 11, 2020
Midwest U.S.A.
Insured losses
(in USD millions)
▪ >1,000 (PCS)
Timeline and meteorology
▪ An upper level trough was positioned over the Northwest U.S.- Western Canada this feature combined with regional instability and moisture helped to produce multiple rounds of severe thunderstorms for the northern Midwest.
▪ Locally heavy rainfall, hail measuring 1 to 1.5”, and 50-60+ mph wind gusts impacted Minnesota and the upper Midwest-Plains at the start of this storm.
▪ Toward later part of this storm, a derecho swept across the region bringing strong wind from Nebraska through the Ohio Valley.
Impact
▪ Some locations in Iowa reported wind gusts over 110 mph and brought hail of 1-2” across parts of the region.
▪ Wind speeds up to 80, 70 and 65 were reported in regions of Minnesota, Nebraska and Wisconsin.
▪ Close to 400,000 properties were affected by power outages throughout the region
Thunderstorm reported on August 9 (source:
SPC, NOAA)
Thunderstorm reported on August 10 (source:
SPC, NOAA)

Natural Catastrophes in 2020 33
WF Beachie Creek August 16 to October 10, 2020
Oregon, U.S.A.
Insured losses
(in USD millions)
▪ >1,000 (PCS)
▪ 150-500 (RMS) Fatalities: Unknown
Timeline
▪ The Beachie Creek Wild Fire was first detected on August 16, 2020 approximately 2 miles south of Jaw Bones flats in rugged terrain deep in the Opal Creek Wilderness.
▪ The fire grew slowly but consistently and was roughly 200 acres by September 1st, fueled by hot and dry conditions.
▪ The winds were 50-75 miles per hour, and the fire growth rate was about 2.77 acres per second in areas of the Beachie Creek fire.
▪ The unique wind event on September 7th created an extreme environment in which the fire was able to accelerate.
▪ A new fire start began at the Incident Command Post forcing immediate evacuation of the Team and fire personnel.
▪ From the night of September 7th, these fires became collectively known as the Santiam Fire
▪ At the end of the wind event, the Lionshead Fire also merged with the Beachie Creek Fire having burned through the Mount Jefferson Wilderness.
Impact
▪ At the beginning of October, seasonal fall weather moved over the fire producing several inches of rain.
▪ During these weeks, a BAER (Burned Area Emergency Response) team assessed the burned landscape and habitats to try to evaluate damage.
▪ On October 8th, PNW Team 8, a Type 2 team took over
management of the fire. Focus efforts on the ground shifted
from suppression and mop-up to suppression repair.
▪ The acreage topped out at close to 190,000 acres. Closures remain in place to keep the public safe from hazards like falling trees and ash pits that can remain hot and smolder for months after the wildfire event.
Extent of the Beachie Creek Wildfire (source: InciWeb)

Natural Catastrophes in 2020 34
WF LNU Lightning Complex
August 17 to September 16, 2020
California, U.S.A.
Insured losses
(in USD millions)
▪ >1,000 (PCS)
▪ 750-1,100 (RMS) Fatalities: 5
Timeline
▪ The LNU Lightning Complex Wild Fire Napa, Sonoma, Lake, Yolo, and Solano Counties started on Monday August 17.
▪ The complex fire included the Hennessey, Gamble, 15-10, Spanish, Markley, 13-4, 11-16, and Walbridge Fires.
▪ Many of the fires are believed to have been caused by lightning strikes as northern and central California began experiencing an unusually active sequence of largely dry lightning strikes earlier in the wee.
▪ Some reports indicate that nearly 11,000 lightning strikes occurred in California in a 72-hour time span.
▪ The LNU Lightning Complex Fire was fully contained on Friday October 2.
Impact
▪ The LNU Lightning Complex had burned 363,220 acres and has destroyed 1,491 structures and damaged a further 232 structures.
▪ 64,600 residents had been evacuated from San Mateo, Santa Cruz counties.
▪ Mandatory evacuations had been ordered for all non-essential personnel on Travis Air Force
▪ The largest portion is the Hennessey Fire, which is burning in Lake and Napa counties, in which, 305,651 acres have burned.
▪ The LNU Lighting Complex is the fourth-largest wildfire in California.
FEMA extent of the LNU Lighting Wildfire (source: FEMA Geospatial Resource Center)
FEMA extent of the LNU Lighting Wildfire (source: FEMA Geospatial Resource Center)

Natural Catastrophes in 2020 35
WF CZU Lightning Complex
August 17 to September 22, 2020
California, U.S.A.
Insured losses
(in USD millions)
▪ >1,000 (PCS)
▪ 1,500-2,500 (RMS)
Fatalities: 1
Timeline
▪ The CZU August Lightning Complex Fire in the counties of Santa Cruz and San Mateo started on Tuesday August 18.
▪ The complex fire included the Waddell Fire, Warrenella Fire, 5-14 Fire, 5-15 Fire, and 5-18 Fire.
▪ Many of the fires are believed to have been caused by lightning strikes as northern and central California began experiencing an unusually active sequence of largely dry lightning strikes earlier in the week.
▪ Some reports indicate that nearly 11,000 lightning strikes occurred in California in a 72 hour time span.
▪ The CZU Lightning Complex Fire was fully contained on Wednesday September 23.
Impact
▪ The CZU Lightning Complex had burned 86,509 acres of land and destroyed 1,490 structures and damaged 140 further structures.
▪ The Big Basin Redwoods State Park has been badly damaged by the fires, according to the California Parks and Recreations Department.
▪ According to the San Mateo County park system, the fires have burned an estimated 2,800 acres of Pescadero Creek County Park, but did not reach Memorial Park or Sam McDonald County Park.
▪ On September 3, the director of Santa Cruz County Public Works reported that the CZU fire has caused an estimated US$310 million in damage to private infrastructure, which includes homes, and US$30 million in damage to public infrastructure.
RMS extent of the CZU Lighting Wildfire (source: RMS)

Natural Catastrophes in 2020 36
HU Laura August 26 to 28, 2020
Southern U.S.A.
Category 4 at landfall
Insured losses
(in USD millions)
▪ >1000 (PCS) ▪ 9,000-13,000
(RMS) ▪ 4,000-8,000
(AIR) Fatalities: Unknown
Timeline and Meteorology ▪ On August 21st, Tropical Depression Thirteen was
upgraded to Tropical Storm Laura. Laura impacted parts of the northern Leeward Islands, the Virgin Islands, and Puerto Rico.
▪ Laura became a major hurricane (Category 3) during the morning on the 26th and continued its strengthening trend.
▪ By the afternoon-evening, Laura became a dangerous Category 4 hurricane, reaching maximum sustained winds of 150 mph and a minimum central pressure of 938 mb.
▪ Laura made landfall at this intensity near Cameron, LA just after midnight on Thursday, August 27th.
▪ Hurricane-force winds impacted northern-coastal Texas and southern-central Louisiana, particularly the Lake Charles, LA area.
▪ Tropical storm-force winds extended into eastern Texas, northern Louisiana, southern Arkansas, and western Mississippi.
▪ Laura had later weakened to a tropical storm over north-central Louisiana and south-central Arkansas.
Impact ▪ Governors’ had declared a state of emergency ahead of
Hurricane Laura in states of Arkansas, Louisiana, Mississippi and Texas.
▪ The main rail line and industry lead tracks around Lake Charles, Louisiana, were out of service after the storm. They suffered heavy damage during the storm and the company had issued embargoes.
▪ Hurricane toppled more than 1,000 massive towers with the high voltage transmission lines, damaged water and wastewater systems and knocked out cell towers that provide mobile phone service.
▪ According to the Louisiana Oil Spill Coordinator’s Office, roughly 15,000 gallons of crude oil were spilt just east of Cameron during Hurricane Laura.
▪ The I-10 was shut down in Louisiana due to a chemical fire that broke out.
▪ Close to 1,000,000 properties were affected by power outages throughout the affected regions.
Wind speed and path of Hurricane Laura (source: NASA, NHC)
Hurricane Laura’s path as of August 26 (source: NOAA)

Natural Catastrophes in 2020 37
HU Sally September 14 to 18, 2020
Southern U.S.A.
Category 2 at landfall
Insured losses
(in USD millions)
▪ >1000 (PCS) ▪ 2,000-3,500
(RMS) ▪ 1,000-3,000
(AIR) Fatalities: Unknown
Timeline and Meteorology ▪ On September 11th, a tropical depression nineteen
formed off the southeast coast of Florida bringing gusty winds and heavy rain across the southern Florida peninsula.
▪ By the afternoon, the storm was upgraded to Tropical Storm Sally as it moved into the Gulf of Mexico, bringing tropical storm conditions to southern Florida.
▪ Sally continued to track west-northwest toward Louisiana and had strengthened, becoming a hurricane, with maximum sustained winds reaching 100 mph, a strong Category 2 Hurricane.
▪ Tropical storm-force winds and heavy rainfall began to impact coastal areas of Mississippi, Alabama, and the Florida Panhandle.
▪ Sally was later downgraded to a tropical storm. Which continued moving northeastward and later by 6th, it was downgraded to a tropical depression.
▪ Heavy rainfall and dangerous flooding continued to be the major impact in regions of Georgia and northern Florida.
Impact ▪ Alabama, Louisiana and Mississippi were approved for
an emergency disaster declaration from FEMA, ▪ A state of emergency was declared for Escambia and
Santa Rosa counties in the Florida Panhandle. ▪ Heavy rainfall has brought flooded streets to numerous
areas in parts of southern and central Georgia. ▪ Flash flooding was reported in many areas throughout
South Carolina on Thursday. ▪ Reports of power lines and trees blown down across
multiple areas of the state from significant wind gusts. ▪ Close to 400,000 properties were affected by power
outages across the affected regions.
Wind speed and path of Hurricane Sally (source: NASA, NHC)
Hurricane Laura’s path as of August 2 (source: NOAA)

Natural Catastrophes in 2020 38
MD Ianos (Medicane)
September 17 to 19, 2020
Greece, Italy
Insured losses
(in USD millions)
▪ Unknown
Economic losses
(in USD millions)
▪ >180m (Greek Ministry of Infrastructure and Transport)
Fatalities
▪ 4+ (BBC)
Timeline and Meteorology ▪ ‘Medicanes’ are rare storms with tropical characteristics, such
as a distinctive eye feature, that develop over the Mediterranean Sea.
▪ From September 17th to 19th, Medicane Ianos tracked northeastwards across the Ionian Sea, causing flash flooding and strong winds across western and central Greece, before moving south over Crete.
▪ Rainfall intensity reached rates of 23 mm/hr during the period the storm affected the island of Cephalonia and significant flash flooding also occurred in the region surrounding Karditsa city (GEER).
▪ Wind gusts of up to 120 km/hr were recorded in the city of Karditsa (BBC).
▪ Using satellite techniques, the Geotechnical Extreme Events Reconnaissance organisation mapped >1,400 landslides that occurred during the event (GEER).
Impact ▪ Four fatalities were reported to have occurred due to flash
flooding (BBC). ▪ >5,000 structures were damaged in Karditsa city as a result of
flash flooding (BBC). ▪ Significant infrastructure damage occurred with flash flooding
leading to the collapse of many bridges and landslides damaging roads and railway networks across Thessaly (GEER).
▪ Significant crop losses occurred, particularly in the region of Thessalia, caused by heavy rain and flooding and to which the Greek government responded with >180m USD in monetary relief for compensation and repairs (USDA) (EN24).
Medicane Ianos, 17th Sept (source:
EOSDIS)

Natural Catastrophes in 2020 39
WF Glass Fire September 27 to October 19, 2020
California, U.S.A.
Insured losses
(in USD millions)
▪ >1,000 (PCS)
▪ 1,500-3,000 (RMS)
Fatalities: Unknown
Timeline
▪ The Glass Fire began on September 27 forcing tens of thousands of people to evacuate in Napa and Sonoma Counties.
▪ The fire ignited in Napa County and later expanded quickly into Sonoma County.
▪ Nearly all residents of Calistoga were forced to evacuate as the Glass Fire made its way towards the city, causing severe damage to wineries along its path.
▪ Glass Fire was fully contained as of 09:00 UTC on Thursday October 22
Impact
▪ According to CalFire update from October 20th, the
Glass Fire had burned 67,484acres across Napa and
Sonoma Counties.
▪ The Glass Fire impacted 1,837 structures in which
1,555 of the structures were destroyed and 282 of the
structures were damaged.
▪ The Santa Rosa Fire Department said the smoke
generated over 60 911 calls & multiple reports to their
closest Fire Station.
▪ Governor issued an emergency proclamation for Napa
and Sonoma counties due to the Glass Fire.
▪ According to media reports, there were 27 Napa Valley wineries that saw some type of structural damage caused by the Glass Fire, a figure that far exceeds that of the 2017 fires which had burned six Napa wineries.
Extent of the Beachie Creek Wildfire (source: napacounty. maps)

Natural Catastrophes in 2020 40
WS Alex-Brigitte 30 Sep - 03 Oct 2020
United Kingdom, Spain, Portugal, France, Italy, Austria, Poland, Czech Republic
Insured losses
(in USD millions)
▪ 340 (FFA & CCR) for both flood and storm losses
Fatalities
▪ At least 5 deaths reported (CCR)
Timeline and Meteorology ▪ Early-season extratropical cyclone. ▪ The storm was named on the 30th September by
AEMET and Meteofrance. ▪ The storm underwent explosive cyclogenesis before
landfall (Meteofrance). ▪ A Mediterranean episode was triggered by the advection
of Mediterranean air northwards where the coastal topography produced a heavy rainfall in southeast France (WMO).
Impact ▪ Red weather alerts were sent out across regions of
France (Meteofrance). ▪ Italy had 630 mm of rain in 24 hours, and France saw
500mm in the same period (Floodlist). ▪ Wind gusts have reached up to 115 mph in parts of
France (NOAA). ▪ 100,000 homes in Brittany without power (NOAA). ▪ Landslides, bridge collapses and roads were destroyed
by the flood aftermath in Italy and France (floodlist).
Precipitation of Storm Alex over Europe (Ventusky)

Natural Catastrophes in 2020 41
FL France and Italy 02-04 October 2020
France, Italy
Insured losses
(in USD millions)
▪ 252m (CCR & FFA)
Fatalities
▪ At least 5 deaths reported and 20 missing (CCR)
Timeline and Meteorology
▪ Windstorm Alex caused heavy flooding in the Alpes-Maritimes region in southeastern France and regions of Northern Italy.
▪ Italy had 630 mm of rain in 24 hours, and France saw 500mm in the same period (Floodlist).
Impact
▪ The estimated insured loss of €210 million is split between homes (72%), professional and agricultural property (25%) and cars (3%) (CCR & FFA).
▪ A total of 14,000 flood related claims are expected to be filed in France (CCR & FFA).
▪ Major flooding impacted the regions around rivers Roya, Boréon and Vésubie which completely destroyed more than 100 locations. The river discharge in these areas exceeded the 100-year return period for such an event. An example of the increased river flows is the increase on la Vésubie at Utelle from 5 m3/s to over 640 m3/s (CCR).
▪ A section of the bridge over the Sesia river in Piedmont's Vercelli province collapsed (BBC).
▪ In Italy, the Fire Department carried out 2,500 interventions in Piedmont, Liguria and Lombardy (Floodlist).
Flood Map of Alpes-Maritime obtained from satellite data.
Flood map of the Sesia river in Piedmont obtained from satellite data.

Natural Catastrophes in 2020 42
HU Delta October 9 to 12, 2020
Southern U.S.A.
Category 2 at landfall
Insured losses
(in USD millions)
▪ >1000 (PCS) ▪ 2,000-3,500
(RMS) ▪ 1,000-3,000
(AIR) Fatalities: Unknown
Timeline and Meteorology ▪ On October 4th, Tropical Cyclone Twenty-Six was declared
by the National Hurricane Center (NHC) on the south of Jamaica.
▪ It was upgraded to Tropical Storm Delta. Overnight, which continued to rapidly intensify, becoming a Category 2 Hurricane, with sustained winds of 110 mph and a minimum central pressure of 962 mb.
▪ Delta made landfall as a category 2 hurricane, with sustained winds of 100 mph, near Creole, Louisiana.
▪ Delta brought very heavy rain, especially across portions of southern Louisiana, where some locations received over a foot of rain.
▪ Storm surge levels reached just over 5 feet in Sabine Pass, TX and Calcasieu Pass, LA.
Impact ▪ More than 3,000 National Guardsmen were supporting
emergency operations and about 25% of utility customers in the state of Louisiana had no power.
▪ Several power lines have been reported down in Natchez and Adams County, Mississippi and some communities are still blocked from travel by downed trees.
▪ Multiple trees have been reported down in Gwinnett county, Georgia.
▪ An EF-1 tornado was reported in Columbus county, South Carolina which damaged buildings on 7 Creeks Highway.
▪ Large swells and rip currents prompted beach closures as far west as the mouth of the Rio Grande, Texas.
▪ Close to 150,000 properties were affected by power outages across the affected regions
Wind speed and path of Hurricane Delta (source: NASA, NHC)
Hurricane Delta’s path as of October 9 (source: NOAA)

Natural Catastrophes in 2020 43
HU Zeta October 28 to 29, 2020
Southern U.S.A.
Category 2 at landfall
Insured losses
(in USD millions)
▪ >1000 (PCS) ▪ 3,000-5,000
(RMS) ▪ 1,500-3,500
(AIR) Fatalities: Unknown
Timeline and Meteorology ▪ On October 25th, Tropical Depression Twenty-Eight was
named in the western Caribbean Sea, about 250 miles south of Cuba.
▪ The storm was upgraded to Tropical Storm Zeta on the 25th with maximum sustained winds around 40mph, with tropical storm-force winds extending 80 miles from the center. Zeta was upgraded to a Category 1 hurricane. Later, hurricane Zeta strengthened to a Category 2 hurricane as it approached the southeastern LA coastline and made landfall. with max sustained winds near 110 mph.
▪ Wind gusts measured at 90 to 100+ mph were recorded along the coast as the center of Zeta moved over New Orleans, LA and towards the MS coast.
▪ Dangerous storm surge flooded the northern Gulf Coast, with storm surge up to 10 ft impacting
Impact ▪ Multiple areas throughout the state of Alabama had trees
being uprooted causing damage to residential/commercial buildings as well as to automobiles.
▪ Morgan city’s drainage pump system broke down on October 25.
▪ Many businesses closed prior to the storm’s arrival in anticipation of the heavy winds in state of Mississippi.
▪ Winds over 50 mph caused trees to be knocked over and causing damage to power lines, residential/commercial structures, and vehicles in state of North and South Carolina.
▪ Close to 1,000,000 properties were affected by power outages across the affected regions.
Wind speed and path of Hurricane Zeta (source: NASA, NHC)
Hurricane Zeta’s path as of October 8 (source: NOAA)

Natural Catastrophes in 2020 44
EQ Aegean Sea October 30, 2020
Greece, Turkey
Magnitude: 7.0
Depth: 21.0 km
Insured losses
(in USD millions)
▪ 68 (PERILS)
Economic losses
(in USD millions)
▪ 35% probability
of losses
between 100
and 1000
(USGS)
Fatalities
▪ 119 (AFAD, BBC)
Timeline and Seismology
▪ On 30th October 2020 at 01:51 pm (local time – 11:51 UTC), a Mw 7.0 earthquake struck offshore, ~13 km north of Samos Island (Greece) and ~15 km south of the Turkish coast (USGS).
▪ The earthquake occurred as a result of normal faulting at a shallow crustal depth within the Eurasian Plate (USGS).
▪ A tsunami was generated, causing coastal flooding in port cities surrounding the epicenter with waves reaching a maximum height of 6 m and penetrating farthest inland about ~1.3 km. (Anadolu Agency).
▪ Within Izmir, the period of vibration of the predominant seismic waves was ~1 second, resulting in 10-14 storey height structures undergoing greater shaking and contributing significantly to observed building collapses.
Impact
▪ The earthquake caused significant structural damage in the surrounding region with the Turkish city of Izmir being particularly affected.
▪ In Turkey, 117 fatalities were reported, mainly due to building collapses. 13 buildings were reported to have been destroyed with >3000 heavily damaged (AFAD).
▪ In Greece, 2 fatalities occurred with some structural damage reported primarily in historical, unreinforced masonry buildings from the early 1900s. Notably the Church the Assumption of Mary in Karlovasi city was heavily damaged (CNN).
▪ Due to the destruction of homes, thousands were left homeless and seeking temporary shelter provided by AFAD, Izmir Municipalities, and NGOs. This however impacted the ongoing Covid-19 pandemic situation, increasing the risk of transmission (Relief Web).
USGS shaking intensity (MMI) footprint for the 30/10/20 Mw7.0 event

Natural Catastrophes in 2020 45
Australia Hail October 31st 2020
Queensland (QLD)
Insured Loss Estimate
(in USD millions)
▪ 905 (PERILS) Fatalities
0
Timeline and Meteorology
▪ 19th October: The Bureau of Meteorology (BoM) issued a forecast for potentially severe thunderstorm activity to impact Eastern Australia on the weekend of the 24th.
▪ 24th October: A large mass of tropical moist air combined with a stagnant upper level frontal trough system stretching from the Gulf of Carpentaria to Victoria. After bringing heavy rain to parts of Victoria, the system would eventually move east, triggering a multi-state, multi-day severe thunderstorm outbreak across Queensland (QLD) and New South Wales (NSW).
▪ 29th October: BoM forecast models indicated that a second frontal trough system could facilitate very severe thunderstorm conditions for QLD and NSW over the following weekend.
▪ 31st October: As predicted, an interaction between warm lower-level air to the east of the trough and cold upper-level air to the west would eventually generate giant hail and become known as the ‘Southeast Queensland Halloween Hailstorms’.
Impact
▪ On the afternoon of the 31st, supercell thunderstorms broke out to the west and south of Brisbane within the Ipswich and Logan City Council Areas, the Lockyer Valley, Scenic Rim and the Gold Coast.
▪ The largest hail was observed in Hillscrest (13 cm) and Forestdale (14 cm), the latter matching the largest recorded hail size on record.
▪ Other severely impacted localities included Adare, Amberley, Rosewood, Springfield and Boronia Heights. Hail measuring 7 cm was also recorded in Gympie, located 150 km north of Brisbane.
▪ In addition to hail, the supercells produced damaging wind gusts, with some gusts over 110 km/h recorded around Moreton Bay.
▪ The giant hail and strong winds caused widespread damage to motor vehicles and property (including roofs, windows, solar panels and collapsed ceilings).
Potential hail zone on 31st October extracted from radar imagery. Red (3-7 cm) and dark red (7+ cm) polygons depict localities with confirmed hail observations (Willis Re/BoM).
The largest hail stones were observed in Hillcrest
(top) and Forestdale (bottom).

Natural Catastrophes in 2020 46
HU Eta October 31 to November 13, 2020
Central America, Colombia, Jamaica, Cayman Islands, Cuba, Bahamas, USA
Max. Category 5
Category 4 at landfall in Nicaragua
Insured losses
(in USD billions)
▪ Minimal (AM Best)
Economic losses
(in USD billions)
▪ 5.0 (UNOCHA)
Fatalities
▪ ~185 (Relief Web)
▪ ▪ Eta was the twenty-eighth named storm of the 2020 Atlantic
Hurricane Season. It was the third most intense November Atlantic hurricane on record behind the 1932 Cuba hurricane and 2020 Hurricane Iota.
▪ Timeline and Meteorology
▪ Eta formed on October 31 from a tropical wave in the eastern Caribbean Sea. The system rapidly organized as it progressed west, reaching its peak strength at Category 4 intensity on November 3, with maximum sustained wind speeds of 150 mph (NHC).
▪ The system made landfall near Puerto Cabezas, Nicaragua, on November 3 as a Category 4.
▪ Eta weakened to a tropical storm quickly after landfall as it moved inland over northern Nicaragua.
▪ The system meandered slowly across Central America, specifically Nicaragua, Honduras and Guatemala, for two days which resulted in torrential rain, destructive floods and mudslides.
▪ It later reorganized over the Caribbean as it accelerated towards Cuba on November 7. Over the next five days, the system moved erratically, moving through the Florida Keys and accelerated across the Southeastern US before dissipating off the Eastern United States. Impact
▪ The following rainfall levels were observed: in Nicaragua and Honduras 15-25 inches fell, 10-20 inches on eastern Guatemala and Belize, 10-15 inches on portions of Panama and Costa Rica. Jamaica, southeast Mexico, El Salvador, Southern Haiti, and the Cayman Islands were also affected by heavy rainfall.
▪ Eta caused catastrophic, life-threatening flash flooding and river flooding, along with landslides in areas of higher terrain of Central America.
▪ Honduras - Eta triggered catastrophic flooding that destroyed many roads and bridges, isolating thousands of people. Over 400,000 people were made homeless in Honduras There have been 13 confirmed deaths (Yale Climate Connections).
▪ Guatemala - More than 150 people died due to flooding and mudslides (Yale Climate Connections). More than 3,561 homes were damaged across Guatemala (CONRED).
Hurricane Eta’s path as of November 2nd (Source: NOAA)
7-day precipitation estimate for October 30 – November 5, using data from rain gauges, satellites, radar, and computer model forecasts. (Source: NOAA)
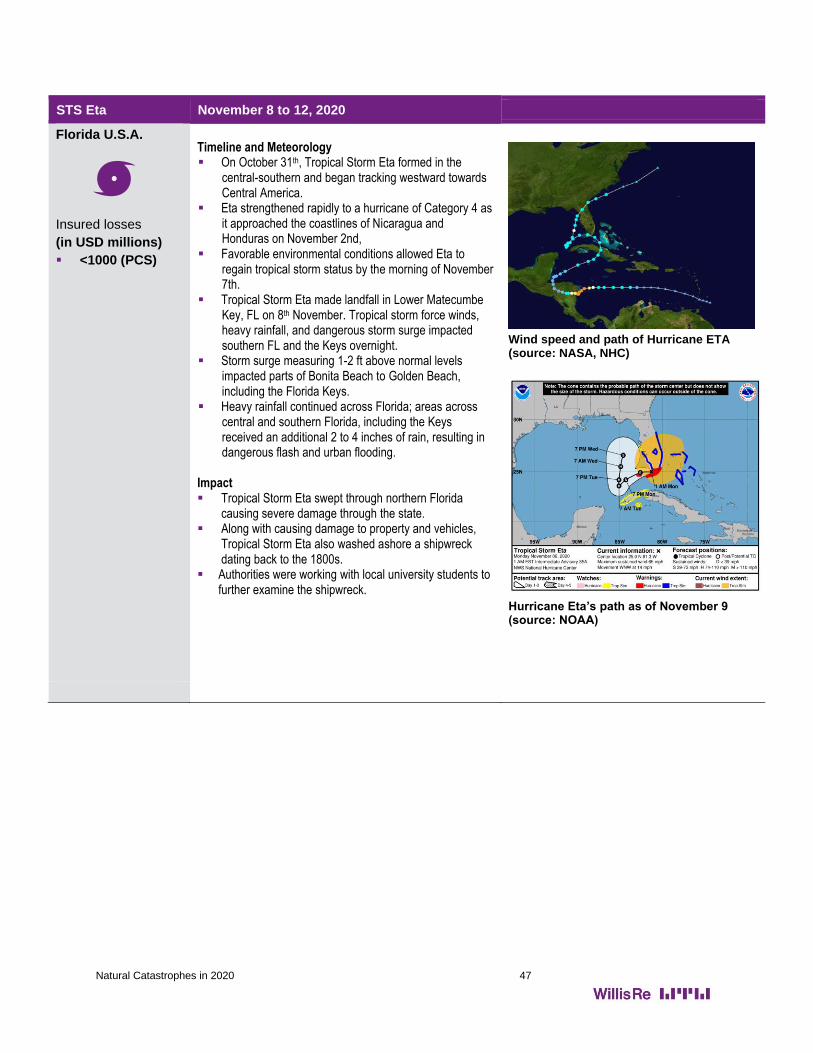
Natural Catastrophes in 2020 47
STS Eta November 8 to 12, 2020
Florida U.S.A.
Insured losses
(in USD millions)
▪ <1000 (PCS)
Timeline and Meteorology ▪ On October 31th, Tropical Storm Eta formed in the
central-southern and began tracking westward towards Central America.
▪ Eta strengthened rapidly to a hurricane of Category 4 as it approached the coastlines of Nicaragua and Honduras on November 2nd,
▪ Favorable environmental conditions allowed Eta to regain tropical storm status by the morning of November 7th.
▪ Tropical Storm Eta made landfall in Lower Matecumbe Key, FL on 8th November. Tropical storm force winds, heavy rainfall, and dangerous storm surge impacted southern FL and the Keys overnight.
▪ Storm surge measuring 1-2 ft above normal levels impacted parts of Bonita Beach to Golden Beach, including the Florida Keys.
▪ Heavy rainfall continued across Florida; areas across central and southern Florida, including the Keys received an additional 2 to 4 inches of rain, resulting in dangerous flash and urban flooding.
Impact ▪ Tropical Storm Eta swept through northern Florida
causing severe damage through the state. ▪ Along with causing damage to property and vehicles,
Tropical Storm Eta also washed ashore a shipwreck dating back to the 1800s.
▪ Authorities were working with local university students to further examine the shipwreck.
Wind speed and path of Hurricane ETA (source: NASA, NHC)
Hurricane Eta’s path as of November 9 (source: NOAA)

Natural Catastrophes in 2020 48
HU Iota November 13th – 19th, 2020
Nicaragua, Honduras and El Salvador
Max. Category 5
Category 4 at landfall in Nicaragua
Insured losses
(in USD billions)
▪ Minimal (AM Best)
Economic losses
(in USD billions)
▪ 1.25 Billion (Insurance Journal)
Fatalities
▪ ~59 (Relief Web)
▪ ▪ Hurricane Iota was the thirty-first and last tropical cyclone,
thirtieth named storm, thirteenth hurricane, and sixth major hurricane of the record-breaking 2020 Atlantic hurricane season. Iota the strongest hurricane in recorded history to make landfall in Nicaragua within November.
▪ Timeline and Meteorology
▪ Iota originated as a tropical wave that moved into the eastern Caribbean on November 10. By November 13, it developed into a tropical depression north of Colombia.
▪ On the November 15, the system underwent explosive intensification, reaching its peak strength at Category 5 intensity on November 16, with maximum sustained wind speeds of 155 mph (NHC).
▪ The system made landfall near Haulover, Nicaragua, on November 17 as a Category 4.
▪ Iota's landfall location was approximately 15 miles south of where Hurricane Eta made landfall on November 3.
▪ Iota then rapidly weakened as it moved over the mountainous terrain of Central America. The inner core of the weakening system was disrupted as it moved through Honduras. Iota weakened to a tropical depression on November 18 as it entered El Salvador and six hours later Iota's low-level circulation center dissipated. Impact
▪ Iota caused severe damage to areas of Central America already devastated by Hurricane Eta just less than two weeks prior.
▪ Flood affected Nicaragua, Honduras, El Salvador, Belize, Mexico, Guatemala, Panama, and Costa Rica.
▪ Hurricane Iota was at category 5 strength, the storm’s southern eyewall passed over the Colombian island of Providencia. Iota caused catastrophic damage on Providencia, destroying 80% of the homes, the other 20% of the island’s homes were damaged, and 98% of the island’s infrastructure was damaged or destroyed (Yale Climate Connections).
▪ NHC recorded that the hurricane’s remnants bought an additional 4-8 inches of rain to portions of Honduras, Guatemala, and southern Belize, with Nicaragua and El Salvador receiving an additional 2-4 inches.
▪ 5.2M people have been affected directly or indirectly by Eta and Iota across nine Latin American and Caribbean countries (COPECO).
Hurricane Iota’s path as of November 16th (Source: NOAA)
3-day rainfall from November 18-21, predicted rainfall amounts for Honduras, Guatemala, Belize, and Mexico. (Source: NOAA)

Natural Catastrophes in 2020 49
WS Bella/Hermine December 26 to 29, 2020
Belgium, Denmark, France, Germany, Ireland, Luxembourg, Netherlands, Spain, Switzerland, UK
Insured losses
(in USD millions)
▪ Losses not yet available/ ongoing
Timeline and Meteorology
▪ On December 24th, 2020, an extratropical cyclone formed in the Atlantic and developed into a powerful European windstorm impacting UK and Ireland on Saturday December 26.
▪ From December 26th to December 29th strong winds and heavy rainfall were reported in Northwest Europe.
▪ Unusually high wind speeds inland of up to 170 km/h affected Ireland, UK, France, Belgium, Luxembourg, the Netherlands, and northern Germany causing power outages, travel disruption and tree damages.
Impact
▪ A wide area across the British Isles and Continental Europe was impacted by strong wind gusts. Additionally, the conditions persisted unusually long as the cyclone moved comparatively slowly towards the east (KIT).
▪ Parts of the UK were also hit by heavy rain on December 26th with a wind gust of 171 km/h being recorded on the Isle of Wight, and the highest gust recorded in 2020 (Met Office).
▪ More than 36,000 power outages were recorded in Ireland, UK and France.
▪ No major damage has been reported across Northwest Europe.
Storm Bella, Peak Wind Gust Footprint 26th
to 28th Dec (source: Euro Tempest)

Natural Catastrophes in 2020 50
EQ Petrinja December 29, 2020
Croatia
Magnitude: 6.4
Depth: ~10 km
Insured losses
(in USD millions)
▪ Unknown
Economic losses
(in USD millions)
▪ 35% probability
of losses
between 100
and 1,000
(USGS)
Fatalities
▪ 7 (BBC)
Timeline and Seismology
▪ On 29th December 2020 at 12:19 pm local time (11:19 UTC), a Mw 6.4 earthquake struck Sisak-Moslavina County, Croatia, with the epicentre located 3km SWS of Petrinja (USGS).
▪ The earthquake was preceded by three foreshocks, the largest being Mw 5.2. Several aftershocks have occurred with the largest being a Mw 4.8 earthquake (USGS).
▪ ‘Very Strong’ to ‘Severe’ shaking intensities were felt in towns surrounding the epicentre, such as Petrinja and Sisak. The capital of Zagreb, experienced ‘Moderate’ to ‘Strong’ shaking intensities (USGS).
Impact
▪ Significant structural damages occurred in the villages of Sisak-Moslavina county. As of 3rd January 2021, surveys had established 8,928 buildings within the county were damaged with 20% of these destroyed (Total Croatia News).
▪ The town of Petrinja is the closest urban centre to the epicentre and was affected most severely, with all structures reported damaged to some degree (vecernji.hr).
▪ Impacts were felt widely across northern Croatia. Zagreb, ~50km north of the epicentre, was affected by power outages and some structural damage (jutarnji.hr).
▪ According to the USGS, this is the largest earthquake to occur in Croatia since the advent of modern seismic instrumentation.
USGS shaking intensity (MMI) footprint for the 29/12/20 Mw 6.4 event

Natural Catastrophes in 2020 51
3. Other natural catastrophe events by peril and
location
Events highlighted in the following tables represent those with detailed information presented in the first
part of the report.
Windstorm
Name Date Location Losses (USD millions) Fatalities
Brendan Jan 13 Ireland, UK Losses not yet available Unknown
Gloria Jan 19 to Jan 22
France, Gibraltar, Morocco, Portugal, Spain
Economic: 78 (Government Spokesperson)
14 (Civil Protection & euroforecaster)
January Hailstorms
Jan 20 Australia Insured: 1,250 (ICA) Unknown
Herve Feb 2 to Feb 8 France, Austria, Switzerland, Czech Republic, Germany
Losses not yet available Unknown
Petra Feb 3 to Feb 4 Austria, Switzerland, Germany, Czech Republic
Insured: 12 (Wiener Städtische, Uniqa, Axa Winterthur)
Unknown
Sabine/Ciara Feb 8 to Feb 11
Austria, Belgium, Switzerland, Germany, Denmark, France, UK, Ireland, Luxembourg, Netherlands, Norway, Sweden
Insured: 2,200-2,400 (Willis Re)
Insured: 1,900 (PERILS)
Insured: 1,100 (Munich Re)
Economic: 1,800 (Munich Re)
14 (Insurance Journal)
Ines Feb 13 Belgium, France, Germany, Ireland, Netherlands, Spain, United Kingdom
Losses not yet available Unknown
Victoria-Dennis
Feb 15 to Feb 17
Belgium, Denmark, France, Germany, Ireland, Luxembourg, Netherlands, Norway, Sweden, United Kingdom
Insured: 372 (Perils) 13 (Perils)
Xanthippe-Yulia
Feb 22 to Feb 24
Austria, Belgium, Germany, Denmark, UK, Netherlands, Norway, Ireland
Losses not yet available Unknown
Bianca Feb 27 Austria, Switzerland, Germany, France
Losses not yet available Unknown
Charlotte/Jorge
Feb 29 France, Belgium, Luxembourg, Netherlands, Germany, UK, Ireland, Iceland
Losses not yet available Unknown
Hanna/Laura Mar 12 Germany, Denmark, UK, Ireland, Sweden, Poland
Losses not yet available Unknown
Tasmanian East Coast Storm
Apr 02 Australia Losses not yet available Unknown
Francis Aug 25 to Aug 26
Western and Central Europe Losses not yet available Unknown
Medicane Ianos
Sep 17 to Sep 18
Italy, Greece Economic: >180 (Greek Ministry of Infrastructure and Transport)
4 (BBC)

Natural Catastrophes in 2020 52
Alpha Sep 18 to Sep 19
Portugal Losses not yet available Unknown
Odette Sep 26 to Sep 27
Belgium Insured: > 28 (Assuralia) Unknown
Alex-Brigitte Sep 30 to Oct 3
United Kingdom, Spain, Portugal, France, Italy, Austria, Poland, Czech Republic
Insured: 340 (FFA & CCR) At least 5 deaths reported (CCR)
Barbara Oct 20 to Oct 22
Portugal, Spain, United Kingdom Losses not yet available Unknown
Aiden Oct 30 to Nov 2 Ireland, UK Losses not yet available Unknown
South East Queensland Hailstorm
Oct 31 Australia Insured: 905 (PERILS) 0
Clement Nov 27 to Dec 2 Azores Islands, Canary Islands, Iberian Peninsula, Madeira Islands
Losses not yet available Unknown
Liisa Nov 11 Finland Losses not yet available Unknown
Dora Dec 2 to Dec 4 France, Portugal, UK Losses not yet available Unknown
Ernest Dec 7 to Dec 12 Spain, France, Italy, Belarus, Russia, Baltics
Losses not yet available Unknown
Bella Dec 26 to Dec 29
Belgium, Denmark, France, Germany, Ireland, Luxembourg, Netherlands, Spain, Switzerland, UK
Losses not yet available Unknown
Blizzard/Cold Front
Name Date Location Losses (USD millions) Fatalities
Winter weather Mar 23 to Apr 2 Italy, Central Europe Losses not yet available Unknown
Winter weather Apr 14 Austria Losses not yet available Unknown
Severe Thunderstorm (Tornado/Hail/Straight Wind)
Name Date Location Losses (USD millions) Fatalities
U.S.A Severe Weather
Jan 10 to Jan 12
Midwest & Southern U.S.A. Insured: <1,000 (PCS) Unknown
U.S.A. Severe Weather
Feb 5 to Feb 8 South and Northeast U.S.A. Insured: <1,000 (PCS) Unknown
U.S.A. Severe Weather
Feb 8 to Feb 11 Arizona & California U.S.A. Insured: <100 (PCS) Unknown
U.S.A. Severe Weather
Mar 2 to Mar 4 Midwest & Southern U.S.A. Insured: >1,000 (PCS) Unknown
U.S.A. Severe Weather
Mar 17 to Mar 20
Midwest & Southern U.S.A. Insured: <1,000 (PCS) Unknown
U.S.A. Severe Storm
Mar 27 to Mar 30
Midwest & Southern U.S.A. Insured: >1,000 (PCS) Unknown
U.S.A. Severe Weather
Apr 7 to Apr 9 Northeast & Midwest U.S.A. Insured: >1,000 (PCS) Unknown

Natural Catastrophes in 2020 53
U.S.A. Severe Weather
Apr 10 to Apr 14
Northeast & Southern U.S.A. Insured: >1,000 (PCS) 16
U.S.A. Severe Weather
Apr 18 to Apr 20
Southern U.S.A. Insured: <1,000 (PCS) Unknown
U.S.A. Severe Weather
Apr 21 to Apr 24
Southern U.S.A. Insured: >1,000 (PCS) 1
U.S.A. Severe Weather
Apr 24 to Apr 26
Southern U.S.A. Insured: <1,000 (PCS) Unknown
U.S.A. Severe Weather
Apr 27 to Apr 30
South and Northeast U.S.A. Insured: <1,000 (PCS) Unknown
U.S.A. Severe Weather
May 2 to May 3 Southern U.S.A. Insured: <1,000 (PCS) Unknown
U.S.A. Severe Weather
May 4 to May 5 Southern U.S.A. Insured: >1,000 (PCS) Unknown
U.S.A. Severe Weather
May 7 to May 8 Southern U.S.A. Insured: <1,000 (PCS) Unknown
Severe Weather May 9 to May 12
Poland, Germany, Czech Republic, France
Losses not yet available Unknown
U.S.A. Severe Weather
May 13 to May 15
Midwest & Northeast U.S.A. Insured: <1,000 (PCS) Unknown
U.S.A. Severe Weather
May 16 to May 21
South and Northeast U.S.A. Insured: <1,000 (PCS) Unknown
U.S.A. Severe Weather
May 20 to May 24
Southern U.S.A. Insured: >1,000 (PCS) Unknown
U.S.A. Severe Weather
May 25 to May 26
Texas U.S.A. Insured: <100 (PCS) Unknown
U.S.A. Severe Weather
May 27 to May 28
Texas U.S.A. Insured: >1,000 (PCS) Unknown
U.S.A. Severe Weather
Jun 2 to Jun 3 Northeast U.S.A. Insured: <1,000 (PCS) Unknown
Italy Severe Weather
Jun 2 to Jun 6 Northern Italy Insured: Unknown Unknown
U.S.A. Severe Weather
Jun 4 South Dakota U.S.A. Insured: <1,000 (PCS) Unknown
U.S.A. Severe Weather
Jun 5 to Jun 11
Midwest U.S.A. Insured: <1,000 (PCS) Unknown
U.S.A. Severe Weather
Jun 6 to Jun 9 Southern U.S.A. Insured: <1,000 (PCS) Unknown
Severe Weather Jun 13 to Jun 15
Germany, Hungary, Czech Republic
Losses not yet available > 1 (FloodList)
U.S.A. Severe Weather
Jun 19 to Jun 21
Texas U.S.A. Insured: <1,000 (PCS) Unknown
Upper North Island Storm and Tornado
Jun 26 New Zealand Insured: 12 (ICNZ) Unknown
Severe Weather Jun 26 to Jun 29
Switzerland, Slovakia, Germany, Poland
Losses not yet available Unknown
Italy Severe Weather
Jul 1 to Jul 4 Northern Italy Insured: Unknown Unknown

Natural Catastrophes in 2020 54
U.S.A. Severe Weather
Jul 5 to Jul 7 Northeast U.S.A. Insured: <1,000 (PCS) Unknown
Severe Weather Jul 7 Bulgaria Insignificant Unknown
Italy Severe Weather
Jul 10 to Jul 11 Northern Italy Insured: Unknown Unknown
U.S.A. Severe Weather
Jul 10 to Jul 12 Midwest U.S.A. Insured: <1,000 (PCS) Unknown
U.S.A. Severe Weather
Jul 17 to Jul 19 Midwest U.S.A. Insured: <1,000 (PCS) Unknown
Italy Severe Weather
Jul 21 to Jul 24 Northern Italy Insured: Unknown Unknown
U.S.A. Severe Weather
Jul 25 to Jul 27 Texas U.S.A. Insured: <1,000 (PCS) Unknown
Severe Weather Jul 27 to Jul 29 Czech Republic, Austria Germany, Slovenia, Switzerland,
Losses not yet available Unknown
U.S.A. Severe Weather
Aug 4 to Aug 5 Colorado U.S.A. Insured: <1,000 (PCS) Unknown
Severe Weather Aug 4 to Aug 5 Germany, Hungary, Austria, Italy, Croatia,
Losses not yet available Unknown
U.S.A. Severe Weather
Aug 8 to Aug 11
Midwest U.S.A. Insured: >1,000 (PCS) Unknown
Severe Weather Aug 8 to Aug 12 Austria, Germany, Poland Losses not yet available Unknown
U.S.A. Severe Weather
Aug 13 to Aug 17
Midwest & Southern U.S.A. Insured: <1,000 (PCS) Unknown
Italy Severe Weather
Aug 23 Verona, Italy Insured: Unknown Unknown
U.S.A. Severe Weather
Aug 26 to Aug 28
Northeast U.S.A. Insured: <1,000 (PCS) Unknown
U.S.A. Severe Weather
Aug 29 to Aug 30
Texas U.S.A. Insured: <100 (PCS) Unknown
Severe Weather Aug 29 to Aug 30
Italy, Austria, Switzerland, Poland
Losses not yet available 18 (The Local)
U.S.A. Severe Weather
Sep 5 to Sep 6 Iowa & Minnesota U.S.A. Insured: <1,000 (PCS) Unknown
U.S.A. Severe Weather
Sep 7 to Sep 9 Idaho & Utah U.S.A. Insured: <1,000 (PCS) 1
Severe Weather Oct 3 to Oct 5 Austria, Poland, Czech Republic Losses not yet available Unknown
U.S.A. Severe Weather
Oct 7 to Oct 8 Northeast U.S.A. Insured: <1,000 (PCS) Unknown
U.S.A. Severe Weather
Oct 25 to Oct 28
California & Oklahoma U.S.A. Insured: <1,000 (PCS) Unknown
U.S.A. Severe Weather
Nov 10 to Nov 12
Midwest & Southern U.S.A. Insured: <1,000 (PCS) Unknown
U.S.A. Severe Weather
Nov 15 to Nov 16
Northeast U.S.A. Insured: <1,000 (PCS) Unknown
U.S.A. Severe Weather
Nov 30 to Dec 1 Northeast U.S.A. Insured: <100 (PCS) Unknown

Natural Catastrophes in 2020 55
Tropical Cyclone - Atlantic Ocean
Name Date Location Landfall Category* Losses (USD millions) Fatalities
Tropical Storm Cristobal
Jun 1 to Jun 9 México, Honduras, Guatemala, El Salvador, U.S.
Tropical Storm Insured: 150 (KCC) 35 (RMS Owl)
Cristobal Jun 6 to Jun 9 Southern U.S.A. Tropical Storm Insured: <1,000 (PCS) Unknown
Fay Jul 10 to Jun 12 Northeast U.S.A. Tropical Storm Insured: <1,000 (PCS) Unknown
Hurricane Hanna Jul 23 to Jul 27 México 1 Economic: Not Significant 7 (Relief Web)
HU Hanna Jul 25 to Jul 27 Texas 1 Insured: <1,000 (PCS) Unknown
Hurricane Isaias July 28 to Aug 05
Dominican Republic, Puerto Rico, the Bahamas and Canada
1 Insured: 200 (KCC) 5 (CNN)
Isaias Jul 30 to Aug 5 South & Northeast U.S.A.
Tropical Storm Insured: >1,000 (PCS) Unknown
Hurricane Laura Aug 20 to Aug 29
Haiti, Caribbean 4 Insured: ~10,000-15,000 (RMS)
~31 (UNOCHA)
Hurricane Marco Aug 20 to Aug 25
México and Costa Rica
1 Economic: Not Significant Unknown
Hurricane Laura Aug 26 to Aug 28
Southern U.S.A. 4 Insured: >1,000 (PCS)
Unknown
Hurricane Nana Sep 1 to Sep 04
Belize, Honduras, Guatemala,
and Southern México
1 Economic: 20.5 (UN OCHA) 0
Hurricane Paulette Sep 13 to Sep 14
Bermuda 1 Economic: Not Significant 0
Hurricane Sally Sep 14 to Sep 18
Southern U.S.A. 2 Insured: >1,000 (PCS) Unknown
Beta Sep 20 to Sep 23
Southern U.S.A. Tropical Storm Insured: <1,000 (PCS) Unknown
Tropical Storm Gamma
Oct 2 to Oct 6 México Tropical Storm Economic: Not Significant Unknown
Hurricane Delta Oct 5 to Oct 11 México 4 Economic: 2,000-3,500 (RMS)
0 (Relief Web)
Hurricane Delta Oct 9 to Oct 12 Southern U.S.A. 2 Insured: >1,000 (PCS) Unknown
Hurricane Zeta Oct 24 to Oct 30
Jamaica, México, U.S.A.
1 Economic: 4,400 (KCC) 8 (Reuters)
Hurricane
Zeta
Oct 28 to Oct 29
Southern U.S.A. 2 Insured: >1,000 (PCS) Unknown
Hurricane Eta Oct 31 to Nov 13
Central America 5 Economic: 5,000 (UNOCHA)
185 (Relief Web)
Eta Nov 8 to Nov 12
Florida U.S.A. Tropical Storm Insured: <1,000 (PCS) Unknown
Hurricane Iota Nov 13 to Nov 19
Central America (Guatemala, Nicaragua, Honduras Colombia)
5 Economic: 1,250 (Insurance Journal)
59 (Relief Web)

Natural Catastrophes in 2020 56
*Saffir-Simpson Hurricane scale
Tropical Cyclone - Northwestern Pacific
Name Date Location Landfall Category* Losses (USD millions) Fatalities
Severe Tropical Cyclone Harold
Apr 02 Vanuatu 4 Losses not yet available Unknown
Typhoon Vongfong (Ambo)
May 12 Philippines 2 Losses not yet available Unknown
Tropical Storm Nuri (Butchoy)
Jun 12 Philippines, China Tropical Storm Losses not yet available Unknown
Tropical Storm Sinlaku Aug 01 Vietnam Tropical Storm Losses not yet available Unknown
Typhoon Hagupit (Dindo)
Aug 01 China 1 Economic: 1,581 (MEM) Unknown
Tropical Storm Jangmi (Enteng)
Aug 10 South Korea Tropical Storm Losses not yet available 42 (Yonhap News)
Typhoon Mekkhala (Ferdie)
Aug 10 China, Philippines 1 Losses not yet available Unknown
Tropical Storm Higos (Helen)
Aug 18 China Tropical Storm Losses not yet available Unknown
Typhoon Bavi (Igme) Aug 22 Northwestern Pacific
Tropical Storm Losses not yet available Unknown
Typhoon Maysak (Julian)
Aug 25 South Korea 2 Losses not yet available Unknown
Typhoon Haishen (Kristine)
Sep 07 Japan, South Korea 2 Insured: 800 (GIAJ) Unknown
Tropical Storm Noul (Leon)
Sep 18 Vietnam Tropical Storm Losses not yet available Unknown
Tropical Storm Dolphin (Marce)
Sep 24 Northwestern Pacific
No landfall Losses not yet available Unknown
Tropical Storm Chan-Hom
Oct 10 Northwestern Pacific
No landfall Losses not yet available Unknown
Tropical Storm Linfa Oct 11 Vietnam Tropical Storm Losses not yet available 61 (Lao Dong)
Tropical Storm Nangka (Nika)
Oct 11 China Tropical Storm Losses not yet available
64 (Vietnam Disaster Management Authority)
Typhoon Saudel (Pepito)
Oct 20 Philippines, China, Vietnam
Tropical Storm Losses not yet available VN 114 (Garda)
Typhoon Molave (Quinta)
Oct 24 Philippines, Vietnam 1 Losses not yet available 27 (NDRRMC)
Typhoon Goni (Rolly) Oct 28 Philippines, Vietnam, Cambodia
5 Losses not yet available PH: 25 (NDRRMC)
Tropical Storm Atsani (Siony)
Nov 02 Northwestern Pacific
No landfall Losses not yet available Unknown
Typhoon Vamco (Ulysses)
Nov 08 Philippines 1 Losses not yet available 101 (NDRRMC)

Natural Catastrophes in 2020 57
Tropical Storm Etau (Tonyo)
Nov 10 Vietnam Tropical Storm Losses not yet available 2 (ReliefWeb)
*Saffir-Simpson Hurricane scale
Tropical Cyclone - Southern Pacific and Oceania
Name Date Location Landfall Category* Losses (USD millions) Fatalities
Tropical Cyclone Blake Jan 08 Australia Tropical Storm Losses not yet available Unknown
Tropical Cyclone Damien Feb 04 Australia 2 Insured: 458 (ICA) Unknown
Tropical Cyclone Esther Feb 23 Australia 1 Losses not yet available Unknown
*Saffir-Simpson Hurricane scale
Tropical Cyclone - Indian Ocean
Name Date Location Landfall Category* Losses (USD millions) Fatalities
Cyclonic Storm Amphan
May 18 India 2 Insured: 150 (Willis Re Estimate) Economic: 14,000 (WMO)
129 (WMO)
Cyclonic Storm Nisarga
Jun 03 India 1 Economic: 823 (Indian Express)
1
Cyclonic Storm Nivar
Nov 25 India 1 Losses not yet available Unknown
*Saffir-Simpson Hurricane scale
Tropical Cyclone - Pacific
Name Date Location Landfall Category* Losses (USD millions) Fatalities
Tropical Storm Amanda
May 30 to Jun 1 El Salvador, Guatemala, Honduras, México
Tropical Storm Economic: Low 23 (Relief Web)
Hurricane Genevieve
Aug 16 to Aug 21 México 4 Economic: Not Significant 2 (Reuters)
*Saffir-Simpson Hurricane scale
Flood
Name Date Location Losses (USD millions) Fatalities
Jakarta and Bekasi Flooding
Jan 01 Indonesia Insured: 79 (AAUI) 66
Mersin, Turkey Floods
Jan 6 to Jan 8 Mersin, Turkey Losses not yet available ~ 2 (Floodlist)
South East Iran Floods
Jan 9 to Jan 11 South East Iran, UAE Losses not yet available ~ 3 (Copernicus)
Brazil Floods Jan 17 to Jan 29 Minas Gerais, Brazil Economic: Low 49 (Floodlist)

Natural Catastrophes in 2020 58
Mediterranean Coastal Floods
Jan 20 to Jan 23 Girona, Spain and Occitanie, France
Losses not yet available ~ 13 (Floodlist)
Madagascar Floods
Jan 22 to Jan 28 Madagascar Losses not yet available ~ 31 (OCHA)
Queensland Monsoonal Flooding
Jan 23 Australia Losses not yet available Unknown
Honduras Floods Jan 28 to Jan 29 Gracias a Dios, Colón, Atlántida, Cortés, Yoro and Islas de la Bahía
Economic: Low 3 (COPECO)
Southland Flooding
Feb 03 New Zealand Insured: 21 (ICNZ) Unknown
Southern Queensland Rainfall and Flooding
Feb 08 Australia Insured: 33 (ICA) Unknown
Bolivia Floods Feb 8 to Feb 29
La Paz, Santa Cruz, Potosi,
Beni, Cochabamba, and Tarija
Economic: Low 17 (Relief Web)
Brazil Floods Feb 9 to Feb 10 Sao Paulo Economic: Low 3 (Floodlist)
Argentina Floods Feb 11 to Feb 19 Chaco, Salta, Tucumán and La Rioja Provinces
Economic: Low 1 (Relief Web)
East Coast Storms and Flooding
Feb 10 Australia Insured: 659 (ICA) Unknown
Peru Floods Feb 17 to Feb 25 Peru and Bolivia Economic: Not Significant 3 (Relief Web)
South West Queensland Flooding
Feb 20 Australia Losses not yet available Unknown
West Java Flooding
Feb 23 Indonesia Losses not yet available 60
Iran Floods Feb 24 to Feb 25 Western Iran Losses not yet available Unknown
Western New South Wales Floods
Feb 26 Australia Losses not yet available Unknown
UK Floods February UK Industry: GBP 375
At least 2 deaths were reported as a result of flooding (Copernicus)
East Africa Floods
March - May
Rwanda, Uganda, Kenya, Somalia, Sudan, South Sudan, Democratic Republic of the Congo, Ethiopia, Tanzania, Burundi and Yemen.
Insured: Overall losses in Rwanda, Uganda and Kenya: > 70 (Munich Re)
>281 Fatalities in Rwanda, Uganda and Kenya (Munich Re)
Castellon, Spain April 1 Castellon, Spain Losses not yet available Unknown
Greece Flash Flooding
Apr 4 to Apr 6 Greece Losses not yet available Unknown
South China Floods
Apr 02 China (Hunan, Jiangxi, Fujian, Guangdong, Guangxi)
Economic: 20 (NDRCC) Unknown

Natural Catastrophes in 2020 59
South China Floods
Apr 17 China (The east of Southwest region to Jianghan area)
Economic: 64 (NDRCC) Unknown
Afghanistan Floods
April to August Afghanistan Losses not yet available >90 (OCHA)
México Floods May 9 Nuevo Leon, Apodaca Economic: Not Significant Unknown
South West of France Floods
May 10 to May 11 South West of France Losses not yet available Unknown
China Flooding May 25 China Losses not yet available Unknown
UAE Flash Floods
May 26 to May 27 Sharjah, UAE Losses not yet available ~ 4 (Floodlist)
Oman Flash Floods
May 27 to May 31 Dhofar Province, Oman Losses not yet available ~ 2 (Floodlist)
Uganda Floods May to Oct Uganda Losses not yet available >21 (OCHA)
Brazil Floods Jun 1 to Jun 15 Brazil Economic: Not Significant 0
Colombia Floods Jun 1 to Jun 15 Colombia Economic: Low Unknown
Corsica, France Jun 11 Corsica, France Losses not yet available Unknown
Ankara Flash Flooding
Jun 11 Turkey Insured: Insignificant 1 (FloodList)
South China Floods
Jun 20
China (Guangxi Zhuang Autonomous Region, Guangdong, Hunan, Guizhou, Yunnan, Jiangxi, Hubei, Zhejiang, Fujian provinces)
Economic: 5,100 (EMDAT) 108 (EMDAT)
Bursa Flash Flooding
Jun 21 Turkey Insured: Insignificant > 2 (FloodList)
Istanbul Flash Flooding
Jun 23 Turkey Losses not yet available 1 (FloodList)
Central/Eastern European Flooding
Jun 22 to Jun 27 Ukraine, Romania, Serbia, Bosnia-Herzegovina
Economic: > 140 for Ukraine (Relief Web)
> 5 (FloodList)
Mianning County Flooding
Jun 30 China (Sichuan Province) Losses not yet available 22 (EMDAT)
Turkey Floods Jun to Jul Ankara, Bursa Province, Istanbul and Rize Province Turkey
Losses not yet available ~4 (Floodlist)
Niger Floods June to September Niger Losses not yet available > 19 (DisastersCharter)
Kyushu Flooding Jul 04 Japan Insured: 500-1,000 (RMS),
800 (GIAJ) 84 (FDMA)
Artvin Flash Flooding
Jul 13 Turkey Losses not yet available > 1 (FloodList)
Iran Floods Jul 13 to Jul 16 Gibil and Ardabil Province Losses not yet available ~ 2 (Floodlist)
Rize Flash Flooding
Jul 14 Turkey Losses not yet available > 2 (FloodList)
Sicily, Italy Jul 15 Sicily, Italy Losses not yet available Unknown
Upper North Island Flooding
Jul 17 New Zealand Insured: 31 (ICNZ) Unknown

Natural Catastrophes in 2020 60
Saudi Arabia Floods
Jul 26 to Aug 4 Saudi Arabia Losses not yet available ~ 3 (Floodlist)
Western Georgia Floods
29 Jul Western Georgia Losses not yet available Unknown
Yemen Floods July to August Yemen Losses not yet available ~ 130 (Floodlist)
Kerala Floods Aug 07 India Losses not yet available 43 (CNN)
Evia Flash Flooding
Aug 8 to Aug 9 Greece Losses not yet available 8 (Anadolu Agency)
West Africa Floods
August – September
Niger, Mali, Nigeria, Chad, Cameroon, Senegal, Burkina Faso, Guinea, Guinea Bissau, Mauritania, Cote d’Ivoire, Ghana, Gambia, Benin, Cabo Verde and Central African Republic
Losses not yet available ~ 412 (OCHA)
Andalucía, Spain Flash Floods
Aug 11 Andalusia, Spain Losses not yet available Unknown
UK, France and Italy Floods
Aug 11 to Aug 13 UK, France and Italy Floods Losses not yet available ~ 6 (Floodlist)
Giresun Flash Flood
Aug 22 Turkey Losses not yet available > 7 (Daily Sabah)
Giresun Province, Turkey Floods
Aug 22 to Aug 23 Giresun Province, Turkey Losses not yet available
~ 4 (Floodlist)
UK and Ireland Floods
Aug 24 to Aug 25 UK and Ireland Losses not yet available
Unknown
Pakistan Floods Aug 28 to Sept 3 Khyber Pakhtunkhwa Province, Pakistan
Losses not yet available ~ 30 (Floodlist)
Galway Floods Sept 2 Galway, Ireland Losses not yet available Unknown
South of France Floods
Sept 19 to Sept 20 Gard, Lozere and Herault, South of France
Losses not yet available Unknown
Adjara Region, Georgia Floods
Oct 1 to Oct 3 Adjara Region, Georgia Losses not yet available
~ 5 (Floodlist)
France and Italy Flash Floods
Oct 2 to Oct 4 Southeastern France and Northern Italy
Insured: 252m (CCR) At least 5 (CCR)
Togo Floods Oct 5 to Oct 13 Togo, West Africa Losses not yet available ~ 11 (Floodlist)
Slovakia Flooding Oct 12 to Oct 14 Slovakia Losses not yet available 1 (FloodList)
Hyderabad Floods
Oct 13 India Losses not yet available Unknown
County Cork Floods
Oct 20 to Oct 21 County Cork, Ireland Losses not yet available
Unknown
Extremadura, Spain Floods
Oct 21 to Oct 22 Extremadura, Spain Losses not yet available
Unknown
El Salvador Floods
Oct 29 El Salvador Losses not yet available
40 (Floodlist)
Colombia Floods Oct 31 to Nov 2 Magdalena Department Economic: Low 0
Northern England, UK Floods
Nov 1 to Nov 2 Northern England, UK Losses not yet available
0

Natural Catastrophes in 2020 61
Andalucía, Span Floods
Nov 5 Andalucia, Spain Losses not yet available
Unknown
Napier Flooding Nov 09 New Zealand Insured: 52 (ICNZ) Unknown
Shaanxi, Shanxi Provinces
Nov 11 China Losses not yet available 13 (EMDAT)
Colombia Floods Nov 14 to Nov 19 Mainland Colombia and islands of San Andrés and Providencia
Economic: Low 7 (Floodlist)
Italy Floods November – Ongoing Sardinia, Italy Losses not yet available >5 (Floodlist)
South Africa Floods
Nov 20 to Nov 21 Kwazulu-Natal and Gauteng, South Africa
Losses not yet available ~ 4 (Floodlist)
Brazil Floods Nov 26 São Carlos Economic: Low 0
South Iran Nov to Dec South Iran Losses not yet available ~ 7 (Floodlist)
Turkey Floods Dec 13 to Dec 14 Izmir Province, Turkey Losses not yet available Unknown
Izmir Flash Flood Dec 14 Turkey Losses not yet available 2 (FloodList)
Earthquake
Date Local Time Location Magnitude
(Mw)
Depth
(km) Losses (USD millions) Fatalities
Jan 7 04:24 Indios, Puerto Rico 6.4 9 Economic: 35% probability of losses between 100 to 1,000 (USGS)
1 (RMS Owl)
Jan 19 13:27 86km ENE of Arzak, China
6 5.6 Losses not yet available Unknown
Jan 24 20:55 Elazig, Turkey 6.7 11.9 Losses not yet available 41 (AFAD)
Jan 28 14:10 Lucea, Jamaica, Cayman Islands, Cuba
7.7 14.9 Economic: 33% probability of losses between 1 to 10 (USGS)
0
Feb 23 09:23 Turkey, Iran Border 6.0 10 Losses not yet available > 9 (NY Times)
Feb 24 16:03 San Vicenzo la Costa, Italy
4.8 10 Losses not yet available 0
Mar 21 02:49 Kanallaki, Greece 5.7 10 Insured: Insignificant 0
Mar 22 06:24 Zagreb, Croatia 5.3 10
Insured: 64 – 80 (Croatian Insurance Bureau)
Economic: 1,100 (Munich Re)
1 (Reuters)
Mar 26 15:38 27km SE of Burias, Philippines
6.1 59 Losses not yet available Unknown
Apr 16 18:15 38km ESE of Falam, Myanmar
5.9 10 Losses not yet available Unknown
May 2 07:19 Tallaboa, Puerto Rico 5.4 11 Economic: 37% probability of losses between 100 to 1,000 (USGS)
0
May 6 11:38 Aleshtar, Iran 4.8 10 Losses not yet available 0
May 7 23:48 Damāvand, Iran 4.6 10 Losses not yet available 2 (USGS)

Natural Catastrophes in 2020 62
May 18 13:48 42km W of Zhaotong, China
5.1 10 Losses not yet available Unknown
Jun 5 06:59 Stilfontein, South Africa 4.8 10 Losses not yet available 0
Jun 9 20:48 Mohr, Iran 5.7 10 Economic: 75% probability of losses between 0-1 (USGS)
0
Jun 14 09:51 Eastern Turkey 5.9 5 Insured: Insignificant 1 (AFAD)
Jun 23 10:29 Santa María Xadani, México
7.4 20 Economic: 37% probability of losses between 100 to 1,000 (USGS)
10 (USGS)
Jun 25 21:05 278km SE of Hotan, China
6.3 10 Economic: 3 (EM-DAT) 4 (EM-DAT)
Jul 17 00:40 Iquique, Chile 5.9 122.7 Economic: 53% probability of losses between 10 to 100 (USGS)
Unknown
Jul 17 02:50 114km N of Kokoda, Papua New Guinea
7 79.8 Losses not yet available Unknown
Jul 22 20:07 Western Xizang, China 6.3 10 Losses not yet available Unknown
Aug 18 00:03 13km E of San Pedro, Philippines
6.6 10 Losses not yet available Unknown
Sep 1 00:09 Vallenar, Chile 6.8 10 Economic: 95% probability of losses between 0 to 1 (USGS)
Unknown
Sep 11 04:35 Tocopilla, Chile 6.3 110.7 Economic: 68% probability of losses between 0 to 1 (USGS)
0
Sep 18 19:28 Crete, Greece 5.9 44.49 Insured: Insignificant 0
Oct 30 13:51 Aegean Sea, Turkey 7.0 21 Insured: 68m (PERILS) 119 (AFAD)
Nov 15 22:37 5km S of Marihatag, Philippines
6 45 Losses not yet available Unknown
Dec 29 11:19 Petrinja 6.4 10 Economic: 35% probability of losses between 100 and 1,000 (USGS)
7 (BBC)
Wildfire
Name Date Location Acres Burnt Losses (USD
millions) Fatalities
Corsica Forest Fire
Feb 8 Corsica, France 5,000 (CEMS) Economic: Insignificant 0
Chernobyl Fires Apr 11 Chernobyl, Ukraine 420,000 (CEMS) Losses not yet available 0
Podlaskie Voivodeship Fires
Apr 19 Podlaskie Voivodeship, Poland
13,163 (CEMS) Losses not yet available 0
Ukraine Wildfire Jul 6 to Jul 7 Luhansk, Ukraine 12,000 (ECHO) Losses not yet available > 6 (BBC)
Corinth Wildfires Jul 23 Corinthia, Greece 8,100 (CEMS) Economic: Insignificant 0
Branco Fires Jul 25 Castelo Branco, Portugal
13,700 (CEMS) Economic: Insignificant 0
Northern Territory Bushfires
Aug 01 Australia Unknown Losses not yet available Unknown
Gran Chaco and Amazon Wildfire
Aug 1 to Oct 31
Argentina, Bolivia, Brazil, and Paraguay
~6.5 million (National Geographic)
Losses not yet available 0

Natural Catastrophes in 2020 63
Landslide
Name Date Cause Location Losses (USD millions) Fatalities
Brazil Landslide Mar 3 Very heavy rain Guarujá, Santos and São Vicente
Economic: Not Significant 43 (Relief Web)
Gran Canaria Forest Fire
Aug 13 to Aug 20
Gran Canaria, Spain 21,000 (ERCC) Economic: Insignificant 0
Cameron Peak Fire
Aug 13 to Nov 6
Colorado >200,000 Insured: <1,000 (PCS) Unknown
Beachie Creek Fire
Aug 16 to
Oct 10 Oregon >190,000 Insured: >1,000 (PCS) Unknown
SCU Lightning Complex Fire
Aug 16 to
Sep 16 California >390,000 Insured: <1,000 (PCS) Unknown
LNU Lightning Complex Fire
Aug 17 to Sep 16
California > 300,000 Insured: >1,000 (PCS) 5
CZU Lightning Complex Fire
Aug 17 to Sep 22
California > 86,000 Insured: >1,000 (PCS) 1
Carmel Fire Aug 18 to
Sep 4 California >6,000 Insured: <1,000 (PCS) Unknown
North Complex Fire
Aug 18 to
Oct 12 California >300,000 Insured: <1,000 (PCS) Unknown
Spain Fires Aug 27 Almonaster La Real & Cabezuela Del Valle, Spain
44,000 (CEMS) Losses not yet available 0
Viseu Fires Sep 7 Viseu, Portugal 5,200 (CEMS) Losses not yet available 1 (ANPC PRT)
Greece Wildfire Sep 9 Athens, Greece Unknown Losses not yet available Unknown
Creek Fire Sep 4 to
Oct 12 California >350,000 Insured: <1,000 (PCS) Unknown
Almeda Fire Sep 7 to Sep 16
Oregon >3,200 Insured: <1,000 (PCS) Unknown
Babb Fire Sep 6 to Sep 18
Washington >18,000 Insured: <1,000 (PCS) Unknown
Holiday Farm Fire Sep 7 to Oct 3 Washington >170,000 Insured: <1,000 (PCS) Unknown
Riverside Fire Sep 8 to Oct 3 Oregon >130,000 Insured: <100 (PCS) Unknown
Echo Mountain Complex Fire
Sep 7 to Sep 23
Oregon >2,000 Insured: <100 (PCS) Unknown
Slater Fire Sep 8 to Oct 9 California >150,000 Insured: <100 (PCS) Unknown
Bobcat Fire Sep 6 to Oct 23
California >115,000 Insured: <1,000 (PCS) Unknown
Ukraine Wildfire Sep 30 to Oct 8
Luhansk, Ukraine 32,000 (ECHO) Losses not yet available 11 (DSNS)
Glass Fire Sep 27 to
Oct 19 California >60,000 Insured: >1,000 (PCS) Unknown
Lake Ohau Fire Oct 04 New Zealand 12,454 Insured: 25 (ICNZ) Unknown
East Troublesome Fire
Oct 14 to Nov 9
Colorado >190,000 Insured: <1,000 (PCS) Unknown

Natural Catastrophes in 2020 64
México Landslide Mar 9 Very heavy rain Monterrey-Saltillo highway Economic: Not Significant 0
Norway Landslide Dec 30 Rainfall Village Ask, Gerdum Economic: Not Significant 7 (Life in Norway)
Civil Disorder
Name Date Location Losses (USD) Fatalities
Riots May 26 to Jun 8 All regions U.S.A. Insured: >1,000 (PCS) 1
Explosion
Name Date Location Losses (USD) Fatalities
Beirut port Aug 4 Beirut, Lebanon Insured: 1,500 (ACAL) >200

Natural Catastrophes in 2020 65
Abbreviations
Symbols
BL Blizzard
HU Hurricane
ST Severe Thunderstorm
DR Drought
LS Landslide
TS Tsunami
EQ Earthquake
ME Meteoroid
VE Volcanic Eruption
EX Explosion
StS Storm Surge
WF Wildfire
FL Flood TC Tropical Cyclone WS Windstorm
HL Hail TO Tornado
STS Severe Tropical Storm
Sources
AAUI (Asosiasi Asuransi Umum Indonesia), AccuWeather (accuweather.com), AEMET (aemet.es), AFAD (en.afad.gov.tr), AIR (AIR Worldwide: air-worldwide.com), Anadolu Agency (aa.com.tr), Arab News (arabnews.com), ARIA (NASA Advanced Imaging and Analysis: aria.jpl.nasa.gov), Artemis, Asia Insurance Review (asiainsurancereview.com), ACAL (Association of Insurance Companies in Lebanon), Assuralia (assuralia.be), Athens News Agency (amna.gr), Axa Winterthur (axa.ch), BBC (BBC.co.uk), BoM (Australia Government - Bureau of Meteorology), CCR, CNN (edition.cnn.com), COEN (National Emergency Operations Center of COPECO) (copeco.gob.hn/), CONRED (National Coordination for Disaster Reduction of Guatemala) (conred.gob.gt/site/index.php), COPECO (copeco.gob.hn/), Copernicus (efas.eu), Copernicus Emergency Management Service (CEMS), Croatian Insurance Bureau (huo.hr), Daily Sabah (dailysabah.com), Dartmouth Flood Observatory (floodobservatory.colorado.edu), Digital Typhoon (http://agora.ex.nii.ac.jp/digital-typhoon/), DSNS (dsns.gov.ua), EA
(environmentagency.blog.gov.uk), Earth Networks (Earthnetworks.com), EOS (Earth Observatory of Singapore: EOS.org), Earth Observing System
Data and Information System (EOSDIS) (earthdata.nasa.gov/eosdis), EM-DAT (The International Disaster Database: emdat.be), ERCC (ec.europa.eu/echo), EuroNews (Euronews.com), EuroTempest (eurotempest.ltd), FAS – Federation of American Scientists (fas.org), FDMA (https://www.fdma.go.jp/disaster/info/), Federal Maritime and Hydrographic Agency (bsh.de), Fethiye Times (fethiyetimes.com), FFA (ffa.org), Financial Tribune (financialtribune.com), Finans Norge (finansnorge.no), FloodList (floodlist.com), Food and Agriculture Organization of the United Nations (fao.org), Garda (https://www.garda.com/), GDACS (Global Disaster Alert and Coordination System:.org), Geosciences (mdpi.com), Geotechnical Extreme Events Reconnaissance (GEER) (geerassociation.org/), German Insurance Association (en.gdv.de), GIAJ (https://www.sonpo.or.jp/en/), Greece Association Of Insurance Companies (eaee.gr), Greek Ministry of Infrastructure and Transport (yme.gr), Greek Reporter (greece.greekreporter.com), IBTrACS (http://ibtracs.unca.edu/), ICA (Insurance Council of Australia), ICNZ (Insurance Council of New Zealand), IFRC (International Federation of Red Cross and Red Crescent Societies: ifrc.org), Iltalehti (iltalehti.fi), Indian Express (https://indianexpress.com/), Insurance Insider (insuranceinsider.com), Insurance Journal (insurancejournal.com), JBA (jbarisk.com), JMA (Japan Meteorology Agency), Jutarnji (jutarnji.hr), Karen Clark & Company (KCC) karenclarkandco.com/news/year/2020/), KIT – Karlsruhe Institute for Technology, livemint (livemint.com), MEM (https://www.mem.gov.cn/), Met Office (metoffice.gov.uk), Meteofrance (meteofrance.com), Milenio (milenio.com), Ministry of Infrastructure and Transport (yme.gr), Munich Re (munichre.com), NASA Earth Observatory (earthobservatory.nasa.gov), National Geographic (https://www.nationalgeographic.com), NDRCC (National Disaster Reduction Center China), NDRRMC (National Disaster Risk Reduction and Management Council), News In English (newsinenglish.no), NOAA – National Oceanic and Atmospheric Administration (nesdis.noaa.gov), NY Times (nytimes.com), OCHA (Bureau des Nations Unies pour la Coordination des Affaires Humanitaires: unocha.org), PCA (Princeton Climate Analytics: princetonclimate.com), PCS (Verisk), PERILS (PERILS.org), POB (Port of Beirut: portdebeyrouth.com), Portuguese National Emergency and Civil Protection Authority (ANPC), Prensa Latina News Agency (plenglish.com), Public Health England – Global Hazards Weekly Bulletin (met.reading.ac.uk), Reinsurance News (reinsurancene.ws), ReliefWeb (reliefweb.int), Reuters (reuters.com), RMS (rms.com), Severe Weather Australia (https://www.severeweather.com.au/), Swedish Forest Agency (skogsstyrelsen.se), Swiss Re (swissre.com), The Guardian (theguardian.com), The Local (thelocal.it), The Slovak Spectator (spectator.sme.sk), The Watchers (watchers.news ), Total Croatia News (total-croatia-news.com), U.S.A. (nhc.noaa.gov), UN OCHA (unocha.org), Uniqa (uniqagroup.com), United States Department of Agriculture (USDA) (USDA.gov), United States Department Of Agriculture Foreign Agricultural Service (fas.usda.gov), USGS (United States Geological Survey (usgs.gov), Vaaju (vaaju.com), Vecernji (vecernji.hr), VENTUSKY (Ventusky.com), Voanews (voanews.com), WBG (World Bank Group: worldbank.org), Weather Underground (wunderground.com), Wiener Städtische (wienerstaedtische.at), World Meteorological Organization (public.wmo.int/en), XPRIMM (xprimm.com), Yonhap News (https://en.yna.co.kr/), Ysale Climate Connections (yaleclimateconnections.org)

Natural Catastrophes in 2020 66
© Copyright 2020 Willis Limited / Willis Re Inc. All rights reserved: No part of this publication may be reproduced, disseminated, distributed, stored in a retrieval system, transmitted or otherwise transferred in any form or by any means, whether electronic, mechanical, photocopying, recording, or otherwise, without the prior written permission of Willis Limited / Willis Re Inc. Some information contained in this document may be compiled from third party sources and Willis Towers Watson (as defined below) does not guarantee and is not responsible for the accuracy of such. This document is for general information only and is not intended to be relied upon. Any action based on or in connection with anything contained herein should be taken only after obtaining specific advice from independent professional advisors of your choice. The views expressed in this document are not necessarily those of Willis Limited / Willis Re Inc., its parent companies, sister companies, subsidiaries or affiliates, Willis Towers Watson PLC and al l member companies thereof (hereinafter collectively, “Willis Towers Watson”). Willis Towers Watson is not responsible for the accuracy or completeness of the contents herein and expressly disclaims any responsibility or liability, based on any legal theory, for damages in any form or amount, based upon, arising from or in connection with for the reader's application of any of the contents herein to any analysis or other matter, or for any results or conclusions based upon, arising from or in connection with the contents herein, nor do the contents herein guarantee, and should not be construed to guarantee, any particular result or outcome. Willis Towers Watson accepts no responsibility for the content or quality of any third party websites that are referenced. The contents herein are provided for informational purposes only and do not constitute and should not be construed as professional advice. Any and all examples used herein are for illustrative purposes only, are purely hypothetical in nature, and offered merely to describe concepts or ideas. They are not offered as solutions for actual issues or to produce specific results and are not to be relied upon. The reader is cautioned to consult independent professional advisors of his/her choice and formulate independent conclusions and opinions regarding the subject matter discussed herein. Willis Towers Watson is not responsible for the accuracy or completeness of the contents herein and expressly disclaims any responsibility or liability based on any legal theory or in any form or amount, based upon, arising from or in connection with for the reader's application of any of the contents herein to any analysis or other matter, nor do the contents herein guarantee, and should not be construed to guarantee any particular result or outcome.