Embed Size (px)
Citation preview

The Use of Local Foods in Maryland Schools: Findings from a Survey of Food Service Directors

About the Surveys and Schools From 2009 to2010, a collaboration of researchers and Extension specialists developed a study to examine the supply chain for local foods in Maryland school meals, investigate the barriers and opportunities for increasing local foods in schools, and develop outreach programs to meet the needs identified, with an eye towards improving farmer incomes. Interviews and surveys were administered with stakeholders from the entire supply chain, including farmers, distributors, food service directors, and school principals. This report focuses on the results from the survey of food service director
he survey of public and private school K‐12 food service directors, which included over 30 uestions, Tq
was intended to study the following:
the current use of local foods in public schools;
the level of stakeholder interest;
whether schools procured directly from local farmers; ell what types of agricultural interest in procuring local foods in the future (as w
products); barriers to using local foods in school meals; and
erceptions about the effectiveness of the Maryland Farm to School legislation, pJane Lawton Farm to School Act.
Some basic characteristics of the food service operation were also collected (Table 1). The survey covered the academic year 2008‐2009 and some information about the summer of 2009. Local foods, for the purpose of the survey, were defined as those produced in
Page | 2
Maryland or the surrounding states.
The school food service survey was developed by the research team made up of members from the University of Maryland, Penn State University, and USDA’s Economic Research Service, in consultation with the Maryland State Departments of Agriculture and Education. For public schools, 18 of 24 surveys were received, representing a 75 percent response rate. Of the private schools in the state, we distributed surveys to the population of schools with more than 150 students (approximately 310 schools), including high, middle and elementary schools. The response rate for private schools was 17 percent (51 schools); we assume that a substantial number of private schools not returning the survey did not provide school meals for students. For an electronic version of this report and detailed information related to the comprehensive survey and statistical components of this research project, please visit http://mdagnrpolicy.arec.umd.edu/ and select “Local Foods.” Contact information for research team members can be found at the end of this report.

Public schools, for the most part in Maryland, have centralized kitchen facilities run by the public school system. In the private schools, 60 percent of the food service is operated by a contractor, while 37 percent are self‐operated by the school. Seventy‐seven percent of these use on‐site kitchens at the school, while 17 percent of the schools have their meals prepared at a satellite or contract kitchens. The enrollment for the schools is varied because the private school numbers most often cover one or two schools, whereas those for the public school are county wide, covering many schools, and the food service departments provide meals to all the schools.
Table 1. Descriptive Characteristics of Respondent Schools and Meals Served
Aspect Public Schools (n=18) Private Schools (n=43)
‐‐Mean‐‐
Enrollment 30,850 (range 2,219‐139,282 420 (range of 78‐1,400)
Daily breakfast served 4,977 25
Daily lunch served 14,146 239
Daily snacks served 723 93
Summer meals total served 33,905 (range 0‐288,911) 1,026 (range 0‐40,000)
Page | 3

Questions & Responses: Purchasing Practices 1. How well trained/equipped would you consider your staff and facilities to prepare fresh fruits and vegetables, e.g., whole carrots that have not been further processed or cut (Table 2)?
Table 2. Capacity of Food Service (Training/Equipment) to Prepare Fresh Fruits
and Vegetables
Public Schools Private School
‐‐Percent‐‐
Very Moderate Lacking Very Moderate Lacking
Staff 56 39 6 76 19 5
Preparation Space 50 39 11 64 36 0
Equipment (knives, food,
processors)
39 33 28 60 30 11
Refrigerator storage space 28 67 6 68 30 3
2. Approximately how many vendors in the following categories does your food service operation use to purchase fresh produce (Table 3)?
Table 3. Vendor Use by School Food Service
Aspect Public Schools Private Schools
‐‐Mean‐‐
Distributors or wholesalers 6.8 1.5
Individual farmers 1 .6
Farmers cooperatives/associations 0 .3
Page | 4

3. Do you purchase more than 50 percent of all your fresh fruits and vegetables from just one vendor (Table 4)?
4. Does your primary vendor offer locally grown products (Table 4)?
5. Have you asked any of your vendors to carry local foods (Table 4)?
6. Do you participate in the Department of Defense Fresh Fruit and Vegetable Program (Table 4)?
Table 4. Vendor Relationship
Aspect Public Schools Private Schools
‐‐Percent‐‐
Purchases > 50% of fresh fruits
and veg from one vendor 89 71
Primary vendor offers locally
grown products 77 43
Asked vendor to carry local foods 53 34
Participate in DOD Fresh Fruit and
Vegetable Program 61 NA
7. Provide name of vendor if you purchase more than 50 percent of all your fresh fruits and vegetables from just one vendor (Table 5).
Table 5. Name of Vendor
Public Schools: PFG Carroll County Foods (4 responses); Keany Produce (3); Dept of Defense
(2); Lankford Sysco (2); Eastern Maryland Sysco (1); Lancaster Foods (1); Produce Source (1);
Greensburg Farm (1); Farmers Market (1).
Private Schools: Keany Produce (6) Hearn Kirkwood (4); Sysco (3); Costco (3); Sam’s Club (3);
U.S. Foodservice (2); PFG Carroll County Foods (1); La Prima Food Group (1); Capital Seafood
(1); Vignola’s Gourmet (1).
Page | 5

8. What were the top 3 fresh fruits and vegetables (by volume) purchased by your food service operation last year, 200809 (Table 6)?
Table 6. Top 3 Fresh Fruits and Vegetables
Public schools fresh fruits (frequency of times mentioned in top 3): Apples (18 responses);
oranges (or tangerines) (16); bananas (7); grapes (5); pears (3); strawberries (2); peaches (1).
Public schools vegetables: Carrots (sticks/baby) (16 responses); lettuce/salad mix (15);
tomatoes (8); celery (6); broccoli (4); corn/collards/sweet potato or potato (all mentioned
once).
Private schools fresh fruits: Apples (33 responses); oranges (or tangerines) (23); grapes (13);
bananas (12); watermelons/melons (6); cantaloupe (5); strawberries (4); pineapples (3);
pears (2); berries (1).
Private schools vegetables: Lettuce/salad mix (28 responses); carrots (sticks/baby) (19);
tomatoes (16); broccoli (8); green beans (6); cucumber (6); onions (3); corn (3); spinach (2);
celery (2); peppers (2); peas/potatoes/zucchini/squash (all mentioned once).
Page | 6

Questions and Responses: Local Foods and Food Service Operations 9. Please rate the following stakeholders in your school district concerning their interest in serving local foods in school meals (Table 7).
Table 7. Interest from Stakeholders Concerning Local Foods in School Meals
Stakeholders Very Moderately Somewhat Not at all
‐‐Percent interested‐‐
PUBLIC SCHOOLS
Your food service operation 59 29 6 6
Parents 24 24 53 0
PTAs 25 25 38 13
Students 12 24 47 17
Principals 19 38 25 19
School Board 50 25 19 6
Superintendent 47 29 24 0
PRIVATE SCHOOLS
Your food service operation 56 19 19 6
Parents 56 19 19 6
PTAs Not applicable
Students 27 24 33 15
Principals 58 19 19 3
School Board 52 23 19 7
Superintendent Not applicable
Page | 7
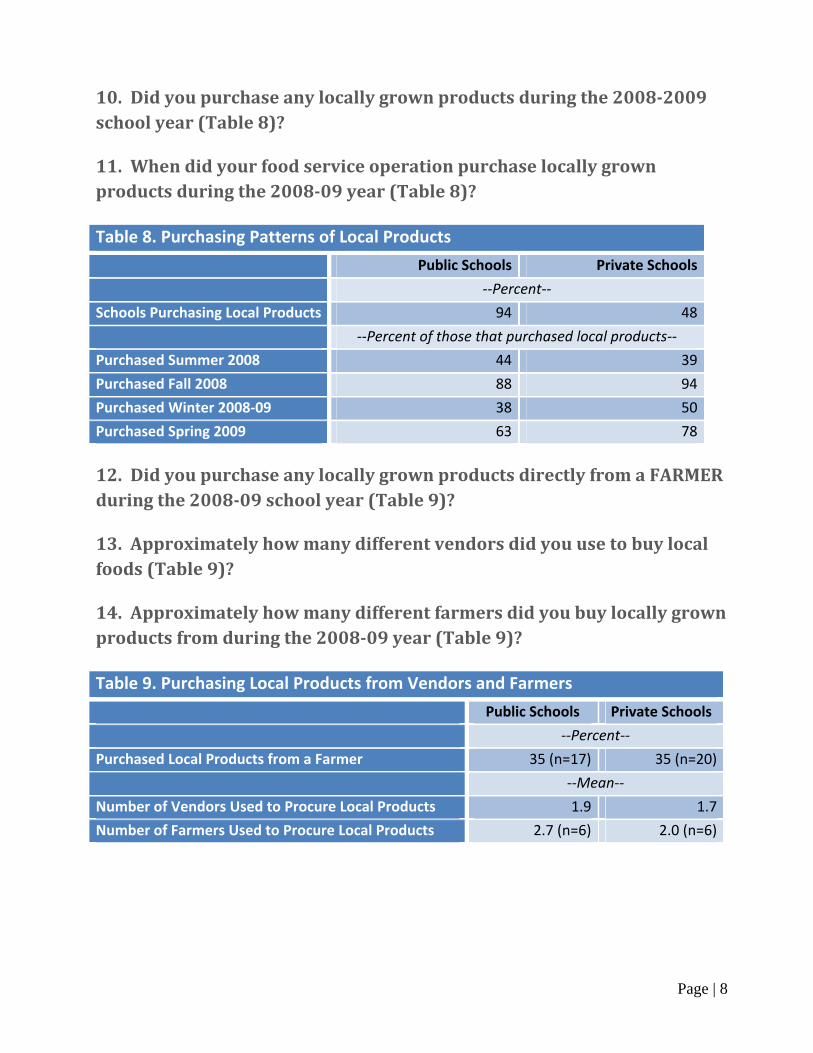
10. Did you purchase any locally grown products during the 20082009 school year (Table 8)?
11. When did your food service operation purchase locally grown products during the 200809 year (Table 8)?
Table 8. Purchasing Patterns of Local Products
Public Schools Private Schools
‐‐Percent‐‐
Schools Purchasing Local Products 94 48
‐‐Percent of those that purchased local products‐‐
Purchased Summer 2008 44 39
Purchased Fall 2008 88 94
Purchased Winter 2008‐09 38 50
Purchased Spring 2009 63 78
12. Did you purchase any locally grown products directly from a FARMER during the 200809 school year (Table 9)?
13. Approximately how many different vendors did you use to buy local foods (Table 9)?
14. Approximately how many different farmers did you buy locally grown products from during the 200809 year (Table 9)?
Table 9. Purchasing Local Products from Vendors and Farmers
Public Schools Private Schools
‐‐Percent‐‐
Purchased Local Products from a Farmer 35 (n=17) 35 (n=20)
‐‐Mean‐‐
Number of Vendors Used to Procure Local Products 1.9 1.7
Number of Farmers Used to Procure Local Products 2.7 (n=6) 2.0 (n=6)
Page | 8

15. What were the top five products you purchased directly from farmers (Table 10)?
Table 10. Top Five Products Purchased Directly from Farmers
Public Schools Private Schools
‐‐Number of Responses‐‐
Apples 3 5
Pears 3 1
Peaches 3 2
Watermelon 3 1
Sweet Corn 2 2
Tomatoes 1 3
Peppers 0 2
Lettuce 0 2
Berries 0 2
Potatoes 0 2
Cantaloupe 1 1
Cherry/plums/nectarines (each mentioned once by public schools)
Mushrooms/green beans/yellow squash/ cabbage/beets/ground beef/carrots/zucchini (each
mentioned once by private schools)
16. How would you rate your overall experience of buying directly from farmers (Table 11)?
Table 11. Experience of Buying Directly from Farmers
Public Schools (n=6) Private Schools (n=7)
‐‐Percent‐‐
Excellent 40 29
Good 60 43
Neutral 0 14
Bad 0 14
Page | 9

Questions and Responses: Plans for Using Local Foods 17. Overall, in the future, how interested are you in purchasing locally produced products (Table 12)?
Table 12. Interest in Purchasing Local Products from a Vendor or Distributor
Public Schools Private Schools
Directly from a Farmer ‐‐Percent‐‐
Very Interested 50 47
Moderately Interested 31 32
Not at all Interested 19 21
Directly from a Distributor
Very Interested 82 49
Moderately Interested 12 44
Not at all Interested 12 8
Page | 10

18. Please tell us your plans for purchasing locally grown fresh fruits, vegetables, and other products over the next 3 years for school meals. (Table 13). [Schools reporting that they would either start purchasing or purchase more/same amount of the product].
Table 13: Plans for Purchasing Locally Grown Fruits and Vegetables
Product Number of Responses
FRUIT
Apples 42
Melons 38
Peaches 35
Strawberries 33
Watermelon 31
VEGETABLES
Beans 27
Broccoli 31
Cabbage 19
Carrots 35
Cauliflower 20
Cucumber 34
Lettuce 34
Lettuce Mix 33
Onions 29
Peas 19
Potatoes 27
Pumpkin 12
Spinach 20
Squash 23
Tomatoes 34
OTHER
Beef 17
Pork 11
Chicken 18
Turkey 15
Milk 30
Cheese 21
Yogurt 21
Page | 11

Questions and Responses: Challenges to Using Local Foods in School Meals 19. From your perspective, what are the SUPPLY related barriers that impact your food service operation’s ability to increase the use of local foods in school meals (Table 14)?
Table 14. Rating of Possible Supply Related Barriers by Food Service Directors
Possible Barriers Major barrier
Moderate barrier Not a barrier
‐‐Percent‐‐
PUBLIC SCHOOL
Seasonal availability 73 20 7
Lack of partially processed product 31 56 13
Product shelf life/appearance 19 63 19
Consistent product quality 25 56 19
Lack of local supply/producers 50 13 38
Developing farmer relationships 20 40 40
Pricing of local foods 18 41 41
Distributor doesn't offer local 13 44 44
PRIVATE SCHOOLS
Pricing of local foods 32 47 21
Developing farmer relationships 25 50 25
Lack of local supply/producers 23 52 26
Seasonal availability 36 36 28
Product shelf life/appearance 24 39 36
Distributor doesn't offer local 36 25 39
Lack of partially processed product 20 40 40
Consistent product quality 18 39 42
Page | 12

20. From your perspective, what are the BUSINESS related and other barriers that impact your food service operation’s ability to increase the use of local foods in school meals (Table 15)?
Table 15. Rating of Possible Business Related Barriers by Food Service Directors
Possible Barriers Major barrier
Moderate barrier Not a barrier
‐‐percent‐‐
PUBLIC SCHOOLS
Extra staff needed 38 31 31
Delivery considerations 35 29 35
Liability 29 35 35
Lack of info‐availability 7 50 43
Menu planning 0 50 50
Lack of facilities 6 38 57
Multiple orders/invoices 6 35 59
Internal purchasing policy 19 19 63
Prime vendor consideration 6 29 75
Student acceptance 6 29 65
Payment arrangements 6 24 71
Lack of prep training 0 19 81
Interest/school admin 0 6 94
Interest/school families 0 0 100
PRIVATE SCHOOLS
Liability 30 46 24
Delivery considerations 31 44 25
Lack of info‐availability 47 20 33
Payment arrangements 29 29 43
Extra staff needed 26 31 43
Menu planning 17 40 43
Internal purchasing policy 25 28 47
Prime vendor consideration 24 29 47
Student acceptance 6 46 49
Multiple orders/invoices 27 24 50
Lack of prep training 3 38 59
Lack of facilities 17 23 60
Interest/school families 6 27 67
Interest/school admin 3 22 75
Page | 13

21. Index of SUPPLY related and BUSINESS related factors (Major Barrier = 1, Moderate Barrier = .5, and Not a Barrier = 0) (Table 16).
Table 16. Index Rankings of Supply Related and Business Related Barriers for both Public and Private Schools Possible Barriers Index Ranking
Seasonal availability 31.0
Delivery considerations 25.5
Pricing 25.5
Liability (farmer compliance with food safety standards) 25.0
Lack of local supply 24.0
Extra staff time needed to prepare fresh food 22.5
Lack of partially processed products 22.5
Product quality 22.5
Developing relationships with farmers 22.0
Consistent product quality 21.0
Lack of information about where/when local foods are available 20.5
Page | 14

22. What equipment, staffing, and other resources would your operation need to make purchasing and serving local products easier (Table 17)?
Table 17. Equipment, Staffing, and Other Resources Needed to Make Purchasing of Locally Grown Foods Easier
# times mentioned
Public Private
Additional refrigeration 9 9
Additional staff 3 5
Storage space 2 5
Training 2 5
Better/more equipment 4
More prep area and sinks 2 1
Additional food processors at school sites 1 1
Small wares/knives at school sites 1 1
Promotions to parents, students and teachers 1
Central kitchen 1
Quality assurance on the part of farmers 1
Farmer needs to be an approved vendor 2
Additional facility space 1
23. Please tell us what type of information you would find helpful in making locally grown food purchasing decisions (Table 18)?
Table 18. Information Helpful to Making Locally Grown Food Purchasing Decisions
# times mentioned
Public Private
Access/information on farmers wanting to sell to schools 4 8
Information on products available 3 9
Competitive price /information on pricing 3 3
List of approved suppliers or suppliers providing local foods 2 18
How other schools are sourcing products 4
Insurance/liability/legal concerns 2 2
Agent capable of bringing both sides together 2 1
Seasonality is issue/year round availability 2
Packing is issue 1
Techniques for preparation 1
Information through vendor about sustainable practices 1
Page | 15

Page | 16
Questions and Responses: Effectiveness of Jane Lawton Farm‐to‐School Program 24. Have you heard of the Jane Lawton FarmtoSchool1 (Home Grown Week) program? If so, how effective do you feel the Jane Lawton FarmtoSchool (Home School Lunch) program has been at (Table 19):
All public school food service directors had heard about the Jane Lawton Farm‐to‐School
program, while only 10 percent of private school food service respondents had. Only public
school responses are included below.
Table 19: Effectiveness of Jane Lawton Farm‐to‐School Program
Aspects Very Moderately Somewhat Not at all/ no change
Educating students 0 29 47 24
Linking food service directors/farmers 0 29 41 29
Increasing student interest 0 31 38 31
Increasing public's awareness 0 35 53 12
Increasing amount of local foods in meals 0 41 47 12
Developing networks/communication for food service directors 12 35 41 12
Educating food service directors 35 12 35 18
1 In Maryland, the Jane Lawton Farm to School Act was established in 2008 to promote the sale of farm products grown in the state to schools, including creating a promotional event "Maryland Homegrown School Lunch Week." The Act was also meant to provide educational experiences for students related to Farm to School.

About the Research TeamProject Contact: Dr. James Hanson, Project Director and Extension Specialist, University of Maryland’s Department of Agricultural & Resource Economics, [email protected]
Dr. Carolyn Dimitri, Visiting Professor with the Department of Nutrition, Food Studies, and Public Health, New York University ([email protected]). [Research conducted while a Senior Economist, USDA, Economic Research Service].
Lydia Oberholtzer, Senior Researcher, Pennsylvania State University (office in Maryland); [email protected]
Nessa Richman, Consultant, marketing and food systems (Maryland), [email protected]
Jack Gurley, Farmer advisory ‐‐ operator of Calvert’s Gift Farm and President of Future Harvest—A Chesapeake Alliance for Sustainable Agriculture; [email protected]
Dr. Gerald Brust, IPM Vegetable Specialist with the University of Maryland Cooperative Extension; [email protected]
Report Author: Lydia Oberholtzer September, 2010
To obtain a copy of this report, please visit http://mdagnrpolicy.arec.umd.edu/ and select “Local Foods.”
COLLEGE OF AGRICULTURE AND NATURAL RESOURCES Department of Agricultural and Resource Economics 2200 Symons Hall College Park, Maryland 20742‐5535 Telephone: 301.405.1293; Fax: 301.314.9091
Funding for this project was provided by the Northeast Center for Risk Management Education and USDA National Institute of Food and Agriculture (Award Number 2007‐49200‐03888)
Page | 17