Embed Size (px)
Citation preview
Summary of LENR research in Japan
Shinya Narita
Iwate University
Chief-in-directors, Japan CF Research Society
ARPA-E, Low-Energy Nuclear Reactions Workshop October 21, 2021
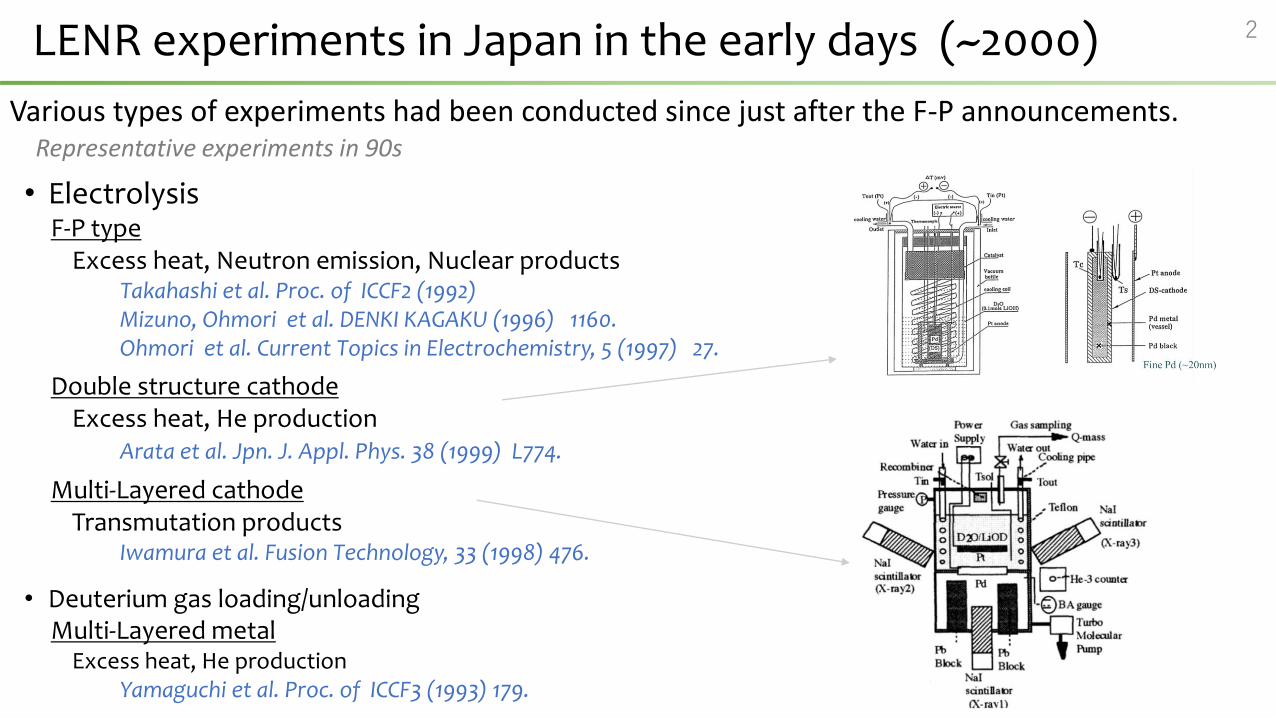
LENR experiments in Japan in the early days (~2000) 2
• ElectrolysisF-P type
Excess heat, Neutron emission, Nuclear products Takahashi et al. Proc. of ICCF2 (1992)Mizuno, Ohmori et al. DENKI KAGAKU (1996) 1160.Ohmori et al. Current Topics in Electrochemistry, 5 (1997) 27.
Double structure cathodeExcess heat, He production
Arata et al. Jpn. J. Appl. Phys. 38 (1999) L774.
Multi-Layered cathode Transmutation products
Iwamura et al. Fusion Technology, 33 (1998) 476.
• Deuterium gas loading/unloadingMulti-Layered metal
Excess heat, He productionYamaguchi et al. Proc. of ICCF3 (1993) 179.
Various types of experiments had been conducted since just after the F-P announcements.Representative experiments in 90s
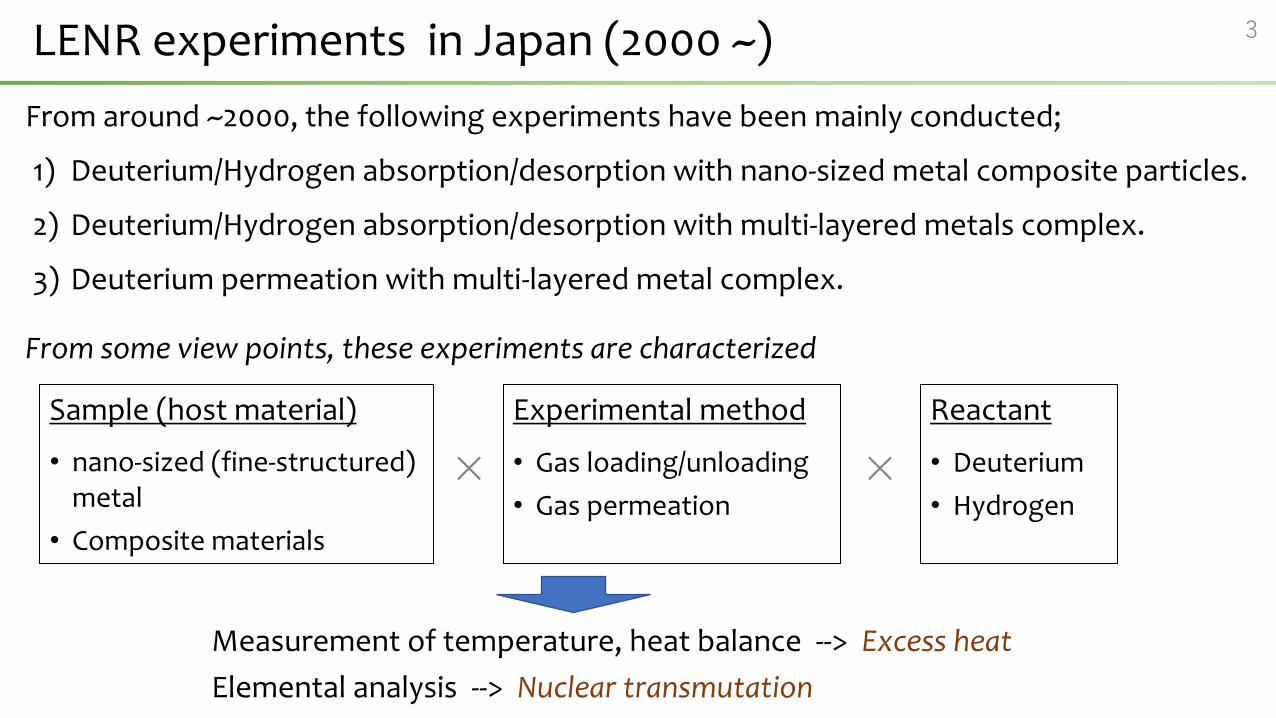
LENR experiments in Japan (2000 ~) 3
From around ~2000, the following experiments have been mainly conducted;
1) Deuterium/Hydrogen absorption/desorption with nano-sized metal composite particles.
2) Deuterium/Hydrogen absorption/desorption with multi-layered metals complex.
3) Deuterium permeation with multi-layered metal complex.
Sample (host material)
• nano-sized (fine-structured)metal
• Composite materials
Experimental method
• Gas loading/unloading
• Gas permeation
Reactant
• Deuterium
• Hydrogen×
Measurement of temperature, heat balance --> Excess heat
Elemental analysis --> Nuclear transmutation
From some view points, these experiments are characterized
×
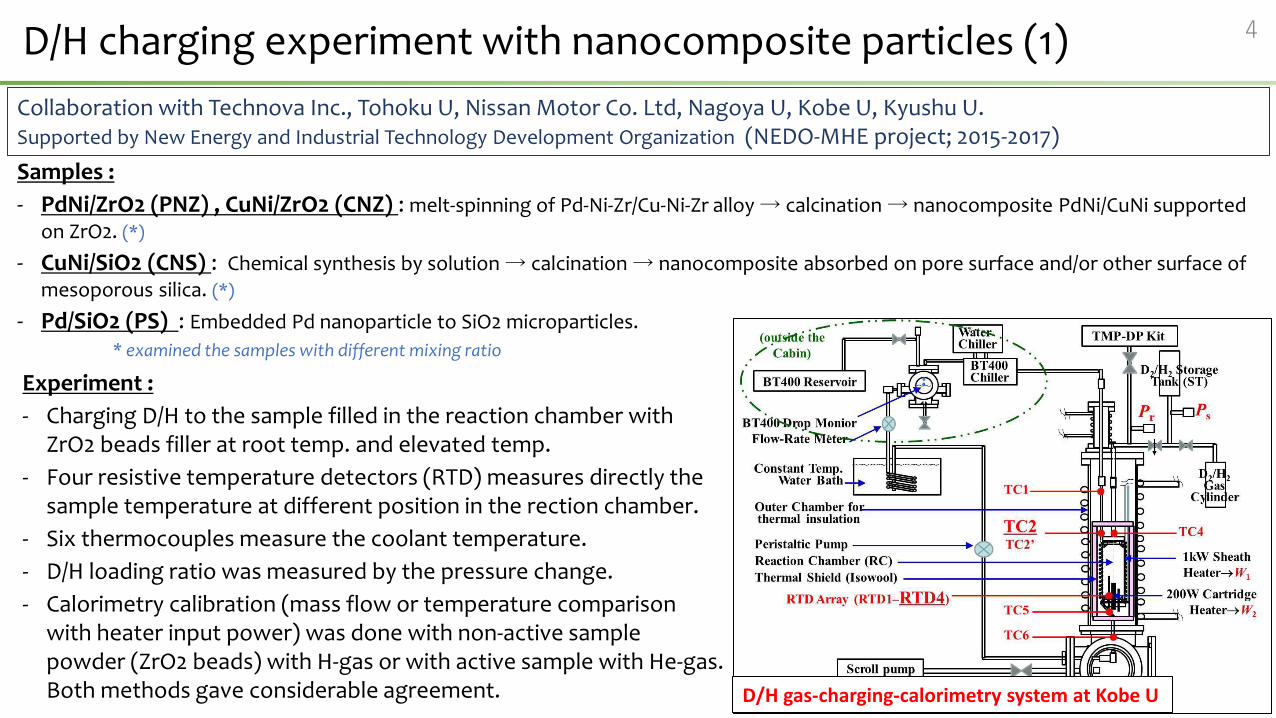
D/H charging experiment with nanocomposite particles (1) 4
Samples :
- PdNi/ZrO2 (PNZ) , CuNi/ZrO2 (CNZ) : melt-spinning of Pd-Ni-Zr/Cu-Ni-Zr alloy → calcination → nanocomposite PdNi/CuNi supported on ZrO2. (*)
- CuNi/SiO2 (CNS) : Chemical synthesis by solution → calcination → nanocomposite absorbed on pore surface and/or other surface of mesoporous silica. (*)
- Pd/SiO2 (PS) : Embedded Pd nanoparticle to SiO2 microparticles.
* examined the samples with different mixing ratio
Collaboration with Technova Inc., Tohoku U, Nissan Motor Co. Ltd, Nagoya U, Kobe U, Kyushu U. Supported by New Energy and Industrial Technology Development Organization (NEDO-MHE project; 2015-2017)
Experiment :
- Charging D/H to the sample filled in the reaction chamber with ZrO2 beads filler at root temp. and elevated temp.
- Four resistive temperature detectors (RTD) measures directly the sample temperature at different position in the rection chamber.
- Six thermocouples measure the coolant temperature.
- D/H loading ratio was measured by the pressure change.
- Calorimetry calibration (mass flow or temperature comparison with heater input power) was done with non-active sample powder (ZrO2 beads) with H-gas or with active sample with He-gas. Both methods gave considerable agreement. D/H gas-charging-calorimetry system at Kobe U
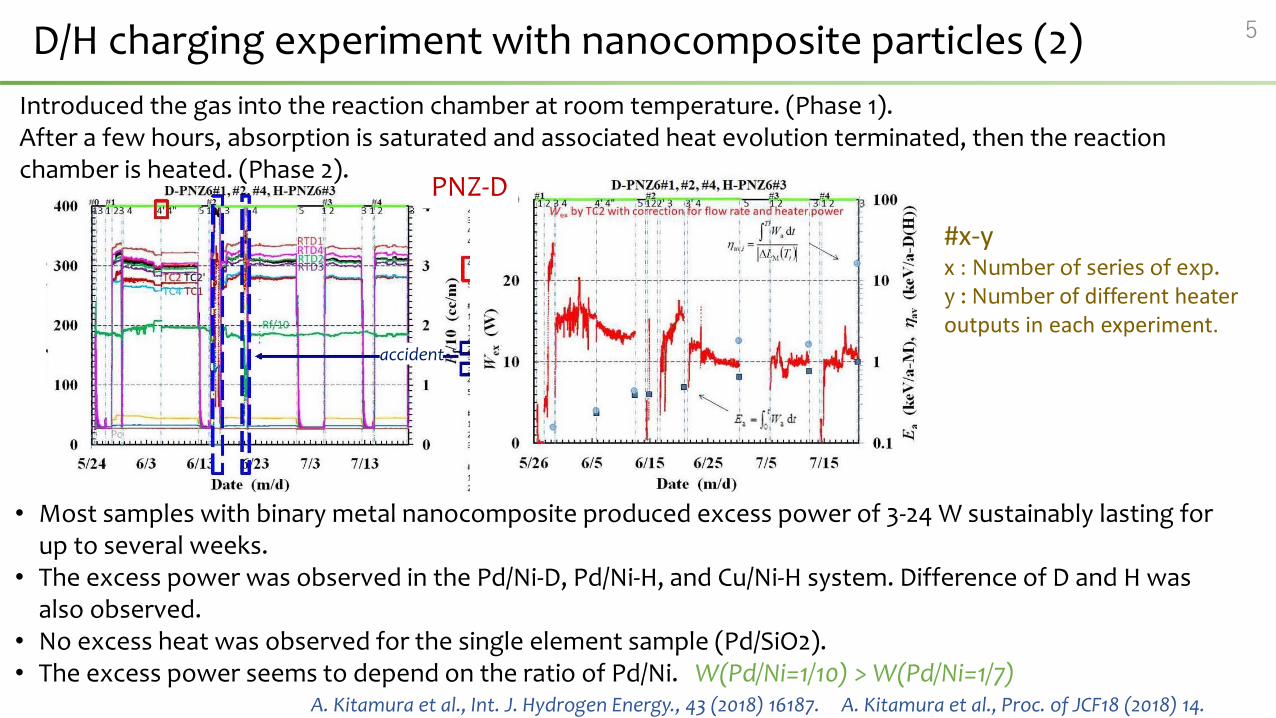
D/H charging experiment with nanocomposite particles (2) 5
A. Kitamura et al., Int. J. Hydrogen Energy., 43 (2018) 16187. A. Kitamura et al., Proc. of JCF18 (2018) 14.
Introduced the gas into the reaction chamber at room temperature. (Phase 1). After a few hours, absorption is saturated and associated heat evolution terminated, then the reaction chamber is heated. (Phase 2).
• Most samples with binary metal nanocomposite produced excess power of 3-24 W sustainably lasting for up to several weeks.
• The excess power was observed in the Pd/Ni-D, Pd/Ni-H, and Cu/Ni-H system. Difference of D and H was also observed.
• No excess heat was observed for the single element sample (Pd/SiO2).• The excess power seems to depend on the ratio of Pd/Ni. W(Pd/Ni=1/10) > W(Pd/Ni=1/7)
PNZ-D
#x-yx : Number of series of exp.y : Number of different heater outputs in each experiment.
accident
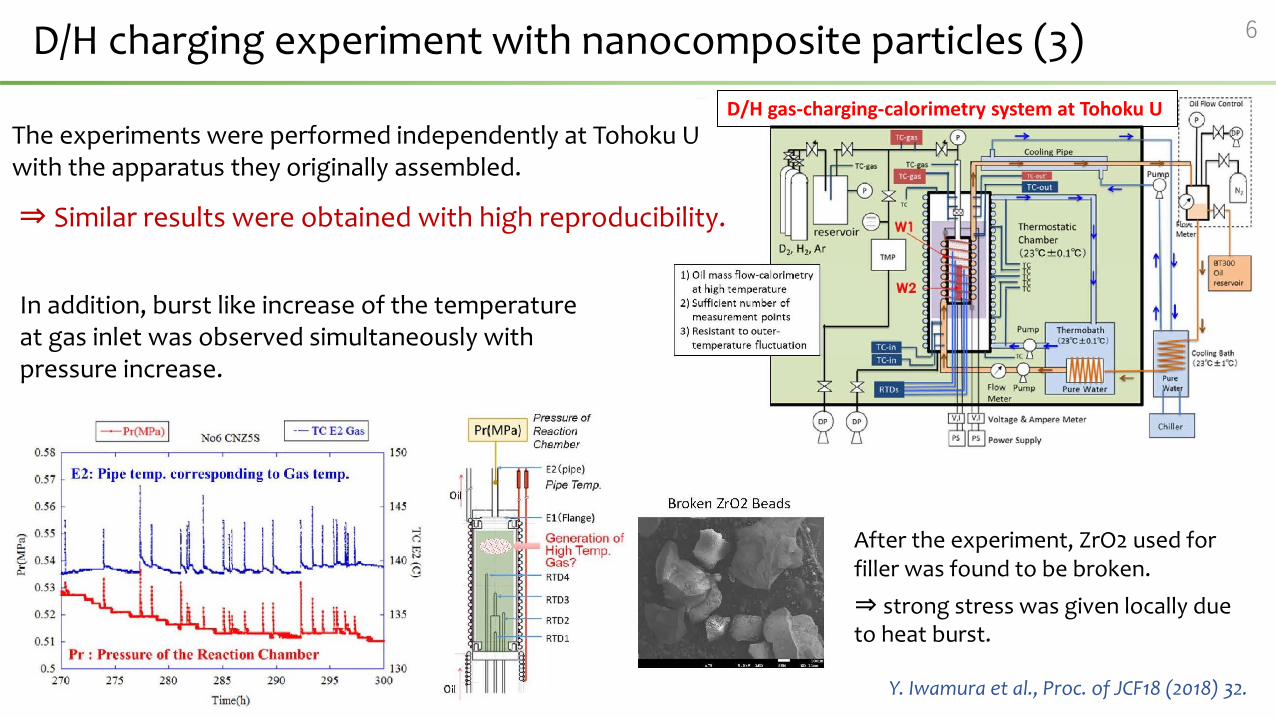
D/H charging experiment with nanocomposite particles (3) 6
The experiments were performed independently at Tohoku U with the apparatus they originally assembled.
⇒ Similar results were obtained with high reproducibility.
Y. Iwamura et al., Proc. of JCF18 (2018) 32.
D/H gas-charging-calorimetry system at Tohoku U
In addition, burst like increase of the temperature at gas inlet was observed simultaneously with pressure increase.
After the experiment, ZrO2 used for filler was found to be broken.
⇒ strong stress was given locally due to heat burst.
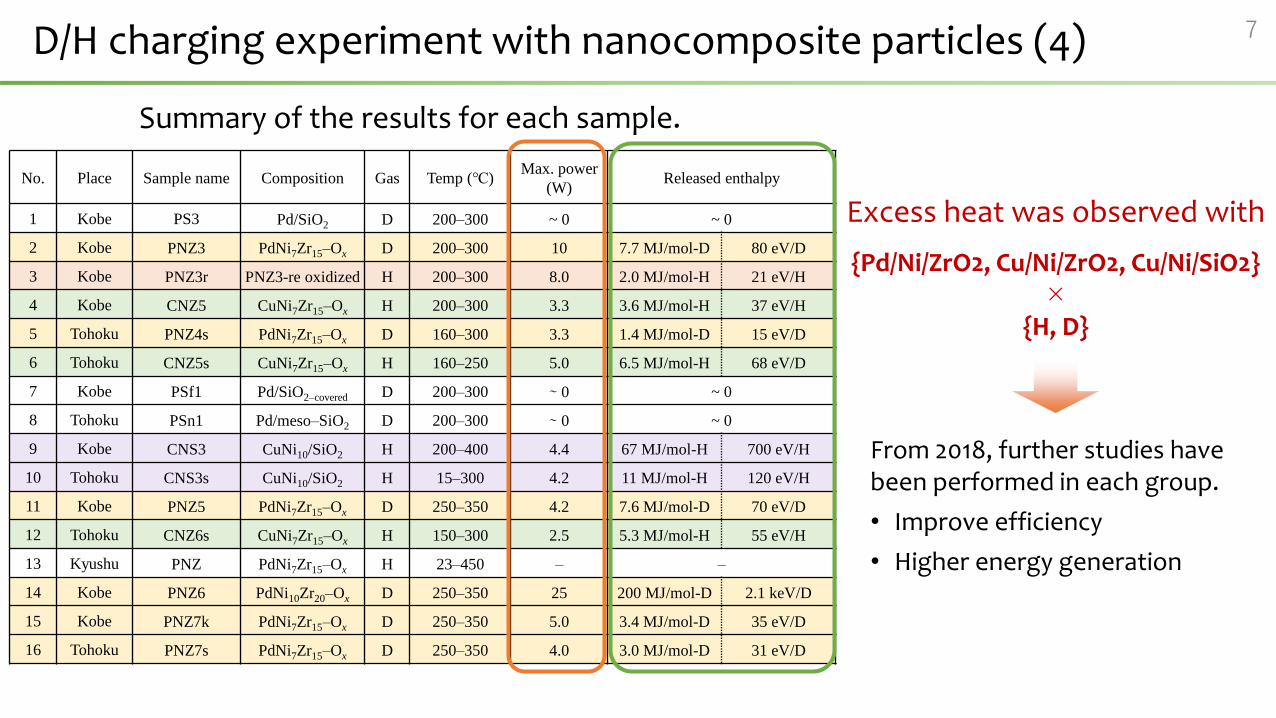
D/H charging experiment with nanocomposite particles (4) 7
Summary of the results for each sample.
From 2018, further studies have been performed in each group.
• Improve efficiency
• Higher energy generation
No. Place Sample name Composition Gas Temp (℃)Max. power
(W)Released enthalpy
1 Kobe PS3 Pd/SiO2 D 200–300 ~ 0 ~ 0
2 Kobe PNZ3 PdNi7Zr15–Ox D 200–300 10 7.7 MJ/mol-D 80 eV/D
3 Kobe PNZ3r PNZ3-re oxidized H 200–300 8.0 2.0 MJ/mol-H 21 eV/H
4 Kobe CNZ5 CuNi7Zr15–Ox H 200–300 3.3 3.6 MJ/mol-H 37 eV/H
5 Tohoku PNZ4s PdNi7Zr15–Ox D 160–300 3.3 1.4 MJ/mol-D 15 eV/D
6 Tohoku CNZ5s CuNi7Zr15–Ox H 160–250 5.0 6.5 MJ/mol-H 68 eV/D
7 Kobe PSf1 Pd/SiO2–covered D 200–300 ∼ 0 ~ 0
8 Tohoku PSn1 Pd/meso–SiO2 D 200–300 ∼ 0 ~ 0
9 Kobe CNS3 CuNi10/SiO2 H 200–400 4.4 67 MJ/mol-H 700 eV/H
10 Tohoku CNS3s CuNi10/SiO2 H 15–300 4.2 11 MJ/mol-H 120 eV/H
11 Kobe PNZ5 PdNi7Zr15–Ox D 250–350 4.2 7.6 MJ/mol-D 70 eV/D
12 Tohoku CNZ6s CuNi7Zr15–Ox H 150–300 2.5 5.3 MJ/mol-H 55 eV/H
13 Kyushu PNZ PdNi7Zr15–Ox H 23–450 – –
14 Kobe PNZ6 PdNi10Zr20–Ox D 250–350 25 200 MJ/mol-D 2.1 keV/D
15 Kobe PNZ7k PdNi7Zr15–Ox D 250–350 5.0 3.4 MJ/mol-D 35 eV/D
16 Tohoku PNZ7s PdNi7Zr15–Ox D 250–350 4.0 3.0 MJ/mol-D 31 eV/D
Excess heat was observed with
{Pd/Ni/ZrO2, Cu/Ni/ZrO2, Cu/Ni/SiO2}×
{H, D}
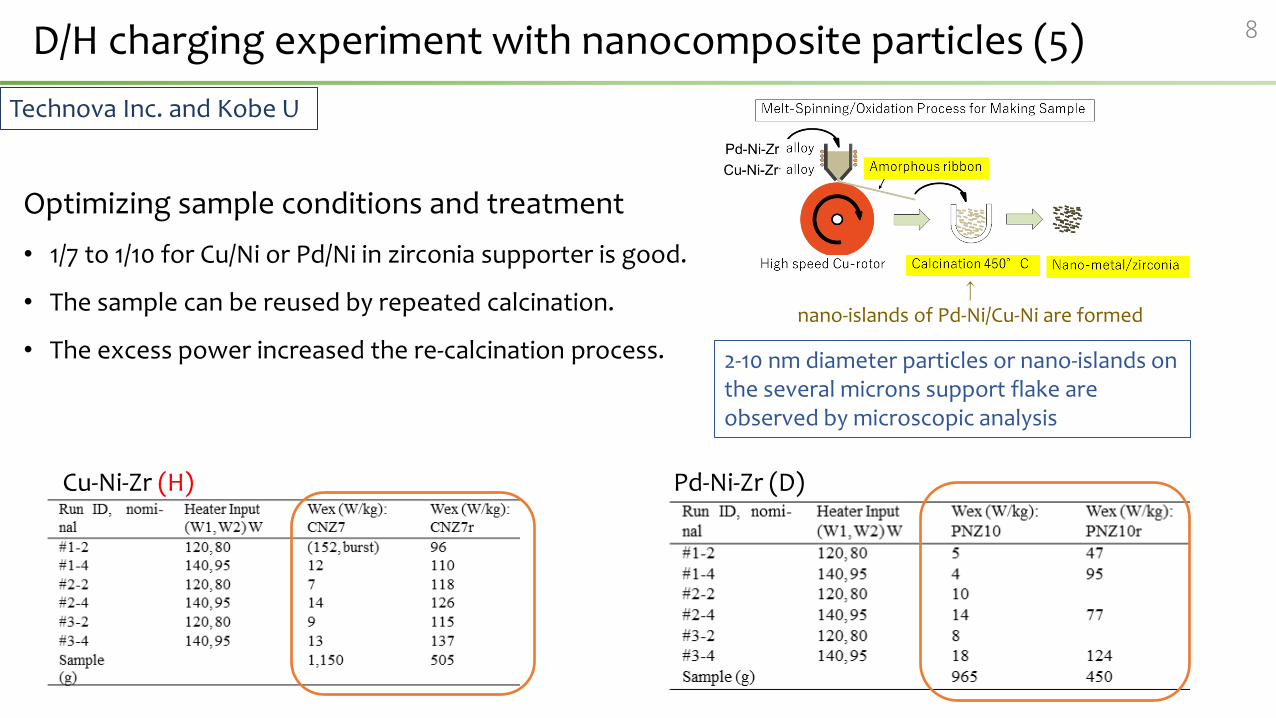
D/H charging experiment with nanocomposite particles (5) 8
Technova Inc. and Kobe U
Optimizing sample conditions and treatment
• 1/7 to 1/10 for Cu/Ni or Pd/Ni in zirconia supporter is good.
• The sample can be reused by repeated calcination.
• The excess power increased the re-calcination process.
Cu-Ni-Zr (H) Pd-Ni-Zr (D)
↑nano-islands of Pd-Ni/Cu-Ni are formed
2-10 nm diameter particles or nano-islands on the several microns support flake are observed by microscopic analysis
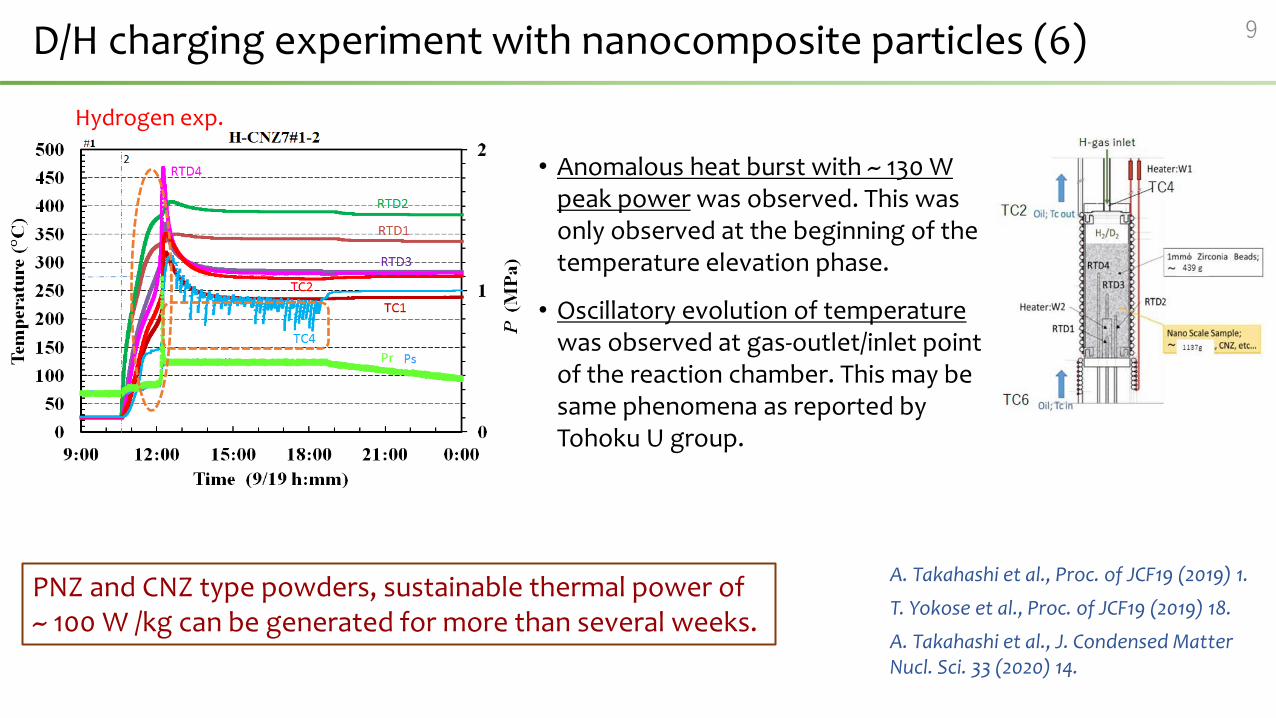
D/H charging experiment with nanocomposite particles (6) 9
• Anomalous heat burst with ~ 130 W peak power was observed. This was only observed at the beginning of the temperature elevation phase.
• Oscillatory evolution of temperature was observed at gas-outlet/inlet point of the reaction chamber. This may be same phenomena as reported by Tohoku U group.
PNZ and CNZ type powders, sustainable thermal power of ~ 100 W /kg can be generated for more than several weeks.
A. Takahashi et al., Proc. of JCF19 (2019) 1.
T. Yokose et al., Proc. of JCF19 (2019) 18.
A. Takahashi et al., J. Condensed Matter Nucl. Sci. 33 (2020) 14.
Hydrogen exp.
D/H charging experiment with nanocomposite particles (7) 10
Current summary
• For CNZ-type powders with hydrogen gas, about 200-300 W/kg excess power for a week has been achieved with 100% reproducibility under certain conditions.
• The COP is in the range of 1.2-1.4. Note that it is in the experiments for characterizing of the phenomena. (Experimental procedures or sample conditions have not been optimized)
• Typical excess power is 10-100 MJ/mol-H (10-100 keV/H). Note that the value “mol-H” here is total amount of absorbed H in the time-interval of excess power observation. But the hydrogen spent for the reaction is considered to be a small fraction of it. Therefore, the excess power per mol-H is underestimated.
⇒ Nuclear reaction origin. (the energy is typically ~ 1-10MeV/H)Non-nuclear explanations should be still considered.
• Sample and operation conditions for improving the efficiency and the released energy are still under study.
− Sample condition and impurity control; microscopic analysis of the sample by various methods comparing before and after experiments.
− Experimental condition; temperature of absorption/desorption.
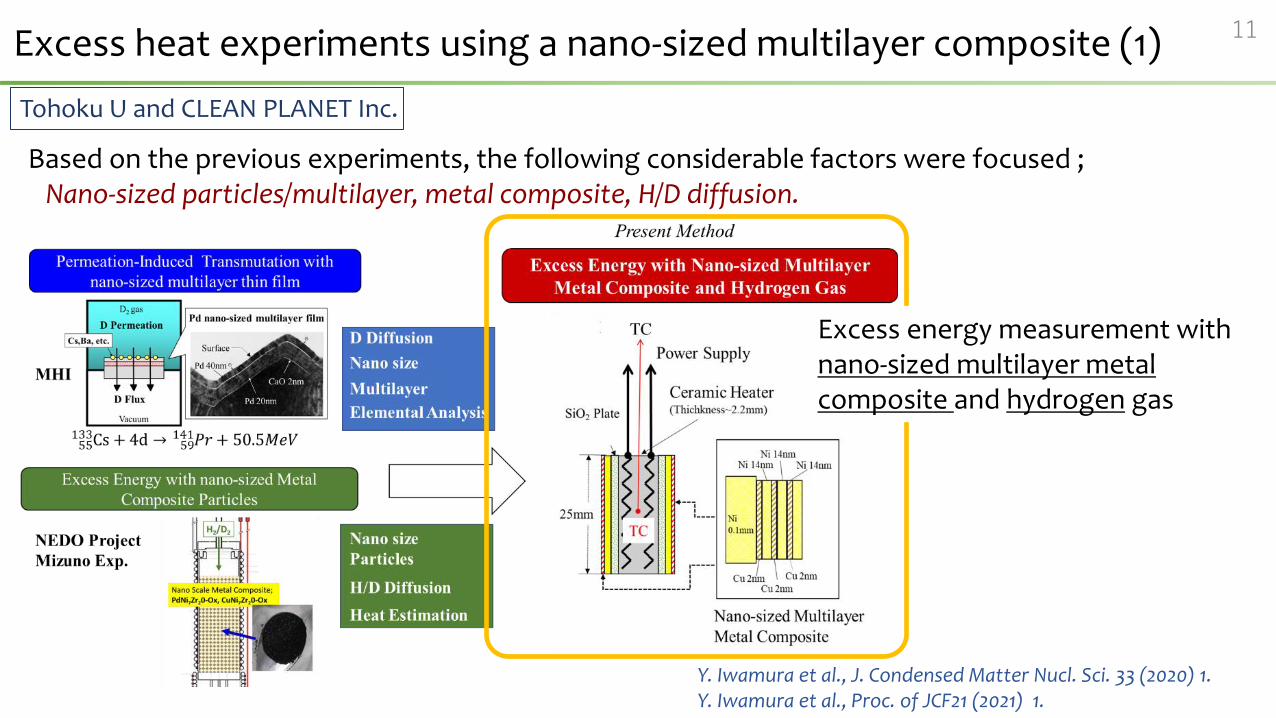
Excess heat experiments using a nano-sized multilayer composite (1) 11
Tohoku U and CLEAN PLANET Inc.
Based on the previous experiments, the following considerable factors were focused ;Nano-sized particles/multilayer, metal composite, H/D diffusion.
Y. Iwamura et al., J. Condensed Matter Nucl. Sci. 33 (2020) 1.Y. Iwamura et al., Proc. of JCF21 (2021) 1.
Excess energy measurement with nano-sized multilayer metal composite and hydrogen gas
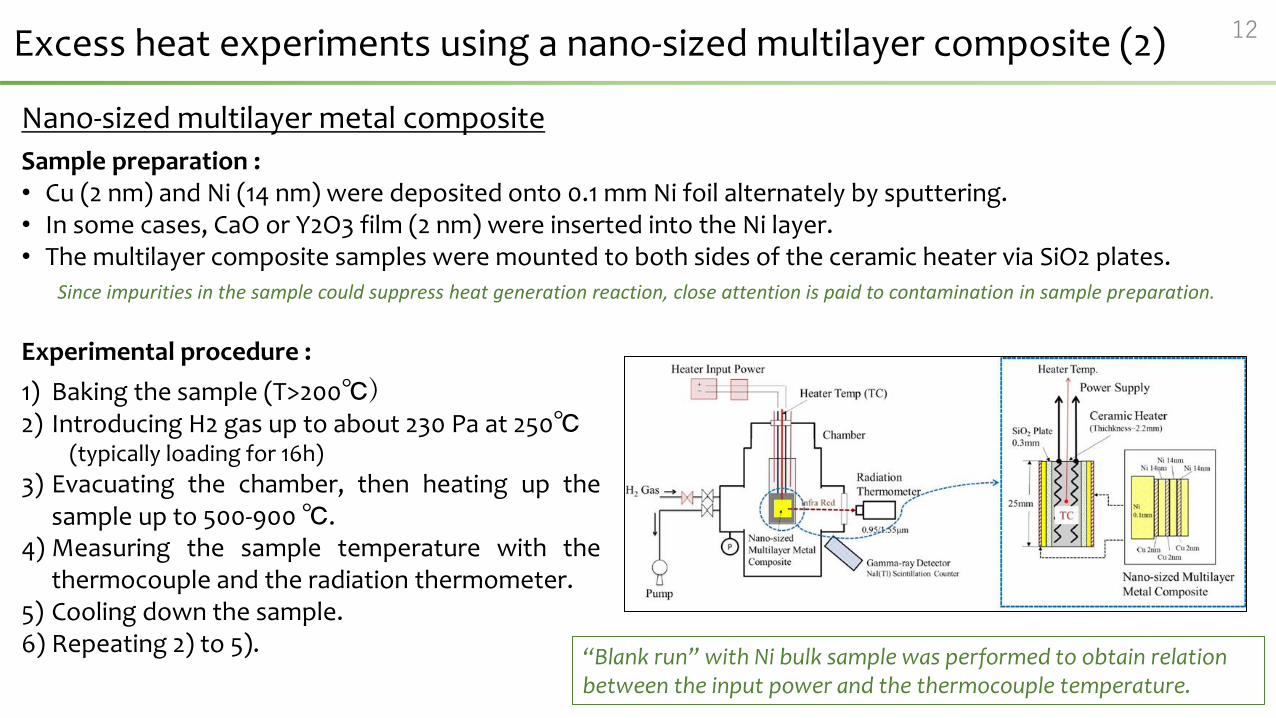
Excess heat experiments using a nano-sized multilayer composite (2) 12
Nano-sized multilayer metal composite
Sample preparation :• Cu (2 nm) and Ni (14 nm) were deposited onto 0.1 mm Ni foil alternately by sputtering.• In some cases, CaO or Y2O3 film (2 nm) were inserted into the Ni layer.• The multilayer composite samples were mounted to both sides of the ceramic heater via SiO2 plates.
Experimental procedure :
1) Baking the sample (T>200℃)2) Introducing H2 gas up to about 230 Pa at 250℃
(typically loading for 16h)
3) Evacuating the chamber, then heating up thesample up to 500-900 ℃.
4) Measuring the sample temperature with thethermocouple and the radiation thermometer.
5) Cooling down the sample.6) Repeating 2) to 5).
“Blank run” with Ni bulk sample was performed to obtain relation between the input power and the thermocouple temperature.
Since impurities in the sample could suppress heat generation reaction, close attention is paid to contamination in sample preparation.
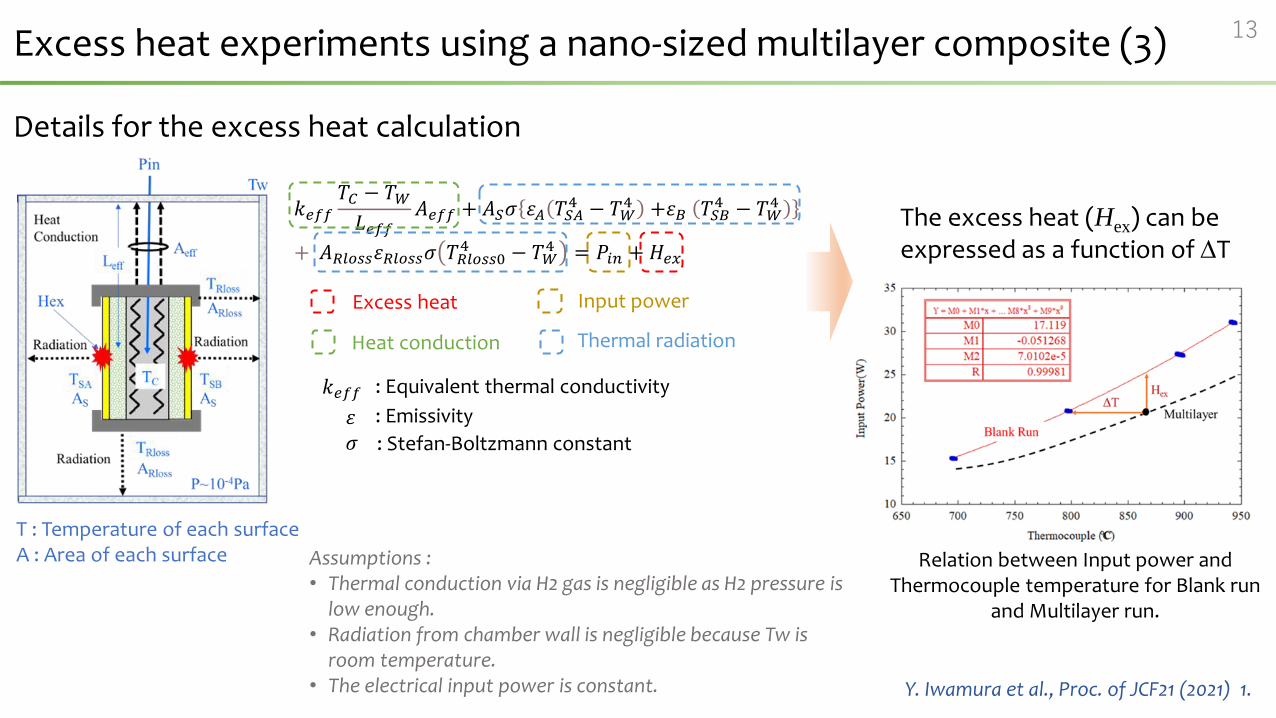
Excess heat experiments using a nano-sized multilayer composite (3) 13
Details for the excess heat calculation
𝑘𝑒𝑓𝑓𝑇𝐶 − 𝑇𝑊𝐿𝑒𝑓𝑓
𝐴𝑒𝑓𝑓 + 𝐴𝑆𝜎 𝜀𝐴 𝑇𝑆𝐴4 − 𝑇𝑊
4 +𝜀𝐵 𝑇𝑆𝐵4 − 𝑇𝑊
4
+ 𝐴𝑅𝑙𝑜𝑠𝑠𝜀𝑅𝑙𝑜𝑠𝑠𝜎 𝑇𝑅𝑙𝑜𝑠𝑠04 − 𝑇𝑊
4 = 𝑃𝑖𝑛 + 𝐻𝑒𝑥
Excess heat Input power
Heat conduction Thermal radiation
𝑘𝑒𝑓𝑓 : Equivalent thermal conductivity
𝜀 : Emissivity
𝜎 : Stefan-Boltzmann constant
T : Temperature of each surfaceA : Area of each surface Assumptions :
• Thermal conduction via H2 gas is negligible as H2 pressure is low enough.
• Radiation from chamber wall is negligible because Tw is room temperature.
• The electrical input power is constant.
Relation between Input power and Thermocouple temperature for Blank run
and Multilayer run.
The excess heat (Hex) can be expressed as a function of DT
Y. Iwamura et al., Proc. of JCF21 (2021) 1.
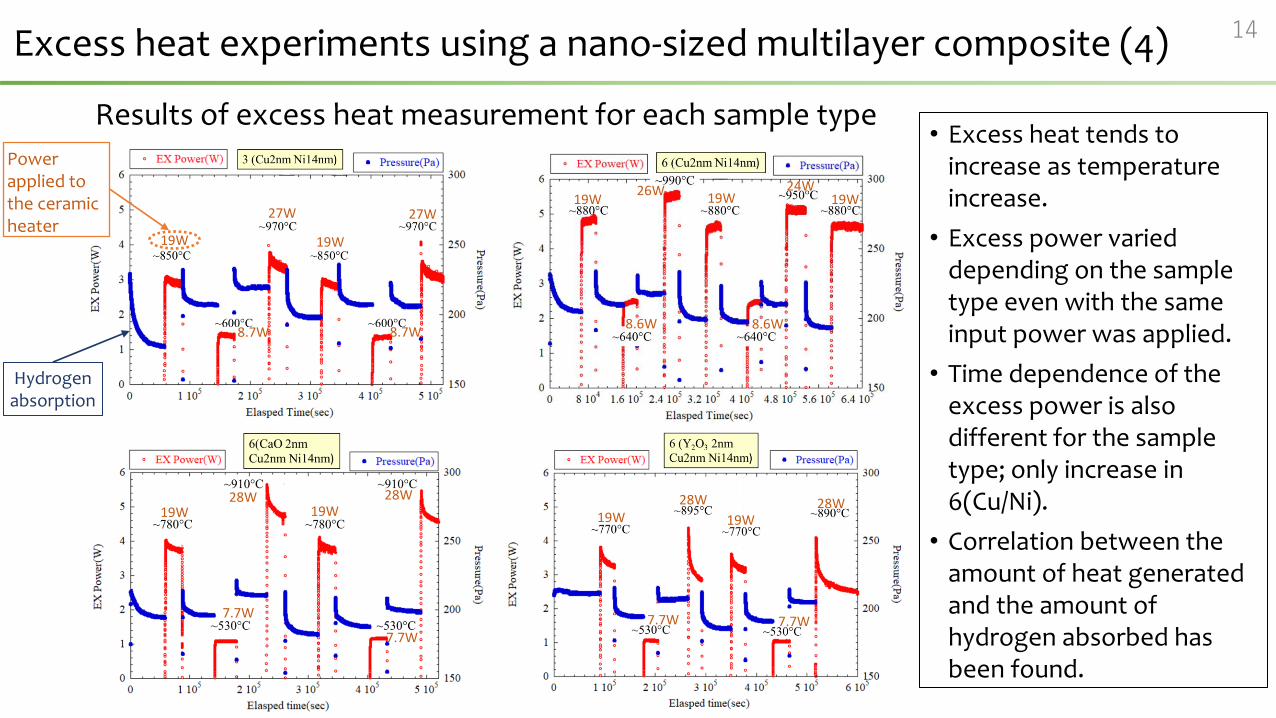
Excess heat experiments using a nano-sized multilayer composite (4) 14
• Excess heat tends to increase as temperature increase.
• Excess power varied depending on the sample type even with the same input power was applied.
• Time dependence of the excess power is also different for the sample type; only increase in 6(Cu/Ni).
• Correlation between the amount of heat generated and the amount of hydrogen absorbed has been found.
Hydrogen absorption
Power applied to the ceramic heater
Results of excess heat measurement for each sample type
19W28W
7.7W
28W19W
7.7W
19W
27W
8.7W
27W
19W
8.7W
19W 19W19W26W 24W
8.6W 8.6W
19W28W 28W
19W
7.7W 7.7W
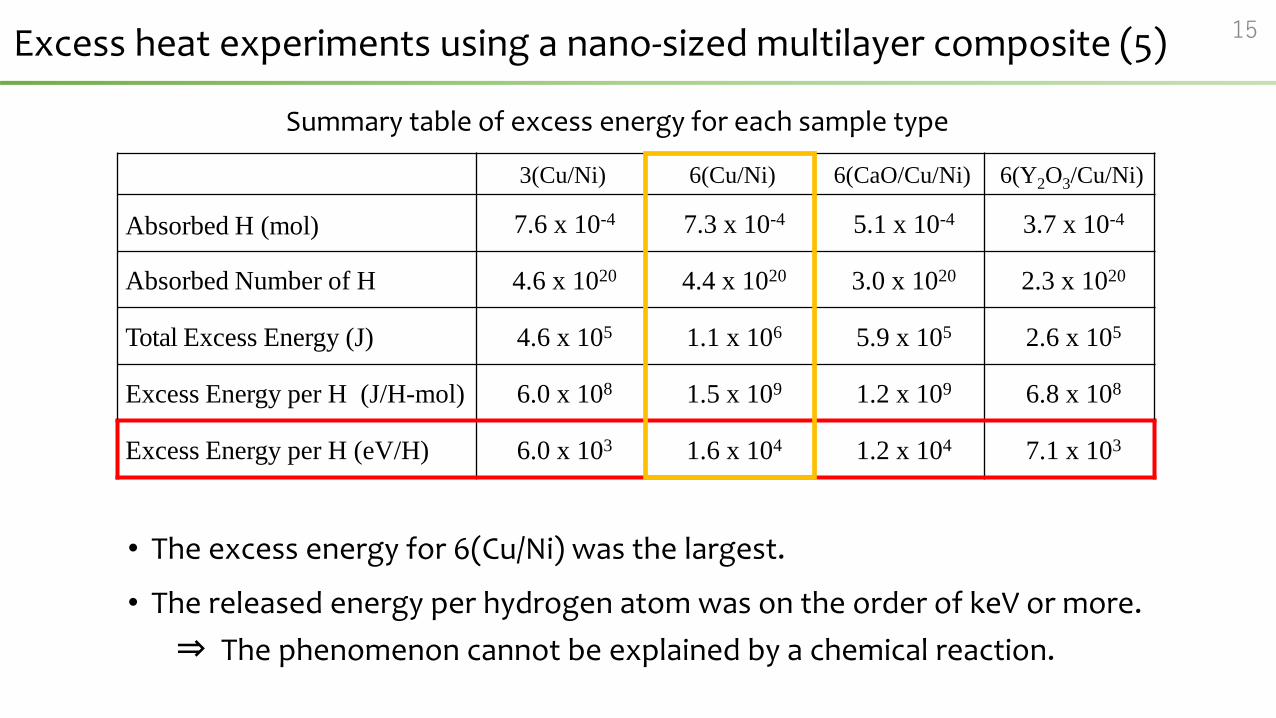
Excess heat experiments using a nano-sized multilayer composite (5) 15
• The excess energy for 6(Cu/Ni) was the largest.
• The released energy per hydrogen atom was on the order of keV or more.
⇒ The phenomenon cannot be explained by a chemical reaction.
3(Cu/Ni) 6(Cu/Ni) 6(CaO/Cu/Ni) 6(Y2O3/Cu/Ni)
Absorbed H (mol) 7.6 x 10⁻⁴ 7.3 x 10⁻⁴ 5.1 x 10⁻⁴ 3.7 x 10⁻⁴
Absorbed Number of H 4.6 x 10²⁰ 4.4 x 10²⁰ 3.0 x 10²⁰ 2.3 x 10²⁰
Total Excess Energy (J) 4.6 x 10⁵ 1.1 x 10⁶ 5.9 x 10⁵ 2.6 x 10⁵
Excess Energy per H (J/H-mol) 6.0 x 10⁸ 1.5 x 10⁹ 1.2 x 10⁹ 6.8 x 10⁸
Excess Energy per H (eV/H) 6.0 x 10³ 1.6 x 10⁴ 1.2 x 10⁴ 7.1 x 10³
Summary table of excess energy for each sample type
Excess heat experiments using a nano-sized multilayer composite (6) 16
Current summary
• The excess power of ~1 GJ/mol-H (~ 10 keV/H) has been observed.
• The excess heat is observed with almost 100% reproducibility if the experiment is repeated under the same conditions. However, at the present, there is still variation in the power by experiment.
• The ratio of the output power to the total input power is 1 ~ 2, currently.
• At present, the excess energy per H is calculated assuming the reaction is attributed to total amount of hydrogen absorbed. In fact, only some of those hydrogens are considered to react. Therefore, the excess power shown is underestimated.
• The released energy in order of > 10keV/H is difficult to be explained by a chemical reaction.
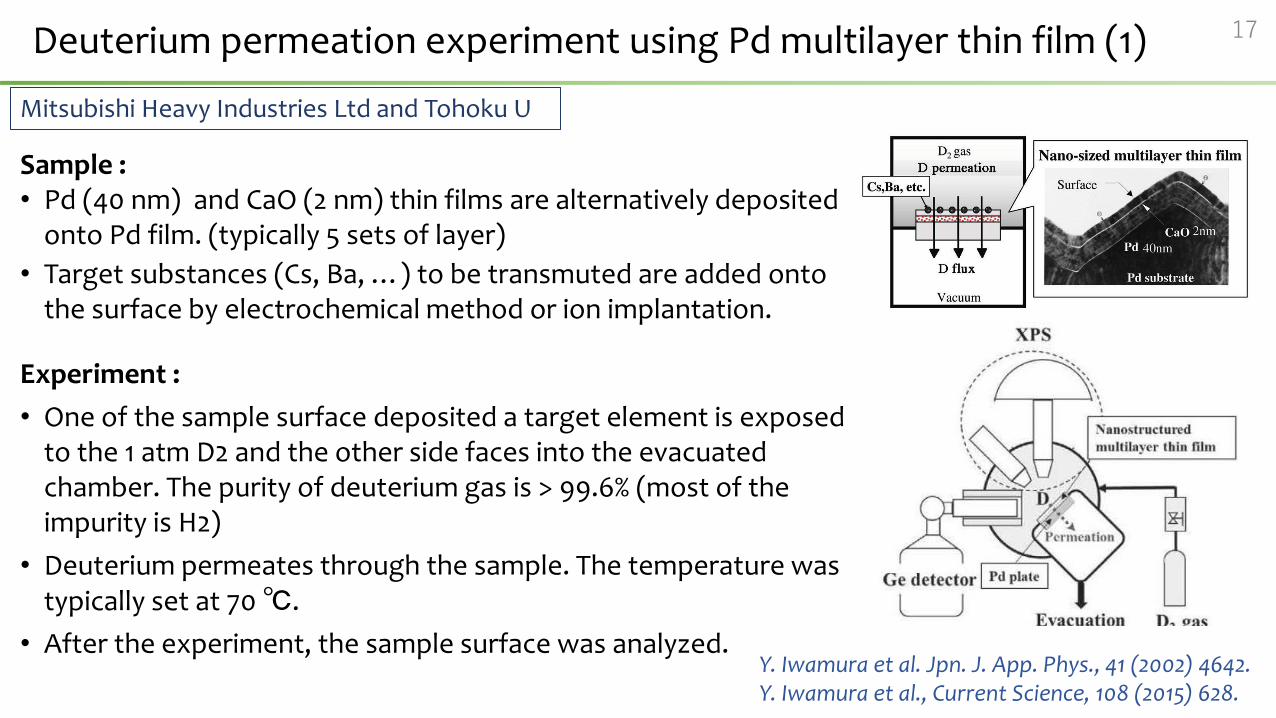
Deuterium permeation experiment using Pd multilayer thin film (1) 17
Y. Iwamura et al. Jpn. J. App. Phys., 41 (2002) 4642.Y. Iwamura et al., Current Science, 108 (2015) 628.
Mitsubishi Heavy Industries Ltd and Tohoku U
Sample :• Pd (40 nm) and CaO (2 nm) thin films are alternatively deposited
onto Pd film. (typically 5 sets of layer)
• Target substances (Cs, Ba, …) to be transmuted are added onto the surface by electrochemical method or ion implantation.
Experiment :
• One of the sample surface deposited a target element is exposed to the 1 atm D2 and the other side faces into the evacuated chamber. The purity of deuterium gas is > 99.6% (most of the impurity is H2)
• Deuterium permeates through the sample. The temperature was typically set at 70 ℃.
• After the experiment, the sample surface was analyzed.
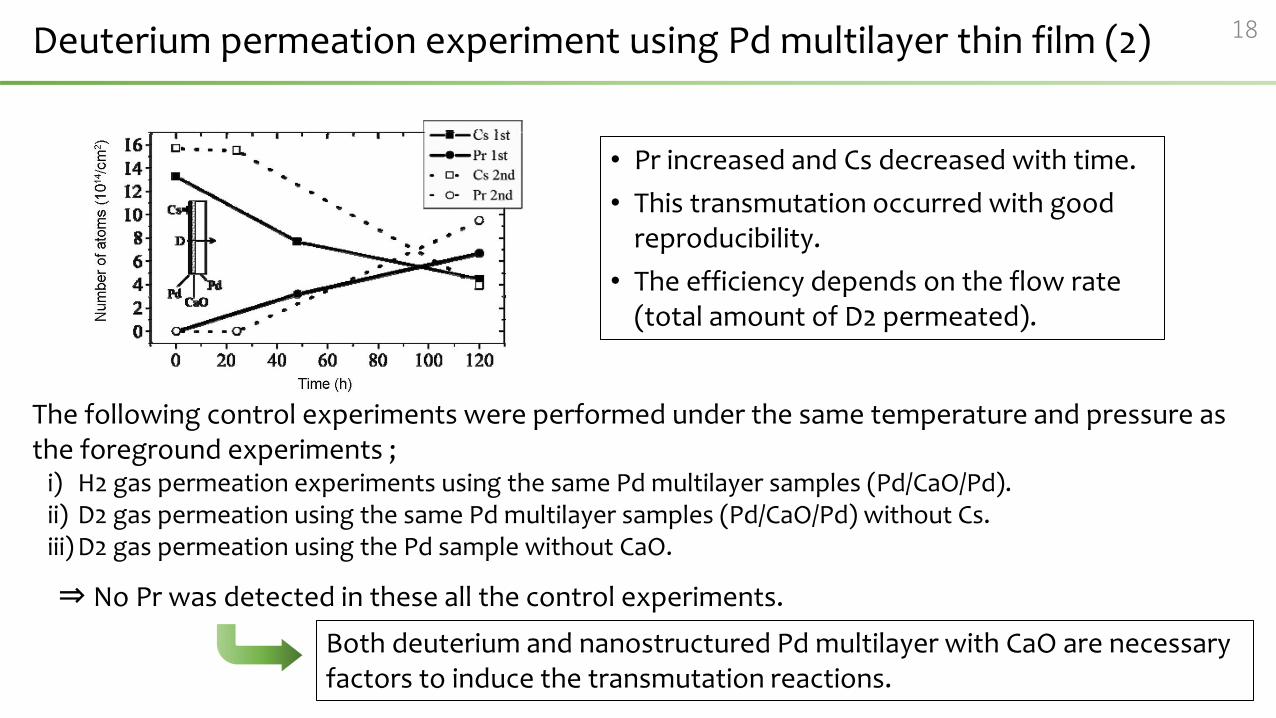
Deuterium permeation experiment using Pd multilayer thin film (2) 18
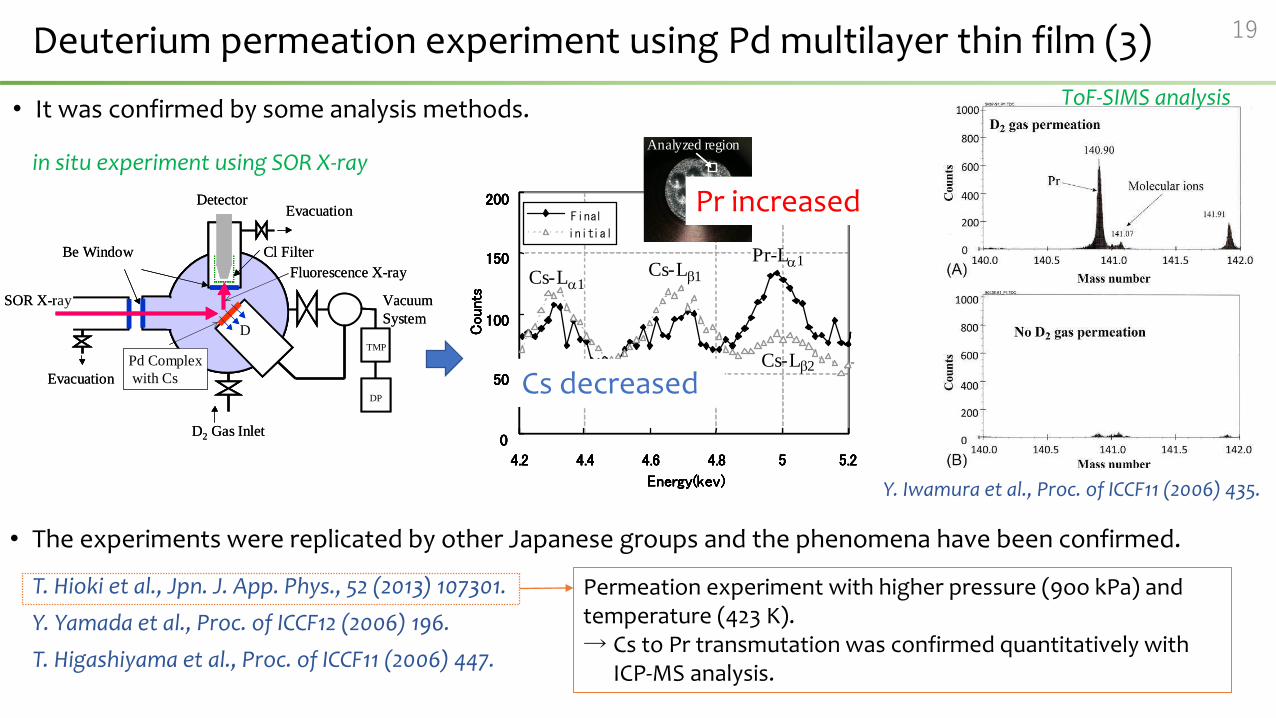
• Pr increased and Cs decreased with time.
• This transmutation occurred with good reproducibility.
• The efficiency depends on the flow rate (total amount of D2 permeated).
The following control experiments were performed under the same temperature and pressure as the foreground experiments ;
i) H2 gas permeation experiments using the same Pd multilayer samples (Pd/CaO/Pd).ii) D2 gas permeation using the same Pd multilayer samples (Pd/CaO/Pd) without Cs.iii) D2 gas permeation using the Pd sample without CaO.
⇒ No Pr was detected in these all the control experiments.
Both deuterium and nanostructured Pd multilayer with CaO are necessary factors to induce the transmutation reactions.
0
50
100
150
200
4.2 4.4 4.6 4.8 5 5.2
Energy(kev)Counts
initial
Final
Cs-L 1Cs-L1
Pr-L 1
Cs-L2
0
50
100
150
200
4.2 4.4 4.6 4.8 5 5.2
Energy(kev)Counts
initial
Final
Cs-L1Cs-L1
Pr-L1
Cs-L2
Analyzed region
0
50
100
150
200
4.2 4.4 4.6 4.8 5 5.2
Energy(kev)Counts
initial
Final
Cs-L 1Cs-L1
Pr-L 1
Cs-L2
0
50
100
150
200
4.2 4.4 4.6 4.8 5 5.2
Energy(kev)Counts
initial
Final
Cs-L1Cs-L1
Pr-L1
Cs-L2
0
50
100
150
200
4.2 4.4 4.6 4.8 5 5.2
Energy(kev)Counts
initial
Final
Cs-L 1Cs-L1
Pr-L 1
Cs-L2
0
50
100
150
200
4.2 4.4 4.6 4.8 5 5.2
Energy(kev)Counts
initial
Final
Cs-L1Cs-L1
Pr-L1
Cs-L2
Analyzed regionAnalyzed region
Deuterium permeation experiment using Pd multilayer thin film (3) 19
• It was confirmed by some analysis methods.
Pr increased
TMP
DP
Be Window
SOR X-ray
Cl Filter
Detector
Evacuation
D2 Gas Inlet
Vacuum
System
Evacuation
Pd Complex
with Cs
D
Fluorescence X-ray
TMP
DP
Be Window
SOR X-ray
Cl Filter
Detector
Evacuation
D2 Gas Inlet
Vacuum
System
Evacuation
Pd Complex
with Cs
D
Fluorescence X-ray
in situ experiment using SOR X-ray
Cs decreased
• The experiments were replicated by other Japanese groups and the phenomena have been confirmed.
T. Hioki et al., Jpn. J. App. Phys., 52 (2013) 107301.
Y. Yamada et al., Proc. of ICCF12 (2006) 196.
T. Higashiyama et al., Proc. of ICCF11 (2006) 447.
Y. Iwamura et al., Proc. of ICCF11 (2006) 435.
ToF-SIMS analysis
Permeation experiment with higher pressure (9oo kPa) and temperature (423 K).→ Cs to Pr transmutation was confirmed quantitatively with
ICP-MS analysis.
Deuterium permeation experiment using Pd multilayer thin film (4) 20
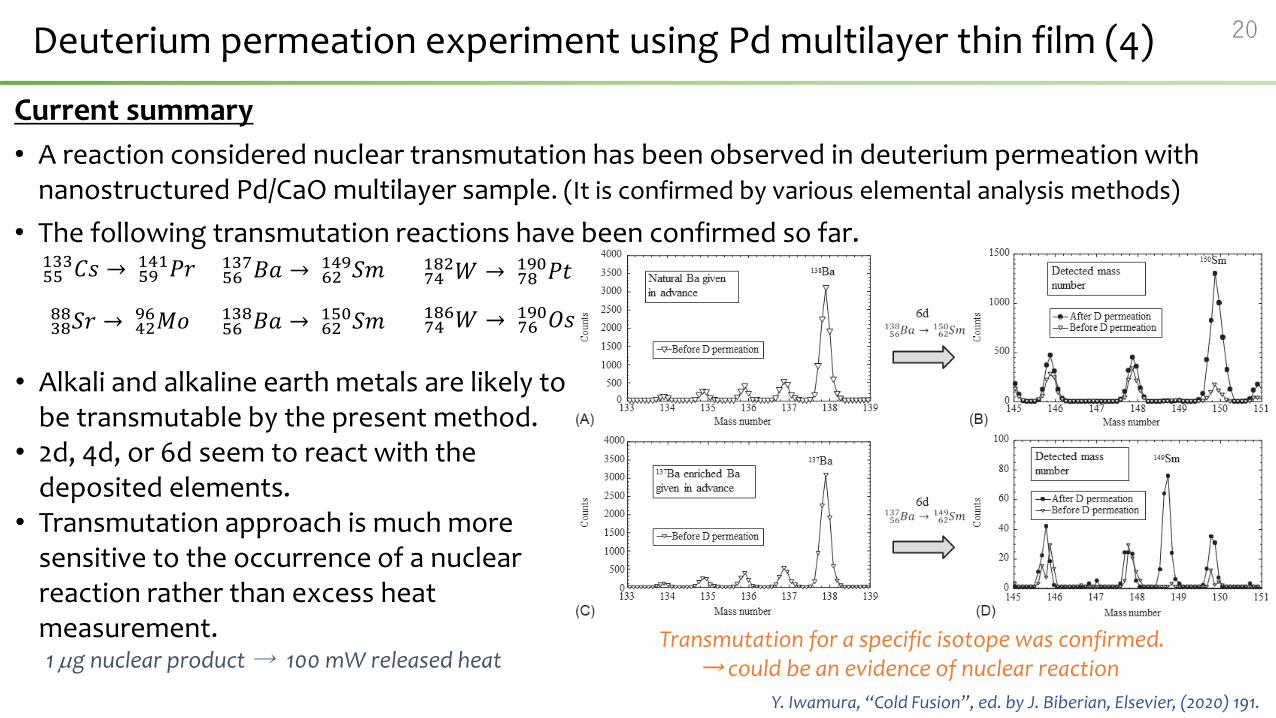
Current summary
• A reaction considered nuclear transmutation has been observed in deuterium permeation with nanostructured Pd/CaO multilayer sample. (It is confirmed by various elemental analysis methods)
• The following transmutation reactions have been confirmed so far.
55133𝐶𝑠 → 59
141𝑃𝑟
3888𝑆𝑟 → 42
96𝑀𝑜 56138𝐵𝑎 → 62
150𝑆𝑚
56137𝐵𝑎 → 62
149𝑆𝑚 74182𝑊 → 78
190𝑃𝑡
74186𝑊 → 76
190𝑂𝑠
• Alkali and alkaline earth metals are likely to be transmutable by the present method.
• 2d, 4d, or 6d seem to react with the deposited elements.
• Transmutation approach is much more sensitive to the occurrence of a nuclear reaction rather than excess heat measurement.1 mg nuclear product → 100 mW released heat
Y. Iwamura, “Cold Fusion”, ed. by J. Biberian, Elsevier, (2020) 191.
Transmutation for a specific isotope was confirmed.→ could be an evidence of nuclear reaction

Other activities in Japan 21
• Other experimentsPNZ-H experiment (Kyushu U, Waseda U, Nissan Motor Corp.)
Deuterium absorption/desorption experiment with laser irradiation (Kyoto U)
Deuterium desorption experiment using multilayer metal sample (Iwate U)
…
• Japan CF-research societyMember: ~70, currentlyObjectives :
Contribute to science and technology development by studying CF phenomena, exchange information between JCF members and organize meeting for CF-research.
Annual meetings :−The meeting has been held 21 times so far. (JCF1-JCF21)−The proceedings have been published for all meetings.
available online from JCF4 from the following link (open access) ;http://www.jcfrs.org/proc_jcf.html
Summary 22
• In Japan, LENR/CMNS research has been continuously and actively conducted.
• In recent years, many important results have been obtained.
✓ Deuterium/Hydrogen sorption/desorption with nano-sized metal composite particles and multi-layered metals complex.− Excess heat has been observed with good reproducibility− It has been observed with not only D but also H.− Observed excess power implies that it is possible to be a nuclear reaction origin.− Studies for improving the efficiency and increase in generated energy are on going by optimizing
the conditions for sample treatment and the experimental procedure.
✓ Deuterium permeation with multi-layered metal complex.− Selective transmutation have been observed with good reproducibility.− Clusters of deuterons are possibly involved in the reaction.
• What is needed for further progress … (personal view)
Experiments in which conditions were systematically varied → clarify the trigger condition and the reaction mechanism.
Engineering study for demonstration of practical use of the reaction.
Detailed and the latest results will be added by Japanese colleague.
Acknowledgement 23
We would like to thank Professor A. Takahashi (Technova) and Professor Y. Iwamura (Tohoku U) for providing information and comments in preparing this material.