Embed Size (px)
Citation preview
Summary Graphs for Relational Database
SchemasXiaoyan Yang (NUS)
Cecilia M. Procopiuc, Divesh Srivastava (AT&T)
Motivation
¨ Complex database schemas in large enterprise systems– 1000+ tables, 10000+ columns, 100000+ PK/FK edges
¨ Prior work to help users understand complex schemas– Customized views (forms) to hide database schema– Present informative tables to simplify schema understanding
¨ Goal: schema graph summary connecting user’s query tables– Needs to be succinct– Needs to preserve informative join paths
2
Complex Schema Graph Example
3
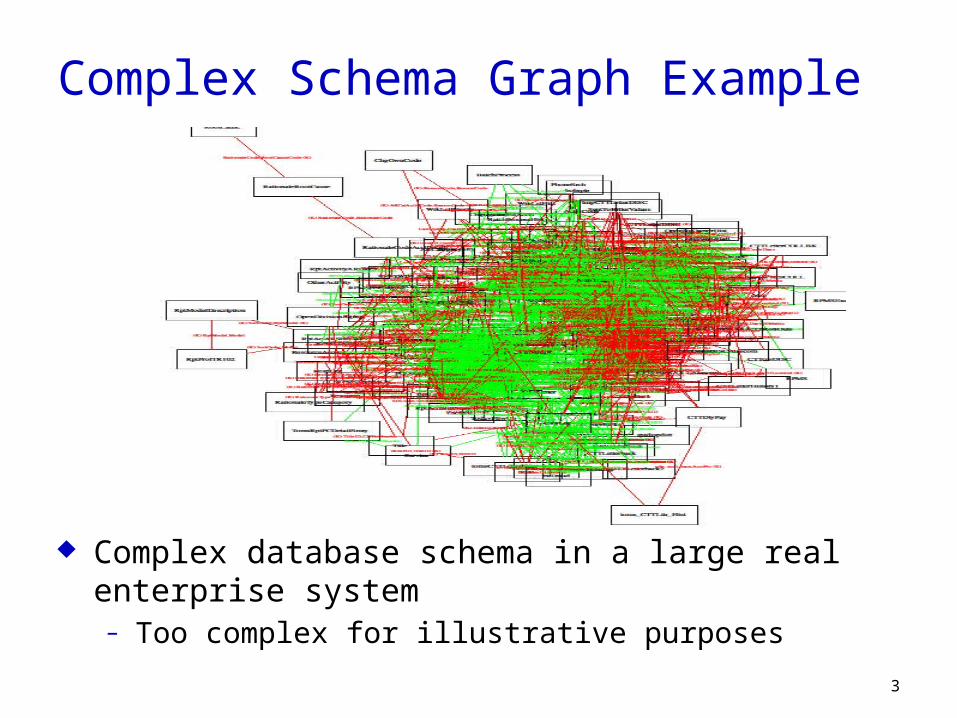
¨ Complex database schema in a large real enterprise system– Too complex for illustrative purposes
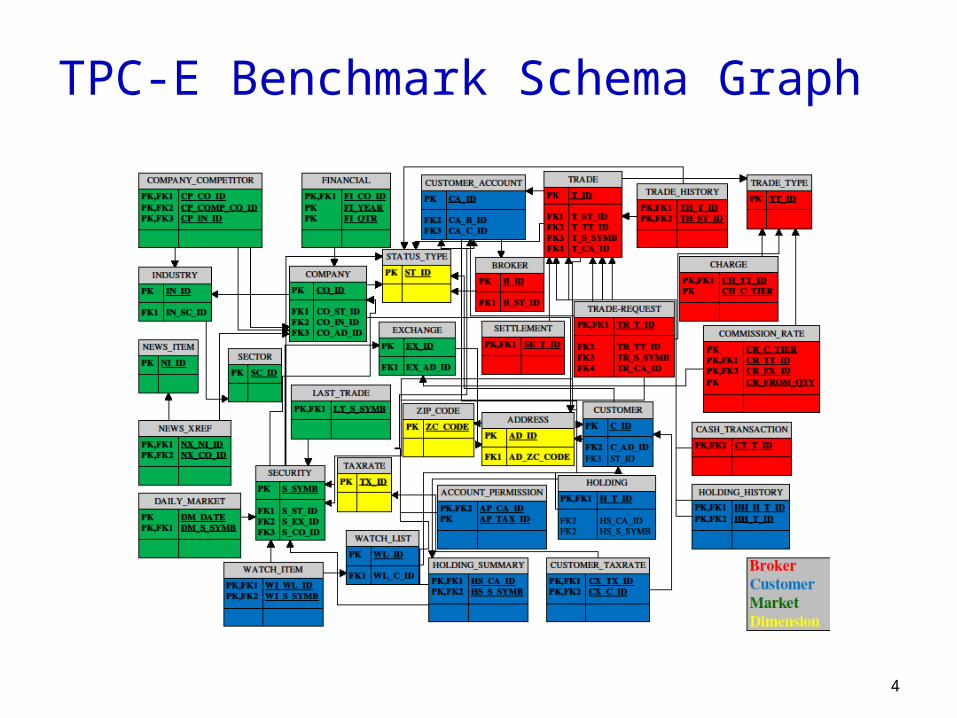
TPC-E Benchmark Schema Graph
4
Useless TPC-E Schema Summary Graph
5
security
trade
customer
status_type
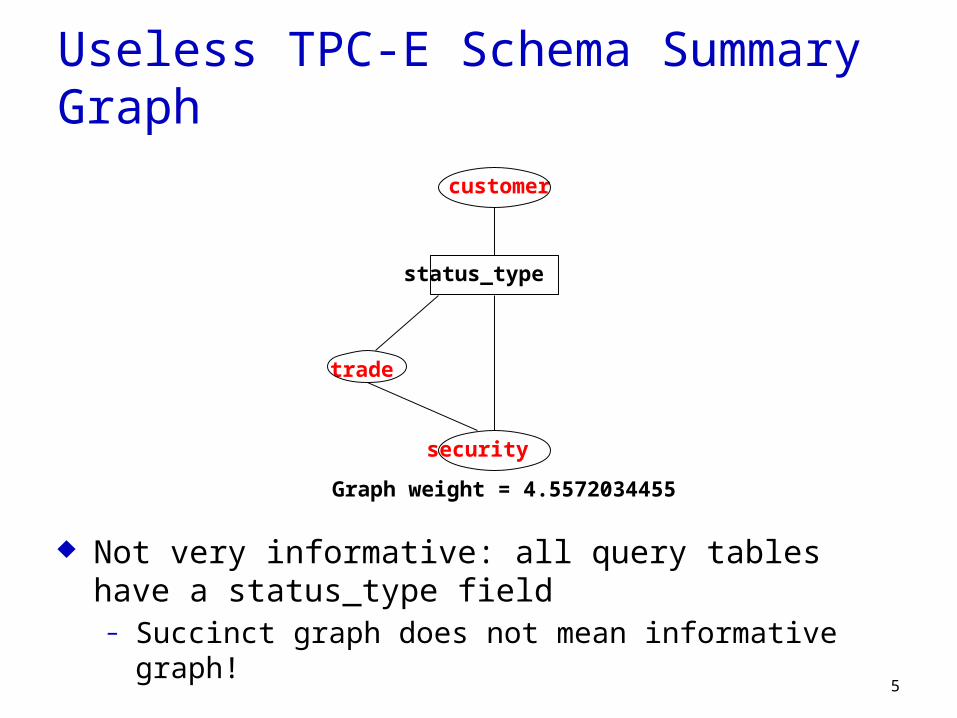
Graph weight = 4.5572034455
¨ Not very informative: all query tables have a status_type field– Succinct graph does not mean informative graph!
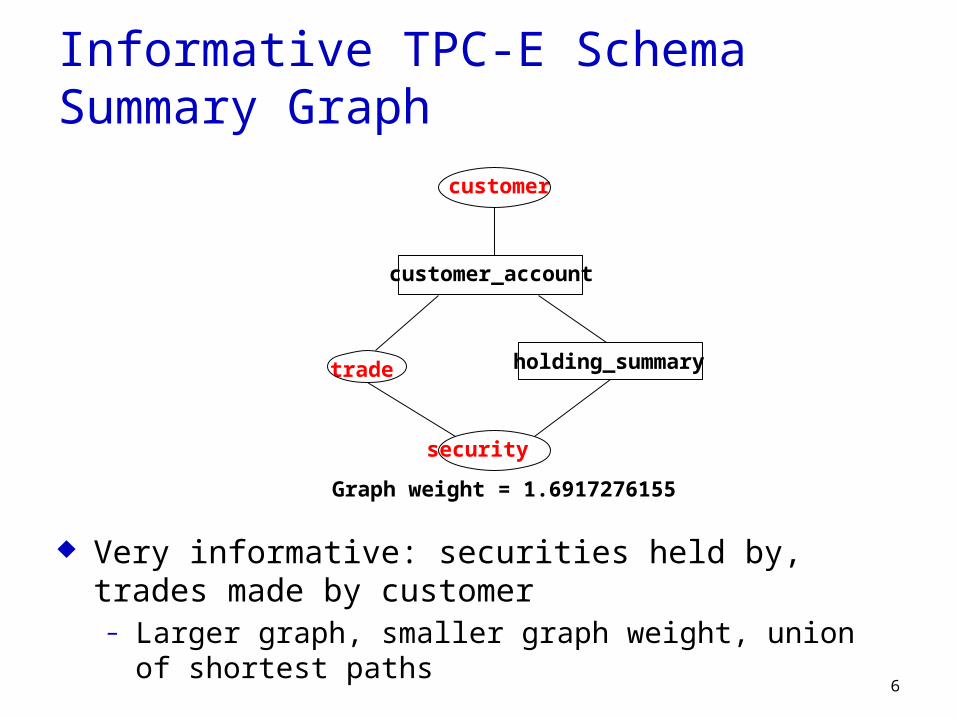
Informative TPC-E Schema Summary Graph
6
customer
customer_account
holding_summary
Graph weight = 1.6917276155
¨ Very informative: securities held by, trades made by customer– Larger graph, smaller graph weight, union of shortest paths
security
trade
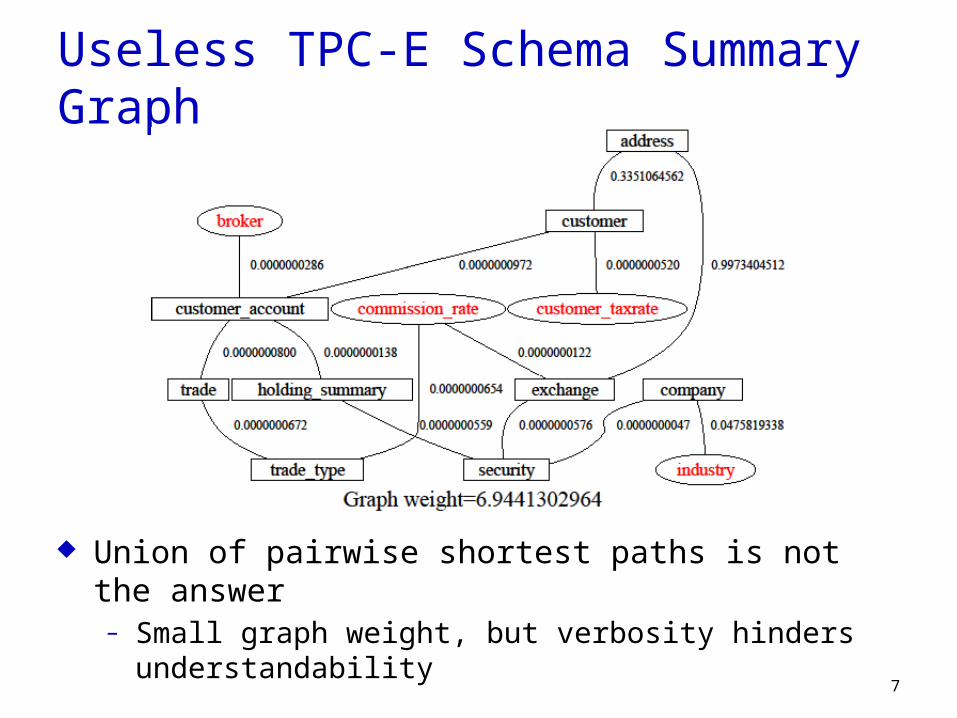
Useless TPC-E Schema Summary Graph
7
¨ Union of pairwise shortest paths is not the answer– Small graph weight, but verbosity hinders understandability
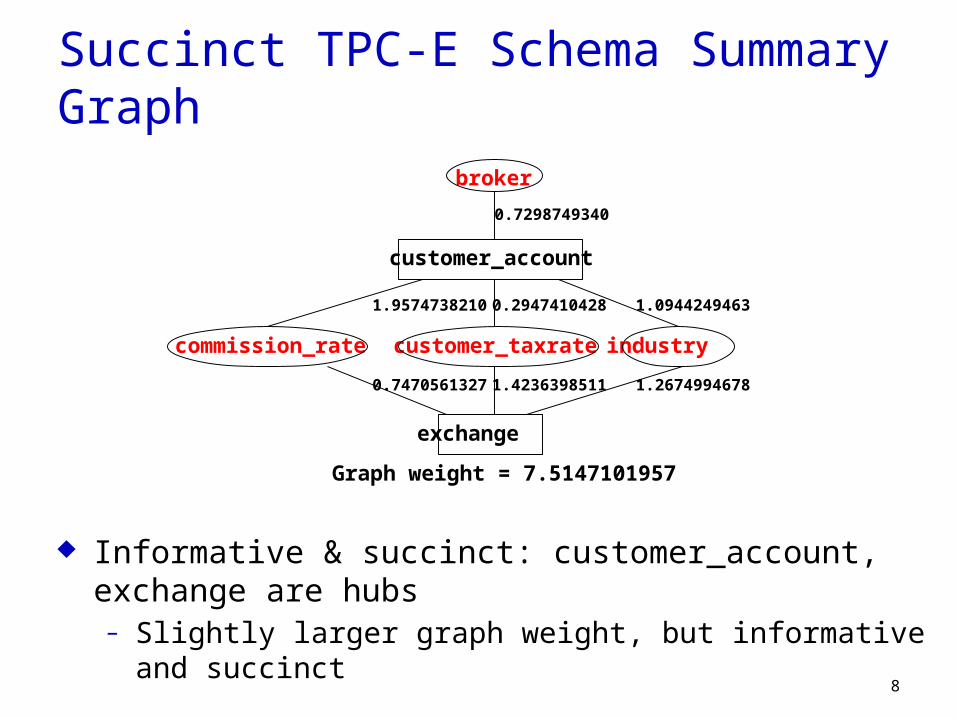
Succinct TPC-E Schema Summary Graph
8
commission_rate customer_taxrate
broker
industry
customer_account
exchange
0.7298749340
0.2947410428 1.09442494631.9574738210
1.4236398511 1.26749946780.7470561327
Graph weight = 7.5147101957
¨ Informative & succinct: customer_account, exchange are hubs– Slightly larger graph weight, but informative and succinct
Outline
¨ Motivation
¨ Problem statement
¨ Our solution– Defining schema edge weights– Computing summary graphs
¨ Experimental results
9
Desiderata
¨ Schema graph summary must be informative and succinct
¨ Need a formal definition of “informative”– Use Information Theory
¨ Need a formal definition of “succinct”– Use Graph Summarization
10
Problem Statement 1: Informative Edges¨ Given schema graph G = (R, E) and database instance D
¨ Problem 1: define schema edge weights, wt: E R+
– More informative join edges have smaller weights (≥ 0)– Extend wt(R1, R2) = weight of shortest path between R1 and R2
11
Problem Statement 2: Succinct Graph¨ Given schema G = (R, E), weight wt, user-specified tables Q
¨ Problem 2: compute summary graph (Rs, Es)– Q Rs R, |Rs| ≤ |Q|+B, for a given small budget B– Meta-edges Es {(R1, R2) | exists path between R1 and R2 in G}– (Rs, Es) must preserve shortest paths between Q tables in G– Optimize: (Rs, Es) has the minimum sum of meta-edge weights
12
Outline
¨ Motivation
¨ Problem statement
¨ Our solution– Defining schema edge weights– Computing summary graphs
¨ Experimental results
13
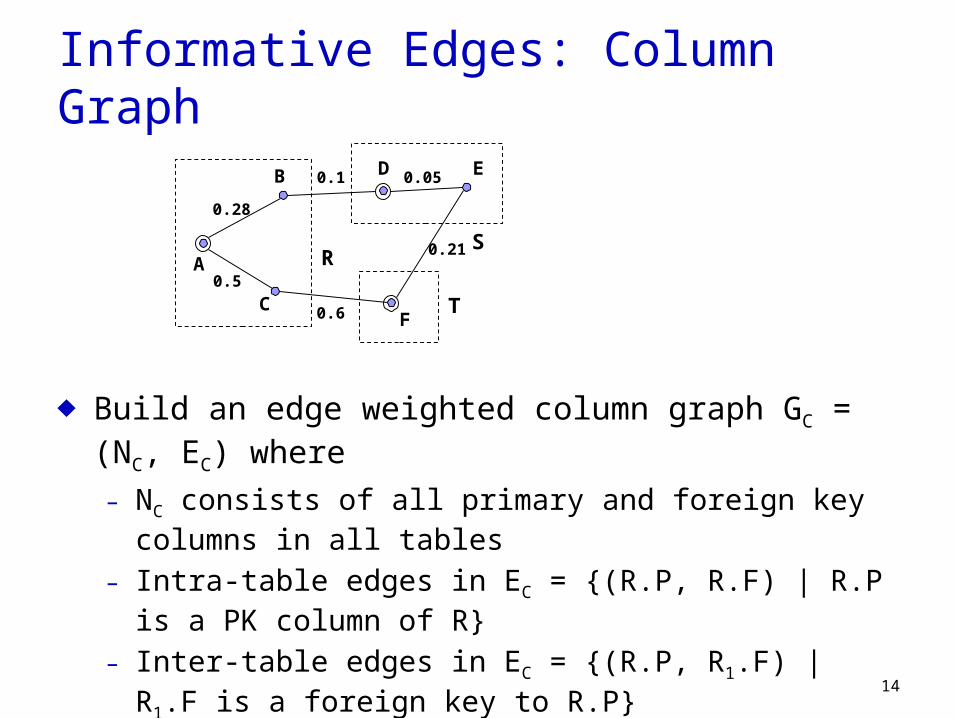
Informative Edges: Column Graph
¨ Build an edge weighted column graph GC = (NC, EC) where – NC consists of all primary and foreign key columns in all tables– Intra-table edges in EC = {(R.P, R.F) | R.P is a PK column of R}– Inter-table edges in EC = {(R.P, R1.F) | R1.F is a foreign key to R.P}– Edge weights based on mutual information between columns
14
A
B
C
D E
F
RS
T
0.28
0.5
0.1
0.6
0.05
0.21
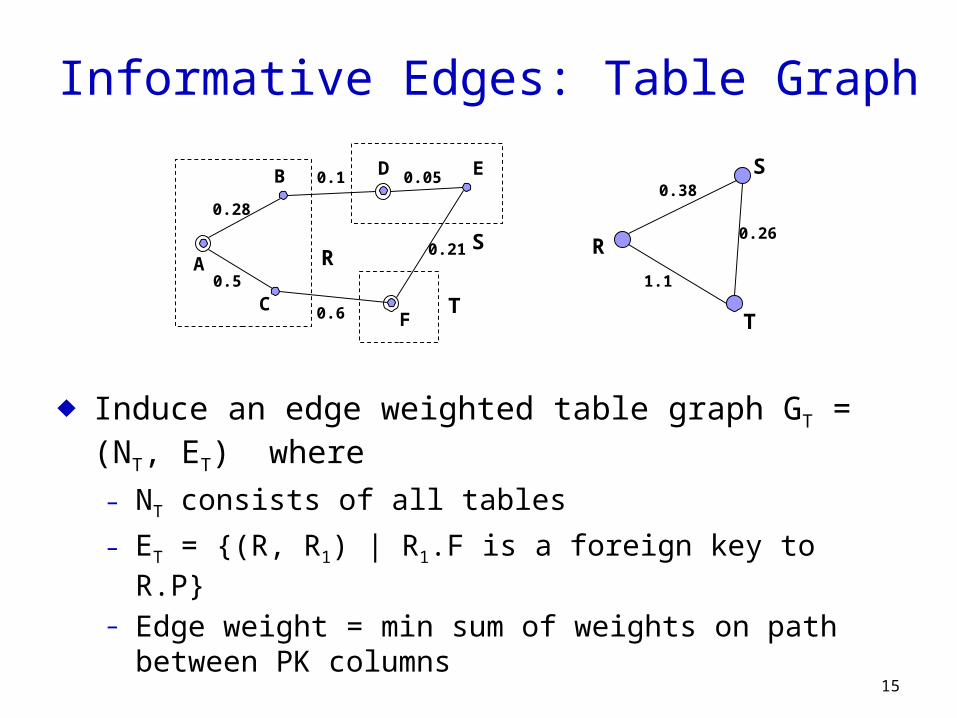
Informative Edges: Table Graph
¨ Induce an edge weighted table graph GT = (NT, ET) where– NT consists of all tables– ET = {(R, R1) | R1.F is a foreign key to R.P}– Edge weight = min sum of weights on path between PK columns
15
A
B
C
D E
F
RS
T
R
S
T
0.28
0.5
0.1
0.6
0.05
0.21
0.38
0.26
1.1
Edge Weight: Using Mutual Information
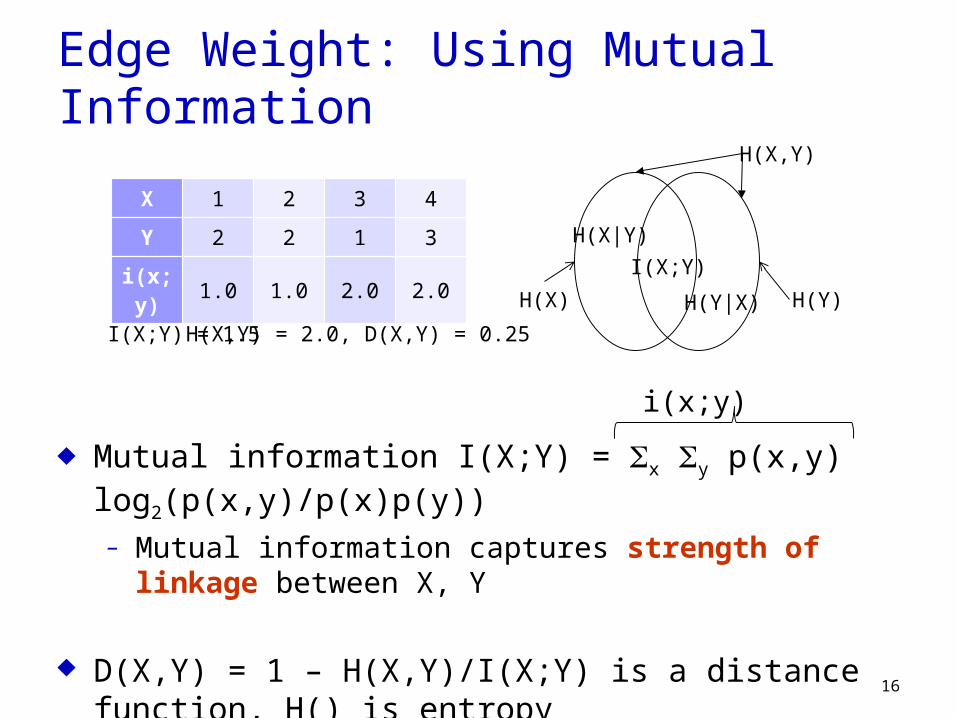
¨ Mutual information I(X;Y) = Sx Sy p(x,y) log2(p(x,y)/p(x)p(y))– Mutual information captures strength of linkage between X, Y
¨ D(X,Y) = 1 – H(X,Y)/I(X;Y) is a distance function, H() is entropy– D(X,Y) = 0 iff X, Y are identical; D(X,Y) = 1 iff X, Y are independent
16
X 1 2 3 4
Y 2 2 1 3
i(x;y) 1.0 1.0 2.0 2.0
I(X;Y) = 1.5 H(X,Y) = 2.0, D(X,Y) = 0.25
i(x;y)
H(X|Y)I(X;Y)
H(Y|X)H(X)
H(X,Y)
H(Y)

Outline
¨ Motivation
¨ Problem statement
¨ Our solution– Defining schema edge weights– Computing summary graphs
¨ Experimental results
17
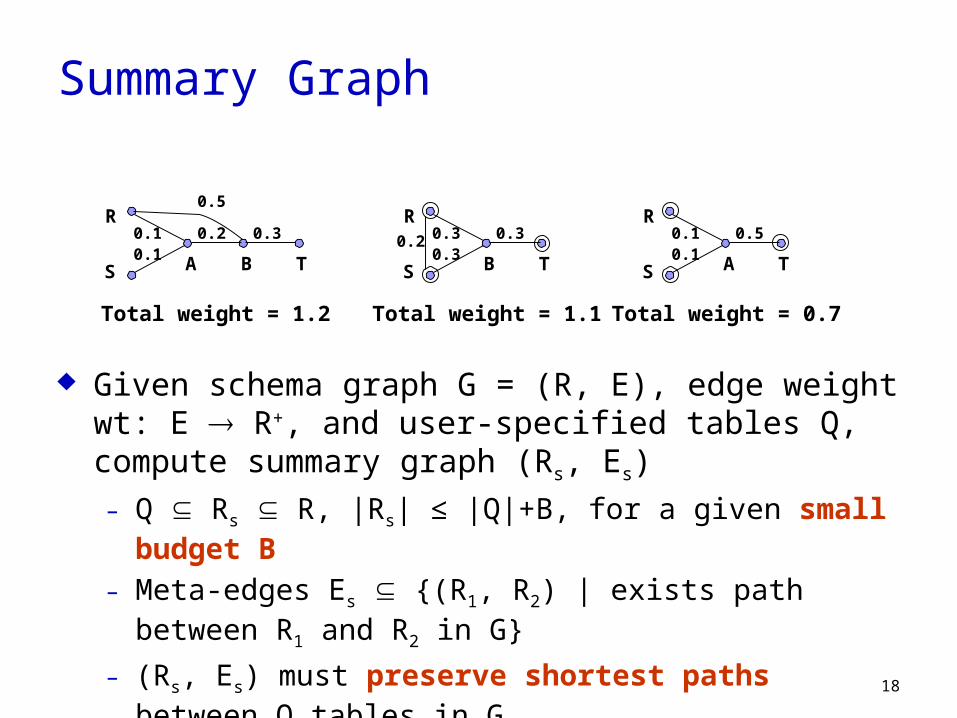
Summary Graph
¨ Given schema graph G = (R, E), edge weight wt: E R+, and user-specified tables Q, compute summary graph (Rs, Es)– Q Rs R, |Rs| ≤ |Q|+B, for a given small budget B– Meta-edges Es {(R1, R2) | exists path between R1 and R2 in G}– (Rs, Es) must preserve shortest paths between Q tables in G– Optimize: (Rs, Es) has the minimum sum of meta-edge weights
18
R
S B T
0.3 0.30.3
0.2R
S A B T
0.5
0.1 0.2 0.30.1
Total weight = 1.2 Total weight = 1.1
R
S A T
0.1 0.50.1
Total weight = 0.7
Properties of Summary Graphs
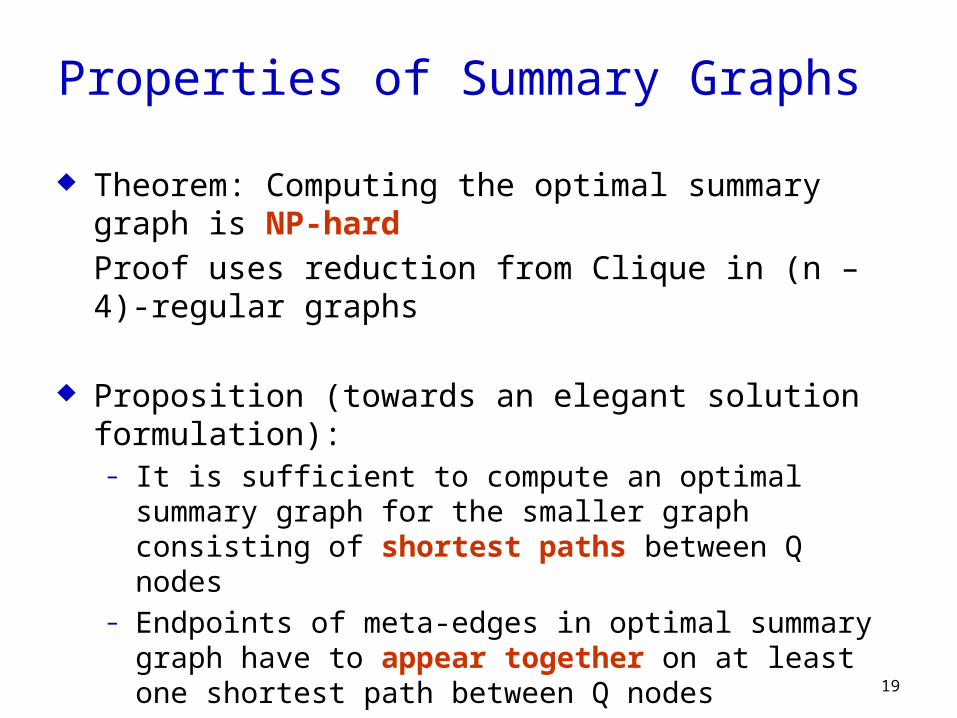
¨ Theorem: Computing the optimal summary graph is NP-hardProof uses reduction from Clique in (n – 4)-regular graphs
¨ Proposition (towards an elegant solution formulation): – It is sufficient to compute an optimal summary graph for the
smaller graph consisting of shortest paths between Q nodes– Endpoints of meta-edges in optimal summary graph have to
appear together on at least one shortest path between Q nodes
19
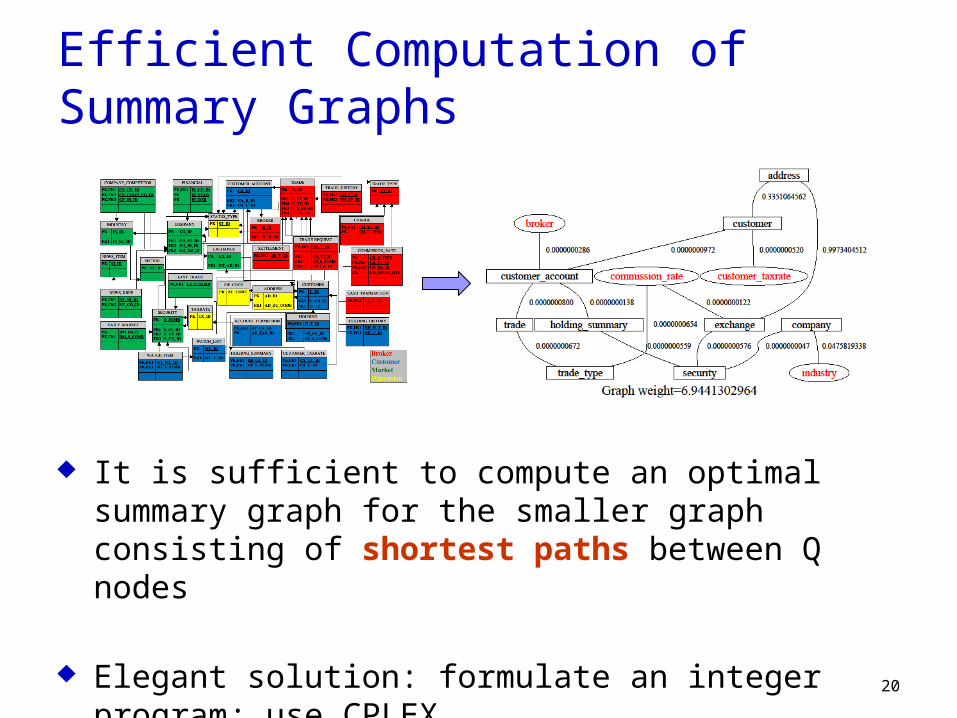
Efficient Computation of Summary Graphs
¨ It is sufficient to compute an optimal summary graph for the smaller graph consisting of shortest paths between Q nodes
¨ Elegant solution: formulate an integer program; use CPLEX
20
Outline
¨ Motivation
¨ Problem statement
¨ Our solution– Defining schema edge weights– Computing summary graphs
¨ Experimental results
21
Experimental Setup
¨ Data: use 2 instances of TPC-E benchmark database schema– Simulates an OLTP workload of a brokerage firm– Well-specified schema, including PK/FK constraints
¨ Quality: use measures based on the TPC-E transaction logs– Table coverage: relative frequency of summary graph tables in log– Join coverage: relative frequency of summary graph joins in log– Summary graph density: reflects complexity of summary graph
22
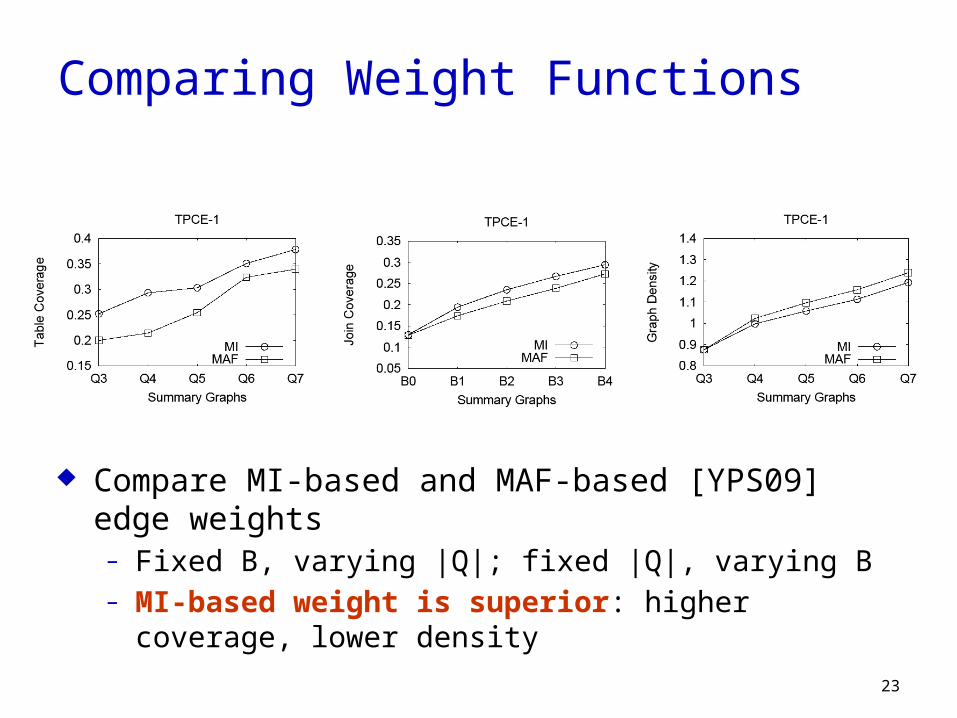
Comparing Weight Functions
¨ Compare MI-based and MAF-based [YPS09] edge weights– Fixed B, varying |Q|; fixed |Q|, varying B– MI-based weight is superior: higher coverage, lower density
23
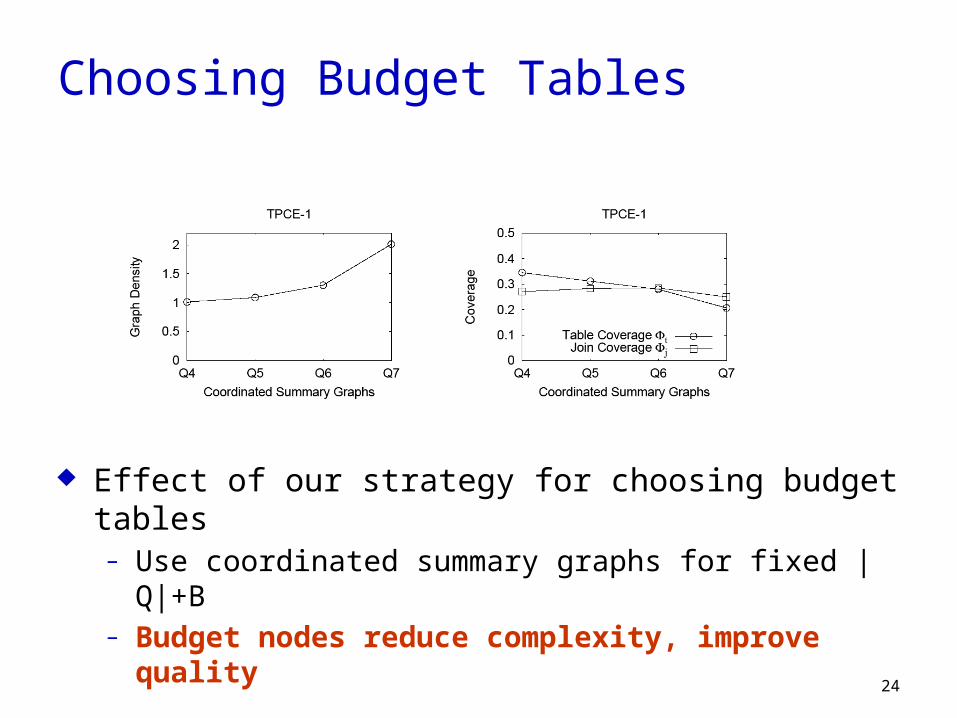
Choosing Budget Tables
¨ Effect of our strategy for choosing budget tables– Use coordinated summary graphs for fixed |Q|+B– Budget nodes reduce complexity, improve quality
24

Summary
¨ Complex database schemas in large enterprise systems– 1000+ tables, 10000+ columns, 100000+ PK/FK edges
¨ Novel schema graph summary is informative and succinct– Define schema graph edge weights using mutual information– Compute succinct summary graph that preserves query table
shortest paths and minimizes graph weight, for a given budget– Experimental study validates weight definition, summary model
¨ Future work: approximations for schema graph summaries
25