Embed Size (px)
Citation preview

EPPECT OF 1, 3-BIS(2-CHLOROETHYL)--1-NITROSOUREA (NSO-@962) AN@TWO REL&TED COMPOUNDS ON A SPECTRUM OP RB12
Kanematsu Sugiura3
SUMMARY
1, 3-Bis (2—chioroethyl) - 1—nitrosourea (BCNU), 1-@methyl- 1—nitrosourea (NSC -2 39 09), and hydroxy-.urea (NSC-32065) were tested for antitumcr activity against 31 transplantable animal tumors. BCNU, themost effective, produced complete inhthltlon of tumor growth In 16 tumors. Its antitumor action was generally the greatest at the maximum tolerated dose (MTD). Four rat tumors were completely inhibited byone-half the MTD and 2 of these tumors by one-fourth the MTD.
INTRODUCTION
It has been reported (2, 3, 5-7, 16) that BCNU has strong antileukemic activity in experimentalanimals, and Reltemeler et ad. (4) obtained good regression of advanced gastrointestinal carcinoma Inpatients. This led us to investigate further Its antitumor activity in a spectrum of animal tumors and tocompare it with 2 closely related compounds, 1-methyl- 1-nltrosourea and hydroxyurea (Table 1).
MATERIALSAND METHODS
Saline solutions of the compounds were prepared fresh daily, and the usual volume for InjectIonswas 0. 5 ml. The agents were given at or near the MTD, I. e. , the dose at which at least 60% of the anlmals survived when started 24 hr after tumor Inoculation and given intraperitoneally (I. p. ) once daily for7 days. A twofold increase In this dose killed at least 60%. If a compound caused marked Inhibition ordestruction of the tumor by this procedure, it was tested against well-established, 7-day-old tumors.
The compounds were tested against 13 solid tumors, 4 ascltes tumxs, and 1 viral leukemia Inthe mouse and against 13 solid rat tumors.
The history, biologic properties, and cytologic descriptions of most of these tumors have beenpresented (12-14), as well as the methods used in the chemotherapy studies. The transplantable ratfthrosarcomas (Nos. 1, 4, 6, 7, and 10) were induced by xanthlne 7-N-oxide (1). Transplants of thesefibrosarcomas “take―In 80-l00@ of Wistar rats, and 14 days after transplantation the tumors measureapproximately 4 . 2 x 2 . 1 x 1 . 6 cm . They are solid and show little necrosis.
For solid tumors (12), small pieces of tumor, each weighing approximately 8 mg and measuring2. 5 cu mm, were Implanted subcutaneously (s. c. ) into healthy young animals (mice, 18-22 gm, and rats,80- 100 gm). A single implant was made by trocar Into the right axillary region.
For ascites tumors (8), each mouse received 0. 1 ml of fluid containing 1-2 million cancer cells,I. p. In the inguinal region.
For the Friend mouse virus leukemia (9), 0. 2 ml of a 10% saline homogenate of leukemic spleenswas injected i. p. in the Ingulnal region.
The criteria for evaluating tumor inhibition are given in Table 2; the tumors and their abbreviationsare listed in Table 3,
Tumor-bearing animals were divided into 1 group of 10 animals for controls and 1 group of 5 animalsfor treatment. The data are averages of the results of multiple experiments.
Animals were maintained on a standard diet (Purina Laboratory Chow) and water@ libitum.
1 Presented in part at theAnnual Meeting of the A merican Association for Cancer Research, Philadelphia,April 7, 1965 (11).
@ Supported in part by grant CA-08748 from the National Cancer Institute, USPHS.@ Division of Experimental Chemotherapy, Sloan-Kettering Institute for Cancer Research, New York, New
York.
MARCH 1967 (Part 2) 179
on July 13, 2018. © 1967 American Association for Cancer Research. cancerres.aacrjournals.org Downloaded from

Kanematsu Sugiura.
RESULTS
The results with BCNU (Table 4) show that i. p. injections of 8. 0 mg/kg/day had a completelyinhthitory effect on WOS, MLS, G26, Sl8Oa, EA, KCa, and TLTa in mice and FRC, JRS, YRS, Fl, F6,F7, FlO, FOT, and AT in rats. This compound had a marked inhibitoryeffect on Sl80, Cl025, BC,TLT, FVL, and W256. The effectiveness of the compound seemed proportional to the dose. However,complete destruction of JRS, YRS, F6, and F7 was obtained with one-half the MTD and the animals appeared normal. Histologic examination of the visceral organs and bone maxrow showed no abnormalities.There was no delayed toxicity.
The controls uniformly had 100% “takes―and low average tumor regression rates essentially similar to those reported elsewhere (10), except that In 2 rat tumors, FRC and YRS, there were 8 and 15%spontaneous tumor regressions, respectively.
The study of BCNU showed complete regression of well-established 7-day-old S 180a, MLS, JRS,YRS, and F 1 (Table 5) . Seven-day-old FVL and FRC were markedly inhthited, and C 1025, G26, and TLTwere moderately inhibited. No spontaneous regressions occurred.
Because BCNU had a distinct inhibitory effect on 7-day-old tumors, it was tested by oral administration (Table 6). S l8Oa and F 1 completely regressed following a dose of 15 and 10 mg/kg/dayrespectively for 7 days.
Fl was implanted In the anterior chamber of the eye of rats. About 100 mg of fresh tumor tissuewas minced with a scalpel and forceps and 10 ml of sterile saline was added; the cells were stained withmethylene blue and counted. An emulsion of 0. 02-0. 05 ml containing 0. 5- 1 million cancer cells was injected by an 0. 25-ml syringe fitted with a 27-gauge needle. Three days after transplantation, I. p. administration of BCNU (8. 0 mg/kg/day) was begun and continued for 7 days. The fibrosarcomas werecompletely destroyed In 8 of 10 rats. There was no evidence of lung metastases. Eight control animalsdied from ulcerated tumors and lung metastases, whereas the tumors In the other 2 animals regressedspontaneously a nd completely, without metastasizing.
Table 7 shows that the antitumor activity of 1-methyl- 1-nitrosourea was much less than that ofBCNU. 1-Methyl-1-nltrosourea at a dose of 20 mg/kg/day produced marked to complete inhthition ofS l8Oa, E1k, KCa, E077 1, C 1025, TLTa, FRC, F6, and FOT, or 9 of 29 tumors. At this dose animals lostconsiderable weight; a higher dose was toxic.
The results with hydroxyurea tested at or near the MTD (Table 8) show that 500 mg/kg/day had amoderate inhthitory effect on S 180a, EC, BC, WOS, MM, and TLTa, but failed to produce a complete ormarked inhibitory effect on any of the 18 tumors tested. Recently Tarnowski@ @j. (1 5) of our Institutetested hydroxyurea against sarcoma T24 1, TLT, EA, ROS, Cl025, MLS, E077 1, melanoma B16, and W256,and found that the first 4 were substantially retarded at the end of therapy.
DISCUSSION
The difference in the effectiveness of BCNU, depending on the tumor system, reemphasizes theusefulness of studies on a variety of tumors. 5180 was markedly inhthited by this compound but 537 wasnot affected. Both mammary tumors, C63 and E077 1, were only slightly inhibited. WOS, generally resistant to chemotherapeutic agents, was completely destroyed but ROS, relatively sensitive to compounds,was completely resistant. Growth of MLS was completely inhibited but MRLS was not affected. Injections of BCNU i. p. completely inhibited the growth of all 4 ascites tumors, 5180a, EA, KCa, and TLTa;but s. c. injections resulted In only slight or moderate Inhibition of growth (unpublished data).
BCNU was tested against 5 grossly and histologically Identical fibrosarcomas induced in rats byxanthlne 7-N-oxide to find out whether these 5 tumors respond to the agent in the same manner. The results showed that the compound had a complete inhthitory effect on Fl, 6, 7, and 10 but only a moderateinhibitory effect on F4.
180 CANCER RESEARCH VOL. 27
on July 13, 2018. © 1967 American Association for Cancer Research. cancerres.aacrjournals.org Downloaded from

Effect of 1 ,3-Bis(2-chtoroethyl)-1-nitrosourea (NSC-409962) and Two Related Compounds on Tumors
REPERENCES
1. Brown, G. B. , Sugiura, K. , and Cresswell, R. M. Purine N-Oxides. XVI. Oncogenic Derivativesof Xanthine and Guanine. Cancer Res. , @:986-9 1, 1965.
2. Goldln, A. , Venditti, J. M. , Mead, J. A. R. , and Glynn, J. P. Antileukemlc Activity of Hydroxyurea (NSC-32065) and Other Urea Derivatives. Cancer Chemother. Rept. , @:57-74, 1964.
3. Johnston, T. P. , McCaleb, G. S. , and Montgomery, J. A. The Synthesis of Antineoplastic Agents.)oom. N-Nitrosoureas. I. J. Med. Chem., .@.:669-81, 1963.
4. Reitemeier, R. J. , Moertel, C. G. , and Hahn, R. G. 1, 3-Bis(2 -chloroethyl)-l-nitrosourea (BCNU)Therapy In Advanced Gasirointestinal Adenocarcinoma. Proc. Am. Assoc. Cancer Res. , Z: 59, 1966.
5. Schabel, F. M. , Jr. , Johnston, T. P. , McCaleb, G. S. , Montgomery, J. A. , Laster, W. R. , andSkipper, H. E. Experimental Evaluation of Potential Anticancer Agents. VIII. Effects of CertainNitrosoureas on IntracerebralL12l0 Leukemia. Cancer Res., j@: 725-33, 1963.
6. Skinner, W. A. , Gram, H. F. , Greene, M. 0. , Greenberg, J. , and Baker, B. R. PotentialAnticancer Agents. )OOCI. The Relationship of Chemical Structure to Antileukaemic Activity with Analogues of l-Methyl-3-n.ttro- l-nitrosoguanldine (NSC-9369). J. Med. Pharm. Chem. , @:299-333,1960.
7. SkIpper, H. E. , Schabel, F . M . , Jr. , and Wilcox, W. S. Experimental Evaluation of PotentialAnticancer Agents. XIII. On the Criteria and Kinetics Associated with “Curability― of ExperimentalLeukemia. Cancer Chemother. Rept. , @:1-1 11, 1964.
8. Sugiura, K. Merits of Ascites Tumors for Chemotherapeutic Screening. Ann. N. Y. Acad. Sd.,j@: 962—73, 1956.
9. Suglura, K. Effects of Compounds on the Friend Mouse Virus Leukemia. Gann, @:251-64, 1959.
10. . Experimental Chemotherapy of Cancer--A Report of Progress. jj@: Progress of Expertmental Tumor Research, Vol. 2, pp. 332-76. New York: Karger, 1961.
11. . Effect of 1, 3-Bis (2 -chloroethyl) - 1-nitrosourea on a Spectrum of Tumors . Proc. Am.Assoc. Cancer Res. , &: 62, 1965.
12. Sugiura, K. , and Stock, C. C. Studies in a Tumor Spectrum. I. Comparison of an Action of Methylbis (2 -chloroethyl)amine and 3 -Bis (2 -chloroethyl) amino-methyl-4-methoxymethyl-5-hydroxy-6-methylpyridine on the Growth of a Variety of Mouse and Rat Tumors. Cancer, @:382-402, 1952.
13. . Studies in a Tumor Spectrum. II. The Effect of 2, 4, 6-Trlethylenimino-a-triazine onthe Growth of a Variety of Mouse and Rat Tumors. Cancer, @:979-9 1, 1952.
14. . Studies in a Tumor Spectrum. III. The Effect of Phosphoramides on the Growth of aVariety of Mouse and Rat Tumors. Cancer Res. , j@: 38-51, 1955.
15. Tarnowski, G. S. , Kreis, W. , Schmid, F. A. , Cappuccino, J. G. , and Burchenal, J. H. Effect ofHydroxylamine (NSC-26250) and Related Compounds on Growth of Transplanted Animal Tumors.CancerRes. (Suppl.), j@(No. 11, part2): 1279—1301,1966.
16. Vendltti, J. M. , Kline, I. , and Goldin, A. Evaluation of Antileukemic Agents Employing AdvancedLeukemia Ll2lO in Mice. Vu. Cancer Res. (Suppl. ), @.j(No. 6, part 2): 827-79, 1964.
MARCH 1967 (Part 9) • 181
on July 13, 2018. © 1967 American Association for Cancer Research. cancerres.aacrjournals.org Downloaded from

ENTRY[ICOMPOUNDNAME*MOLECUlARSTRUCTURESOLVENT79637
79638
79 63 923909t
32065*
4 099 62tUrea,
l—methyl—1—nitroso
Urea, hydroxy
Urea, 1, 3 -bis (2-chloroethyl)-l-nitroso
N3O2C2H6
N202CH4
N3 O@Cl3 C@H90
CH3
@ IH3N—C——N—NO
0
IH2 N—C —NHOH
I CH3CH2C1HN—C —N —NO
ICH3CH2C1Saline
Saline
Saline*
Compounds were supplied by the Cancer Chemotherapy National Service Center, National Cancer In
stitute.t Original supplier was Southern Research Institute.$ Original supplier was The Squibb Institute for Medical Research.
TABLE 2
Criteria for Evaluating TumorInhibltlon*SYMBOL
-
±
+
-H-
+++DEGREE
OF TUMOR INHIBITION
None
Slight
Moderate
Marked
CompleteTUMOR
INDEXt
0.76-1.0
0.51—0.75
0. 26-0. 50
0. 08-0. 25
0-0.07
Kanematsu Sugiura
* Solid tumors were measured with calipers, in 2 dIameters, weekly for 4 weeks. Results in the fol
lowing tables are based on observations made 2 weeks after tumor implant except for Iglesias ovarianand adrenal tumors, which were measured at the times indicated In the tables.
Volume of ascites fluid was measured 10-li days after injection of ascites. The animals were killedwith ether and weighed, the fluid was removed by cutting the abdominal skin, the adhering fluid waswiped off with a paper towel, and the animals were reweighed. The weight difference was the fluidvolume. Grading of ascites tumors was calculated similarly to that of solid tumors but was based onthe relative weight (in grams) of the ascitic fluid in the treated animals compared with the weight ofthe fluid In the control group.
The spleens of mice with Friend virus leukemia were weighed at the end of the 3rd week.
t The tumor index was determined by dividing the average measurement in the treated animals by theaverage measurement in the control group.
182 CANCER RESEARCH VOL. 27
TABLE 1
Compounds Tested Against a Spectrum of Tumors
on July 13, 2018. © 1967 American Association for Cancer Research. cancerres.aacrjournals.org Downloaded from
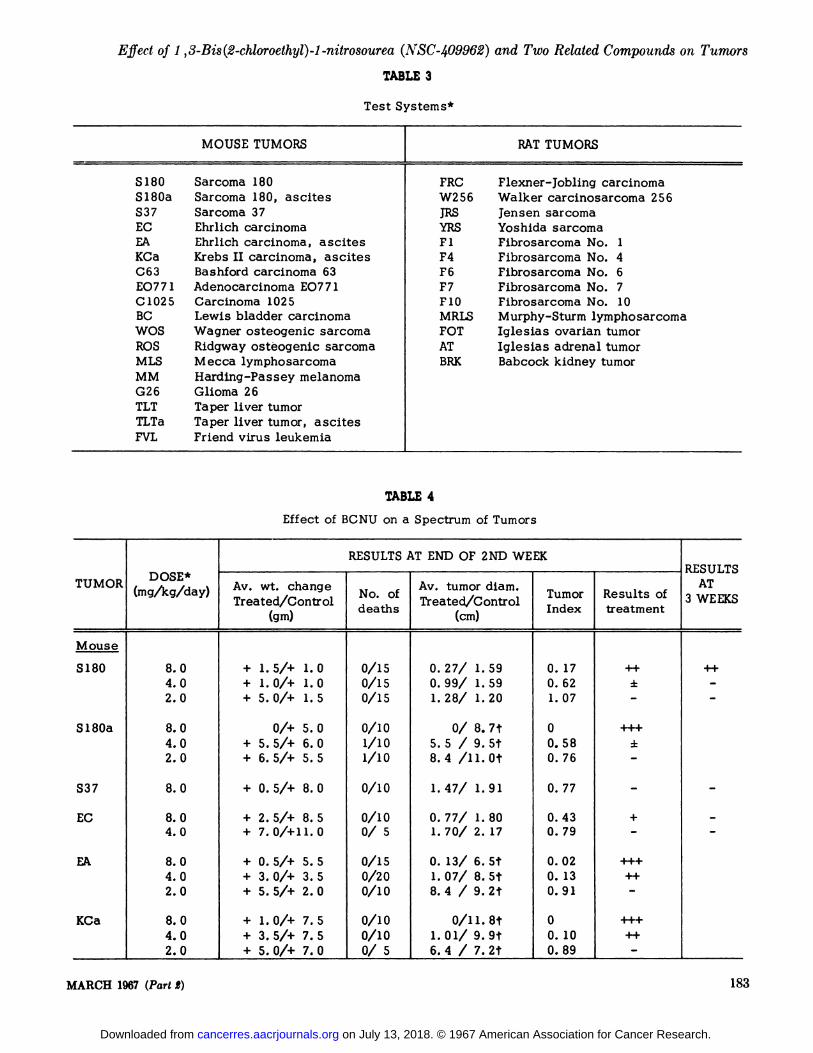
MOUSE TUMORSRATTUMORSS
180 Sarcoma 180Sl8Oa Sarcoma 180, ascltes537 Sarcoma 37EC Ehrlich carcinomaEA Ehrlich carcinoma, ascitesKCa Krebs II carcinoma, ascitesC63 Bashford carcinoma 63EO77 1 Adenocarcinoma EO771Cl025 Carcinoma 1025BC Lewis bladder carcinomaWOS Wagner osteogenic sarcomaROS Ridgway ostéogenlc sarcomaMLS Mecca lymphosarcomaMM Harding-Passey melanomaG26 Glioma 26TLT Taper liver tumorTLTa Taper liver tumor, ascitesFVL Friend virus leukemiaFRC
Flexner-Jobling carcinomaW256 Walker carcinosarcoma 256JRS Jensen sarcomaYRS Yoshida sarcomaF 1 Fibrosarcoma No. 1F4 Fibrosarcoma No. 4F6 Fibrosarcoma No. 6F7 Fibrosarcoma No. 7FlO Fibrosarcoma No. 10MRLS Murphy-Sturm lymphosarcomaFOT Igleslas ovarian tumorAT Iglesias adrenal tumorBRK Babcock kidneytumorTA3LE
4
Effect of BCNU on a Spectrum ofTumorsTUMOR*
, D@S@@
@mg@icg@dayjRESULTS
AT END OF 2ND WEEK..__________RESULTSAv.
wt. changeTreated@Control
(gm)No.
ofdeathsAv.
tumor diam.,Treatea,'Control
(cm)TumorIndexResults
oftreatmentATMouse
5180
Sl8Oa
537
EC
EA
KCa8.0
4.02.0
8.04.02.0
8.0
8.04.0
8. 04. 02.0
8.04.02. 0+
1.5/+ 1,0
4 i.o/+ 1.0
4 s.o/+ 1.5
0/4 5.0+ 5.5/4 6.04 6.5/4 5.5
4 0.5/4 8.0
+ 2.5/+ 8.54 7.0/411.0
4 0. 5/+ 5. 5
4 3. o/+ 3. 5
+ 5.5/+ 2.0
4 1.0/4 7.5
+ 3. 5/4 7. S
4 5. o/+ 7. 00/15
0/150/15
0/101/101/10
0/10
0/100/ 5
0/is0/200/10
0/100/100/ 50.27/
1.590.99/ 1.591.28/ 1.20
0/ 8.715.5 / 9_st8.4 /ll.ot
1.47/ 1.91
0.77/ 1.801.70/ 2.17
0. 13/ 6. 5t1. 07/ 8. St8.4 / 9.2t
0/ll.8t1.01/ 9.9t6. 4 / 7. 2t0.17
0.621.07
00.580.76
0.77
0.430.79
0. 020. 130.91
00.100. 89++
±—
4+4
±—
—
4—
+4+
4+—
+4+
+4—4+
—
—
—
—
—
Effect of 1 ,3-Bis(@-chloroethyl)-1-nitrosourea (NSC-40996f2) and Two Related Compounds on Tumors
TABLE 3
Test Systems*
MARCH 1967 (Part @) 183
on July 13, 2018. © 1967 American Association for Cancer Research. cancerres.aacrjournals.org Downloaded from

RESULTS AT END OF 2NDWEEKTUMORDOSE*
(mg/kg/day)RESULTSAv.wt. change
Treated/Control(gm)No.
ofdeathsAv.
tumor diam.Treated/Control
(cm)TumorIndexResults
oftreatmentAT
Kanematsu Sugiura
Mouse
C63 8.0 + 5.0/-i-u.s 0/10 0.91/ 1.51 0.60 ±4.0 + 4.5/+ 7.0 0/ 5 1.38/ 1.59 0.87 —
E0771 8.0 o/+ 6.5 1/16 1.31/ 2.03 0.65 ±4. 0 + 1. o/+ 5. 5 0/ 5 i. 63/ 2. 06 0. 79 —
Cl025 8.0 o/+ 8.0 0/10 0.43/ 1.89 0.23 +4 ±4.0 + 2.0/+ 5.5 0/10 1.09/ 1.63 0.67 ± —2. 0 + 2. o/+ 3. 0 0/10 1. 12/ 1. 90 0. 59 ± —
BC 8.0 —2.5/+ 2.0 0/10 0.22/ i.16 0.19 +4 +4.0 —0.5/i-2.0 0/10 0.86/ 1.35 0.64 ± —2.0 + l.0/+ 2.5 0/ 5 1.21/ 1.35 0.90 — —
WOS 8.0 —1.5/i-4.0 0/20 0/ 3.06 0 -i-++ +4+4. 0 + 1. 0/-i- 3. 0 0/25 0. 79/ 2. 12 0. 37 + ±2. 0 + 5. 0/-i- 5. 0 0/10 2. 39/ 2. 17 1. 09 — —
ROS 8.0 —1.5/+ 5.0 1/10 0.83/ 1.01 0.824. 0 —1. o/+ 2. 0 0/ 5 1. 07/ 1. 14 0. 94
MLS 8. 0 —1. 0/i- 3. 5 0/10 0. 13/ 1. 95 0. 07 +++4. 0 —1. 5/+ 3. 0 0/15 0. 60/ 2. 30 0. 26 +4 +2.0 + 2.5/+ 3.5 1/10 1.83/ 2.23 0.82 — —
MM 8.0 + 2.0/+ 5.5 0/10 0.77/ 0.82 0.94
G26 8. 0 —3. 5/i- 1. 5 o/io 0. 03/ 0. 83 0. 04 -i-++ +4+4.0 + 0.5/+ 2.5 0/10 0.56/ 1.24 0.45 + ±2.0 + o.s/+ 1.5 0/ 5 1.05/ 1.21 0.87 — —
TLT 8.0 + 0.s/i-4.5 0/10 0.27/ 1.55 0.17 +4 +4.0 + 7.5/+ 7.5 0/10 1.04/ 2.31 0.45 + ±2.0 +lO.0/+ 7.5 0/ 5 2.04/ 2.31 0.88 — —
TLTa 8.0 + 0.5/-f2.5 1/10 0/ 8.Ot 0 +444.0 + 2.5/+ 5.0 0/15 1.92/ 8.3t 0.23 +42. 0 + 3. o/+ 4. 5 0/10 7. 7 / 8. Ot 0. 96 —
FVL 8.0 —1.0/-i-8.5 3/10 0.50/ 2.48* 0.20 144. 0 + 1. 5/+lO. 0 1/10 0. 66/ 2. 26$ 0. 29 +2.0 +ll.0/—l3,5 0/10 1.00/ 2.00* 0.50 +
Rat
FRC 8.0 +11.0/1-49.0 0/10 0/ 2.37 0 14+ 44+4.0 +l7.0/+62.0 0/10 1.02/ 2.39 0.43 + ±2.0 +29.0/i-44.0 0/ 5 1.21/ 1.74 0.70 ± —1. 0 +32. 0/4-42. 0 0/ 5 1. 27/ 2. 26 0. 56 ± —
184 CANCER RESEARCH VOL. 27
TABLE 4
(Continued)
on July 13, 2018. © 1967 American Association for Cancer Research. cancerres.aacrjournals.org Downloaded from

TUMORDOSE*(mg/kg/day)RESULTS
AT END OF 2ND WEEKRESULTS
AT3WEEKSAv,
wt. changeTreated/Control
(gm)No.
ofdeathsAv.
. tumor diam.Treated/Control
(cm)TumorIndexResults
oftreatment
Effect of 1 ,3-Bis(P2-chloroethyl)-1-nitrosourea (NSC-409962) and Two Related Compounds on Tumors
TABLE 4
(Concluded)
Rat
W256 8.0 —11.o/+36.0 0/10 0.60/ 3.24 0.19 44 444.0 + 7.0/+47.0 0/10 0.61/ 2.96 0.21 44 ±2. 0 +22. 0,1+55. 0 0/10 0. 56/ 3. 37 0. 17 14 ±1.0 +32.0/+54.0 0/10 1.41/ 3.28 0.43 + —
JRS 8.0 + 5.0/+39.0 0/10 0/ 3.13 0 +++4.0 +ll.0/+43,0 0/10 0/ 3.63 0 +4+2.0 +34.0/+52.0 o/io 0.26/ 3.31 0.08 44 +1.0 +5l.0/+56.0 0/5 4.02/4.42 0.91 — —
YRS 8.0 +13.0/4-54.0 0/10 0/ 2.49 0 +4+ +4+4.0 +l6.0/+5l,0 0/10 0.02/ 2.38 0.01 +4+ +4+2.0 +34,0/4-46,0 o/io 0/ 2.79 0 44+ +4+1.0 +48.o/+53.0 0/10 0.86/ 2.95 0.29 +4 +
8.0 o/+47.o 0/is 0/ 2.20 0 44+ +4+4.0 +l5.0/+48,0 0/10 0.43/ 1.84 0.23 44 +2.0 +26.o/+44.0 0/ 5 1.14/ 1.77 0.64 ± —1.0 +36.0/+4'4.0 0/ s 1.37/ 1.77 0.77 — —
F4 8.0 —12.0/+44.0 0/ 5 0.40/ 1.22 0.33 + ±4.0 + 6.0/+38.0 0/ 5 0.40/ 0.61 0.66 ± —2.0 +2l.0/+38.0 0/ 5 0.57/ 0.61 0.93 — —
P6 8.0 —6.0/+46.0 0/is 0.03/ 1.47 0.02 +4+4.0 + 8.0/+31 0/10 0/ 1.20 0 +++ 44+
F7 8.0 —7.0/+48.0 0/10 0/ 1.95 0 +++4.0 +14.0/+54.0 0/10 0/ 1.77 0 +++ 44+2.0 +20.0/+37.0 0/ 5 0/ 1.59 0 +1—i- 44+1.0 +25.0/+68.0 0/ 5 2.49/ 2.24 1.11 — —
FlO 8.0 —5.0/+5l.0 0/10 0/ 2.31 0 44+ +4*
MRLS 8. 0 —3. o/+38. 0 2/10 3. 43/ 3. 99 0. 864. 0 +12. 0/+30. 0 1/ 5 3. 55/ 4. 44 0. 80
FOT 8. 0 —11. 0/+35. 0 0/ 5 0/ 1. 82 § 0 +4+
AT 8.0 —12.0/+106.0 0/ 5 0/ 1.5911 0 +4+
BRK 8.0 —l0.0/+43.0 0/is 0.68/ 2.05 0.33 + ±4.0 + 5.0/+40.0. o/ s 1.35/ 2.03 0.66 ± —
* Treatment (1. p. ) was started 24 hr after tumor inoculation and continued for 7 days.
t Volume in ml at 10-il days.4:Spleen weight in gm at 3rd week.§4th week results.II8th week results.
185MARC!! 1967 (Part 2)
on July 13, 2018. © 1967 American Association for Cancer Research. cancerres.aacrjournals.org Downloaded from

TUMORDOSE*(mg/kg/day)RESULTS
AT END OF 2 ND WEEKRESULTS
AT@ WEEKSAv.
wt. changeTreated/Control
(gm)No.
ofdeathsAv.
tumor diam.Treated/Control
(cm)TumorIndexResults
oftreatment
Kanematsu Sugiura
TABLE 5
Effect of BCNU on 7-Day-Old Tumors
Mouse
5180 8.0 —5.0/—4.0 5/10 1.77/ 2.15 0.82
S180a 8.0 + 2.0/+ 8.0 4/10 o/ll.3t 0 44+
E1k 8.0 + 5.5/4-8.0 4/30 8.1 / 8.4t 0.96
KCa 8.0 + 6.0/+ 7.0 0/20 7.9 /ll.8t 0.67 ±
C1025 8.0 o/+ 4.5 1/20 0.81/ 2.00 0.41 + ±
BC 8.0 + l.0/+ 2.5 0/10 1.80/ 1.92 0.94
WOS 8.0 —1.o/+ 4.5 0/20 1.54/ 2.93 0.53 ± —4.0 + 2.5/+ 4.0 o/io 2.53/ 3.01 0.84 — —
MLS 8.0 + 1.o/+ 2.0 0/30 0.07/ 2.11 0.03 +++
G26 8. 0 —1. 5/+ 7. 0 1/20 0. 63/ 2. 28 0. 27 + +
TLT 8.0 + 4.5/+ 6.0 0/10 1.42/ 3.32 0.43 +
TLTa 8.0 4 3.5/+ 6.0 0/20 8.2 / 8.40t 0.98
FVL 8.0 + i.o/+ 9.5 1/15 0.48/ 1.99* 0.24 44
Rat
FRC 8. 0 + 6. o/+62. 0 1/20 0. 22/ 2. 78 0. 08 +4 +44. 0 +28. 0/+66. 0 0/10 @.76/ 3. 60 0. 49 + —
W256 8.0 +ls.0/+82.0 0/20 2.38/ 4.43 0.54 ±
JRS 8. 0 +15. o/+35. 0 o/io 0. 15/ 3. 27 0. 05 44+ 14+4.0 —8.o/+35.0 0/ 5 0/ 3.27 0 14+ +142. 0 +14. o/+72. 0 1/20 0. 52/ 3. 91 0. 13 +4- 14
YRS 8.0 +28.0/+58.0 0/20 0.07/ 3.37 0.02 +++ +14
Fl 8.0 + s.o/+52.o 0/20 0.02/ 2.75 0.01 14+ 14+4.0 +32.0/+73.0 0/10 i.60/ 2.50 0.64 ± —
MRLS 8.0 +29.0/+33.0 0/10 3.52/ 3.18 1.11
* Treatment (I. p. ) was started 7 days after tumor inoculation and continued for 7 days.
t Volume in ml at 10-il days.4: Spleen weight in gm at 3rd week.
186 CANCER RESEARCH VOL. 27
on July 13, 2018. © 1967 American Association for Cancer Research. cancerres.aacrjournals.org Downloaded from

TUMORDOSE*(mg/kg/day)RESULTS
AT END OF 2ND WEEKRESULTS
AT3WEEKSAv.
wt. changeTreated/Control
(gm)No.
ofdeathsAv.
tumor diam.Treated/Control
(cm)TumorIndexResults
oftreatmentMouse
5180
Sl8Oa
WOS
@iYRS
Fl15
15
is10
10
10+
0.5/— 2.5
0/+ 7.0
—5. o/+ 4. 0
—3. o/+ 4. 0
—2l.0/+38.0
—25.0/+35.00/10
0/10
2/10o/io
0/b
o/io1.22/
2.20
0.80/lO.7t
0. 69/ 2. 920. 84/ 2. 92
0.71/ 2.34
0/ 1.470.55
0.07
0. 240. 29
0.30
0±
14+
4*
+
+
44+—
+
±
±
44+*
Treatment was started 7 days after tumor inoculation and continued for 7 days.
t Volume in ml at 10-li days.
TABLE 7
Effect of l-Methyl-l-nitrosourea on a Spectrum ofTumorsTUMORDOSE*
(mg/kg/day)RESULTS
AT END OF 2ND WEEKRESULTS
AT3WEEKSAv.
wt. changeTreated/Control
(gm)No.
ofdeathsAv.
tumor diam.Theated/Control
(cm)TumorIndexResults
oftreatmentMouse
5180
Sl8Oa
537
EC
EA
KCa
C63
EO771
Ci02520
20
20
20
20
20
20
20
20—
1.0/— 2.5
— l.0/+ 6.5
— 3.0/+ 8.0
— 1. 0/+ 7. 0
— 0.5/+ s.s
— 1. s/i- 7. 0
— 1.0/-F 4.5
—4. o/+ 3. 5
— 2.5/+ 3.00/is
0/10
1/ 5
0/10
0/10
0/ 5
2/15
1/10
0/100.92/
1.55
0.04/ 9.6t
1.58/ 1.91
i. 03/ 2. 14
0.04/li.Ot
0/10.8t
0.88/ 1.75
0. 24/ 1. 49
0.36/ 1.640.59
0.04
0.83
0. 48
0.04
0
0.50
0. 16
0.22±
+++
—
+
+++
+++
+
1*
44—
—
-
—
+
±
Effect of 1 ,3-Bis(2-chloroethyl)-1-nitrosourea (NSC-4O996@) and Two Related Compounds on Tumors
TABLE 6
Effect of Oral Administration of BCNU on 7-Day-Old Tumors
MARCH 1967 (Part 2) 187
on July 13, 2018. © 1967 American Association for Cancer Research. cancerres.aacrjournals.org Downloaded from

TUMORDOSE*(mg/kg/day)RESULTS
AT END OF 2ND WEEK1@ESULTS
AT3W@EKSAv.
wt. changeTreated/Control
(gm)No.
ofdeathsAv.
tumor diam.Treated/Control
(cm)TumorIndexResults
oftreatment
Kanematsu SugiuraTABLE 7
(Concluded)
0.66/ 1.22
0. 77/ 2. 591. 51/ 2. 70
i.oi/ 1.311.50/ 1.41
0. 71/ 2. 02
0. 96/ 0. 81
1.02/ 1.21
0.56/ 1.54
0.21/ 9.50t0. 08/il. 3
1. 32/ 3. 46$
±
1-
±
+
+
+4+
+44
1-
14+
±
+
±
+4
±
±
+1-
1-
±
Mouse
BC
WOS
ROS
MLS
MM
G26
TLT
TLTa
FVL
Rat
FRC
W2 56
JRS
YRS
F4
F6
F7
MRLS
FOT
AT
BRK
20
2010
2010
20
20
20
20
2010
20
20
20
20
20
20
20
20
20
20
20
20
— 2.0/+ 0.5
— 3.5/1- 3.0
+ i.o/+ 4.0
— 2.0/+ 3.0
+ 3.0/1- 3.5
- 3.0/+ 4.5
— 3. o/+ 2. 5
— 2.0/+ l.s
— 2.5/+ 4.5
— 3. 5/+ 5. 5
+ i.o/+ 5.5
— 3.0/1-10.0
— 2.0/+38.0
1- 6.0/+41.0
+21.o/+57.0
1- 9.0/1-35.0
+17.o/+64.0
+14. 0/÷42. 0
1- 6. 0/+49. 0
— 2.0/+38.0
—37.0/— 8.0
—26.0/+4l.0
+20.0/+36.0
i/i 0
0/i 00/ 5
i/i 00/ 5
0/10
0/10
0/ 5
1/10
i/is0/ 5
2/10
0/i 0
i/is
0/10
0/is
0/ 5
0/i0
0/i 0
2/10
i/ 5
0/ 5
0/ 5
0. 04/
2. 15/
3. 50/
1. 19/
0. 91/
0. 19/
1. 22/
2. 35/
0. 25/
1. 12/
0. 92/
1. 88
3. 81
3. 19
3. 52
1. 22
1. 79
2. 08
3. 34
2. 63@
2. 2311
1. 62
0. 54
0. 300. 56
0. 771. 06
0. 35
1. 19
0. 84
0. 36
0. 020. 01
0. 38
0. 02
0. 56
1. 26
0. 34
0. 74
0. 11
0. 59
0. 70
0. 10
0.•50
0. 57
±
±
±
±
14+
:1:
+
* Treatment (i. p. ) was started 24 hr after tumor Inoculation and continued for 7 days.
t Volume in ml at 10-il days.4: Spleen weight In gm at 3rd week.§4th week results.II8th week results.
188 CANCER RESEARCH VOL. 27
on July 13, 2018. © 1967 American Association for Cancer Research. cancerres.aacrjournals.org Downloaded from

TUMORDOSE*mg/kg/day)RESULTS
AT END OF 2ND WEEKRESULTS
AT3WEEKSAv.
wt. changeTreated/Control
(gm)No.
ofdeathsAv.
tumor diam.Treated/Control
(cm)TumorIndexResults
oftreatment
Effect of 1 ,3-Bis(f2-chloroethyl)-1 -nitrosourea (NSC-409962) and Two Related Compounds on Tumors
TABLE 8
Effect of Hydroxyurea on a Spectrum of Tumors
100
500250100
500
500100
250
500100
500100
500
500100
500100
500250
500100
100
200
200
200
200
200
—3. 0/— 3. 5
+ o.s/+ 8.5
+ i.s/+ 7.0
1- 4.0/1- 5.0
1- 2.0/1- 8.0
1- 4.5/+lO.5
o/+ 4. 5
+ 4.0/+10.5
+ 3.0/1- 9.0
+ 3.0/+ 5.0
— o.s/+ i.s
0/1- 3.0
—2.0/1- 6.0
1- 6. 5/1- 6.0
1- 2.5/1- 4.0
0/-i- 2.0
1- l.s/+ i_s
1- 0.5/+ 3.5
1- 2.0/+ 3.5
1- 5.5/+ 8.0
1- 6.5/+ 8.5
+28.o/+so.0
+31.0/@41.0
+42.0/+51.0
+45.0/1-48.0
+12. 0/1-43. 0
+32.0/+47.0
0/ 5
1/ 51/ 51/ 5
0/ 5
0/i00/i0
0/ 5
0/ 50/ 5
2/1s0/ 5
1/1s
0/i 01/ s
0/ 50/ s
0/i 00/i 0
0/ 51/ 5
0/ 5
0/ 5
0/ 5
0/ 5
1/ s
0/ 5
1. 85/ l. 86
4. 4 / 9. 8t5. 6 /13. Ot6. 9 / 7. it
1.62/ 1.91
0.76/ 2.270. 73/ 2. 08
6. 1 /10. 7t
1.21/ 1.391.36/ 1.01
0.58/ 1.651. 25/ 1. 67
1.00/ 2.65
0. 35/ 0. 860. 30/ 0. 48
0. 88/ 1. 181.53/ 1.83
3. 90/ 9. 05t5. 25/ 9. 05t
2. 74/ 3. 13$2. 15/ 3. 07$
0. 99
0. 450. 430. 97
0. 85
0. 330. 35
0. 57
0. 871. 35
0. 350. 75
0. 38
0. 410. 63
0. 750. 84
0. 430. 58
0. 880. 70
1. 23
0. 61
0. 66
0. 68
0. 53
0. 67
+
+
1-
+
±
+
±
1-
+
±
±
1-
±
±
±
±
±
±
±
Mouse
S 180
S 180a
S37
EC
KCa
C63
BC
WOS
MM
G26
TLTa
FVL
Rat
FRC
Fl
P6
P7
MRLS
BRI(
±
±
1. 87/
1. 47/
1. 08/
0. 81/
2. 04/
1. 52
2. 41
1. 64
1. 19
3. 85
1. 10/ 1. 64
* Treatment U. p. ) was started 24 hr after tumor inoculation and continued for 7 days.
1@Volume in ml at i0-@i1 days.4: Spleen weight In gm at 3rd week.
MARCH 1967 (Part 2) 189
on July 13, 2018. © 1967 American Association for Cancer Research. cancerres.aacrjournals.org Downloaded from
1967;27:179-189. Cancer Res Kanematsu Sugiura Two Related Compounds on a Spectrum of TumorsEffect of 1,3-Bis(2-Chloroethyl)-1-Nitrosourea (NSC-409962) and
Updated version
http://cancerres.aacrjournals.org/content/27/3_Part_2/179
Access the most recent version of this article at:
E-mail alerts related to this article or journal.Sign up to receive free email-alerts
Subscriptions
Reprints and
To order reprints of this article or to subscribe to the journal, contact the AACR Publications
Permissions
Rightslink site. Click on "Request Permissions" which will take you to the Copyright Clearance Center's (CCC)
.http://cancerres.aacrjournals.org/content/27/3_Part_2/179To request permission to re-use all or part of this article, use this link
on July 13, 2018. © 1967 American Association for Cancer Research. cancerres.aacrjournals.org Downloaded from