Embed Size (px)
Citation preview
40 DESIGN MANAGEMENT JOURNAL ACADEMIC REVIEW 2000
N E W S T R U C T U R E S F O R D E S I G N M A N A G E M E N T
B y E r i k B o h e m i a
Suitability of IndustrialDesigners to Managea Product Development Group:Australian Perspective
ERIK BOHEMIA,
INDUSTRIAL DESIGN
PROGRAM, SCHOOL OF
CIVIC ENGINEERING
AND ENVIRONMENT,
UNIVERSITY OF
WESTERN SYDNEY
IntroductionOver the last decade, the Australian manufacturing industry has come under increasingpressure to lift its performance. An increase in global competition, volatile shifts in markets,rapid changes in technology, and shifting government policy have all contributed to theincreasing need for Australian manufacturers to become more competitive. For example,the government’s decision to reduce tariffs on imported goods has resulted in these goodsbecoming available at reduced prices (Whitford 1992).
In an attempt to survive, many manufacturers pursue “world best practice”1 strategies inthe areas of product and process quality, productivity, management techniques, technology,and design. Thus, the traditional manufacturing model is gradually being replaced in Australiaby a new and more dynamic model of “lean manufacturing” (see Table 1).
Lean manufacturing was pioneered in the 1950s by Dr. Ohno at the Toyota Motor Co.2
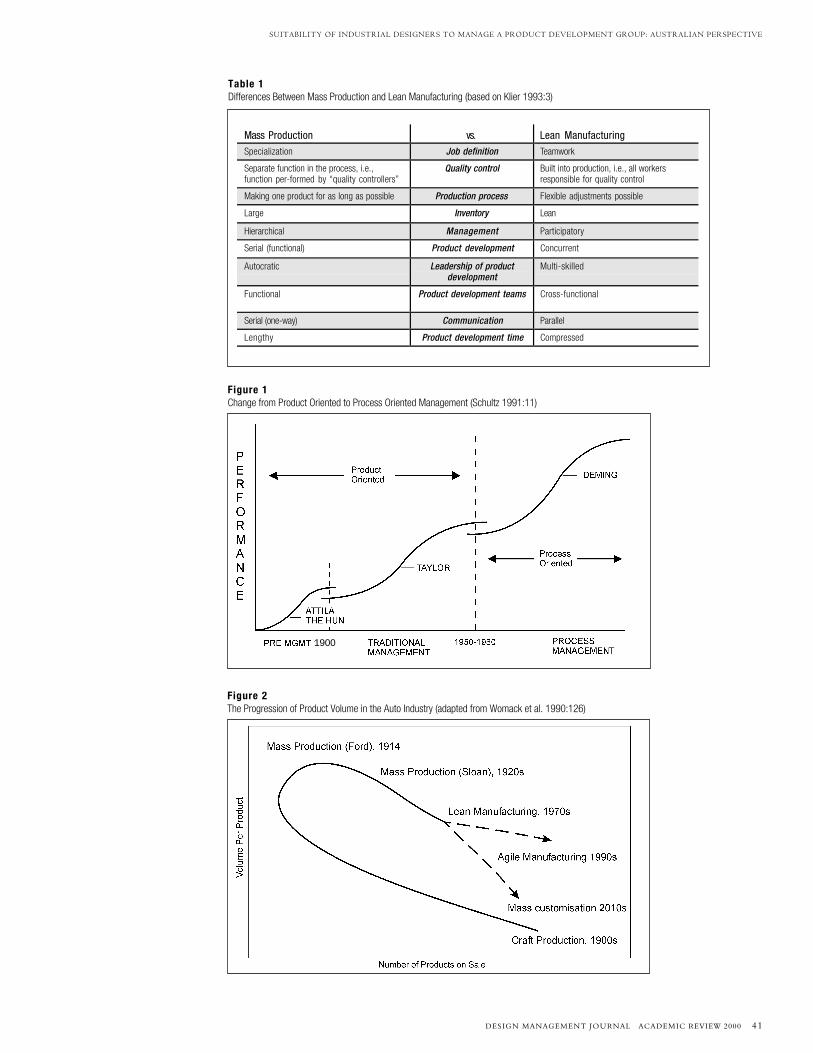
(Runkle 1991; Womack, Jones & Roos 1990; Stalk & Hount 1990; Martin 1996). Leanmanufacturing is process-oriented, whereas mass production is product-oriented (seeFigure 1). Essentially, it is a new way of managing the whole system.
Lean manufacturing is a technique that allows companies to be more responsive to quicklychanging markets and to more sophisticated and demanding consumers. This is accomplishedby using less development and lead time; using less inventory; and having less waste and fewerparts (hence, the term “lean” manufacturing). However, lean manufacturing also encompassesimproved quality; product variety; greater workplace cooperation, both internally (betweendepartments) and externally (between the organization, suppliers, and customers); andcontinual learning and improvement (Hogg 1993).
Lean manufacturing incorporates the best aspects of craft production—for exampleflexibility; and mass production– for example quality and low price (Hogg 1993:36;Morrocco 1993:24). Figure 2 illustrates the progression from craft production to lean manu-facturing in relation to the variety of products and volume of production.
Organizational management techniques, such as quality circles, close links with suppliers(Keiretsu), continuous improvement (Kaizen), and just-in-time (Kanban) inventory controlshave all played a key role in the lean manufacturing process (Womack, et. al. 1990; Stalk &Hount 1990; Department of Industrial Relations & AMC, 1992; Hogg 1993; AMC & McKinseyand Co. 1993; Miller 1993:67). It is predicted that lean manufacturing will supercede massproduction and become the next manufacturing paradigm (Womack, et. al. 1990).
A report published by Lehigh University predicts the possible global competitiveenvironment US manufacturing will be facing in 2006. The report coined a new term “agilemanufacturing” and the “virtual company” (Nagel, Dove, Goldman & Preiss 1988; Martin1996:127). Agile manufacturing is concerned with very similar aspects as leanmanufacturing. It emphasises greater flexibility of organization and even shorter is lead-timeto market and focus on customer satisfaction (Martin 1996:127). To accomplish this, it is
1. Various studies have been
commissioned by government
and businesses to unveil what
is the best practice and how it
can be implemented, e.g.,
Leading the Way (Australian
Manufacturing Council &
Manufacturing Advisory Group
1993) and Emerging Exporters(Australian Manufacturing
Council & McKinsey Co. 1993)
2. Therefore, some literature
refers to lean manufacturing
as the “Toyota manufacturing
system.”
SUITABILITY OF INDUSTRIAL DESIGNERS TO MANAGE A PRODUCT DEVELOPMENT GROUP: AUSTRALIAN PERSPECTIVE
DESIGN MANAGEMENT JOURNAL ACADEMIC REVIEW 2000 41
Table 1Differences Between Mass Production and Lean Manufacturing (based on Klier 1993:3)
Figure 2The Progression of Product Volume in the Auto Industry (adapted from Womack et al. 1990:126)
Figure 1Change from Product Oriented to Process Oriented Management (Schultz 1991:11)
Mass Production vs. Lean Manufacturing
Specialization Job definition Teamwork
Separate function in the process, i.e.,function per-formed by “quality controllers”
Quality control Built into production, i.e., all workersresponsible for quality control
Making one product for as long as possible Production process Flexible adjustments possible
Large Inventory Lean
Hierarchical Management Participatory
Serial (functional) Product development Concurrent
Autocratic Leadership of productdevelopment
Multi-skilled
Functional Product development teams Cross-functional
Serial (one-way) Communication Parallel
Lengthy Product development time Compressed
1900
42 DESIGN MANAGEMENT JOURNAL ACADEMIC REVIEW 2000
PAPERS ON THE NATURE AND PRACTICE OF DESIGN MANAGEMENT
required to create faster and greater partnerships and networks of companies bycreating “virtual companies.” It is suggested that this “web” of companies canimprove its performance if parties take active steps during the early design stagesto manage this web as a complete system (Whitney 1995).
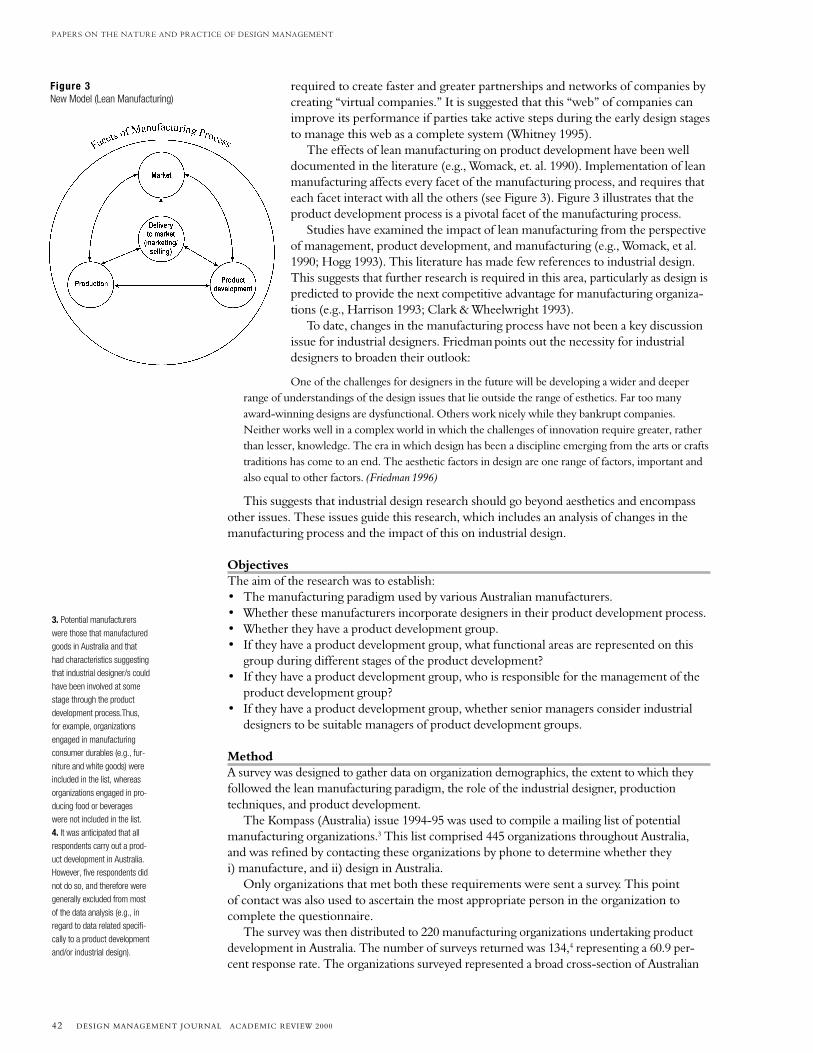
The effects of lean manufacturing on product development have been welldocumented in the literature (e.g., Womack, et. al. 1990). Implementation of leanmanufacturing affects every facet of the manufacturing process, and requires thateach facet interact with all the others (see Figure 3). Figure 3 illustrates that theproduct development process is a pivotal facet of the manufacturing process.
Studies have examined the impact of lean manufacturing from the perspectiveof management, product development, and manufacturing (e.g., Womack, et al.1990; Hogg 1993). This literature has made few references to industrial design.This suggests that further research is required in this area, particularly as design ispredicted to provide the next competitive advantage for manufacturing organiza-tions (e.g., Harrison 1993; Clark & Wheelwright 1993).
To date, changes in the manufacturing process have not been a key discussionissue for industrial designers. Friedman points out the necessity for industrialdesigners to broaden their outlook:
One of the challenges for designers in the future will be developing a wider and deeperrange of understandings of the design issues that lie outside the range of esthetics. Far too manyaward-winning designs are dysfunctional. Others work nicely while they bankrupt companies.Neither works well in a complex world in which the challenges of innovation require greater, ratherthan lesser, knowledge. The era in which design has been a discipline emerging from the arts or craftstraditions has come to an end. The aesthetic factors in design are one range of factors, important andalso equal to other factors. (Friedman 1996)
This suggests that industrial design research should go beyond aesthetics and encompassother issues. These issues guide this research, which includes an analysis of changes in themanufacturing process and the impact of this on industrial design.
ObjectivesThe aim of the research was to establish:• The manufacturing paradigm used by various Australian manufacturers.• Whether these manufacturers incorporate designers in their product development process.• Whether they have a product development group.• If they have a product development group, what functional areas are represented on this
group during different stages of the product development?• If they have a product development group, who is responsible for the management of the
product development group?• If they have a product development group, whether senior managers consider industrial
designers to be suitable managers of product development groups.
MethodA survey was designed to gather data on organization demographics, the extent to which theyfollowed the lean manufacturing paradigm, the role of the industrial designer, productiontechniques, and product development.
The Kompass (Australia) issue 1994-95 was used to compile a mailing list of potentialmanufacturing organizations.3 This list comprised 445 organizations throughout Australia,and was refined by contacting these organizations by phone to determine whether theyi) manufacture, and ii) design in Australia.
Only organizations that met both these requirements were sent a survey. This pointof contact was also used to ascertain the most appropriate person in the organization tocomplete the questionnaire.
The survey was then distributed to 220 manufacturing organizations undertaking productdevelopment in Australia. The number of surveys returned was 134,4 representing a 60.9 per-cent response rate. The organizations surveyed represented a broad cross-section of Australian
Figure 3New Model (Lean Manufacturing)
3. Potential manufacturers
were those that manufactured
goods in Australia and that
had characteristics suggesting
that industrial designer/s could
have been involved at some
stage through the product
development process.Thus,
for example, organizations
engaged in manufacturing
consumer durables (e.g., fur-
niture and white goods) were
included in the list, whereas
organizations engaged in pro-
ducing food or beverages
were not included in the list.
4. It was anticipated that all
respondents carry out a prod-
uct development in Australia.
However, five respondents did
not do so, and therefore were
generally excluded from most
of the data analysis (e.g., in
regard to data related specifi-
cally to a product development
and/or industrial design).
SUITABILITY OF INDUSTRIAL DESIGNERS TO MANAGE A PRODUCT DEVELOPMENT GROUP: AUSTRALIAN PERSPECTIVE
DESIGN MANAGEMENT JOURNAL ACADEMIC REVIEW 2000 43
5. The majority of responding
organizations were Australian
owned (77.3%).
6. Key indicators have been
ascertained from the following
literature: Australian Manufac-
turing Council & McKinsey &
Co. 1993; Association for
Manufacturing Excellence
1990a; Association for Manu-
facturing Excellence 1990b;
Clark & Fujimoto 1991;
Wheelwright & Clark 1992;
Clark & Wheelwright 1993;
Department of Industrial Rela-
tions & Australian Manufactur-
ing Council 1992; Harrison
1990; Hogg 1993; McGrath,
Anthony & Sharpiro 1992;
Nagel & Dove 1988; Sohal, et
al., 1994; Stalk, at al., 1990;
Susman 1992; Womack, et al.
1990.
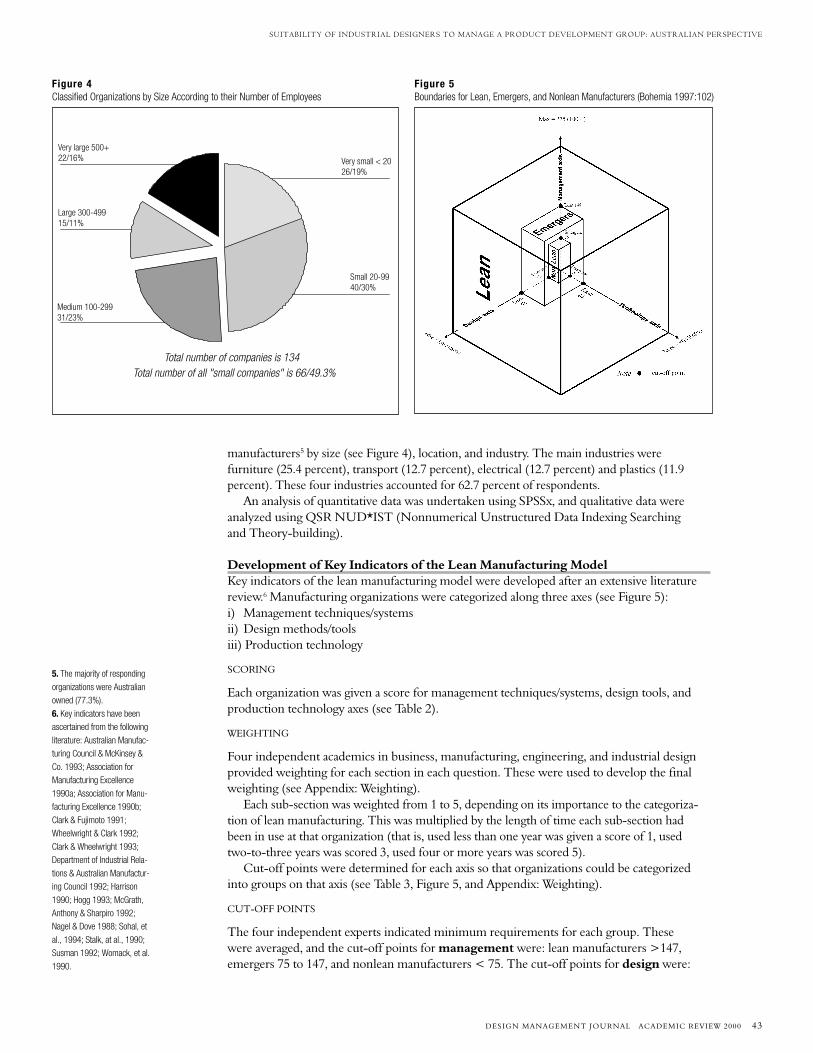
manufacturers5 by size (see Figure 4), location, and industry. The main industries werefurniture (25.4 percent), transport (12.7 percent), electrical (12.7 percent) and plastics (11.9percent). These four industries accounted for 62.7 percent of respondents.
An analysis of quantitative data was undertaken using SPSSx, and qualitative data wereanalyzed using QSR NUD*IST (Nonnumerical Unstructured Data Indexing Searchingand Theory-building).
Development of Key Indicators of the Lean Manufacturing ModelKey indicators of the lean manufacturing model were developed after an extensive literaturereview.6 Manufacturing organizations were categorized along three axes (see Figure 5):i) Management techniques/systemsii) Design methods/toolsiii) Production technology
SCORING
Each organization was given a score for management techniques/systems, design tools, andproduction technology axes (see Table 2).
WEIGHTING
Four independent academics in business, manufacturing, engineering, and industrial designprovided weighting for each section in each question. These were used to develop the finalweighting (see Appendix: Weighting).
Each sub-section was weighted from 1 to 5, depending on its importance to the categoriza-tion of lean manufacturing. This was multiplied by the length of time each sub-section hadbeen in use at that organization (that is, used less than one year was given a score of 1, usedtwo-to-three years was scored 3, used four or more years was scored 5).
Cut-off points were determined for each axis so that organizations could be categorizedinto groups on that axis (see Table 3, Figure 5, and Appendix: Weighting).
CUT-OFF POINTS
The four independent experts indicated minimum requirements for each group. Thesewere averaged, and the cut-off points for management were: lean manufacturers >147,emergers 75 to 147, and nonlean manufacturers < 75. The cut-off points for design were:
Very large 500+22/16% Very small < 20
26/19%
Large 300-49915/11%
Medium 100-29931/23%
Small 20-9940/30%
Total number of companies is 134Total number of all "small companies" is 66/49.3%
Figure 4Classified Organizations by Size According to their Number of Employees
Figure 5Boundaries for Lean, Emergers, and Nonlean Manufacturers (Bohemia 1997:102)
44 DESIGN MANAGEMENT JOURNAL ACADEMIC REVIEW 2000
PAPERS ON THE NATURE AND PRACTICE OF DESIGN MANAGEMENT
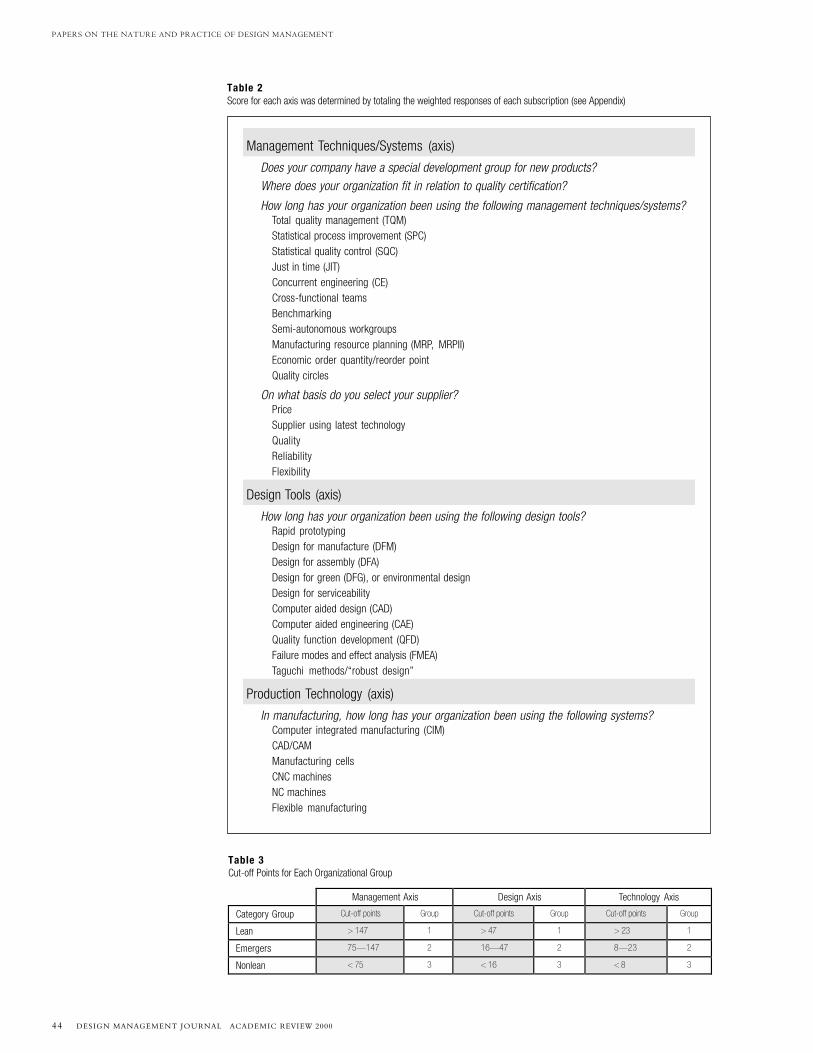
Management Axis Design Axis Technology Axis
Category Group Cut-off points Group Cut-off points Group Cut-off points Group
Lean > 147 1 > 47 1 > 23 1
Emergers 75—147 2 16—47 2 8—23 2
Nonlean < 75 3 < 16 3 < 8 3
Table 3Cut-off Points for Each Organizational Group
Table 2Score for each axis was determined by totaling the weighted responses of each subscription (see Appendix)
Management Techniques/Systems (axis)
Does your company have a special development group for new products?Where does your organization fit in relation to quality certification?
How long has your organization been using the following management techniques/systems?Total quality management (TQM)Statistical process improvement (SPC)Statistical quality control (SQC)Just in time (JIT)Concurrent engineering (CE)Cross-functional teamsBenchmarkingSemi-autonomous workgroupsManufacturing resource planning (MRP, MRPII)Economic order quantity/reorder pointQuality circles
On what basis do you select your supplier?PriceSupplier using latest technologyQualityReliabilityFlexibility
Design Tools (axis)
How long has your organization been using the following design tools?Rapid prototypingDesign for manufacture (DFM)Design for assembly (DFA)Design for green (DFG), or environmental designDesign for serviceabilityComputer aided design (CAD)Computer aided engineering (CAE)Quality function development (QFD)Failure modes and effect analysis (FMEA)Taguchi methods/“robust design”
Production Technology (axis)
In manufacturing, how long has your organization been using the following systems?Computer integrated manufacturing (CIM)CAD/CAMManufacturing cellsCNC machinesNC machinesFlexible manufacturing
SUITABILITY OF INDUSTRIAL DESIGNERS TO MANAGE A PRODUCT DEVELOPMENT GROUP: AUSTRALIAN PERSPECTIVE
DESIGN MANAGEMENT JOURNAL ACADEMIC REVIEW 2000 45
lean manufacturers >47, emergers 16 to 47, and nonlean manufacturers < 16. The cut-offpoints for technology were: lean manufacturers >23, emergers 8 to 23, and nonleanmanufacturers < 8.
The cut-off points for lean manufacturers were determined by adding the minimumindicators in management, design, and technology. These indicators had to be in use for atleast two to three years.7 The cut-off points for the emergers were the same indicators, butthese only had to have been used for less than one year. Any organization scoring below thecut-off point for emergers was assigned to the nonlean group.
FINAL GROUPING
The final groupings were lean manufacturers, emergers, and nonlean manufacturers.Organizations were allocated to one of these groups in the following way (see Table 4):• If they were in group 1 on all the axes—that is, management, design, and technology—
they were called lean manufacturers.• If they were in group 3 on any of the axes, they were put into nonlean.• All other combinations were allocated to emergers.8
Twenty organizations were classified as lean manufacturers, 41 as emergers, and 73 asnonlean manufacturers (see Table 4).
It must be noted that much of the literature discusses differences between leanmanufacturers and mass producers. The above instrument only measured organizationson the dimension of lean manufacturing; therefore, the term nonlean manufacturers cannotbe equated with mass producers. However, many organizations falling into the nonleanmanufacturers group may be using mass-production strategies.
Analysis of Results and Key Findings
PRODUCTION TECHNIQUES USED IN AUSTRALIAN
MANUFACTURING
It was found that 20 organizations (15 percent) wereusing lean manufacturing strategies (similar to theresults obtained by Sohal and Egglestone (1994:50));41 (30.5 percent) were in a group that had commencedusing some lean manufacturing strategies and werelabelled “emergers”; and 73 organizations (54.5 percent)were nonlean manufacturers (Bohemia 1997).
The data obtained in this study indicate that a qualityfocus is becoming the norm for many Australian manufacturing organizations—for example,81.5 percent of organizations surveyed have, or are seeking, quality certification; 50.8 percentwere using TQM strategies (Bohemia 1997).
There is some evidence to support a shift toward the adoption of design strategies. While87.1 percent of organizations had included design technology—for example, CAD—as part oftheir manufacturing strategy, only lean manufacturers had incorporated the use of key designmethods, such as quality function deployment (QFD), in substantial numbers (Bohemia 1997).
EMPLOYING/CONTRACTING OF INDUSTRIAL DESIGNERS
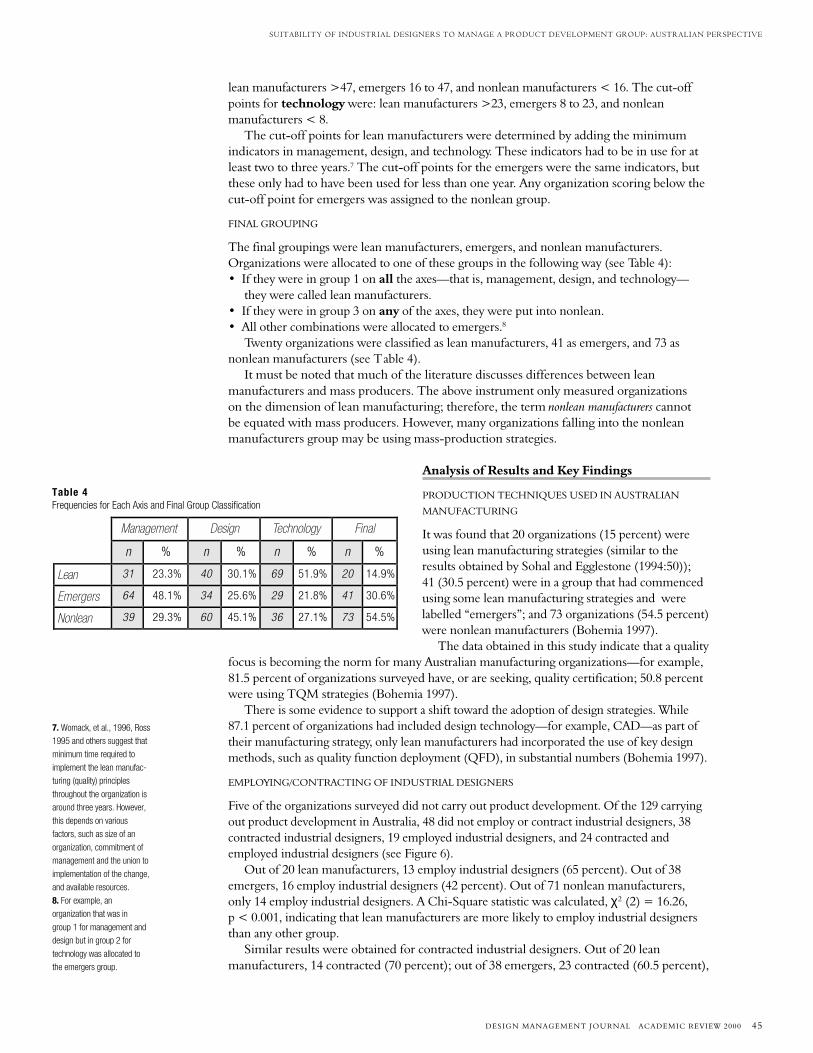
Five of the organizations surveyed did not carry out product development. Of the 129 carryingout product development in Australia, 48 did not employ or contract industrial designers, 38contracted industrial designers, 19 employed industrial designers, and 24 contracted andemployed industrial designers (see Figure 6).
Out of 20 lean manufacturers, 13 employ industrial designers (65 percent). Out of 38emergers, 16 employ industrial designers (42 percent). Out of 71 nonlean manufacturers,only 14 employ industrial designers. A Chi-Square statistic was calculated, χ2 (2) = 16.26,p < 0.001, indicating that lean manufacturers are more likely to employ industrial designersthan any other group.
Similar results were obtained for contracted industrial designers. Out of 20 leanmanufacturers, 14 contracted (70 percent); out of 38 emergers, 23 contracted (60.5 percent),
7. Womack, et al., 1996, Ross
1995 and others suggest that
minimum time required to
implement the lean manufac-
turing (quality) principles
throughout the organization is
around three years. However,
this depends on various
factors, such as size of an
organization, commitment of
management and the union to
implementation of the change,
and available resources.
8. For example, an
organization that was in
group 1 for management and
design but in group 2 for
technology was allocated to
the emergers group.
Management Design Technology Final
n % n % n % n %
Lean 31 23.3% 40 30.1% 69 51.9% 20 14.9%
Emergers 64 48.1% 34 25.6% 29 21.8% 41 30.6%
Nonlean 39 29.3% 60 45.1% 36 27.1% 73 54.5%
Table 4Frequencies for Each Axis and Final Group Classification
46 DESIGN MANAGEMENT JOURNAL ACADEMIC REVIEW 2000
PAPERS ON THE NATURE AND PRACTICE OF DESIGN MANAGEMENT
and out of 71 nonlean manufacturers, 25 contracted(32.2 percent). A Chi-Square statistic was calculated,χ2 (2) = 10.92, p < 0.005, indicating that leanmanufacturers are also more likely to contract indust-rial designers than any other group. This indicatesthat industrial design may be more of a focus for leanmanufacturers than for other groups.
Product Development
SOURCE OF NEW PRODUCT IDEAS
Mean scores were calculated for the importance of vari-ous sections of the organization as a source of new prod-uct ideas for lean manufacturers, emergers, and nonleanmanufacturers. It was hypothesized that lean manufac-turers would score all sections more evenlythan emergers and nonlean manufacturers, because inthe lean manufacturing model, all sections should beinvolved in the generation of new product ideas throughthe use of cross-functional product development groups.The data do not support this hypothesis, and they look tobe in the opposite direction—that is, it isnonlean manufacturing organizations that have scoredsections more evenly (see Figure 7). Even though thehypothesis was not supported, importance of design as asource of new product ideas increases as organizationsmove toward the lean manufacturing model.
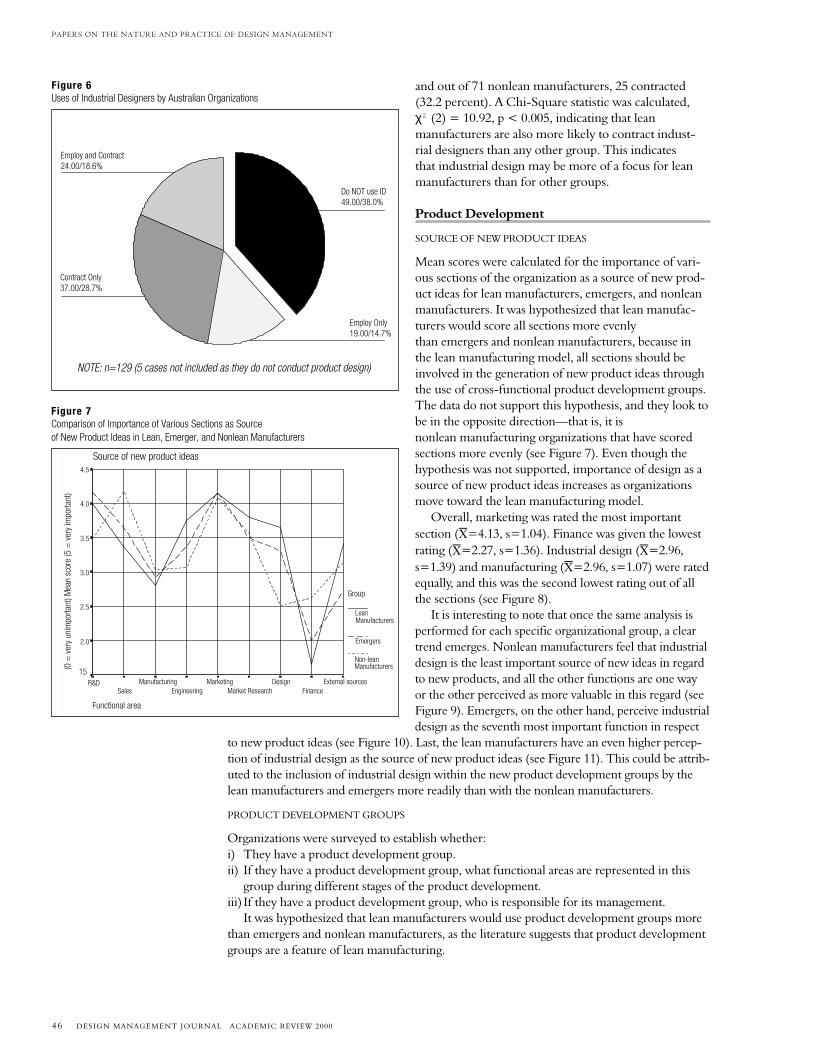
Overall, marketing was rated the most importantsection ( =4.13, s=1.04). Finance was given the lowestrating ( =2.27, s=1.36). Industrial design ( =2.96,s=1.39) and manufacturing ( =2.96, s=1.07) were ratedequally, and this was the second lowest rating out of allthe sections (see Figure 8).
It is interesting to note that once the same analysis isperformed for each specific organizational group, a cleartrend emerges. Nonlean manufacturers feel that industrialdesign is the least important source of new ideas in regardto new products, and all the other functions are one wayor the other perceived as more valuable in this regard (seeFigure 9). Emergers, on the other hand, perceive industrialdesign as the seventh most important function in respect
to new product ideas (see Figure 10). Last, the lean manufacturers have an even higher percep-tion of industrial design as the source of new product ideas (see Figure 11). This could be attrib-uted to the inclusion of industrial design within the new product development groups by thelean manufacturers and emergers more readily than with the nonlean manufacturers.
PRODUCT DEVELOPMENT GROUPS
Organizations were surveyed to establish whether:i) They have a product development group.ii) If they have a product development group, what functional areas are represented in this
group during different stages of the product development.iii) If they have a product development group, who is responsible for its management.
It was hypothesized that lean manufacturers would use product development groups morethan emergers and nonlean manufacturers, as the literature suggests that product developmentgroups are a feature of lean manufacturing.
Employ and Contract24.00/18.6%
Contract Only37.00/28.7%
Employ Only19.00/14.7%
Do NOT use ID49.00/38.0%
NOTE: n=129 (5 cases not included as they do not conduct product design)
Figure 6Uses of Industrial Designers by Australian Organizations
Source of new product ideas
Functional area
External sourcesFinance
DesignMarket Research
MarketingEngineering
ManufacturingSales
R&D
(0 =
ver
y un
impo
rtant
) Mea
n sc
ore
(5 =
ver
y im
porta
nt)
4.5.
4.0.
3.5
3.0
2.5
2.0
15.
Group
LeanManufacturers
Emergers
ManufacturersNon-lean
Figure 7Comparison of Importance of Various Sections as Sourceof New Product Ideas in Lean, Emerger, and Nonlean Manufacturers
SUITABILITY OF INDUSTRIAL DESIGNERS TO MANAGE A PRODUCT DEVELOPMENT GROUP: AUSTRALIAN PERSPECTIVE
DESIGN MANAGEMENT JOURNAL ACADEMIC REVIEW 2000 47
9. Fifty percent of nonlean
manufacturers do not use the
special development groups at
all. On the other hand, emerg-
ers do not use it only in 16
percent of cases, and
lean manufacturers do not use
it only in 5 percent of cases.
Figure 11Perceived Importance of Different Sections as Source of New Product Ideasin Order of Importance for Lean Manufacturers.
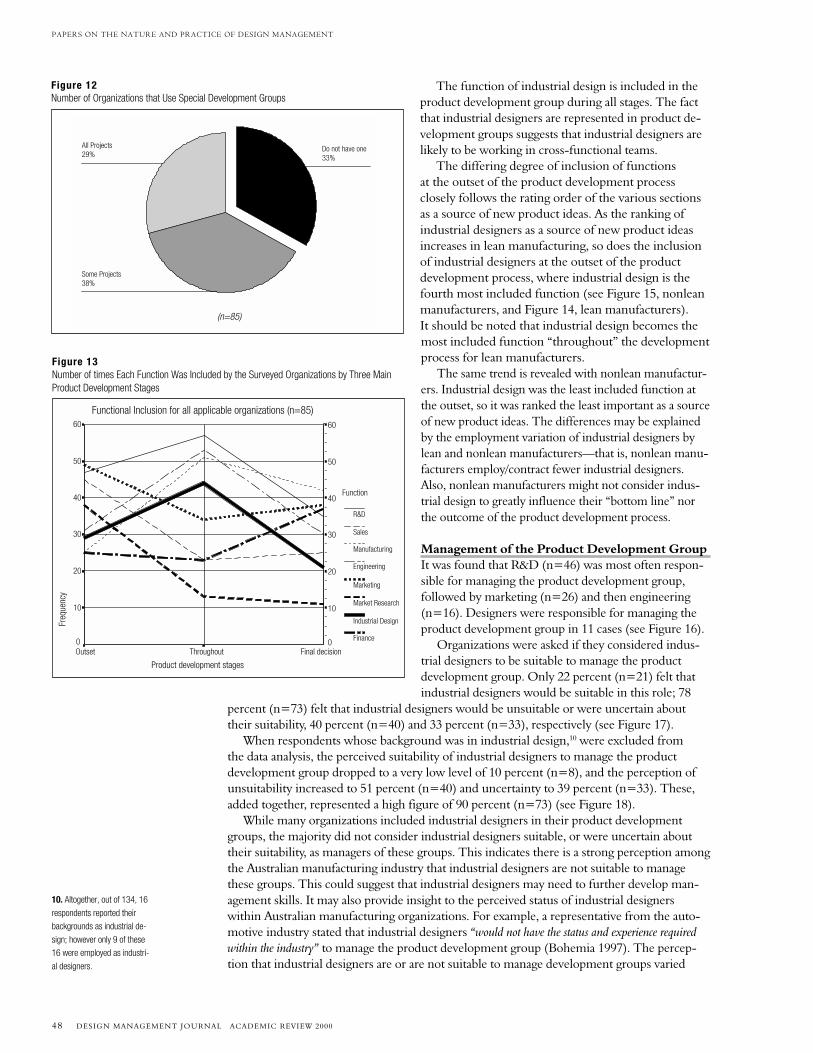
Overall, it was found that 67 percent (n=85) of organizations use a product developmentgroup in some form (that is, for all projects or some projects) for new products (see Figure 12).9
An analysis of the data was made using Chi-Square statistics. It was found that, as hypoth-esized, it would be more likely for lean manufacturers to use product development groupsfor all projects, emergers to use product development groups for some projects, and nonleanmanufacturers to not use product development groups, χ2(4) = 24.88, p < 0.005.
As lean manufacturers are more likely to use product development groups for all projects,this is likely to have an impact on the role of industrial designers and product developmentmethodology. Industrial designers working in lean manufacturing organizations will berequired to work closely with other professionals in work teams. This may require thedevelopment of additional skills as outlined by Hogg (1993).
Representation of Functional Areas on the Product Development GroupsFrequencies were calculated for the number of organizations using each functional area(that is, R&D, sales, industrial design, engineering, manufacturing, market research, market-ing, and finance) at the outset, throughout, and at the final decision stage of the projectdevelopment (see Figure 13). Marketing (n=49), R&D (n=47), and sales (n=45)are used more than other sections at the outset of the project. R&D (n=57), engineering(n=53), and manufacturing (n = 51) are used more than other sections throughout theproject. Manufacturing (n=42), marketing (n=38), and R&D (n=35) are use more thanother sections at the final decision stage (before production commences), see Figure 13.
1.0 1.5 2.0 2.5 3.0 3.5 4.0 4.5
Finance
Manufacturing
Sales
External
Industrial Design
Engineering
Market Research
R&D
Marketing
Importance of function (1=least, 5=very)
Orga
niza
tiona
l fun
ctio
n
Figure 10Perceived Importance of Different Sections as Source of New Product Ideasin Order of Importance for Emergers.
1.5 2.0 2.5 3.0 3.5 4.0 4.5
Finance
External
Manufacturing
Industrial Design
Engineering
Market Research
Sales
R&D
Marketing
Importance of function (1=least, 5=very)
Orga
niza
tiona
l fun
ctio
n
Figure 9Perceived Importance of Different Sections as Source of New Product Ideasin Order of Importance for non-lean manufacturers.
1.5 2.0 2.5 3.0 3.5 4.0 4.5
Industrial Design
Finance
Manufacturing
Engineering
External
R&D
Market Research
Marketing
Sales
Importance of function (1=least, 5=very)
Orga
niza
tiona
l fun
ctio
n
2.0 2.5 3.0 3.5 4.0 4.5
Finance
Industrial Design
Manufacturing
External
Engineering
R&D
Sales
Marketing
Importance of function (1=least, 5=very)
Orga
niza
tiona
l fun
ctio
n
Figure 8Perceived Importance of Different Sections as Source of New Product Ideasin Order of Importance for All Organizations.
48 DESIGN MANAGEMENT JOURNAL ACADEMIC REVIEW 2000
PAPERS ON THE NATURE AND PRACTICE OF DESIGN MANAGEMENT
The function of industrial design is included in theproduct development group during all stages. The factthat industrial designers are represented in product de-velopment groups suggests that industrial designers arelikely to be working in cross-functional teams.
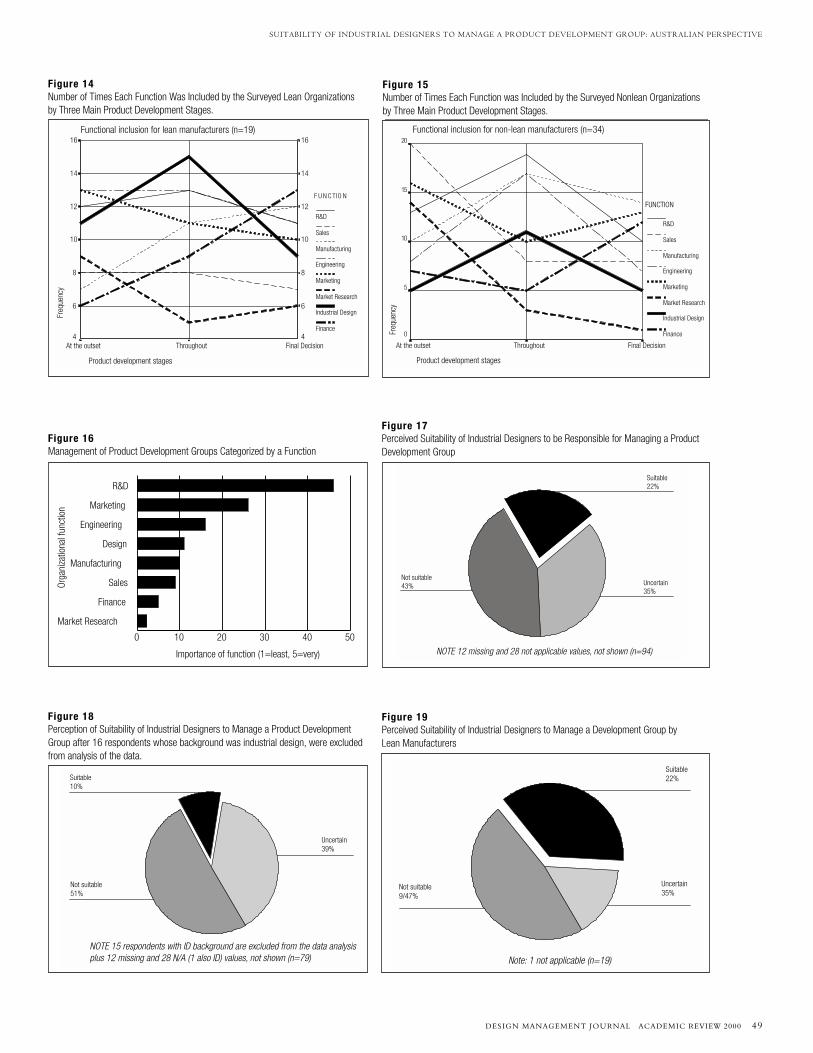
The differing degree of inclusion of functionsat the outset of the product development processclosely follows the rating order of the various sectionsas a source of new product ideas. As the ranking ofindustrial designers as a source of new product ideasincreases in lean manufacturing, so does the inclusionof industrial designers at the outset of the productdevelopment process, where industrial design is thefourth most included function (see Figure 15, nonleanmanufacturers, and Figure 14, lean manufacturers).It should be noted that industrial design becomes themost included function “throughout” the developmentprocess for lean manufacturers.
The same trend is revealed with nonlean manufactur-ers. Industrial design was the least included function atthe outset, so it was ranked the least important as a sourceof new product ideas. The differences may be explainedby the employment variation of industrial designers bylean and nonlean manufacturers—that is, nonlean manu-facturers employ/contract fewer industrial designers.Also, nonlean manufacturers might not consider indus-trial design to greatly influence their “bottom line” northe outcome of the product development process.
Management of the Product Development GroupIt was found that R&D (n=46) was most often respon-sible for managing the product development group,followed by marketing (n=26) and then engineering(n=16). Designers were responsible for managing theproduct development group in 11 cases (see Figure 16).
Organizations were asked if they considered indus-trial designers to be suitable to manage the productdevelopment group. Only 22 percent (n=21) felt thatindustrial designers would be suitable in this role; 78
percent (n=73) felt that industrial designers would be unsuitable or were uncertain abouttheir suitability, 40 percent (n=40) and 33 percent (n=33), respectively (see Figure 17).
When respondents whose background was in industrial design,10 were excluded fromthe data analysis, the perceived suitability of industrial designers to manage the productdevelopment group dropped to a very low level of 10 percent (n=8), and the perception ofunsuitability increased to 51 percent (n=40) and uncertainty to 39 percent (n=33). These,added together, represented a high figure of 90 percent (n=73) (see Figure 18).
While many organizations included industrial designers in their product developmentgroups, the majority did not consider industrial designers suitable, or were uncertain abouttheir suitability, as managers of these groups. This indicates there is a strong perception amongthe Australian manufacturing industry that industrial designers are not suitable to managethese groups. This could suggest that industrial designers may need to further develop man-agement skills. It may also provide insight to the perceived status of industrial designerswithin Australian manufacturing organizations. For example, a representative from the auto-motive industry stated that industrial designers “would not have the status and experience requiredwithin the industry” to manage the product development group (Bohemia 1997). The percep-tion that industrial designers are or are not suitable to manage development groups varied
10. Altogether, out of 134, 16
respondents reported their
backgrounds as industrial de-
sign; however only 9 of these
16 were employed as industri-
al designers.
Figure 12Number of Organizations that Use Special Development Groups
(n=85)
Some Projects38%
All Projects29%
Do not have one33%
Figure 13Number of times Each Function Was Included by the Surveyed Organizations by Three MainProduct Development Stages
Final decisionThroughoutOutset
60
50
40
30
20
10
0
60
50
40
30
20
10
0
Function
R&D
Sales
Manufacturing
Engineering
Marketing
Market Research
Industrial Design
Finance
Product development stages
Freq
uenc
y
Functional Inclusion for all applicable organizations (n=85)
SUITABILITY OF INDUSTRIAL DESIGNERS TO MANAGE A PRODUCT DEVELOPMENT GROUP: AUSTRALIAN PERSPECTIVE
DESIGN MANAGEMENT JOURNAL ACADEMIC REVIEW 2000 49
Functional inclusion for non-lean manufacturers (n=34)
Product development stages
Final DecisionThroughoutAt the outset
Freq
uenc
y
20
15
10
5
0
FUNCTION
R&D
Sales
Manufacturing
Engineering
Marketing
Market Research
Industrial Design
Finance
Figure 15Number of Times Each Function was Included by the Surveyed Nonlean Organizationsby Three Main Product Development Stages.
Functional inclusion for lean manufacturers (n=19)
Product development stages
Final DecisionThroughoutAt the outset
Freq
uenc
y
16
14
12
10
8
6
4
16
14
12
10
8
6
4
F U N C TIO N
R&D
Sales
Manufacturing
Engineering
Marketing
Market Research
Industrial Design
Finance
Figure 14Number of Times Each Function Was Included by the Surveyed Lean Organizationsby Three Main Product Development Stages.
Not suitable43% Uncertain
35%
Suitable22%
NOTE 12 missing and 28 not applicable values, not shown (n=94)
Figure 17Perceived Suitability of Industrial Designers to be Responsible for Managing a ProductDevelopment Group
Uncertain39%
Suitable10%
Not suitable51%
NOTE 15 respondents with ID background are excluded from the data analysis plus 12 missing and 28 N/A (1 also ID) values, not shown (n=79)
Figure 18Perception of Suitability of Industrial Designers to Manage a Product DevelopmentGroup after 16 respondents whose background was industrial design, were excludedfrom analysis of the data.
Note: 1 not applicable (n=19)
Uncertain35%
Suitable22%
Not suitable9/47%
Figure 19Perceived Suitability of Industrial Designers to Manage a Development Group byLean Manufacturers
Figure 16Management of Product Development Groups Categorized by a Function
0 10 20 30 40 50
Market Research
Finance
Sales
Manufacturing
Design
Engineering
Marketing
R&D
Importance of function (1=least, 5=very)
Orga
niza
tiona
l fun
ctio
n
50 DESIGN MANAGEMENT JOURNAL ACADEMIC REVIEW 2000
PAPERS ON THE NATURE AND PRACTICE OF DESIGN MANAGEMENT
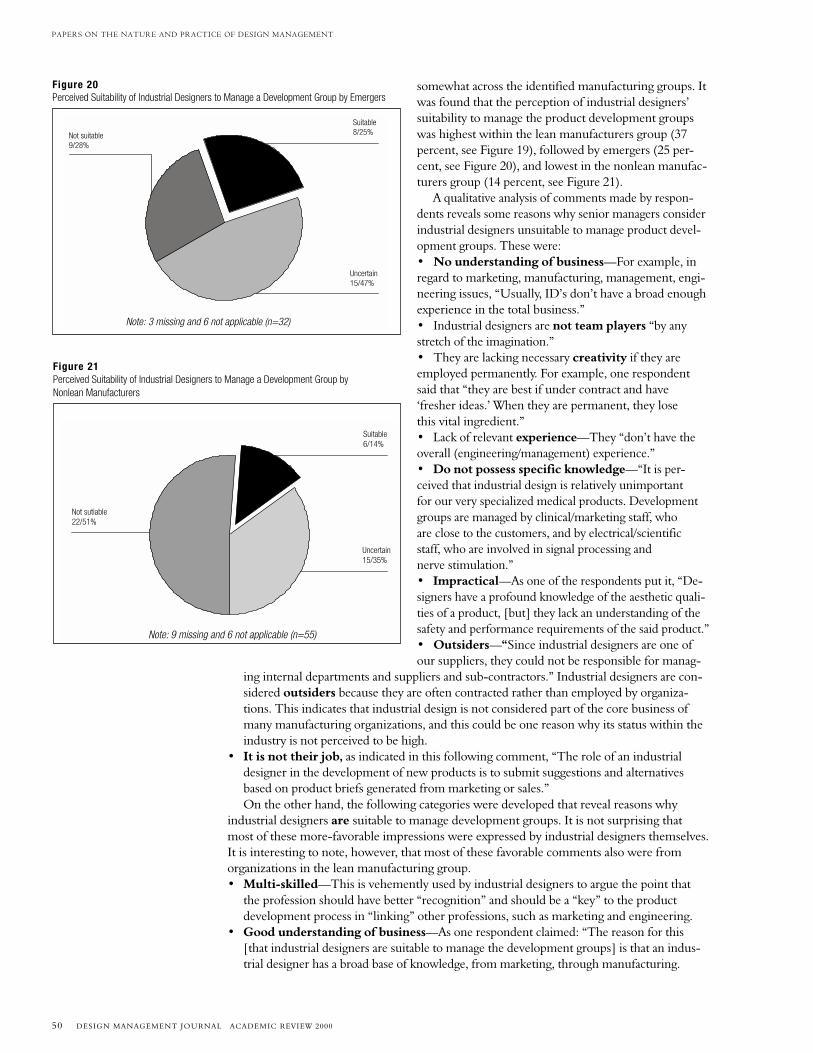
somewhat across the identified manufacturing groups. Itwas found that the perception of industrial designers’suitability to manage the product development groupswas highest within the lean manufacturers group (37percent, see Figure 19), followed by emergers (25 per-cent, see Figure 20), and lowest in the nonlean manufac-turers group (14 percent, see Figure 21).
A qualitative analysis of comments made by respon-dents reveals some reasons why senior managers considerindustrial designers unsuitable to manage product devel-opment groups. These were:• No understanding of business—For example, inregard to marketing, manufacturing, management, engi-neering issues, “Usually, ID’s don’t have a broad enoughexperience in the total business.”• Industrial designers are not team players “by anystretch of the imagination.”• They are lacking necessary creativity if they areemployed permanently. For example, one respondentsaid that “they are best if under contract and have‘fresher ideas.’ When they are permanent, they losethis vital ingredient.”• Lack of relevant experience—They “don’t have theoverall (engineering/management) experience.”• Do not possess specific knowledge—“It is per-ceived that industrial design is relatively unimportantfor our very specialized medical products. Developmentgroups are managed by clinical/marketing staff, whoare close to the customers, and by electrical/scientificstaff, who are involved in signal processing andnerve stimulation.”• Impractical—As one of the respondents put it, “De-signers have a profound knowledge of the aesthetic quali-ties of a product, [but] they lack an understanding of thesafety and performance requirements of the said product.”• Outsiders—“Since industrial designers are one ofour suppliers, they could not be responsible for manag-
ing internal departments and suppliers and sub-contractors.” Industrial designers are con-sidered outsiders because they are often contracted rather than employed by organiza-tions. This indicates that industrial design is not considered part of the core business ofmany manufacturing organizations, and this could be one reason why its status within theindustry is not perceived to be high.
• It is not their job, as indicated in this following comment, “The role of an industrialdesigner in the development of new products is to submit suggestions and alternativesbased on product briefs generated from marketing or sales.”On the other hand, the following categories were developed that reveal reasons why
industrial designers are suitable to manage development groups. It is not surprising thatmost of these more-favorable impressions were expressed by industrial designers themselves.It is interesting to note, however, that most of these favorable comments also were fromorganizations in the lean manufacturing group.• Multi-skilled—This is vehemently used by industrial designers to argue the point that
the profession should have better “recognition” and should be a “key” to the productdevelopment process in “linking” other professions, such as marketing and engineering.
• Good understanding of business—As one respondent claimed: “The reason for this[that industrial designers are suitable to manage the development groups] is that an indus-trial designer has a broad base of knowledge, from marketing, through manufacturing.
Note: 9 missing and 6 not applicable (n=55)
Suitable6/14%
Uncertain15/35%
Not sutiable22/51%
Figure 21Perceived Suitability of Industrial Designers to Manage a Development Group byNonlean Manufacturers
Note: 3 missing and 6 not applicable (n=32)
Uncertain15/47%
Suitable8/25%Not suitable
9/28%
Figure 20Perceived Suitability of Industrial Designers to Manage a Development Group by Emergers
SUITABILITY OF INDUSTRIAL DESIGNERS TO MANAGE A PRODUCT DEVELOPMENT GROUP: AUSTRALIAN PERSPECTIVE
DESIGN MANAGEMENT JOURNAL ACADEMIC REVIEW 2000 51
Decisions need to be made with all these aspects taken into account. An industrial designeralso has the ability to look at where products are going and to look at ideas and concepts thatare going to be the future for a manufacturer.”
• It is their job—A respondent who is employed as an industrial designer has claimed that“we are trained in all fields of cradle-to-the-grave product life, including market researchand placement, ergonomics, engineering, manufacturing, presenting, communicating,designing, and being creative. This includes being able to make design decisions.”
• Integrator—This category is summarized in the following quote, “An industrial designeris the key that informs and interprets the needs of all the other areas. He or she is skilledin design and production, and has understanding of market needs.”
The above contrasting reports on reasons why industrial designers are consideredappropriate or not to lead product development groups suggest that:i) Managers outside the design profession do not fully understand the capabilities of
industrial designers and the role they can contribute to product development.ii) Industrial designers have an “over-inflated” opinion of their capabilities and contributions
to product development.
It is beyond the scope of this study to establish which is the more accurate perception.However, it is important to investigate this area, as it has the following implications:i) If managers have a poor understanding of the contribution industrial designers make to
product development groups, then an increased effort needs to be made to educateAustralian manufacturers of the value of industrial design.
ii) If industrial designers have an over-inflated opinion of their contribution to productdevelopment groups, then the basic education of industrial designers needs to bere-evaluated and adjusted to “fit” better with industry.It is also possible that these contradictory reports result from professional bias—that is,
managers from professions other than design are not willing to give credit to the role of otherprofessions in their contribution to product development groups.
ConclusionThe data indicate that lean manufacturers:i) Employ more industrial designers than nonlean manufacturersii) Involve industrial designers more in product development groupsiii)Consider industrial designers a better source of new product ideas than do nonlean
manufacturersiv) Perceive industrial designers as more suitable to manage product development groups
This suggests that as we shift from mass production to lean manufacturing, the role ofindustrial designers is becoming more critical, consequently increasing designers’ status andtheir power within organizations. This is reflected in the data, as the perception that industrialdesigners are or are not suitable to manage development groups varies somewhat across theidentified manufacturing groups. Lean manufacturers perceive industrial designers to beslightly more suitable than do emergers and nonlean manufacturers. This could be due to anumber of factors—and one of them might be a question of power.
For example, in the mass-manufacturing paradigm with an emphasis on cost, accountingmay be in a more powerful position. If production cannot continue without the expertiseof engineers, then engineering may be in a powerful position. On the other hand, if theorganizational emphasis is on innovation, then research and development and marketingmight play a critical role. It can be argued that once an organization develops design strategiesand starts to use design for competitive advantage in the market place, industrial design willthen be considered more critical in enabling the organization to achieve its goals. This is anexample of indispensability (Stoner, Yetton, Craig and Johnston 1994:237). This is the casewhen a department’s “activities are critically important to the organization” and they cannotbe done by the other departments.
It can be argued that global competition, which is forcing organizations to adopt
52 DESIGN MANAGEMENT JOURNAL ACADEMIC REVIEW 2000
PAPERS ON THE NATURE AND PRACTICE OF DESIGN MANAGEMENT
advanced manufacturing systems, such as lean manufacturing, is having a positive impacton how design is perceived by manufacturing organizations. An associated factor that maybe contributing to this is the management and design tools that lean manufacturers use—for example, total quality management, quality control, statistical quality control, qualityfunction deployment, concurrent engineering, and design for manufacturability andassembly. These tools should drive organizations to formalize their processes. Blaich andBlaich (1993) argue that the formalization of the product development process has becomea legitimate concern within manufacturing organizations, and this should in turn removeany ambiguity that surrounds industrial design and its scope within the design process.These tools also force the organization to rethink its various strategies and adjust theprocess accordingly, in order to use industrial design to achieve a competitive advantagein the market place.
Product “quality” was an important consideration in the ’80s and ’90s, and was ableto provide organizations with a competitive advantage. This research confirms that mostorganizations have incorporated TQM strategies into their mainstream practice. Newcompetitive advantages are now being sought (Elis 1994:33), and the literature suggeststhat industrial design is going to be integral in the pursuit of competitive advantage inrapidly changing local and global markets (The Australian Academy of Design 1995;Dusting-Laird 1995:31; AMC 1994; AMC & McKinsey 1993; Crawford 1994; Gobé1993:22; Lorenz, 1990:5; NIES 1993; Nussbaum 1993:40; Stalk & Hount 1990;Womack, et al. 1990; W alsh, Roy , Bruce & Potter 1992, Blaich & Blaich 1993). This is evi-dent from the data analysis, as more lean manufacturers than other identified groupsuse industrial design—that is, employ/contract and include in product development groups.At the same time, the lean manufacturers consider the importance of industrial designersas a better source of new product ideas than do emergers and nonlean manufacturers.Therefore, changes that are occurring in the manufacturing industry in Australia should beviewed as positive for the industrial design profession, and this profession should startseriously debating these changes so that designers fully understand their role/s and potentialin a lean manufacturing paradigm. � (Reprint #00ABOH40)
ReferencesThe Australian Academy of Design. 1995. Competing by Design: The National Design Review
Report. St. Leonards, NSW.Association for Manufacturing Excellence. 1990. Flexibility: Manufacturing Battlefield of the ’90s:
Report on Attaining Manufacturing Flexibility in Japan and the United States.Association for Manufacturing Excellence. 1990. Manufacturing 21 Report: The Future of Japanese
Manufacturing, Association for Manufacturing Excellence. Wheeling, IL.Australian Manufacturing Council & Manufacturing Advisory Group (N.Z.) 1993. Leading the
Way: A Study of Manufacturing Practices in Australia and New Zealand, Second Edition.Australian Manufacturing Council. 1994. The Wealth of Ideas: How Linkages Help Sustain
Innovation and Growth. Melbourne, Vic., Aus.Blaich, R. & Blaich, J. 1993. Product Design and Corporate Strategy: Managing the Connection for
Competitive Advantage. New York: McGraw-Hill.Bohemia, E. 1997. “Lean Manufacturing in A ustralia and its Impact on Industrial Design,”
Proceedings of the International Conference on Engineering Design, ICED, Tampere, August19-21. Vol. 1 Tampere, Finland:Tampere University of Technology, 101-104.
Clark, K. B. & Fujimoto, T. 1991. Product Development Strategy, Boston: Harvard BusinessSchool Press.
Clark, K. B. & Wheelwright, S. C. 1993. Managing New Product and Process Development: Textand Cases. New York: The Free Press.
Crawford, M. C. 1994. New Product Management, Fourth Edition. Boston: Irvin.Australian Manufacturing Council & McKinsey & Co. 1992. International Best Practice. Report of
the Overseas Sudy Mission. Commonwealth of Australia, Canberra, ACT.Dusting-Laird, S. 1995. “Design on the Future.” AusIndustry Magazine, X (July/August), 31.Elis, S. R. 1994. “Toward the Design Era: The Evolution of the Designer as Functional
Interface with Marketing and Engineering.” Design Management Journal (Summer), 31-34.
SUITABILITY OF INDUSTRIAL DESIGNERS TO MANAGE A PRODUCT DEVELOPMENT GROUP: AUSTRALIAN PERSPECTIVE
DESIGN MANAGEMENT JOURNAL ACADEMIC REVIEW 2000 53
Friedman, K. 1996. Subject: Informative and concise essay on the challenges of industrial,Industrial Design Forum ([email protected]), [Online Dec. 1996, accessed 26 Sept.1997]. URL: http://caid4u.kaist.ac.kt/~tjnam/idforum/96-12/0135.html
Gobé, M. 1993. “The best and worst: industrial designs.” Chief Executive 86 (June), 23-33.Harrison, N. J. 1990. Restructuring for Competition: Australian Manufacturing Strategies in the 1990s;
Executive Summary of the 1990 Australian Manufacturing Survey. Sydney, NSW: University ofTechnology.
Klier, T. H. 1993. “Lean manufacturing understanding a new manufacturing system.” ChicagoFed Letter 67 (March), 1-3.
Lorenz, C. 1990. The Design Dimension: The New Competitive Weapon for Product Strategy andGlobal Marketing, Second Edition. Oxford: Basil Blackwell, 166.
Martin, J. 1996. Cybercorp: The New Business Revolution. New York: American ManagementAssociation.
McGrath, M. E., Anthony, M. T. & Shapiro, A. R. 1992. Product Development: Success ThroughProduct and Cycle-time Excellence. Stoneham, MA: Butterworth-Heinemann.
McKinsey & Co., Australian Manufacturing Council. 1993. Emerging Exporters: Australia’s HighValue-Added Manufacturing Exporters. Melbourne: Australian Manufacturing Council.
Miller, K. L. 1993. “GM’s German lesson.” Business Week (December), 67-68.Morrocco, J. D. 1993. “USAF aim: lean production.” Aviation Week and Space Technology. May
(138), 23-24.Nagel, R., Dove, R., Goldman, S. & Preiss, K. (eds.) 1988. 21st Century Manufacturing Strategy:
Volume 1 and Volume 2, Bethlemen, PA: Iacocca Institute, Lehigh University.Nussbaum, B. 1993. “Hot product: smart design is the common thread.” Business Week 3322
(June), 53-57.Ross, J. E. 1995. Total Management Quality: Text, Cases and Readings, Second Edition. Delray
Beach, FL: St. Lucie Press, 455.Runkle, D. L. 1991. “SMR forum: taught in America.” Sloan Management Review 33 (1), 57-72.Shultz, L. E. 1991. “The rings of Management: The New Management Theory.” Human
Systems Management. Vol. 10, 11-17.Sohal, A. S. & Egglestone, A. 1994. “Lean production: experience among Australian
organizations.” International Journal of Operations and Production Management 14 (11), 35-51.Stalk, G. and Hount, T. M. 1990. Competing Against Time: How Time-Based Competition is
Reshaping Global Markets. New York: The Free Press.Stoner, J. A. F., Yetton, P. W., Craig, J. F. & Johnston, K. D. 1994. Management, Second Ed.
Sydney, NSW: Prentice Hall Australia.Susman, G. I. (ed.) 1992. Integrating Design and Manufacturing for Competitive Advantage. New
York: Oxford University Press.Walsh, V., Roy, R., Bruce, M. & Potter, S. 1992. Winning by Design: Technology, Product Design
and International Competitiveness. Oxford, UK: Blackwell.Wheelwright, S. C. & Clark, K. B. 1992. Revolutionizing Product Development: Quantum Leaps in
Speed, Efficiency, and Quality. New York: The Free Press.Whitford, B. 1992. Success Through Excellence: How Companies in Australia are Seeking and
Attaining Excellence. South Perth, WA, Aus.: Beaumont.Whitney, D. 1995. Agile Pathfinders in the Aircraft and Automobile Industries:A Progress Report
[Online 1995, accessed 12 October 1995]. URL: http://web.mit.edu./org/c/ctpid/www/agile/atlanta.html
Womack, J. P., Jones, D. T. & Roos, D. 1990. The Machine that Changed the World. New York:Rawson.
54 DESIGN MANAGEMENT JOURNAL ACADEMIC REVIEW 2000
PAPERS ON THE NATURE AND PRACTICE OF DESIGN MANAGEMENT
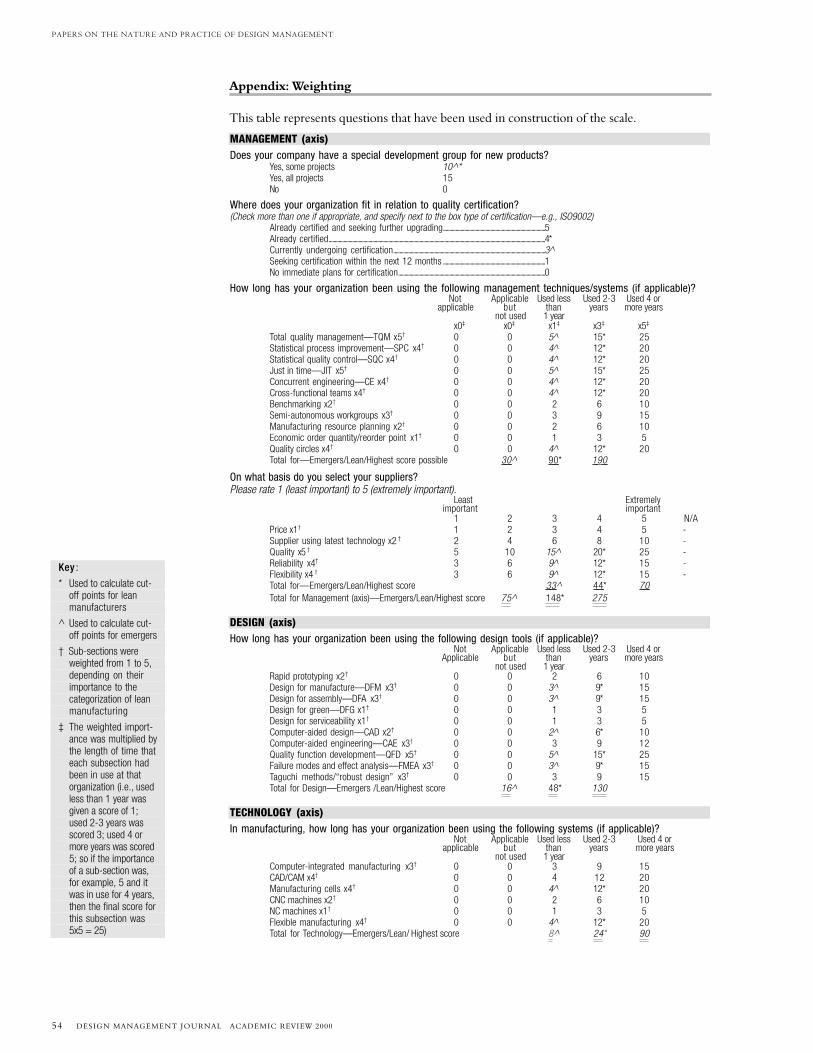
MANAGEMENT (axis)Does your company have a special development group for new products?
Yes, some projects 10^*Yes, all projects 15No 0
Where does your organization fit in relation to quality certification?(Check more than one if appropriate, and specify next to the box type of certification—e.g., ISO9002)
Already certified and seeking further upgrading..................................................................................5Already certified..............................................................................................................................................................................4*Currently undergoing certification..........................................................................................................................3Seeking certification within the next 12 months ..................................................................................1No immediate plans for certification......................................................................................................................0
How long has your organization been using the following management techniques/systems (if applicable)?Not Applicable Used less Used 2-3 Used 4 or
applicable but than years more years not used 1 year
x0‡ x0‡ x1‡ x3‡ x5‡
Total quality management—TQM x5† 0 0 5 15* 25Statistical process improvement—SPC x4† 0 0 4 12* 20Statistical quality control—SQC x4† 0 0 4 12* 20Just in time—JIT x5† 0 0 5 15* 25Concurrent engineering—CE x4† 0 0 4 12* 20Cross-functional teams x4† 0 0 4 12* 20Benchmarking x2† 0 0 2 6 10Semi-autonomous workgroups x3† 0 0 3 9 15Manufacturing resource planning x2† 0 0 2 6 10Economic order quantity/reorder point x1† 0 0 1 3 5Quality circles x4† 0 0 4 12* 20Total for—Emergers/Lean/Highest score possible 30 90 * 190
On what basis do you select your suppliers?Please rate 1 (least important) to 5 (extremely important).
Least .............................. Extremelyimportant important
1 2 3 4 5 N/APrice x1† 1 2.............. 3 4 5 -Supplier using latest technology x2 † 2 4.............. 6 8 10 -Quality x5 † 5 10............ 15^ 20* 25 -Reliability x4† 3 6.............. 9 12* 15 -Flexibility x4 † 3 6.............. 9 12* 15 -Total for—Emergers/Lean/Highest score 33 44 * 70 Total for Management (axis)—Emergers/Lean/Highest score 75 148 * 275
DESIGN (axis)How long has your organization been using the following design tools (if applicable)?
Not Applicable Used less Used 2-3 Used 4 or Applicable but than years more years
not used 1 yearRapid prototyping x2† 0 0 2 6 10Design for manufacture—DFM x3† 0 0 3 9* 15Design for assembly—DFA x3† 0 0 3 9* 15Design for green—DFG x1† 0 0 1 3 5Design for serviceability x1† 0 0 1 3 5Computer-aided design—CAD x2† 0 0 2 6* 10Computer-aided engineering—CAE x3† 0 0 3 9 12Quality function development—QFD x5† 0 0 5 15* 25Failure modes and effect analysis—FMEA x3† 0 0 3 9* 15Taguchi methods/“robust design” x3† 0 0 3 9 15Total for Design—Emergers /Lean/Highest score 16 48 * 130
TECHNOLOGY (axis)In manufacturing, how long has your organization been using the following systems (if applicable)?
Not Applicable Used less Used 2-3 Used 4 orapplicable but than years more years
not used 1 yearComputer-integrated manufacturing x3† 0 0 3 9 15CAD/CAM x4† 0 0 4 12 20Manufacturing cells x4† 0 0 4 12* 20CNC machines x2† 0 0 2 6 10NC machines x1† 0 0 1 3 5Flexible manufacturing x4† 0 0 4 12* 20Total for Technology—Emergers/Lean/ Highest score 8 24 * 90
Appendix: Weighting
This table represents questions that have been used in construction of the scale.
Key :
* Used to calculate cut-off points for leanmanufacturers
Used to calculate cut-off points for emergers
† Sub-sections wereweighted from 1 to 5,depending on theirimportance to thecategorization of leanmanufacturing
‡ The weighted import-ance was multiplied bythe length of time thateach subsection hadbeen in use at thatorganization (i.e., usedless than 1 year wasgiven a score of 1;used 2-3 years wasscored 3; used 4 ormore years was scored5; so if the importanceof a sub-section was,for example, 5 and itwas in use for 4 years,then the final score forthis subsection was5x5 = 25)