Embed Size (px)
Citation preview
SUGGESTED SOLUTIONS
KB 2 – Business Management Accounting
June 2017
All Rights Reserved
KB2 - Suggested Solutions June 2017 Page 2 of 18
SECTION 1 Answer 01
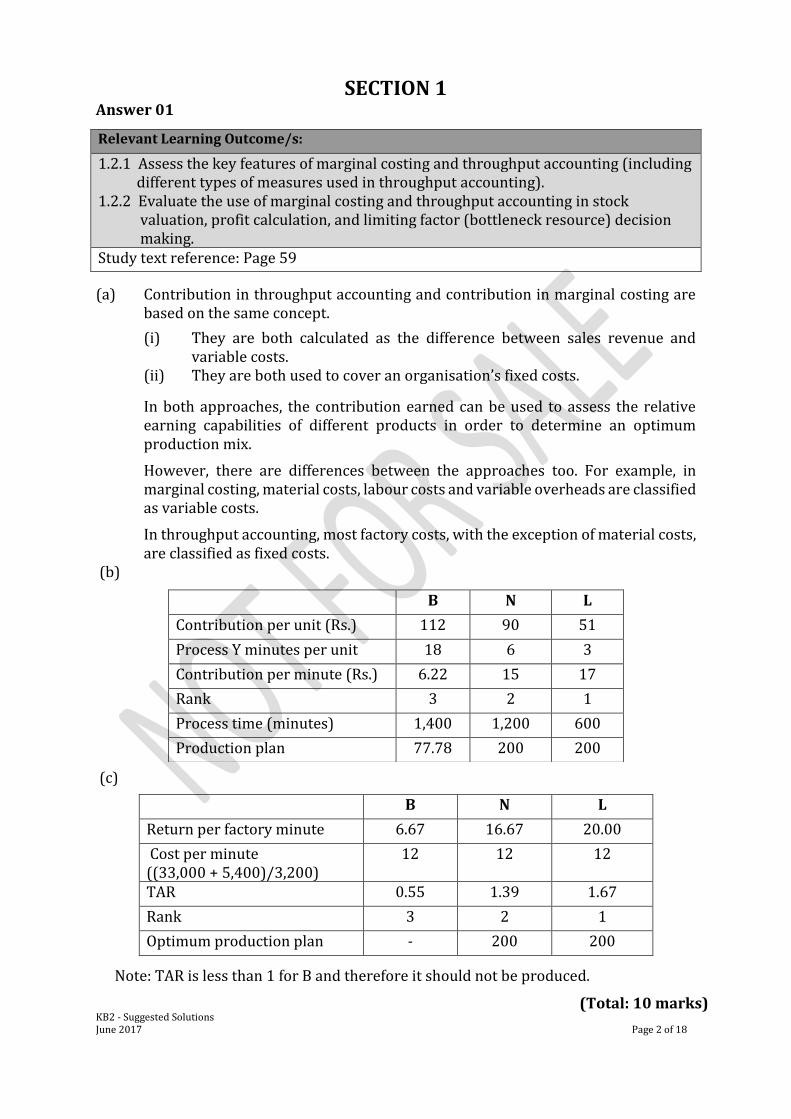
(a) Contribution in throughput accounting and contribution in marginal costing are based on the same concept.
(i) They are both calculated as the difference between sales revenue and variable costs.
(ii) They are both used to cover an organisation’s fixed costs.
In both approaches, the contribution earned can be used to assess the relative earning capabilities of different products in order to determine an optimum production mix.
However, there are differences between the approaches too. For example, in marginal costing, material costs, labour costs and variable overheads are classified as variable costs.
In throughput accounting, most factory costs, with the exception of material costs, are classified as fixed costs.
(b)
(c)
Note: TAR is less than 1 for B and therefore it should not be produced.
Relevant Learning Outcome/s:
1.2.1 Assess the key features of marginal costing and throughput accounting (including different types of measures used in throughput accounting). 1.2.2 Evaluate the use of marginal costing and throughput accounting in stock valuation, profit calculation, and limiting factor (bottleneck resource) decision making. Study text reference: Page 59
B N L
Contribution per unit (Rs.) 112 90 51
Process Y minutes per unit 18 6 3
Contribution per minute (Rs.) 6.22 15 17
Rank 3 2 1
Process time (minutes) 1,400 1,200 600
Production plan 77.78 200 200
B N L
Return per factory minute 6.67 16.67 20.00
Cost per minute ((33,000 + 5,400)/3,200)
12 12 12
TAR 0.55 1.39 1.67
Rank 3 2 1
Optimum production plan - 200 200
(Total: 10 marks)
KB2 - Suggested Solutions June 2017 Page 3 of 18
Answer 02
(a) (i)
Cost savings from waste minimisation through recycling and energy saving measures.
Companies with poor environmental performance may face an increased cost of capital because investors and lenders demand a higher risk premium.
Pressure group campaigns could cause damage to the reputation and/or additional costs. This can hamper demand and thereby affect revenue generation.
Present tendency of customers is towards environmental friendly products and manufacturing systems.
Compliance in environmental regulations will save environmental costs and secure the continuation of operations.
(ii)
Material cost itself is an environmental cost. Wastage of material is included in the material cost.
Cost of effluent treatment or waste incineration. Labour cost in relation to wastage management etc. Cost and penalties of non-compliance with environmental regulations. Cost of compliance with environmental regulations. Research and development costs related to environmental issues. Consumption of energy.
(b) The two main objectives of working capital management are:
To ensure that the company has sufficient liquid resources to carry out day to day operations (adequate resources to function and grow).
To improve profitability by keeping investment in working capital to the minimum required.
Sometimes these two objectives conflict with one other. For instance, if the company has a conservative approach to working capital management, they would have ample liquidity. This would in turn reduce profits as excessive funds are tied up in working capital and the company will miss out on profitable opportunities. These two objectives will often conflict as liquid assets give the lowest returns.
(Total: 10 marks)
Relevant Learning Outcome/s:
1.3.3 Assess environmental accounting (including its importance, types of costs and techniques available 5.1.1 Define the term “working capital management”. Study text reference: Pages 117-119, 601-602
KB2 - Suggested Solutions June 2017 Page 4 of 18
Answer 03
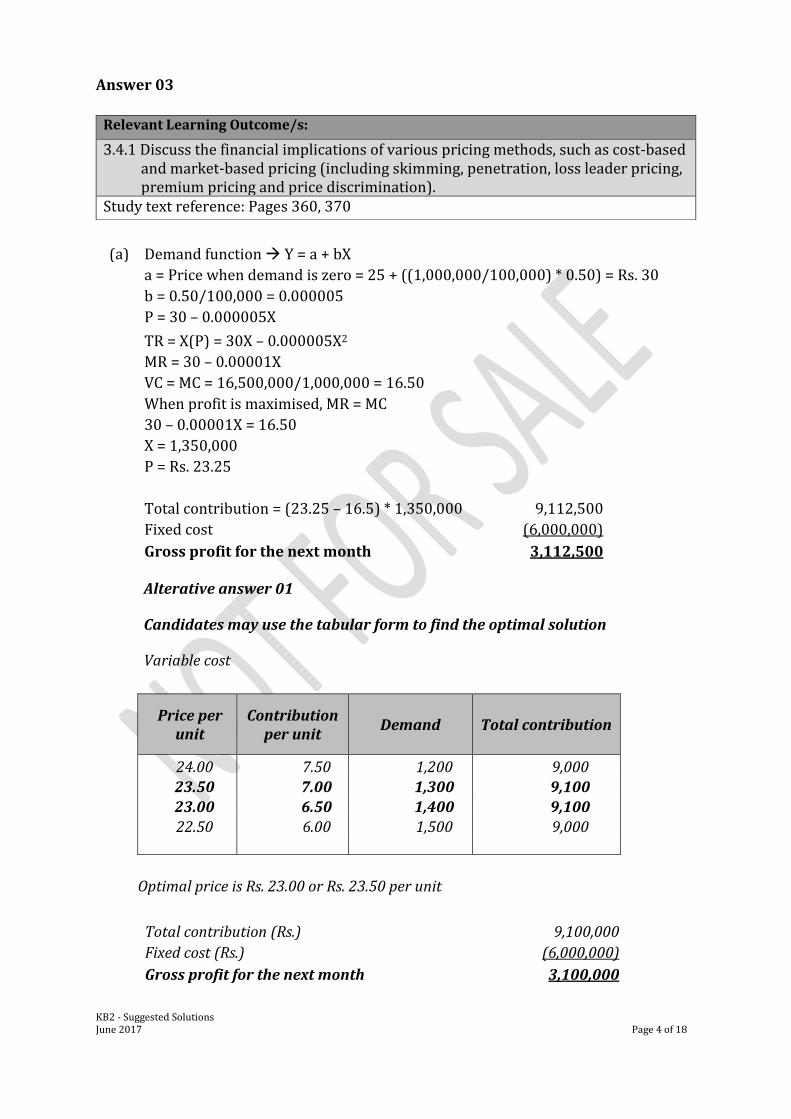
(a) Demand function Y = a + bX
a = Price when demand is zero = 25 + ((1,000,000/100,000) * 0.50) = Rs. 30
b = 0.50/100,000 = 0.000005
P = 30 – 0.000005X
TR = X(P) = 30X – 0.000005X2
MR = 30 – 0.00001X
VC = MC = 16,500,000/1,000,000 = 16.50
When profit is maximised, MR = MC
30 – 0.00001X = 16.50
X = 1,350,000
P = Rs. 23.25
Total contribution = (23.25 – 16.5) * 1,350,000 9,112,500
Fixed cost (6,000,000)
Gross profit for the next month 3,112,500 Alterative answer 01
Candidates may use the tabular form to find the optimal solution
Variable cost
Price per unit
Contribution per unit
Demand Total contribution
24.00 7.50 1,200 9,000 23.50 7.00 1,300 9,100 23.00 6.50 1,400 9,100 22.50 6.00 1,500 9,000
Optimal price is Rs. 23.00 or Rs. 23.50 per unit
Total contribution (Rs.) 9,100,000
Fixed cost (Rs.) (6,000,000)
Gross profit for the next month 3,100,000
Relevant Learning Outcome/s:
3.4.1 Discuss the financial implications of various pricing methods, such as cost-based and market-based pricing (including skimming, penetration, loss leader pricing, premium pricing and price discrimination).
Study text reference: Pages 360, 370
KB2 - Suggested Solutions June 2017 Page 5 of 18
Alternate answer 02
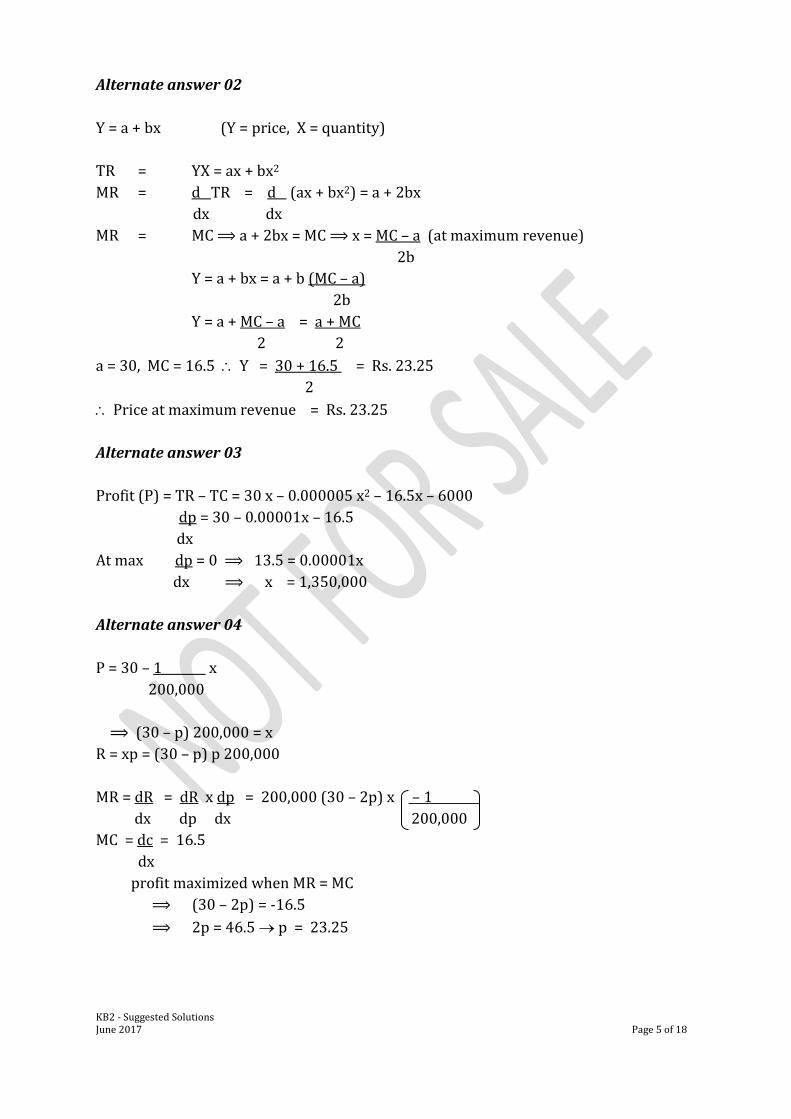
Y = a + bx (Y = price, X = quantity)
TR = YX = ax + bx2
MR = d TR = d (ax + bx2) = a + 2bx
dx dx
MR = MC ⟹ a + 2bx = MC ⟹ x = MC – a (at maximum revenue)
2b
Y = a + bx = a + b (MC – a)
2b
Y = a + MC – a = a + MC
2 2
a = 30, MC = 16.5 Y = 30 + 16.5 = Rs. 23.25
2
Price at maximum revenue = Rs. 23.25
Alternate answer 03
Profit (P) = TR – TC = 30 x – 0.000005 x2 – 16.5x – 6000
dp = 30 – 0.00001x – 16.5
dx
At max dp = 0 ⟹ 13.5 = 0.00001x
dx ⟹ x = 1,350,000
Alternate answer 04
P = 30 – 1 x
200,000
⟹ (30 – p) 200,000 = x
R = xp = (30 – p) p 200,000
MR = dR = dR x dp = 200,000 (30 – 2p) x – 1
dx dp dx 200,000
MC = dc = 16.5
dx
profit maximized when MR = MC
⟹ (30 – 2p) = -16.5
⟹ 2p = 46.5 p = 23.25
KB2 - Suggested Solutions June 2017 Page 6 of 18
(b) A market skimming pricing strategy sets a higher unit price at inception in order to generate profit as quick as possible, and then reduces the price when competitors gradually come into the market offering similar products. The company can gain advantages from this strategy if the product is highly innovative and unique where consumers are willing to pay a premium price for the product. However, this strategy may not be appropriate for OGP since there are so many existing suppliers in the market with similar products and the product is not highly technical. Further, the skimming approach would require the product to have a relatively inelastic demand where the decrease in demand is proportionately lower than the increase in price. Therefore the competitive marketplace does not appear to support the skimming strategy.
(Total: 10 marks) Answer 04
(a) Revenue centres: Usually have authority over sales only, and have very little control over costs. To evaluate a revenue centre’s performance, only look at its revenues and ignore its costs and other factors.
Revenue centres have some drawbacks. Their evaluations are based entirely on sales, so revenue centres have no reason to control costs. This kind of free rein encourages the managers to hire extra employees or find other costly ways to increase sales (e.g. giving away salty treats to increase drink purchases).
Cost centres: Usually produce goods or provide services to other parts of the company. Because they only make goods or services, they have no control over sales prices and therefore they can be evaluated only based on their total costs.
One way for a cost centre to reduce costs is by buying inferior materials, but doing so hurts the quality of finished goods. When dealing with cost centres, you must carefully monitor the quality of goods.
Profit centres: They are businesses within a larger business, such as the individual stores that make up a mall, whose managers enjoy control over their own revenues and expenses. They often select the merchandise to buy and sell, and they have the power to set their own prices.
Relevant Learning Outcome/s:
4.1.1 Discuss decentralisation and different types of responsibility centres (revenue, cost, profit and investment centres) Study text reference: Pages 555-559, 213
KB2 - Suggested Solutions June 2017 Page 7 of 18
Profit centers are evaluated based on the controllable margin: the difference between controllable revenues and controllable costs. All non-controllable costs, such as allocated overhead or other indirect fixed costs are excluded from the evaluation. The great thing about running a profit center is that doing so gives managers an incentive to do exactly what the company wants earn profits. However, classifying responsibility centres as profit centres has disadvantages too. Although they get evaluated based on revenues and expenses, no one pays attention to the use of their assets. This gives managers an incentive to use excessive assets to boost profits. Investment centres: Feature everything. Managers of investment centres have authority over and are held responsible for revenues, expenses and investments made in their centres. Return on investment (ROI) is often used to evaluate their performance. To improve the return on investment, managers can either increase the controllable margin (profits) or decrease average operating assets (improve productivity).
Using return on investment to evaluate investment centres addresses many of the drawbacks involved in evaluating revenue centres, costs centres, and profit centres. However, classification as an investment centre can encourage managers to emphasise productivity over profitability – work harder to reduce assets (which increases ROI) rather than to increase overall profitability.
Alternative answer
Cost centre Cost centre manager is responsible for and has control over controllable costs
incurred in the cost centre. Uncontrollable costs such as H/O allocated cost depreciation interest etc. do not
come under controllable costs. Hence the cost centre manager is not responsible for these.
Examples of a cost centre – maintenance dept., manufacturing dept. Manager of a cost centre is not responsible for revenue, assets and liabilities. Performance can be measured through budgets, efficiency measures and variance
analysis. Revenue centre Manager is responsible only for raising revenue and has no responsibility for
forecasting or controlling costs. E.g. Sales centre of a branded product.
Fund raising centre of a charity.
Performance can be controlled through revenue targets
KB2 - Suggested Solutions June 2017 Page 8 of 18
Profit centre Accountable for both costs and revenue. To establish a profit centre it is required to
identify units of the organisation to which both revenue and costs can be separately attributed
Revenue may arise from both external and internal sales at a transfer price Controllable profit can be used for performance evaluation Investment centre This is a profit centre with the additional responsibility of capital investment.
Accordingly, it is accountable for controllable profit and controllable capital employed
Assessment of the results of a SBU as profit alone is inadequate and it has to be related to capital invested (ROCE, ROI, residual income etc.)
Subsidiary of a conglomerate is an investment centre. Manager has the authority to decide price, volume of sales, volume of product costs
incurred, capital assets to be purchased, and the working capital requirement. In evaluating performance, the head office non-current assets apportioned to the
centre are to be reported separately since they are not directly attributable to the investment centre.
(b) Controllability principle
The controllability principle states that it is appropriate to evaluate the performance of a responsibility centre only based on measurable targets significantly influenced by the manager of that responsibility centre.
The controllability principle can be implemented by either eliminating the uncontrollable items from the areas that the managers are held accountable for or by calculating their effects so that the reports distinguish between controllable and uncontrollable items.
(Total: 10 marks)
KB2 - Suggested Solutions June 2017 Page 9 of 18
Answer 05
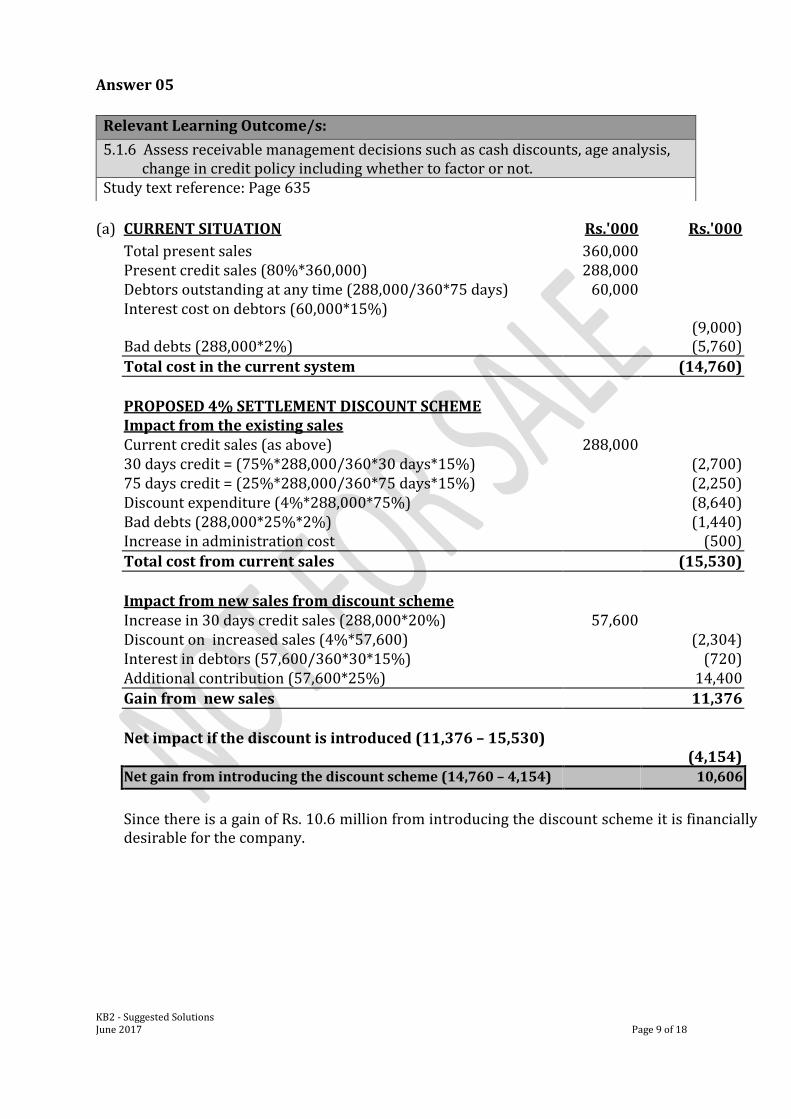
(a) CURRENT SITUATION Rs.'000 Rs.'000
Total present sales 360,000 Present credit sales (80%*360,000) 288,000 Debtors outstanding at any time (288,000/360*75 days) 60,000 Interest cost on debtors (60,000*15%)
(9,000)
Bad debts (288,000*2%) (5,760)
Total cost in the current system (14,760)
PROPOSED 4% SETTLEMENT DISCOUNT SCHEME Impact from the existing sales Current credit sales (as above) 288,000 30 days credit = (75%*288,000/360*30 days*15%) (2,700) 75 days credit = (25%*288,000/360*75 days*15%) (2,250) Discount expenditure (4%*288,000*75%) (8,640) Bad debts (288,000*25%*2%) (1,440) Increase in administration cost (500)
Total cost from current sales (15,530)
Impact from new sales from discount scheme Increase in 30 days credit sales (288,000*20%) 57,600 Discount on increased sales (4%*57,600) (2,304) Interest in debtors (57,600/360*30*15%) (720) Additional contribution (57,600*25%) 14,400
Gain from new sales 11,376
Net impact if the discount is introduced (11,376 – 15,530)
(4,154)
Net gain from introducing the discount scheme (14,760 – 4,154) 10,606
Since there is a gain of Rs. 10.6 million from introducing the discount scheme it is financially
desirable for the company.
Relevant Learning Outcome/s:
5.1.6 Assess receivable management decisions such as cash discounts, age analysis, change in credit policy including whether to factor or not. Study text reference: Page 635
KB2 - Suggested Solutions June 2017 Page 10 of 18
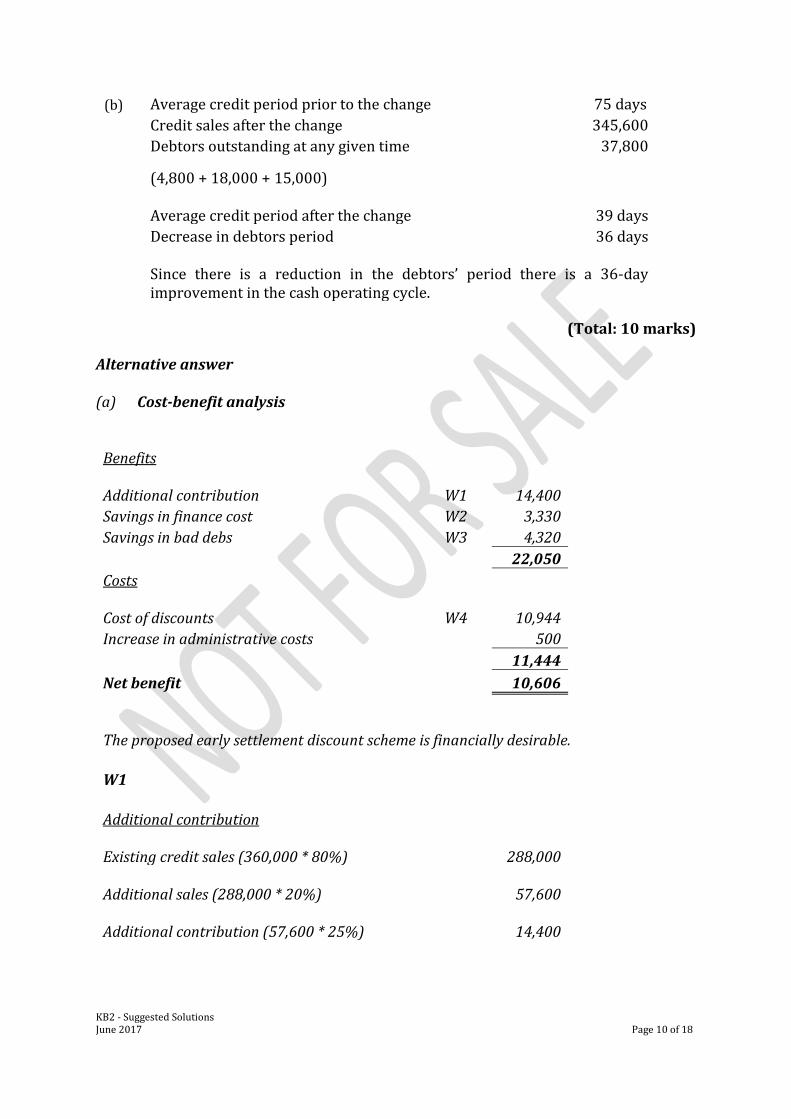
(b) Average credit period prior to the change 75 days
Credit sales after the change 345,600
Debtors outstanding at any given time 37,800
(4,800 + 18,000 + 15,000)
Average credit period after the change 39 days
Decrease in debtors period 36 days
Since there is a reduction in the debtors’ period there is a 36-day improvement in the cash operating cycle.
(Total: 10 marks) Alternative answer (a) Cost-benefit analysis
Benefits
Additional contribution W1
14,400 Savings in finance cost W2 3,330 Savings in bad debs W3 4,320
22,050 Costs
Cost of discounts W4
10,944 Increase in administrative costs 500
11,444
Net benefit 10,606
The proposed early settlement discount scheme is financially desirable.
W1 Additional contribution
Existing credit sales (360,000 * 80%)
288,000
Additional sales (288,000 * 20%)
57,600
Additional contribution (57,600 * 25%)
14,400
KB2 - Suggested Solutions June 2017 Page 11 of 18
W2
Savings in finance costs Trade receivables Before early settlement discount scheme (288,000 * 75/360) 60,000
After early settlement discount scheme
75% of the existing credit sales (288,000 * 75%) 216,000
100% of new credit sales 57,600
(As above) 273,600
Trade receivables on that (273,600 * 30/360) 22,800 Trade receivables on remaining 25% of the existing credit sales (288,000 * 25 * 75/360) 15,000
37,800
Decrease in trade receivables (60,000 – 37,800) 22,200
Finance cost savings (22,200 * 15%) 3,330
W3 Savings in bad debts Bad debts before early settlement discount scheme (288,000 * 2%)
5,760
Bad debts after early settlement discount scheme (288,000 * 25% * 2%)
1,440
Benefit 4,320
W4 Cost of discounts Revenue subject to early settlement discount scheme
273,600
((288,000 * 75%) + 57,600)
Discount @ 4% (273,600 * 4%) 10,944
(b) Trade receivable collection period before early settlement discount scheme 75 days
(360/(Credit sales/Trade receivables))
(360/(288,000/60,000)) Trade receivable collection period after early settlement discount scheme 39 days
(360/((288,000 + 57,600)/37,800))
Reduction in trade receivable collection period 36 days
Therefore reduction in cash operating cycle 36 days
KB2 - Suggested Solutions June 2017 Page 12 of 18
Answer 06
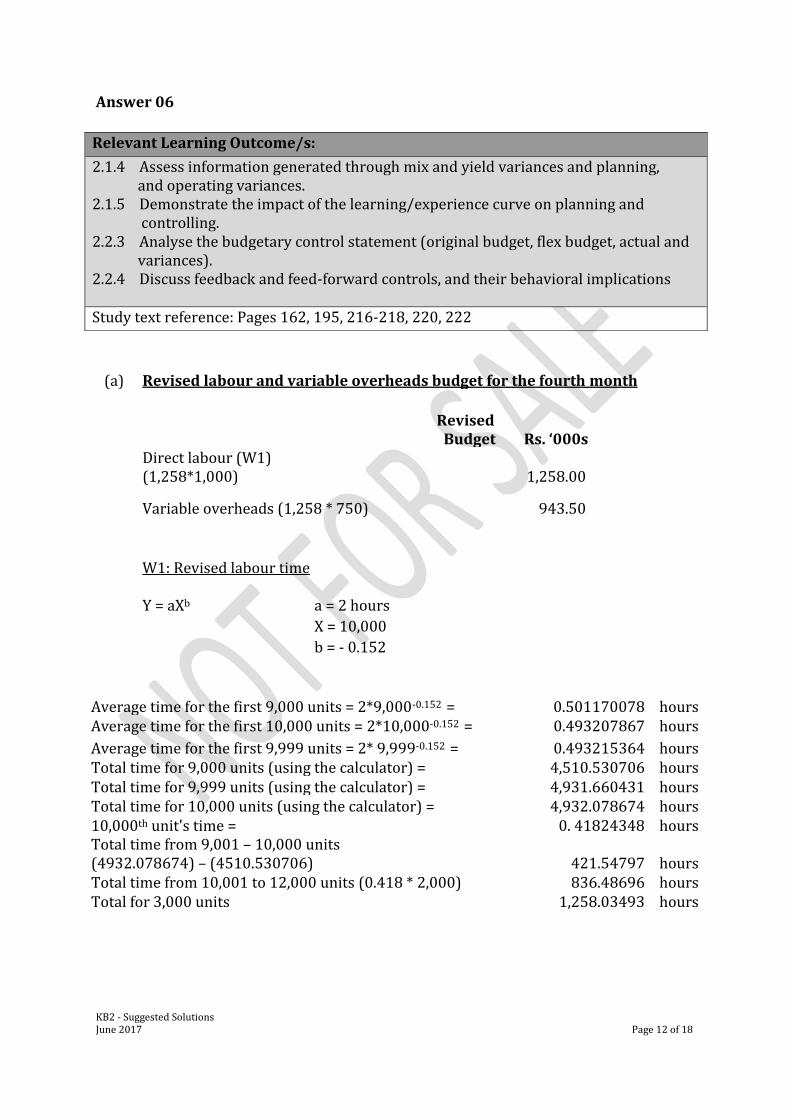
(a) Revised labour and variable overheads budget for the fourth month
Revised Budget Rs. ‘000s
Direct labour (W1) (1,258*1,000)
1,258.00
Variable overheads (1,258 * 750) 943.50
W1: Revised labour time
Y = aXb a = 2 hours
X = 10,000
b = - 0.152
Average time for the first 9,000 units = 2*9,000-0.152 = 0.501170078 hours Average time for the first 10,000 units = 2*10,000-0.152 = 0.493207867 hours
Average time for the first 9,999 units = 2* 9,999-0.152 = 0.493215364 hours Total time for 9,000 units (using the calculator) = 4,510.530706 hours Total time for 9,999 units (using the calculator) = 4,931.660431 hours Total time for 10,000 units (using the calculator) = 4,932.078674 hours 10,000th unit's time = 0. 41824348 hours Total time from 9,001 – 10,000 units (4932.078674) – (4510.530706) 421.54797 hours Total time from 10,001 to 12,000 units (0.418 * 2,000) 836.48696 hours Total for 3,000 units 1,258.03493 hours
Relevant Learning Outcome/s:
2.1.4 Assess information generated through mix and yield variances and planning, and operating variances. 2.1.5 Demonstrate the impact of the learning/experience curve on planning and controlling. 2.2.3 Analyse the budgetary control statement (original budget, flex budget, actual and variances). 2.2.4 Discuss feedback and feed-forward controls, and their behavioral implications Study text reference: Pages 162, 195, 216-218, 220, 222
KB2 - Suggested Solutions June 2017 Page 13 of 18
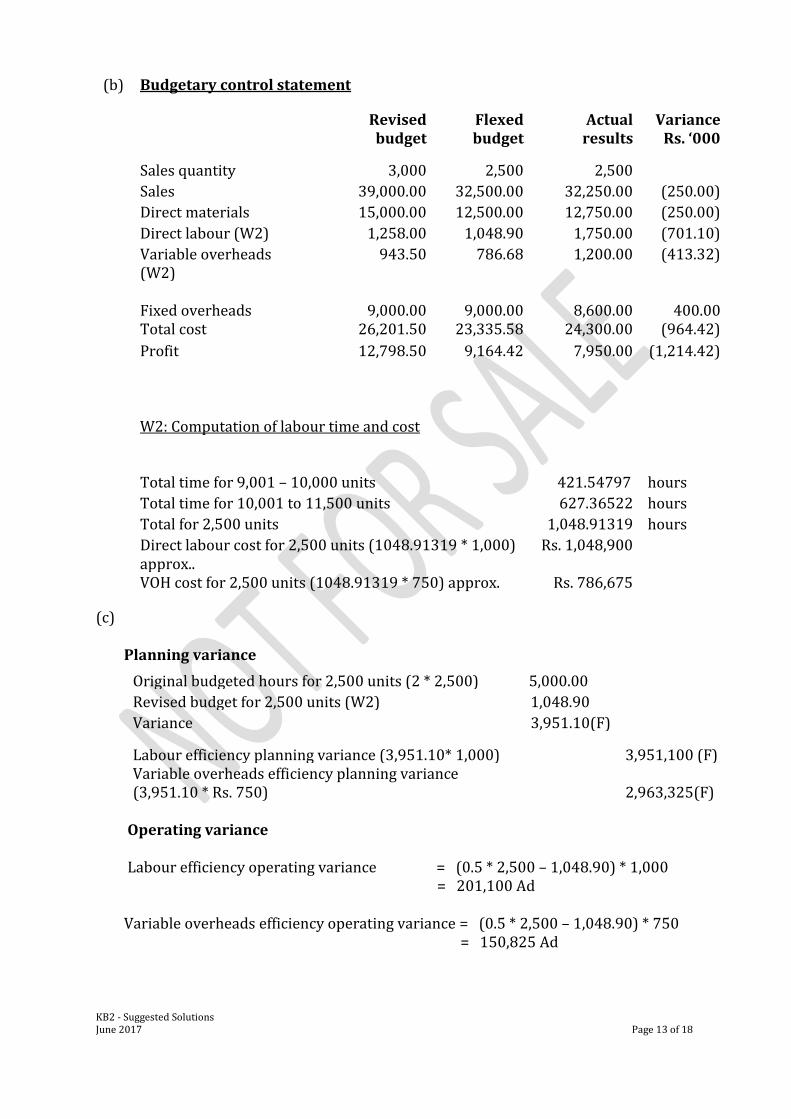
(b) Budgetary control statement
Revised budget
Flexed budget
Actual results
Variance Rs. ‘000
Sales quantity
3,000 2,500 2,500
Sales
39,000.00 32,500.00 32,250.00 (250.00)
Direct materials
15,000.00 12,500.00 12,750.00 (250.00)
Direct labour (W2)
1,258.00 1,048.90 1,750.00 (701.10)
Variable overheads (W2)
943.50 786.68 1,200.00 (413.32)
Fixed overheads
9,000.00
9,000.00
8,600.00
400.00
Total cost
26,201.50 23,335.58 24,300.00 (964.42)
Profit
12,798.50 9,164.42 7,950.00 (1,214.42)
W2: Computation of labour time and cost
Total time for 9,001 – 10,000 units
421.54797 hours Total time for 10,001 to 11,500 units
627.36522 hours
Total for 2,500 units
1,048.91319 hours
Direct labour cost for 2,500 units (1048.91319 * 1,000) approx..
Rs. 1,048,900
VOH cost for 2,500 units (1048.91319 * 750) approx. Rs. 786,675
(c) Planning variance
Operating variance Labour efficiency operating variance = (0.5 * 2,500 – 1,048.90) * 1,000 = 201,100 Ad Variable overheads efficiency operating variance = (0.5 * 2,500 – 1,048.90) * 750 = 150,825 Ad
Original budgeted hours for 2,500 units (2 * 2,500) 5,000.00
Revised budget for 2,500 units (W2) 1,048.90
Variance 3,951.10(F)
Labour efficiency planning variance (3,951.10* 1,000) 3,951,100 (F) Variable overheads efficiency planning variance (3,951.10 * Rs. 750) 2,963,325(F)
KB2 - Suggested Solutions June 2017 Page 14 of 18
(d) Feedback control compares actual results with those budgeted.
Like what is done by WPL, the actual results are compared with the budgeted, and both negative and positive variances are identified. Where there is a material difference between the actual and expected positions, the variance is investigated and corrective measures are taken. By doing so WPL tries to get the actual results in line with those budgeted. Therefore the feedback control is reactionary and based on historical data. Feed-forward control is the forecasting of differences between actual and planned outcomes, and the implementation of action, before the event, to avoid such differences. Feedback is backward looking and correcting the activities that sometimes will not be appropriate to the current and future conditions. Feed-forward control uses the latest forecast of results to compare to an expected position in the future. In feed-forward control, costs are constantly controlled and monitored. This expectation is usually generated by using the information that was not available at the time the original plan was set. This differs from feedback control because the latest forecast is an estimation of the future results and its aim is to proactively anticipate any issues.
(Total: 25 marks)
KB2 - Suggested Solutions June 2017 Page 15 of 18
Answer 07
(a) (i) Probability of winning WYE having won EXE at normal price = 48%/60% = 80% (ii) Probability of losing WYE having won EXE at normal price = 1 – 80% = 20% (iii) Probability of winning WYE having won EXE at reduced price = 48%/80% = 60% (iv) Probability of losing WYE having won EXE at reduced price = 1 – 60% = 40%
Relevant Learning Outcome/s:
3.8.2 Demonstrate how a decision would be made under conditions of uncertainty, using:
- Decision tree-based expected value calculations - Data tables - Alternative decision criterions (minimax, maximax and minimax regret)
Study text reference: Page 533
KB2 - Suggested Solutions June 2017 Page 16 of 18
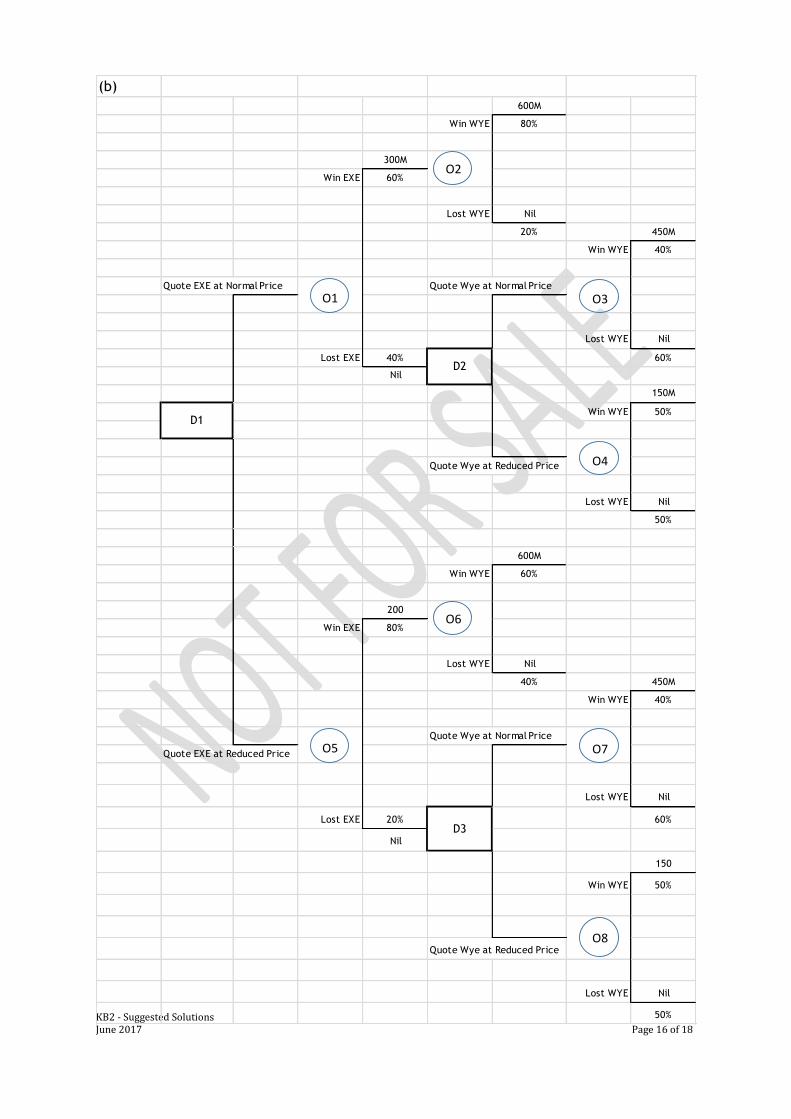
(b)
600M
Win WYE 80%
300M
Win EXE 60%
Lost WYE Nil
20% 450M
Win WYE 40%
Quote EXE at Normal Price Quote Wye at Normal Price
Lost WYE Nil
Lost EXE 40% 60%
Nil
150M
Win WYE 50%
Quote Wye at Reduced Price
Lost WYE Nil
50%
600M
Win WYE 60%
200
Win EXE 80%
Lost WYE Nil
40% 450M
Win WYE 40%
Quote Wye at Normal Price
Quote EXE at Reduced Price
Lost WYE Nil
Lost EXE 20% 60%
Nil
150
Win WYE 50%
Quote Wye at Reduced Price
Lost WYE Nil
50%
D3
D2
D1
O1
O2
O3
O4
O5
O6
O7
O8
KB2 - Suggested Solutions June 2017 Page 17 of 18
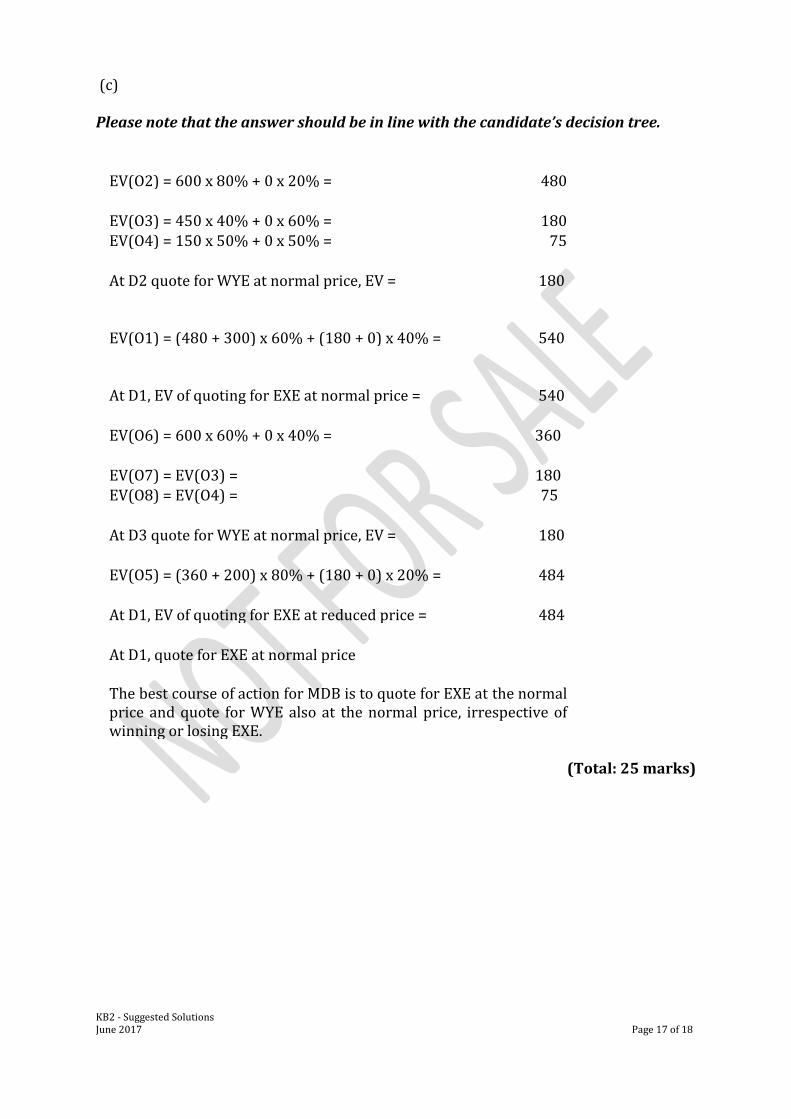
(c) Please note that the answer should be in line with the candidate’s decision tree.
EV(O2) = 600 x 80% + 0 x 20% = 480
EV(O3) = 450 x 40% + 0 x 60% = 180 EV(O4) = 150 x 50% + 0 x 50% = 75
At D2 quote for WYE at normal price, EV = 180
EV(O1) = (480 + 300) x 60% + (180 + 0) x 40% =
540
At D1, EV of quoting for EXE at normal price =
540
EV(O6) = 600 x 60% + 0 x 40% = 360
EV(O7) = EV(O3) = 180 EV(O8) = EV(O4) = 75
At D3 quote for WYE at normal price, EV = 180
EV(O5) = (360 + 200) x 80% + (180 + 0) x 20% = 484
At D1, EV of quoting for EXE at reduced price = 484
At D1, quote for EXE at normal price
The best course of action for MDB is to quote for EXE at the normal price and quote for WYE also at the normal price, irrespective of winning or losing EXE.
(Total: 25 marks)
KB2 - Suggested Solutions June 2017 Page 18 of 18
Notice of Disclaimer
The answers given are entirely by the Institute of Chartered Accountants of Sri Lanka (CA Sri Lanka)
and you accept the answers on an "as is" basis.
They are not intended as “Model answers’, but rather as suggested solutions.
The answers have two fundamental purposes, namely:
1. to provide a detailed example of a suggested solution to an examination question; and
2. to assist students with their research into the subject and to further their understanding and
appreciation of the subject.
The Institute of Chartered Accountants of Sri Lanka (CA Sri Lanka) makes no warranties with respect
to the suggested solutions and as such there should be no reason for you to bring any grievance against
the Institute of Chartered Accountants of Sri Lanka (CA Sri Lanka). However, if you do bring any
action, claim, suit, threat or demand against the Institute of Chartered Accountants of Sri Lanka (CA
Sri Lanka), and you do not substantially prevail, you shall pay the Institute of Chartered Accountants
of Sri Lanka's (CA Sri Lanka’s) entire legal fees and costs attached to such action. In the same token,
if the Institute of Chartered Accountants of Sri Lanka (CA Sri Lanka) is forced to take legal action to
enforce this right or any of its rights described herein or under the laws of Sri Lanka, you will pay the
Institute of Chartered Accountants of Sri Lanka (CA Sri Lanka) legal fees and costs.
© 2013 by the Institute of Chartered Accountants of Sri Lanka (CA Sri Lanka).
All rights reserved. No part of this document may be reproduced or transmitted in any form or by any
means, electronic, mechanical, photocopying, recording, or otherwise, without prior written permission
of the Institute of Chartered Accountants of Sri Lanka (CA Sri Lanka).
KB 2 – Business Management Accounting: Business Level Examination June 2017
![3.4.1. QLM [20] Extension activities in the neighborhood ...miraj-mahavidyalaya.org/Criterion3/3.4.1.pdf5. Participation of girl students in ‘Nirbhaya Abhiyan’(Beti Bachao-Beti](https://img.pdfslide.us/doc/110x75/5f53b8d10d7a9b017432bcbc/341-qlm-20-extension-activities-in-the-neighborhood-miraj-5-participation.jpg)