Embed Size (px)
Citation preview
Sudden-Onset Hazards and the Risk of Future Displacement in Fiji
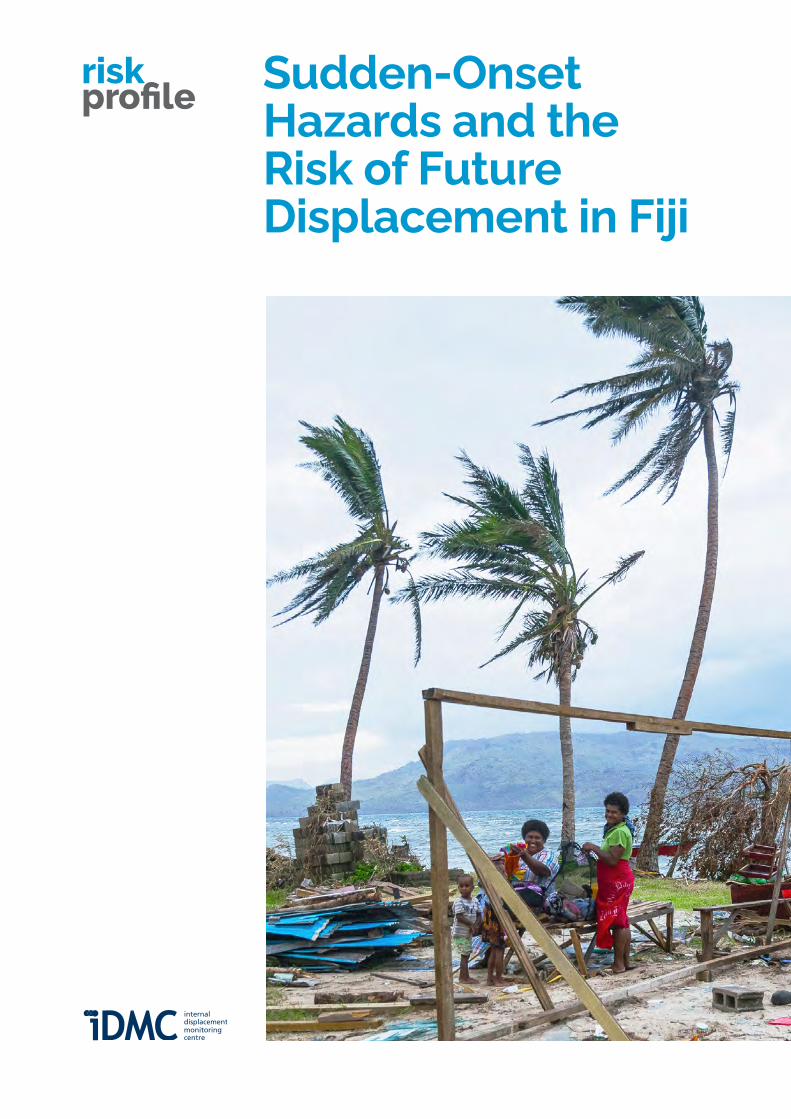
Cyclone Evan, Fiji. Many houses were flattened when Cyclone Evan tore across Fiji causing widespread damage. Photo Rowena Harbridge/AusAID. © Benoit Matsha-Carpentier / IFRC
Cover image: Women gather in front of a house destroyed by Cyclone Winston in a village of Ra Province, Fiji. © 2016 Vlad Sokhin
Table of Contents
Summary 4
Social and demographic context 6
Disaster displacement in Fiji: historical trends (2008-2019) 8
Displacement risk: two key metrics and how to read them 11
Disaster displacement risk in Fiji 11
Probable Maximum Displacement (PMD) by hazard 12
Average Annual Displacement (AAD) per hazard and multi-hazards 12
Results - Displacement risk by hazard 13
Risk of displacement as a result of storm surges 14
Risk of displacement as a result of cyclonic winds 15
Risk of displacement as a result of earthquakes 16
Risk of displacement as a result of tsunamis 17
Towards risk-informed decision-making in Fiji 18
Why do we need to understand risks? 20
Methodological considerations and caveats 21
IDMC’s Global Disaster Displacement Risk Model 21
Caveats and future improvements 23
Endnotes 26
4Sudden-Onset Hazards and the Risk of Future Displacement in Fiji
Summary
Disaster displacement is one of the world's biggest
humanitarian and sustainable development challenges,
and climate change and urbanisation are expected to
aggravate the phenomenon.
IDMC has used its global internal displacement data-
base to look at future displacement risk associated with
sudden-onset hazards such as earthquakes, tsunamis,
cyclonic winds and storm surges. The analysis consid-
ered a wide range of possible hazard scenarios, their
likelihood and their potential to cause housing damage,
which served as a proxy for displacement.
This technical paper represents initial results assessing
the risk of disaster displacement in Fiji. It acknowledg-
es that displacement associated with climate change
and disasters in the country happens to communities,
households and individuals and response is not state-
led. It also recognises that while displacement based on
Fiji's Displacement Guidelines is distinct from planned
relocation and evacuation, there are clear indicators that
the group of people affected by both processes intersect.
This baseline country risk profile provides initial results
of hazard, risk and uncertainties for these sudden onset
hazards via two metrics at the national level:
• Probable Maximum Displacement (PMD) is the
maximum displacement expected within a given
time period. It answers the question: What is the
maximum expected displacement within a time
range of X years? It represents the outlier event
that could occur during that time frame.
• Average Annual Displacement (AAD) represents
the annualized accumulated effect of all the cata-
logue events. It is a compact metric which accounts
for the probable displacement of small to medium
and extreme events.
Fiji’s displacement risk, for example, is highest with
storm surges. There is a 56 per cent probability that in
the next 20 years about 35,000 people will be displaced
as a result of storm surges in the archipelago.
About 5,800 people on average are likely to be displaced
during any given year in the country by sudden-onset
hazards, such as earthquakes, tsunamis, cyclonic winds
and storm surges. This is the Annual Average Displace-
ment metric.
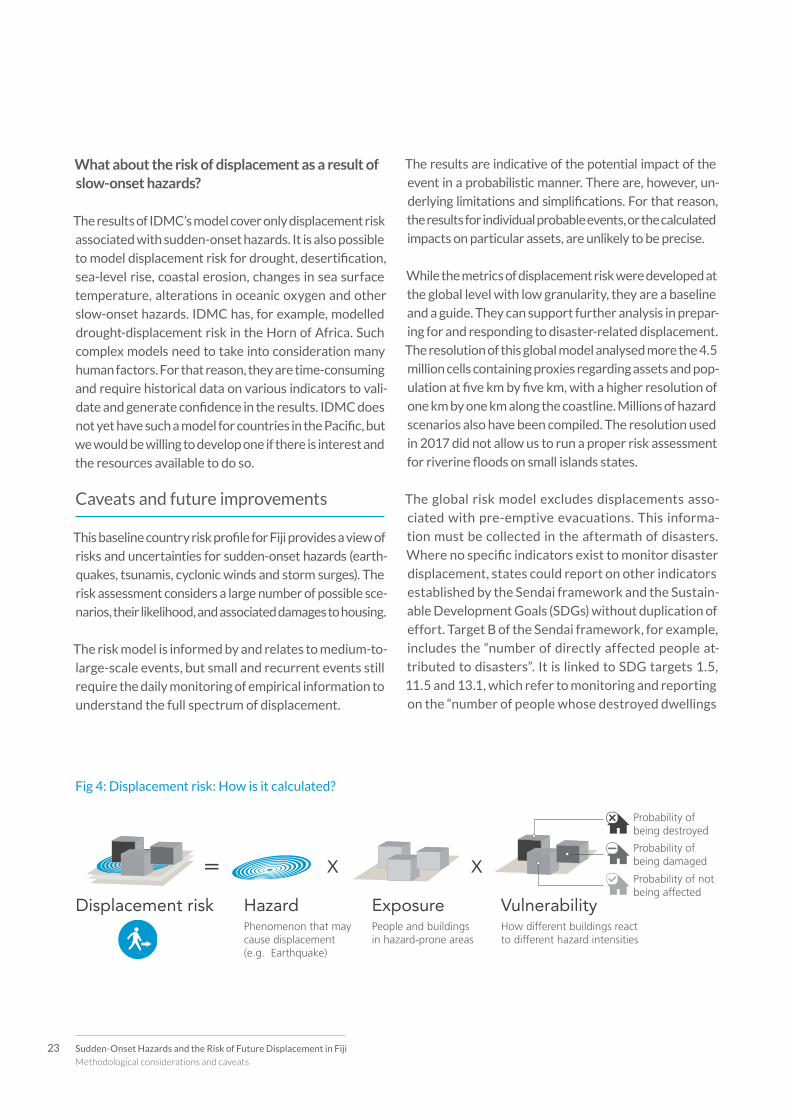
Displacement risk is based on the well-known equation
of risk, using 3 components:
1. Hazard: this component assesses the likelihood of
different hazards, as well as their intensity
2. Exposure: the number of people and assets exposed
to hazards
3. Vulnerability: assesses the likelihood of collapse
and structural damage to exposed buildings. Vulner-
ability should not be considered from an economic
and social point of view. This model uses only the
physical aspect of vulnerability and how assets
react to different hazard intensities that render
them uninhabitable.
Summary
5 Sudden-Onset Hazards and the Risk of Future Displacement in Fiji
Summary
IDMC’s Global Displacement Risk Model presents results at
a national level to provide insight into future displacement
situations, allowing decision-makers to make risk-informed
decisions that can help prevent and reduce the risk of disas-
ter displacement before it happens.
Disaster displacement is one of the world's biggest
humanitarian and sustainable development challeng-
es. Climate change and urbanisation are expected to
compound the issue.
The inhabitants of developing island states in the Pacific
are among the most vulnerable populations. At least
50,000 Pacific Islanders are at risk of being displaced
each year. In these countries, where almost all major
services, human settlements and tourism infrastructure
are located in coastal areas, sudden-onset hazards such
as cyclones, sea-level rise and coastal flooding pose
severe social and economic risks.
This baseline report is a first attempt to take stock of the
risk of future displacement associated with sudden-on-
set events. It is divided into four main parts:
1. Background on Fiji
2. A baseline risk of displacement in the country
3. Towards risk-informed decision-making in Fiji and
4. A last section on how IDMC’s Global Disaster Dis-
placement Risk Model was constructed, as well as
caveats and future improvements
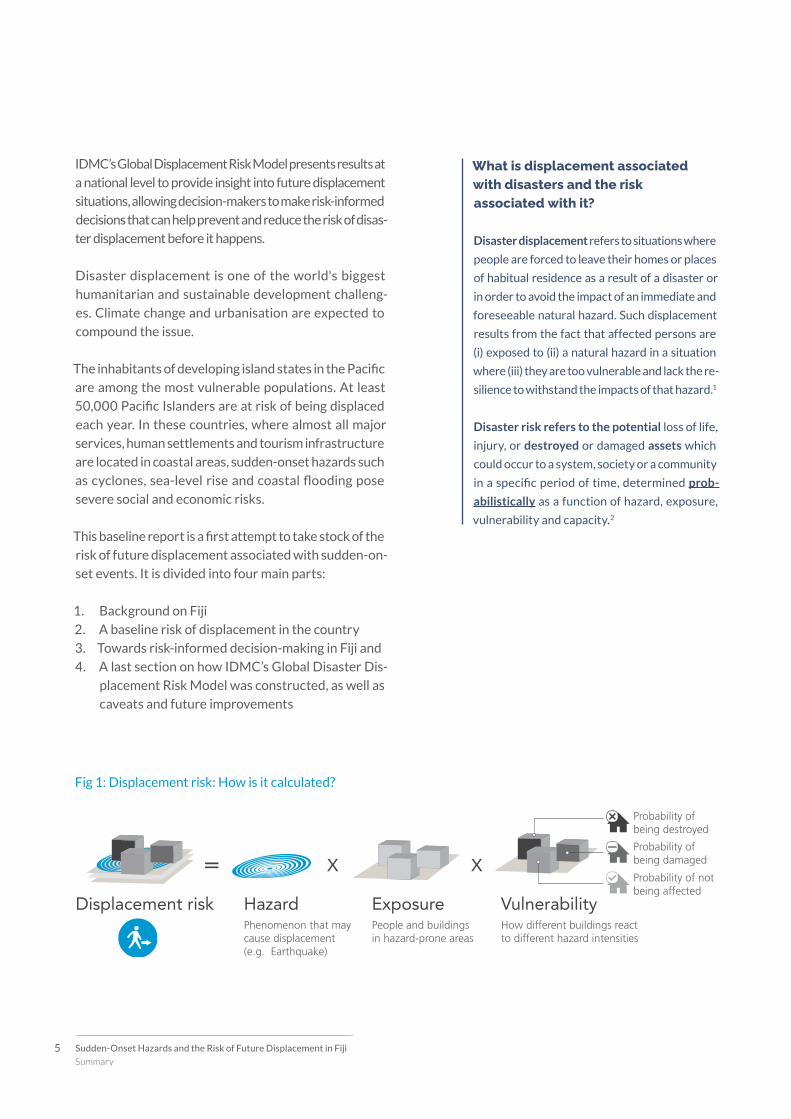
Fig 1: Displacement risk: How is it calculated?
What is displacement associated with disasters and the risk associated with it?
Disaster displacement refers to situations where
people are forced to leave their homes or places
of habitual residence as a result of a disaster or
in order to avoid the impact of an immediate and
foreseeable natural hazard. Such displacement
results from the fact that affected persons are
(i) exposed to (ii) a natural hazard in a situation
where (iii) they are too vulnerable and lack the re-
silience to withstand the impacts of that hazard.1
Disaster risk refers to the potential loss of life,
injury, or destroyed or damaged assets which
could occur to a system, society or a community
in a specific period of time, determined prob-
abilistically as a function of hazard, exposure,
vulnerability and capacity.2
Displacement risk Hazard Exposure Vulnerability
= X X
Phenomenon that maycause displacement(e.g. Earthquake)
People and buildingsin hazard-prone areas
How different buildings reactto different hazard intensities
Probability ofbeing destroyed
Probability ofbeing damaged
Probability of notbeing affected
6Sudden-Onset Hazards and the Risk of Future Displacement in Fiji
Social and demographic context
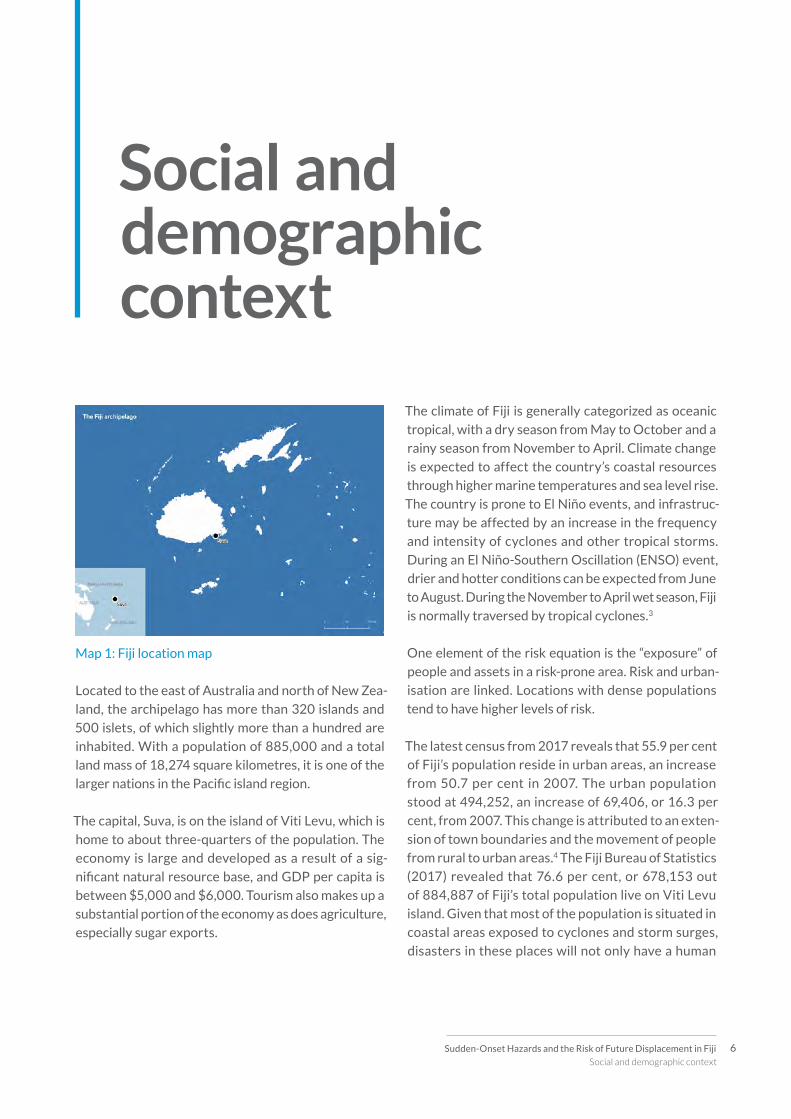
Map 1: Fiji location map
Located to the east of Australia and north of New Zea-
land, the archipelago has more than 320 islands and
500 islets, of which slightly more than a hundred are
inhabited. With a population of 885,000 and a total
land mass of 18,274 square kilometres, it is one of the
larger nations in the Pacific island region.
The capital, Suva, is on the island of Viti Levu, which is
home to about three-quarters of the population. The
economy is large and developed as a result of a sig-
nificant natural resource base, and GDP per capita is
between $5,000 and $6,000. Tourism also makes up a
substantial portion of the economy as does agriculture,
especially sugar exports.
The climate of Fiji is generally categorized as oceanic
tropical, with a dry season from May to October and a
rainy season from November to April. Climate change
is expected to affect the country’s coastal resources
through higher marine temperatures and sea level rise.
The country is prone to El Niño events, and infrastruc-
ture may be affected by an increase in the frequency
and intensity of cyclones and other tropical storms.
During an El Niño-Southern Oscillation (ENSO) event,
drier and hotter conditions can be expected from June
to August. During the November to April wet season, Fiji
is normally traversed by tropical cyclones.3
One element of the risk equation is the “exposure” of
people and assets in a risk-prone area. Risk and urban-
isation are linked. Locations with dense populations
tend to have higher levels of risk.
The latest census from 2017 reveals that 55.9 per cent
of Fiji’s population reside in urban areas, an increase
from 50.7 per cent in 2007. The urban population
stood at 494,252, an increase of 69,406, or 16.3 per
cent, from 2007. This change is attributed to an exten-
sion of town boundaries and the movement of people
from rural to urban areas.4 The Fiji Bureau of Statistics
(2017) revealed that 76.6 per cent, or 678,153 out
of 884,887 of Fiji’s total population live on Viti Levu
island. Given that most of the population is situated in
coastal areas exposed to cyclones and storm surges,
disasters in these places will not only have a human
Social and demographic context
7 Sudden-Onset Hazards and the Risk of Future Displacement in Fiji
Social and demographic context
impact, but also an economic one. Fishery resources
are critically important in the Pacific Islands region
as a source of food and employment, a generator of
government revenue and a foundation for economic
development.5 More than 90 per cent of the popula-
tion, both rural and urban, live in coastal areas where
the vast majority of services, infrastructure and agri-
cultural production are located.
In many Small Island Developing States (SIDS), exposure
to hazards is driven by the growing concentration of
people and assets in low-lying coastal areas and the
marginalisation of the urban poor in risk-prone areas.
This also means disasters affect more urban dwellers
with increasingly harmful consequences for employ-
ment, housing and critical infrastructure, such as roads,
and power and water supplies.6
Many Pacific cities have expanded in recent years,
including informal settlements on riverbanks and
estuaries, and in peri-urban areas, waste disposal
sites and mangrove swamps. This has increased the
exposure and vulnerability of populations and assets
to hazards, driving up the risk and potential impacts
of displacement.7
Fiji experienced many disasters during the current and
previous century. At least 225 people died in 1931 as
a result of a hurricane and flood, the largest loss of life
from a disaster in Fiji's history.8
Eleven tsunamis have been recorded in Fiji, of which
three were generated within Fiji's waters. The most
damaging one occurred in 1953, claiming five lives in
Suva and Kadavu and flooding parts of Suva City. The
waves reached estimated heights of about two meters
in Suva and about five meters at Nakasaleka in Kadavu.9
Box 1: Government initiatives
Fiji has identified 800 vulnerable communities
with over 40 sites identified to be relocated
because of climate-related disasters.10 Some of
these communities have already been relocated,
including Vunidogoloa in Vanualevu and Na-
rikoso in Kadavu. The government launched its
Planned Relocation Guideline in 2014 to respond
effectively to the relocation needs of communi-
ties affected by climate change and disasters. It
enacted Act 21 in 2019, establishing the Climate
Relocation and Displaced Peoples Trust Fund
for Communities and Infrastructure to assist
communities with relocation. Fiji's guidelines
on displacement were also launched that year
to reduce the vulnerabilities associated with
displacement and consider durable solutions
to prevent and reduce displacement's drivers in
affected communities. The guidelines recognise
that addressing displacement is not primarily a
process led by the state, while providing guid-
ance for non-state actors to address it in various
stages. Through its National Climate Change
policy, its implementation of its National Devel-
opment Plan (NDP), its National Disaster Risk
Reduction Policy and its National Humanitarian
Policy for Disaster Risk Management, Fiji aligns
itself with the fundamental principle of humanity
and free movement of people, both of which are
non-political in nature. The guaranteed civil,
political, social, economic and cultural rights
enshrined in the country's constitution apply to
persons who are resettled, including the rights
of judicial redress.
8Sudden-Onset Hazards and the Risk of Future Displacement in Fiji
Social and demographic context
Disaster displacement in Fiji: historical trends (2008-2019)
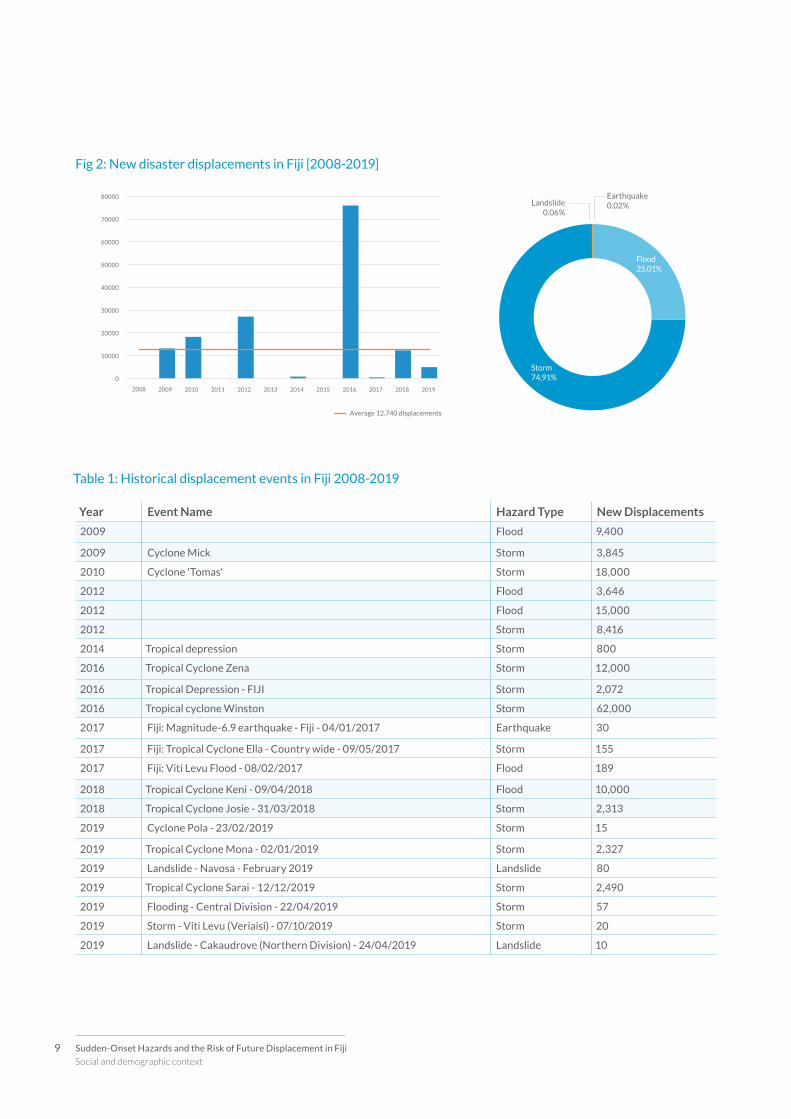
Disasters have triggered about 153,000 displacements
in Fiji since IDMC began collecting data on the phe-
nomenon in 2008. IDMC has detected 30 disaster
displacement events related to weather, such as storms
and floods.
The data on new displacements presented in table
1 corresponds to the estimated number of internal
displacement movements that have taken place as the
result of an event. Summed up by years or decades,
the numbers could include individuals who have been
displaced more than once. In this sense, the number of
new displacements is not equal to the number of people
displaced during a year.
A large number of displacements in Fiji have been
triggered by weather-related events. Storms, especially
cyclones, are the main triggers of displacement. Tropical
Cyclone Winston, the most powerful cyclone to strike
Fiji in recent times, led to widespread destruction after
striking on 20 and 21 February 2016. It generated 40
per cent of the displacement recorded during the de-
cade in Fiji and was the strongest recorded cyclone in
the southern hemisphere with estimated wind speeds
of up to 295km/h. Forty-four people were killed, and
350,000 people were affected. Thirty-two thousand
houses were destroyed or damaged.11
Tropical depressions have generated widespread
flooding. Torrential rains in 2012 caused by multiple
tropical depressions resulted in severe damage to
schools, homes, businesses, agriculture and infra-
structure, especially in the Western Division. Flash
floods, also common, pose a serious threat. Floods
and landslides in recent years have claimed lives,
damaged property and infrastructure, affected busi-
nesses and livelihoods, and erased decades of devel-
opment. Parts of the Nadi area were under water in
February 2017 as continuous, heavy rains triggered
flash floods.12
Box 2: Local definitions
The following definitions are from the national
relocation and displacement guidelines:
Relocation refers to the voluntary, planned and
coordinated movement of climate-displaced per-
sons within states to suitable locations, away from
risk-prone areas, where they can enjoy the full spec-
trum of rights including housing, land and property
rights and all other livelihood and related rights.
It includes: displacement, evacuation (emergency
relocation) and planned relocation.
Displacement is the movement of persons who
have been forced or obliged to flee or to leave
their homes or places of habitual residence, in
particular as a result of or in order to avoid the
effects of armed conflict, situations of generalised
violence, violations of human rights or natural or
human-made disasters.
Evacuation refers to the rapid physical movement
of people away from the immediate threat or impact
of a hazard to a safer place. The purpose is to move
people as rapidly as possible to a place of safety
and shelter. It is commonly characterised by a short
timeframe (from hours to weeks) within which
emergency procedures need to be enacted to save
lives and minimize exposure to harm. Evacuations
may be mandatory, advisory or spontaneous.
Planned Relocation is understood as a solution
measure, involving the state, in which a commu-
nity (as distinct from an individual/ household) is
physically moved to another location and resettled
permanently there.
9 Sudden-Onset Hazards and the Risk of Future Displacement in Fiji
Social and demographic context
Year Event Name Hazard Type New Displacements
2009 Flood 9,400
2009 Cyclone Mick Storm 3,845
2010 Cyclone 'Tomas' Storm 18,000
2012 Flood 3,646
2012 Flood 15,000
2012 Storm 8,416
2014 Tropical depression Storm 800
2016 Tropical Cyclone Zena Storm 12,000
2016 Tropical Depression - FIJI Storm 2,072
2016 Tropical cyclone Winston Storm 62,000
2017 Fiji: Magnitude-6.9 earthquake - Fiji - 04/01/2017 Earthquake 30
2017 Fiji: Tropical Cyclone Ella - Country wide - 09/05/2017 Storm 155
2017 Fiji: Viti Levu Flood - 08/02/2017 Flood 189
2018 Tropical Cyclone Keni - 09/04/2018 Flood 10,000
2018 Tropical Cyclone Josie - 31/03/2018 Storm 2,313
2019 Cyclone Pola - 23/02/2019 Storm 15
2019 Tropical Cyclone Mona - 02/01/2019 Storm 2,327
2019 Landslide - Navosa - February 2019 Landslide 80
2019 Tropical Cyclone Sarai - 12/12/2019 Storm 2,490
2019 Flooding - Central Division - 22/04/2019 Storm 57
2019 Storm - Viti Levu (Veriaisi) - 07/10/2019 Storm 20
2019 Landslide - Cakaudrove (Northern Division) - 24/04/2019 Landslide 10
Fig 2: New disaster displacements in Fiji [2008-2019]
Table 1: Historical displacement events in Fiji 2008-2019
10Sudden-Onset Hazards and the Risk of Future Displacement in Fiji
Social and demographic context
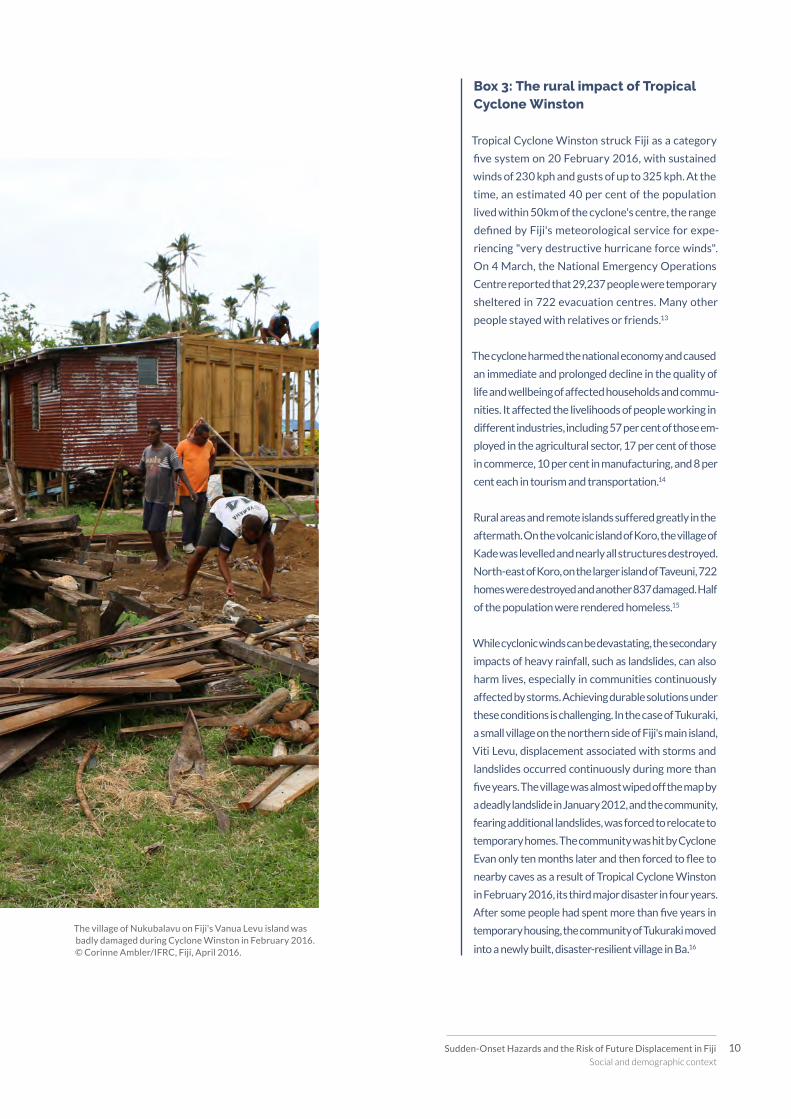
The village of Nukubalavu on Fiji's Vanua Levu island was badly damaged during Cyclone Winston in February 2016. © Corinne Ambler/IFRC, Fiji, April 2016.
Box 3: The rural impact of Tropical Cyclone Winston
Tropical Cyclone Winston struck Fiji as a category
five system on 20 February 2016, with sustained
winds of 230 kph and gusts of up to 325 kph. At the
time, an estimated 40 per cent of the population
lived within 50km of the cyclone's centre, the range
defined by Fiji's meteorological service for expe-
riencing "very destructive hurricane force winds".
On 4 March, the National Emergency Operations
Centre reported that 29,237 people were temporary
sheltered in 722 evacuation centres. Many other
people stayed with relatives or friends.13
The cyclone harmed the national economy and caused
an immediate and prolonged decline in the quality of
life and wellbeing of affected households and commu-
nities. It affected the livelihoods of people working in
different industries, including 57 per cent of those em-
ployed in the agricultural sector, 17 per cent of those
in commerce, 10 per cent in manufacturing, and 8 per
cent each in tourism and transportation.14
Rural areas and remote islands suffered greatly in the
aftermath. On the volcanic island of Koro, the village of
Kade was levelled and nearly all structures destroyed.
North-east of Koro, on the larger island of Taveuni, 722
homes were destroyed and another 837 damaged. Half
of the population were rendered homeless.15
While cyclonic winds can be devastating, the secondary
impacts of heavy rainfall, such as landslides, can also
harm lives, especially in communities continuously
affected by storms. Achieving durable solutions under
these conditions is challenging. In the case of Tukuraki,
a small village on the northern side of Fiji's main island,
Viti Levu, displacement associated with storms and
landslides occurred continuously during more than
five years. The village was almost wiped off the map by
a deadly landslide in January 2012, and the community,
fearing additional landslides, was forced to relocate to
temporary homes. The community was hit by Cyclone
Evan only ten months later and then forced to flee to
nearby caves as a result of Tropical Cyclone Winston
in February 2016, its third major disaster in four years.
After some people had spent more than five years in
temporary housing, the community of Tukuraki moved
into a newly built, disaster-resilient village in Ba.16
11 Sudden-Onset Hazards and the Risk of Future Displacement in Fiji
Disaster displacement risk in Fiji
The baseline based on our global model presents results
at a national level and aims to provide insight into future
displacement situations. This analysis of future displace-
ment risk associated with sudden- onset hazards, includ-
ing earthquakes, tsunamis, cyclonic winds and storm
surges, considers a large number of possible hazard
scenarios, their likelihood, and the potential damages
to housing, which is used as a proxy for displacement.
Displacement risk: two key metrics and how to read them
Our “multi-hazard” Global Disaster Displacement Risk
Model provides two metrics at the national level: the
Average Annual Displacement (AAD) by hazard and
the Probable Maximum Displacement (PMD) by haz-
ard. These metrics are based on a displacement risk
model developed at the global level, so the granularity
of the data is low and estimates should be considered
Disaster displacement risk in Fiji
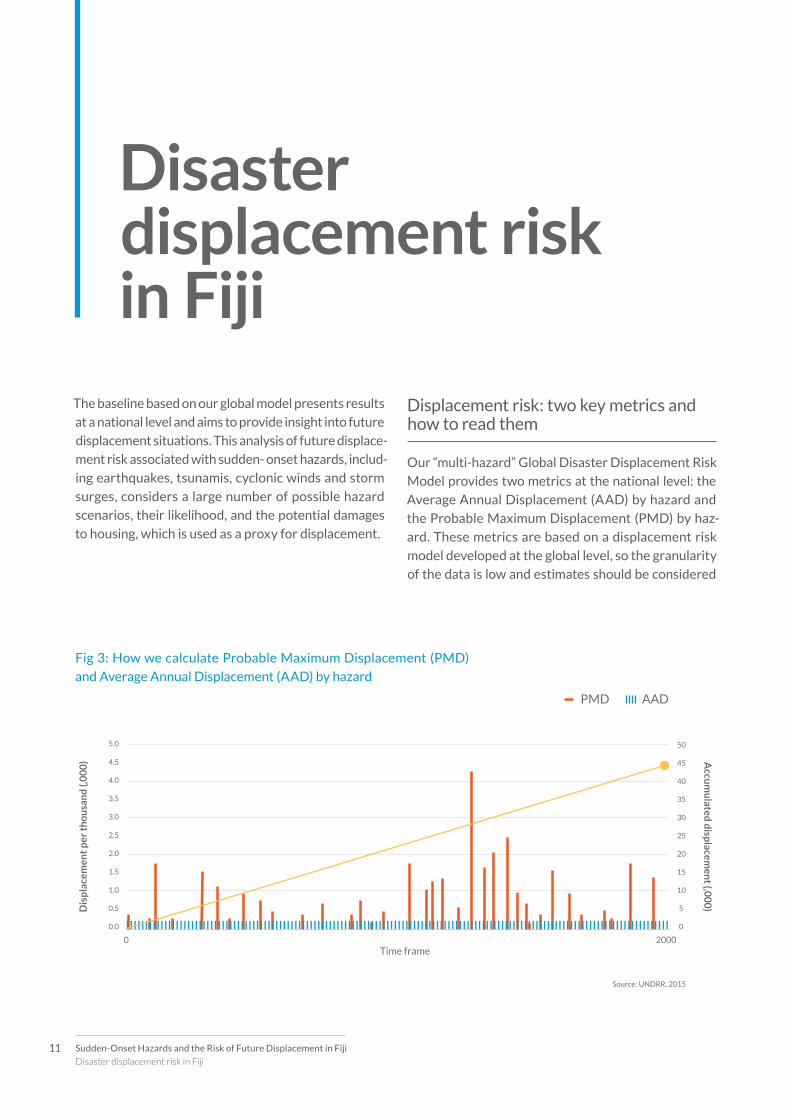
Fig 3: How we calculate Probable Maximum Displacement (PMD)
and Average Annual Displacement (AAD) by hazard
12Sudden-Onset Hazards and the Risk of Future Displacement in Fiji
Disaster displacement risk in Fiji
as conservative. The model considers the likelihood of
different hazards, as well as their intensity, to estimate
the number of people that could be forced to flee from
their habitual place of residence as a result of severe
damage or destruction that could render housing unin-
habitable. Many factors could also influence the severity
and duration of displacement: insurance penetration
and coverage, coping capacity, recovery and humani-
tarian response.
Probable Maximum Displacement (PMD) by hazard
Probable Maximum Displacement (PMD) is the maxi-
mum displacement expected within a given time period.
It answers the question: What is the maximum expected
displacement within a range of X years? It represents
the outlier event that could occur during a specific time
frame. The PMD can be used, for example, to determine
the assets or the size of shelters that should be made
available by governments to cope with the magnitude
of potential displacement.
“A hundred years does not mean it will occur every 100
years.” (see Table 2). The Probable Maximum Displace-
ment (PMD) for different return periods can therefore
be expressed as the probability of a given displacement
amount being exceeded over different periods of time.
Even in the case of a thousand-year return period, there
is still a five per cent probability of a PMD being exceed-
ed over a 50-year time frame. This metric is relevant, for
example, to the planners and designers of infrastructure
projects as investments may be made for an expected
lifespan of 50 years.
Average Annual Displacement (AAD) per hazard and multi-hazards
AAD is the “magnitude” of future displacement by haz-
ard types that a country can experience. It is not the
number of displacements that the country will struggle
with each year. Rather, these numbers represent the
Box 4: Risk return period, the concept
The concept of return period is often misunder-
stood. If a “displacement” has a 500-year return
period, this does not mean that the “displacement”
will occur only every 500 years, nor does it mean
that if the “displacement” occurred today, it would
not recur for another 500 years. Rather, it means
that the loss happens once every 500 years on
average. For example, if there are four extreme
events in the space of a century followed by 19
centuries without such extreme events, the return
period would still be 500 years.17 A longer return
period (for example, 100 vs. 20 years) suggests a
lower probability that an extreme hazard will occur
in any single year.
The most common misconception is that a 100-
year flood will only occur once per century. That
is not true. There is a small probability that such
an intense event could happen every year. If a
100-year flood happened last year, it can happen
again before the next century, or even this year. It is
also possible for such an event to not occur within
a 100-year period.
Houston, Texas in the US, for example, has ex-
perienced 500-year floods three years in a row,
including one caused by Hurricane Harvey. This
has prompted a revision of the city’s zoning
regulations to account for changes in the flood
drainage basins around it.
We expect to see many similar revisions as cli-
mate change alters the frequency and intensity
of extreme events, and the rapid sprawl of cities
shrinks the natural areas available to absorb
floodwater.18
13 Sudden-Onset Hazards and the Risk of Future Displacement in Fiji
Disaster displacement risk in Fiji
number of people expected to be displaced per year
considering all the events that could occur over a long
timeframe in the area being assessed. The AAD is a
compact metric with a low sensitivity to uncertainty.
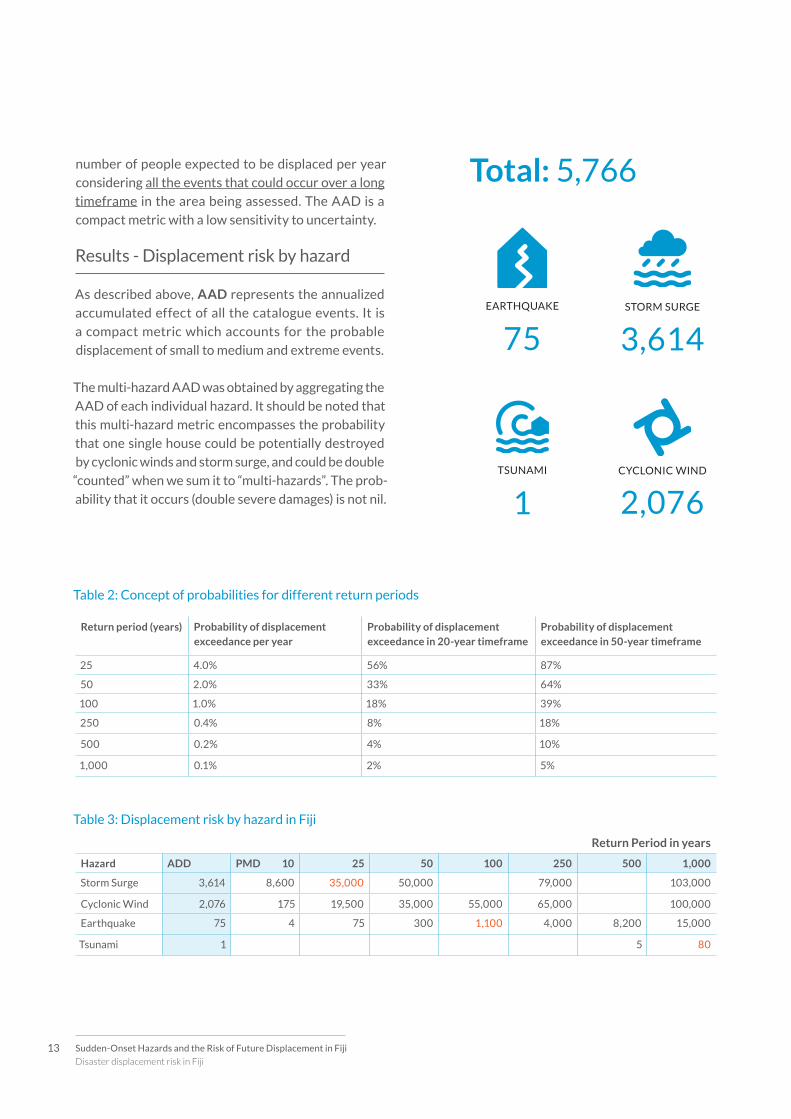
Results - Displacement risk by hazard
As described above, AAD represents the annualized
accumulated effect of all the catalogue events. It is
a compact metric which accounts for the probable
displacement of small to medium and extreme events.
The multi-hazard AAD was obtained by aggregating the
AAD of each individual hazard. It should be noted that
this multi-hazard metric encompasses the probability
that one single house could be potentially destroyed
by cyclonic winds and storm surge, and could be double
“counted” when we sum it to “multi-hazards”. The prob-
ability that it occurs (double severe damages) is not nil.
Return period (years) Probability of displacement exceedance per year
Probability of displacement exceedance in 20-year timeframe
Probability of displacement exceedance in 50-year timeframe
25 4.0% 56% 87%
50 2.0% 33% 64%
100 1.0% 18% 39%
250 0.4% 8% 18%
500 0.2% 4% 10%
1,000 0.1% 2% 5%
Table 2: Concept of probabilities for different return periods
Return Period in years
Hazard ADD PMD 10 25 50 100 250 500 1,000
Storm Surge 3,614 8,600 35,000 50,000 79,000 103,000
Cyclonic Wind 2,076 175 19,500 35,000 55,000 65,000 100,000
Earthquake 75 4 75 300 1,100 4,000 8,200 15,000
Tsunami 1 5 80
Table 3: Displacement risk by hazard in Fiji
14Sudden-Onset Hazards and the Risk of Future Displacement in Fiji
Disaster displacement risk in Fiji
Our Global Disaster Displacement Risk Model highlights
that around 5,800 people could be displaced in Fiji in
any given year of the future. This is the Average Annual
Displacement (AAD) - (see Table 3).
While the AAD metric is useful for providing a sense of the
scale of the annual risk of displacement, it tends to hide
potential outliers. High intensity but low frequency events
could take place in extremely long spans of time, leading to
mass displacement. A category 5 cyclone or a 6.5-magnitude
earthquake, for instance, could strike Fiji unexpectedly and
cause significant displacement. While such extreme events
may not have occurred since record keeping began, they
can still take place, and it is important that the country be
prepared for them. Cyclones Winston and Pam are exam-
ples of disaster at an unprecedented level.
The model for Fiji considers the likelihood of different haz-
ards, as well as their maximum intensity at different return
periods (see table 3 – in red. The estimate of risk displace-
ment is explained in each hazard section, above). This na-
tional level resolution is based on the observations and data
at the global level. It provides multi-hazard risk metrics and
enables comparisons of risk levels between countries and
regions across hazards types. At this scale, the estimates
should therefore be considered conservative.
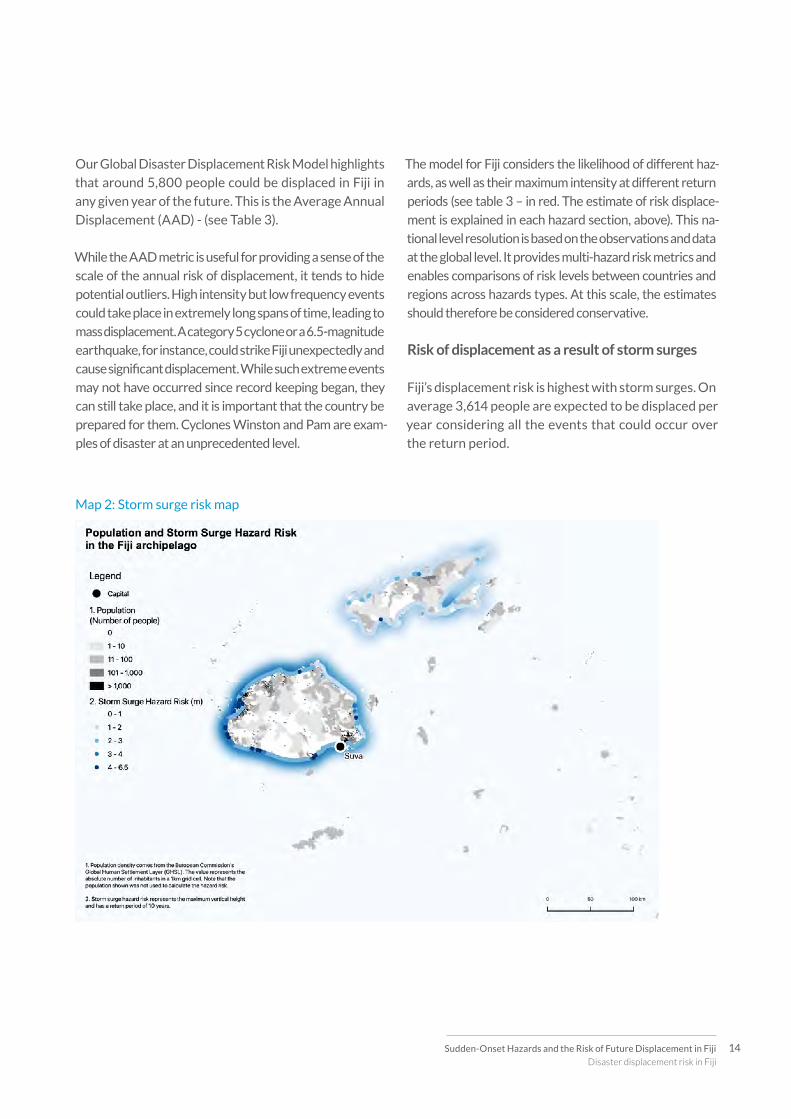
Risk of displacement as a result of storm surges
Fiji’s displacement risk is highest with storm surges. On
average 3,614 people are expected to be displaced per
year considering all the events that could occur over
the return period.
Map 2: Storm surge risk map
15 Sudden-Onset Hazards and the Risk of Future Displacement in Fiji
Disaster displacement risk in Fiji
Regarding the maximum probable displacement, there
is a 56 per cent probability that in the next 20 years
about 35,000 people will be displaced because of storm
surges in the archipelago. As a cyclone moves across the
Pacific ocean, its winds push the water into a wall as the
storm moves onshore. The impacts will depend on the
coast's topography and the tides. The risk of displace-
ment enters uncharted territory even with king tides,
which occur when extreme weather events coincide
with uncommonly high tides caused by the alignment
of solar and lunar gravitational pulls.19
Storm surge risk in Fiji is high around the main island
of Viti Levu. That is especially true on the west coast
around Nadi Bay where there is a 33 per cent probability
that in the next 20 years the area may experience storm
surges of between three and four meters.
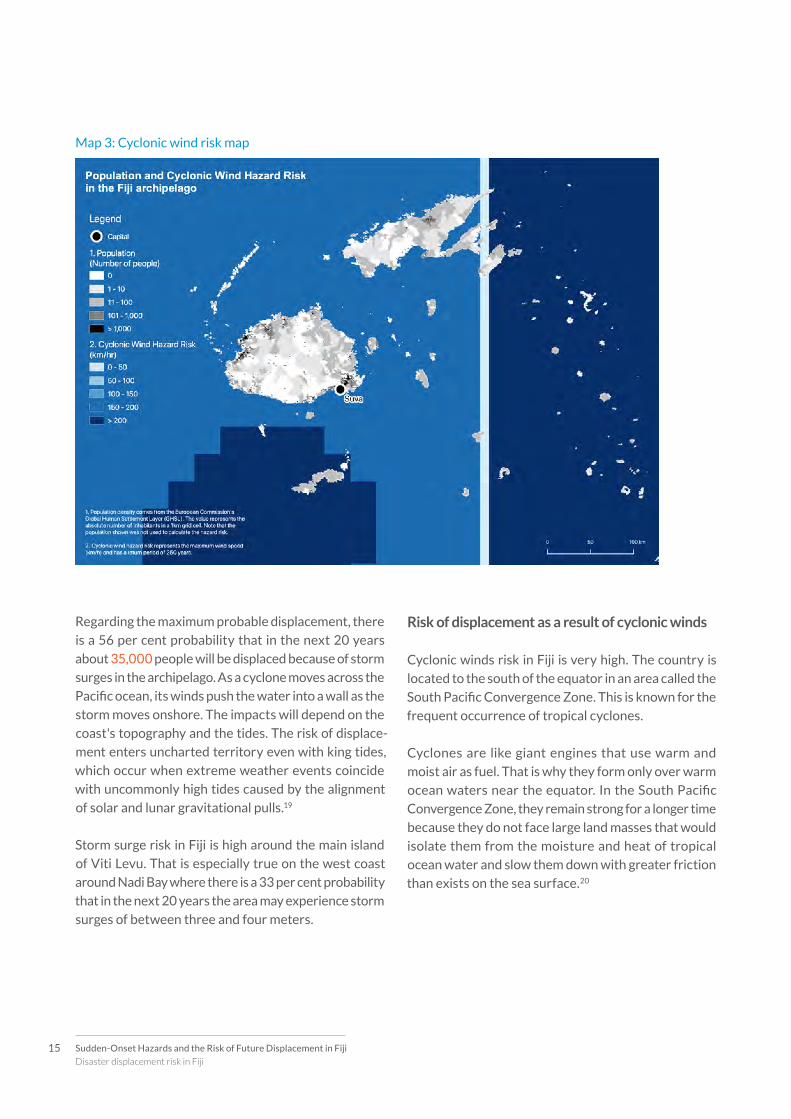
Risk of displacement as a result of cyclonic winds
Cyclonic winds risk in Fiji is very high. The country is
located to the south of the equator in an area called the
South Pacific Convergence Zone. This is known for the
frequent occurrence of tropical cyclones.
Cyclones are like giant engines that use warm and
moist air as fuel. That is why they form only over warm
ocean waters near the equator. In the South Pacific
Convergence Zone, they remain strong for a longer time
because they do not face large land masses that would
isolate them from the moisture and heat of tropical
ocean water and slow them down with greater friction
than exists on the sea surface.20
Map 3: Cyclonic wind risk map
16Sudden-Onset Hazards and the Risk of Future Displacement in Fiji
Disaster displacement risk in Fiji
On average 2,076 people are expected to be displaced
per year considering all the events that could occur over
the return period. Surrounded by ocean, the archipelago
of Fiji, especially Kadavu and Taveuni and the sparse
islands situated in the east, could experience wind
speeds greater than 230km/h. Regarding the probable
maximum displacement, there is an 18 per cent prob-
ability that in the next 50 years about 65,000 people
will become displaced by cyclonic winds.
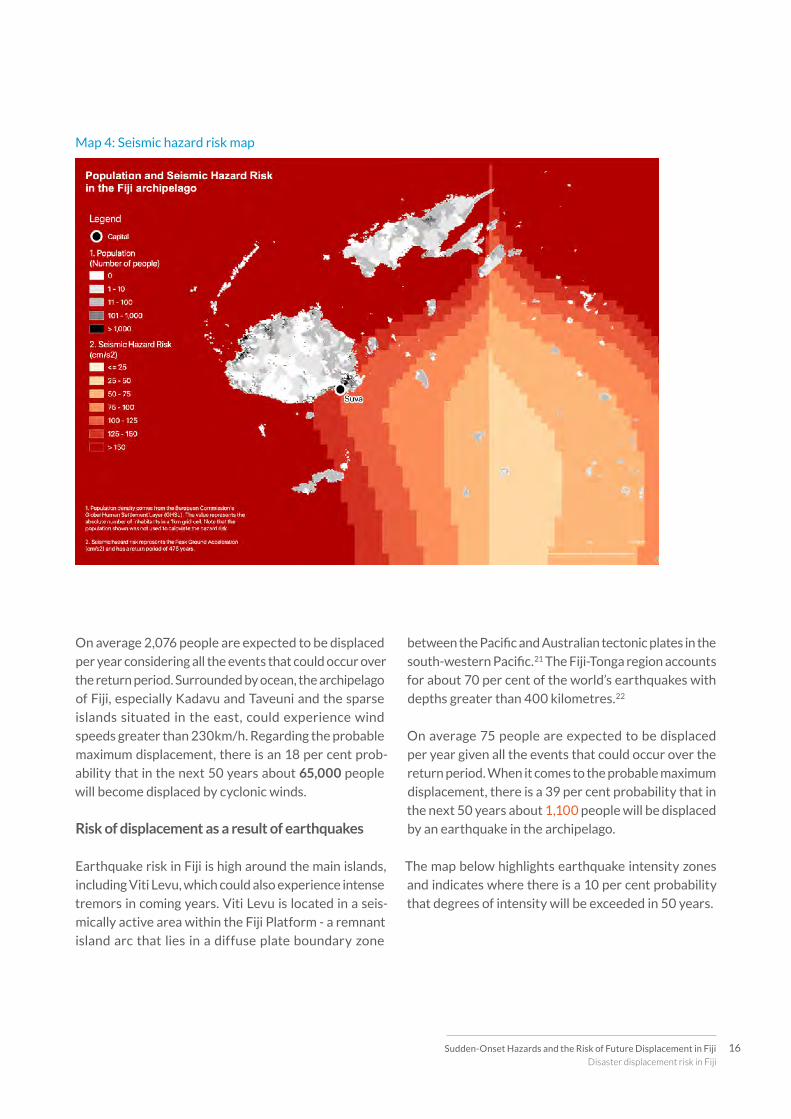
Risk of displacement as a result of earthquakes
Earthquake risk in Fiji is high around the main islands,
including Viti Levu, which could also experience intense
tremors in coming years. Viti Levu is located in a seis-
mically active area within the Fiji Platform - a remnant
island arc that lies in a diffuse plate boundary zone
between the Pacific and Australian tectonic plates in the
south-western Pacific.21 The Fiji-Tonga region accounts
for about 70 per cent of the world’s earthquakes with
depths greater than 400 kilometres.22
On average 75 people are expected to be displaced
per year given all the events that could occur over the
return period. When it comes to the probable maximum
displacement, there is a 39 per cent probability that in
the next 50 years about 1,100 people will be displaced
by an earthquake in the archipelago.
The map below highlights earthquake intensity zones
and indicates where there is a 10 per cent probability
that degrees of intensity will be exceeded in 50 years.
Map 4: Seismic hazard risk map
17 Sudden-Onset Hazards and the Risk of Future Displacement in Fiji
Disaster displacement risk in Fiji
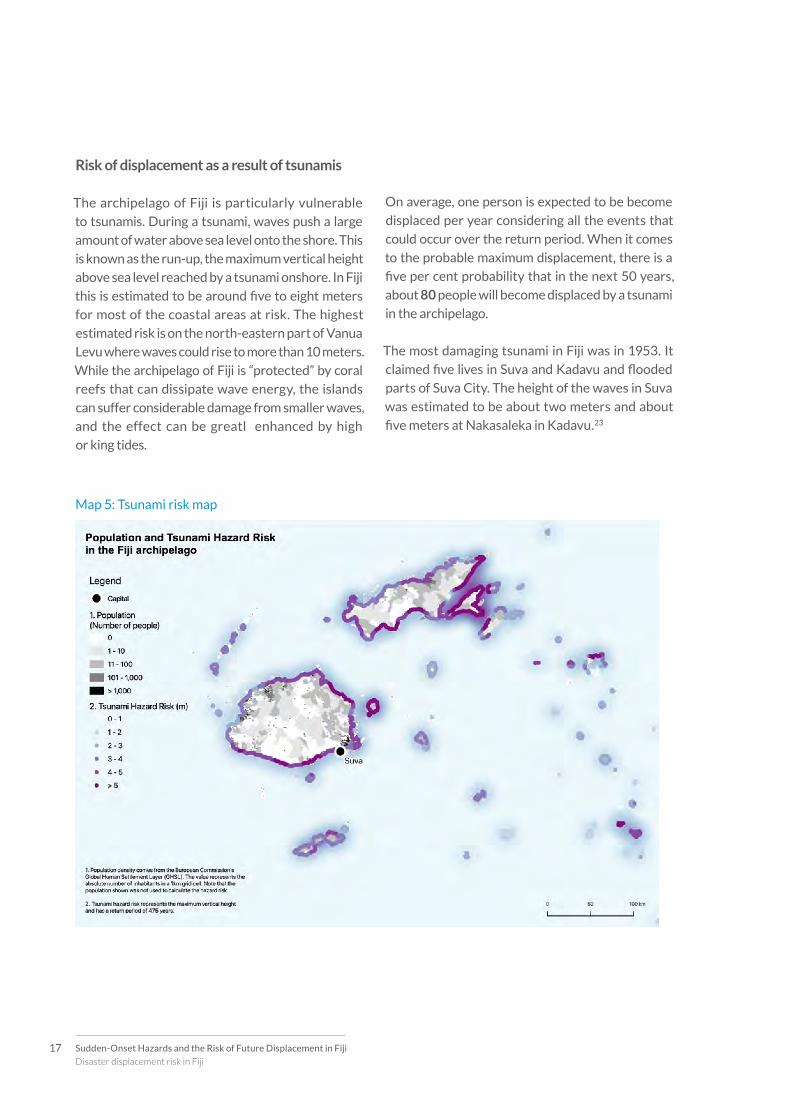
Map 5: Tsunami risk map
Risk of displacement as a result of tsunamis
The archipelago of Fiji is particularly vulnerable
to tsunamis. During a tsunami, waves push a large
amount of water above sea level onto the shore. This
is known as the run-up, the maximum vertical height
above sea level reached by a tsunami onshore. In Fiji
this is estimated to be around five to eight meters
for most of the coastal areas at risk. The highest
estimated risk is on the north-eastern part of Vanua
Levu where waves could rise to more than 10 meters.
While the archipelago of Fiji is “protected” by coral
reefs that can dissipate wave energy, the islands
can suffer considerable damage from smaller waves,
and the effect can be greatl enhanced by high
or king tides.
On average, one person is expected to be become
displaced per year considering all the events that
could occur over the return period. When it comes
to the probable maximum displacement, there is a
five per cent probability that in the next 50 years,
about 80 people will become displaced by a tsunami
in the archipelago.
The most damaging tsunami in Fiji was in 1953. It
claimed five lives in Suva and Kadavu and flooded
parts of Suva City. The height of the waves in Suva
was estimated to be about two meters and about
five meters at Nakasaleka in Kadavu.23
Sudden-Onset Hazards and the Risk of Future Displacement in Fiji
Towards risk-informed decision-making in Fiji
18
Disasters have triggered about 290 million displace-
ments around the world since IDMC began collecting
data on the phenomenon in 2008. This is more than
three times the number of people displaced because
of conflict and violence. Given the scale of the threat,
the need to address the risk of displacement associ-
ated with disasters has been explicitly recognised in
global policy agendas on disaster risk reduction and
climate change.
Global agreements on disaster risk reduction, such
as the Hyogo Framework for Action 2005–2015 and
the Sendai Framework for Disaster Risk Reduction
2015–2030, have promoted and significantly increased
efforts to reduce disaster risk in general. The Sendai
framework recognises the importance of addressing
displacement risk in particular.24
Disaster displacement is likely to grow in the future.
Weather-related hazards account for more than 87 per
cent of all disaster displacement. Climate change and
the increasing concentration of populations in areas
exposed to storms and floods mean that ever more
people are at risk of being displaced.
People displaced by disasters face similar challenges to
those who flee conflict and violence. Many of them lose
their homes, assets and income. They face insecurity, re-
duced access to services such as water, food, healthcare
and education, and disrupted social networks.
Towards risk-informed decision-making in Fiji
Box 5: Risk definition
/rɪsk/
The potential loss of life, injury, or destroyed or
damaged assets which could occur to a system,
society or a community in a specific period of
time, determined probabilistically as a function
of hazard, exposure, vulnerability and capacity.
(UNDRR – 2017). Risk is the possibility of some-
thing bad happening.
Sudden-Onset Hazards and the Risk of Future Displacement in Fiji
Towards risk-informed decision-making in Fiji
19
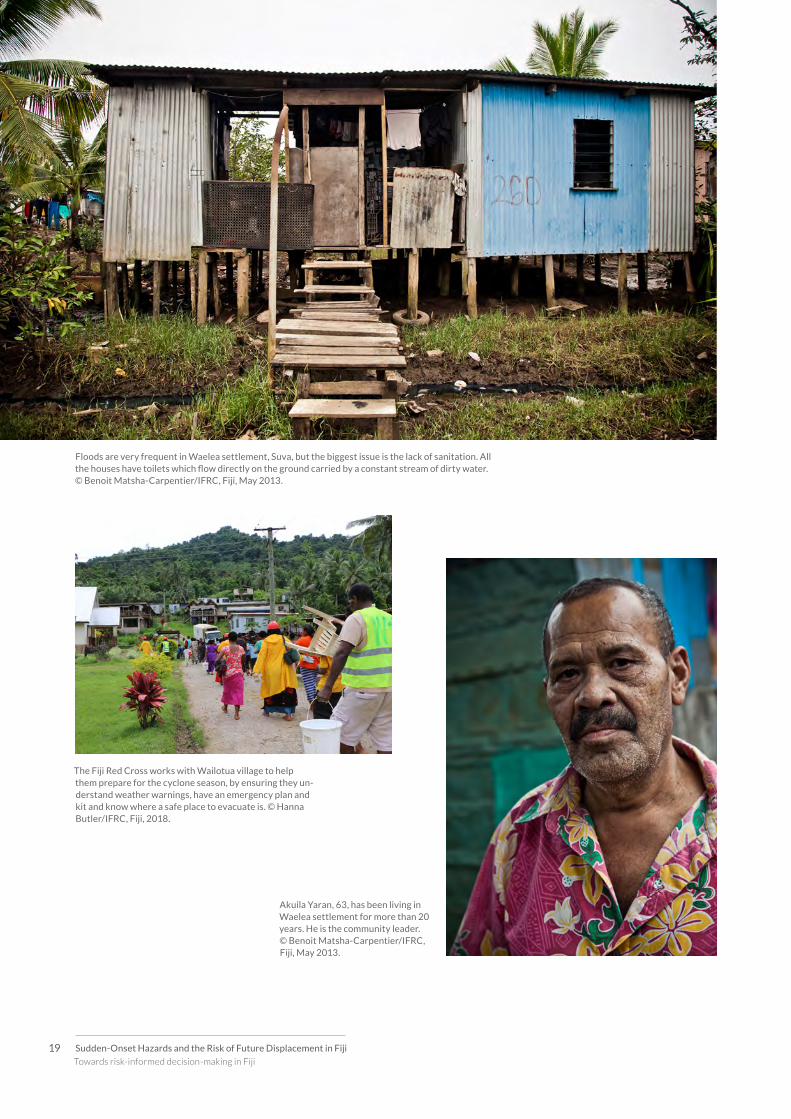
Floods are very frequent in Waelea settlement, Suva, but the biggest issue is the lack of sanitation. All the houses have toilets which flow directly on the ground carried by a constant stream of dirty water. © Benoit Matsha-Carpentier/IFRC, Fiji, May 2013.
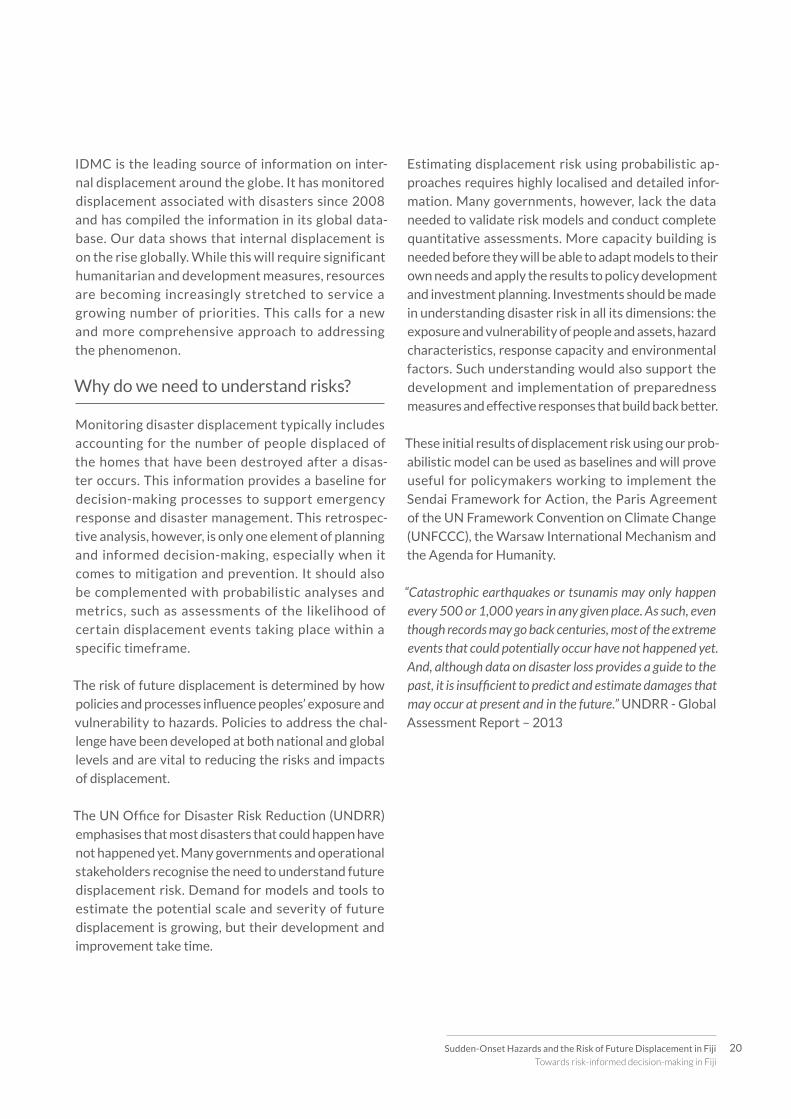
The Fiji Red Cross works with Wailotua village to help them prepare for the cyclone season, by ensuring they un-derstand weather warnings, have an emergency plan and kit and know where a safe place to evacuate is. © Hanna Butler/IFRC, Fiji, 2018.
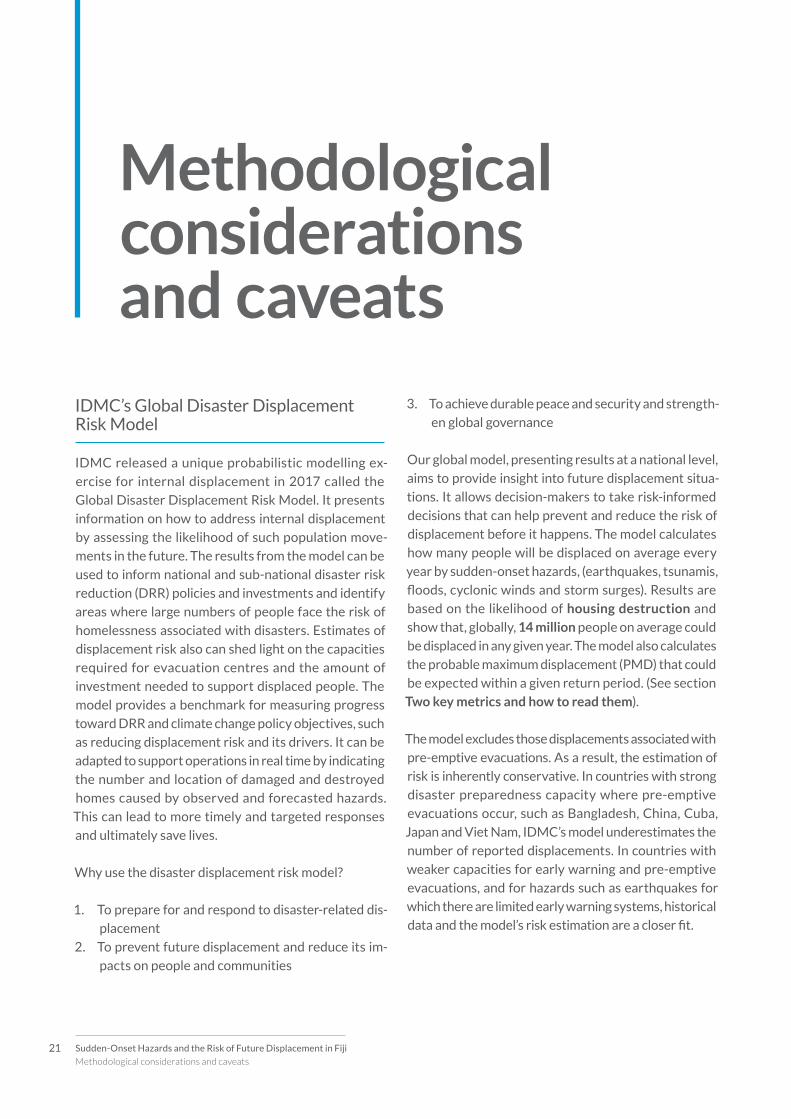
Akuila Yaran, 63, has been living in Waelea settlement for more than 20 years. He is the community leader. © Benoit Matsha-Carpentier/IFRC, Fiji, May 2013.
Sudden-Onset Hazards and the Risk of Future Displacement in Fiji
Towards risk-informed decision-making in Fiji
20
IDMC is the leading source of information on inter-
nal displacement around the globe. It has monitored
displacement associated with disasters since 2008
and has compiled the information in its global data-
base. Our data shows that internal displacement is
on the rise globally. While this will require significant
humanitarian and development measures, resources
are becoming increasingly stretched to service a
growing number of priorities. This calls for a new
and more comprehensive approach to addressing
the phenomenon.
Why do we need to understand risks?
Monitoring disaster displacement typically includes
accounting for the number of people displaced of
the homes that have been destroyed after a disas-
ter occurs. This information provides a baseline for
decision-making processes to support emergency
response and disaster management. This retrospec-
tive analysis, however, is only one element of planning
and informed decision-making, especially when it
comes to mitigation and prevention. It should also
be complemented with probabilistic analyses and
metrics, such as assessments of the likelihood of
certain displacement events taking place within a
specific timeframe.
The risk of future displacement is determined by how
policies and processes influence peoples’ exposure and
vulnerability to hazards. Policies to address the chal-
lenge have been developed at both national and global
levels and are vital to reducing the risks and impacts
of displacement.
The UN Office for Disaster Risk Reduction (UNDRR)
emphasises that most disasters that could happen have
not happened yet. Many governments and operational
stakeholders recognise the need to understand future
displacement risk. Demand for models and tools to
estimate the potential scale and severity of future
displacement is growing, but their development and
improvement take time.
Estimating displacement risk using probabilistic ap-
proaches requires highly localised and detailed infor-
mation. Many governments, however, lack the data
needed to validate risk models and conduct complete
quantitative assessments. More capacity building is
needed before they will be able to adapt models to their
own needs and apply the results to policy development
and investment planning. Investments should be made
in understanding disaster risk in all its dimensions: the
exposure and vulnerability of people and assets, hazard
characteristics, response capacity and environmental
factors. Such understanding would also support the
development and implementation of preparedness
measures and effective responses that build back better.
These initial results of displacement risk using our prob-
abilistic model can be used as baselines and will prove
useful for policymakers working to implement the
Sendai Framework for Action, the Paris Agreement
of the UN Framework Convention on Climate Change
(UNFCCC), the Warsaw International Mechanism and
the Agenda for Humanity.
“Catastrophic earthquakes or tsunamis may only happen every 500 or 1,000 years in any given place. As such, even though records may go back centuries, most of the extreme events that could potentially occur have not happened yet. And, although data on disaster loss provides a guide to the past, it is insufficient to predict and estimate damages that may occur at present and in the future.” UNDRR - Global
Assessment Report – 2013
21 Sudden-Onset Hazards and the Risk of Future Displacement in Fiji
Methodological considerations and caveats
IDMC’s Global Disaster Displacement Risk Model
IDMC released a unique probabilistic modelling ex-
ercise for internal displacement in 2017 called the
Global Disaster Displacement Risk Model. It presents
information on how to address internal displacement
by assessing the likelihood of such population move-
ments in the future. The results from the model can be
used to inform national and sub-national disaster risk
reduction (DRR) policies and investments and identify
areas where large numbers of people face the risk of
homelessness associated with disasters. Estimates of
displacement risk also can shed light on the capacities
required for evacuation centres and the amount of
investment needed to support displaced people. The
model provides a benchmark for measuring progress
toward DRR and climate change policy objectives, such
as reducing displacement risk and its drivers. It can be
adapted to support operations in real time by indicating
the number and location of damaged and destroyed
homes caused by observed and forecasted hazards.
This can lead to more timely and targeted responses
and ultimately save lives.
Why use the disaster displacement risk model?
1. To prepare for and respond to disaster-related dis-
placement
2. To prevent future displacement and reduce its im-
pacts on people and communities
3. To achieve durable peace and security and strength-
en global governance
Our global model, presenting results at a national level,
aims to provide insight into future displacement situa-
tions. It allows decision-makers to take risk-informed
decisions that can help prevent and reduce the risk of
displacement before it happens. The model calculates
how many people will be displaced on average every
year by sudden-onset hazards, (earthquakes, tsunamis,
floods, cyclonic winds and storm surges). Results are
based on the likelihood of housing destruction and
show that, globally, 14 million people on average could
be displaced in any given year. The model also calculates
the probable maximum displacement (PMD) that could
be expected within a given return period. (See section
Two key metrics and how to read them).
The model excludes those displacements associated with
pre-emptive evacuations. As a result, the estimation of
risk is inherently conservative. In countries with strong
disaster preparedness capacity where pre-emptive
evacuations occur, such as Bangladesh, China, Cuba,
Japan and Viet Nam, IDMC’s model underestimates the
number of reported displacements. In countries with
weaker capacities for early warning and pre-emptive
evacuations, and for hazards such as earthquakes for
which there are limited early warning systems, historical
data and the model’s risk estimation are a closer fit.
Methodological considerations and caveats
22
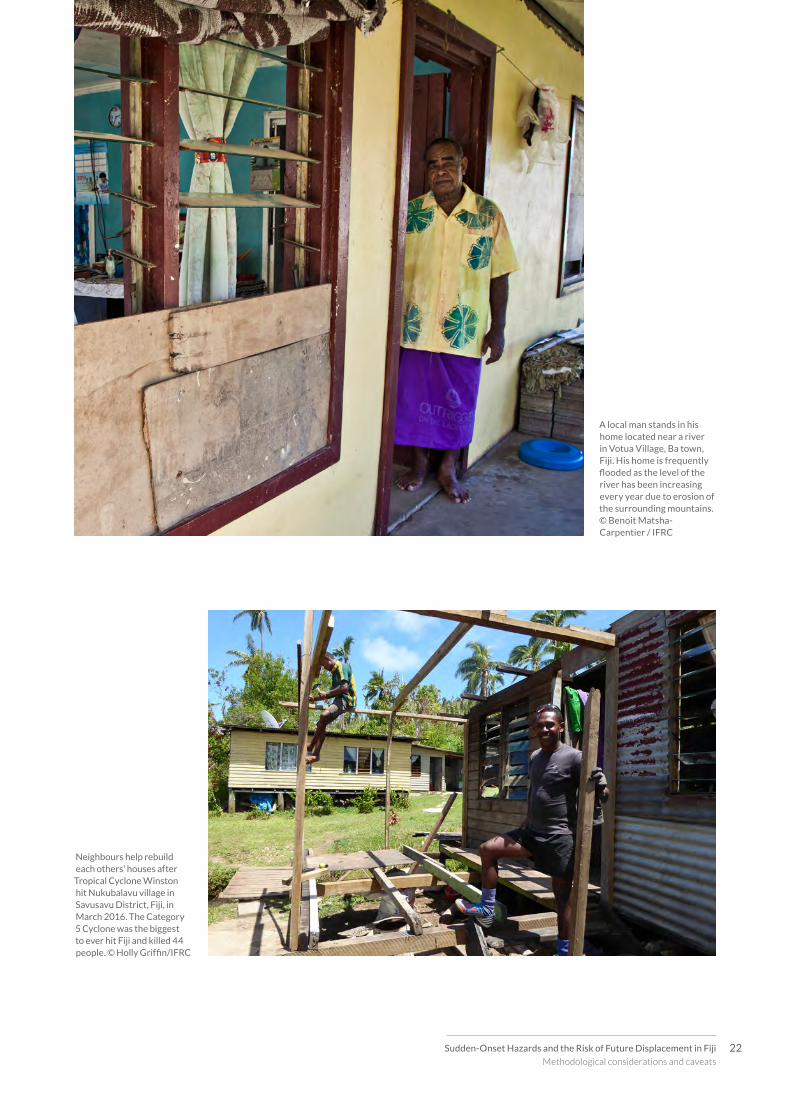
Neighbours help rebuild each others' houses after Tropical Cyclone Winston hit Nukubalavu village in Savusavu District, Fiji, in March 2016. The Category 5 Cyclone was the biggest to ever hit Fiji and killed 44 people. © Holly Griffin/IFRC
A local man stands in his home located near a river in Votua Village, Ba town, Fiji. His home is frequently flooded as the level of the river has been increasing every year due to erosion of the surrounding mountains. © Benoit Matsha-Carpentier / IFRC
Sudden-Onset Hazards and the Risk of Future Displacement in Fiji
Methodological considerations and caveats
23 Sudden-Onset Hazards and the Risk of Future Displacement in Fiji
Methodological considerations and caveats
What about the risk of displacement as a result of slow-onset hazards?
The results of IDMC’s model cover only displacement risk
associated with sudden-onset hazards. It is also possible
to model displacement risk for drought, desertification,
sea-level rise, coastal erosion, changes in sea surface
temperature, alterations in oceanic oxygen and other
slow-onset hazards. IDMC has, for example, modelled
drought-displacement risk in the Horn of Africa. Such
complex models need to take into consideration many
human factors. For that reason, they are time-consuming
and require historical data on various indicators to vali-
date and generate confidence in the results. IDMC does
not yet have such a model for countries in the Pacific, but
we would be willing to develop one if there is interest and
the resources available to do so.
Caveats and future improvements
This baseline country risk profile for Fiji provides a view of
risks and uncertainties for sudden-onset hazards (earth-
quakes, tsunamis, cyclonic winds and storm surges). The
risk assessment considers a large number of possible sce-
narios, their likelihood, and associated damages to housing.
The risk model is informed by and relates to medium-to-
large-scale events, but small and recurrent events still
require the daily monitoring of empirical information to
understand the full spectrum of displacement.
The results are indicative of the potential impact of the
event in a probabilistic manner. There are, however, un-
derlying limitations and simplifications. For that reason,
the results for individual probable events, or the calculated
impacts on particular assets, are unlikely to be precise.
While the metrics of displacement risk were developed at
the global level with low granularity, they are a baseline
and a guide. They can support further analysis in prepar-
ing for and responding to disaster-related displacement.
The resolution of this global model analysed more the 4.5
million cells containing proxies regarding assets and pop-
ulation at five km by five km, with a higher resolution of
one km by one km along the coastline. Millions of hazard
scenarios also have been compiled. The resolution used
in 2017 did not allow us to run a proper risk assessment
for riverine floods on small islands states.
The global risk model excludes displacements asso-
ciated with pre-emptive evacuations. This informa-
tion must be collected in the aftermath of disasters.
Where no specific indicators exist to monitor disaster
displacement, states could report on other indicators
established by the Sendai framework and the Sustain-
able Development Goals (SDGs) without duplication of
effort. Target B of the Sendai framework, for example,
includes the “number of directly affected people at-
tributed to disasters”. It is linked to SDG targets 1.5,
11.5 and 13.1, which refer to monitoring and reporting
on the “number of people whose destroyed dwellings
Fig 4: Displacement risk: How is it calculated?
Displacement risk Hazard Exposure Vulnerability
= X X
Phenomenon that maycause displacement(e.g. Earthquake)
People and buildingsin hazard-prone areas
How different buildings reactto different hazard intensities
Probability ofbeing destroyed
Probability ofbeing damaged
Probability of notbeing affected
24Sudden-Onset Hazards and the Risk of Future Displacement in Fiji
Methodological considerations and caveats
were attributed to disasters”. Sendai’s target G and
particularly G-6 could be also monitored using data
on pre-emptive evacuations.
The model can be used to inform national and local disaster
risk reduction policies and investments, and to identify
areas where large numbers of people are at risk of losing
their home. Its resolution, however, does not allow for its
use in decisions on land use and urban planning.
IDMC is working closely with the Swiss Federal Institute
of Technology in Zurich (ETHZ) and Oxford University
to improve the model’s ability to predict displacement
risk for rapid-onset hazards, including floods on small
island states. Increasing the resolution of the exposure
layer from five square kilometres to one allows for a more
granular assessment of the people and assets exposed.
This, coupled with a rerun of hazard scenarios using
the latest technologies, has produced a more accurate
estimate that suggests the number of people at risk
of displacement from all hazards is significantly higher
than previously thought. Better resolution also allowed
the disaggregation of displacement risk figures by urban
and rural locations.
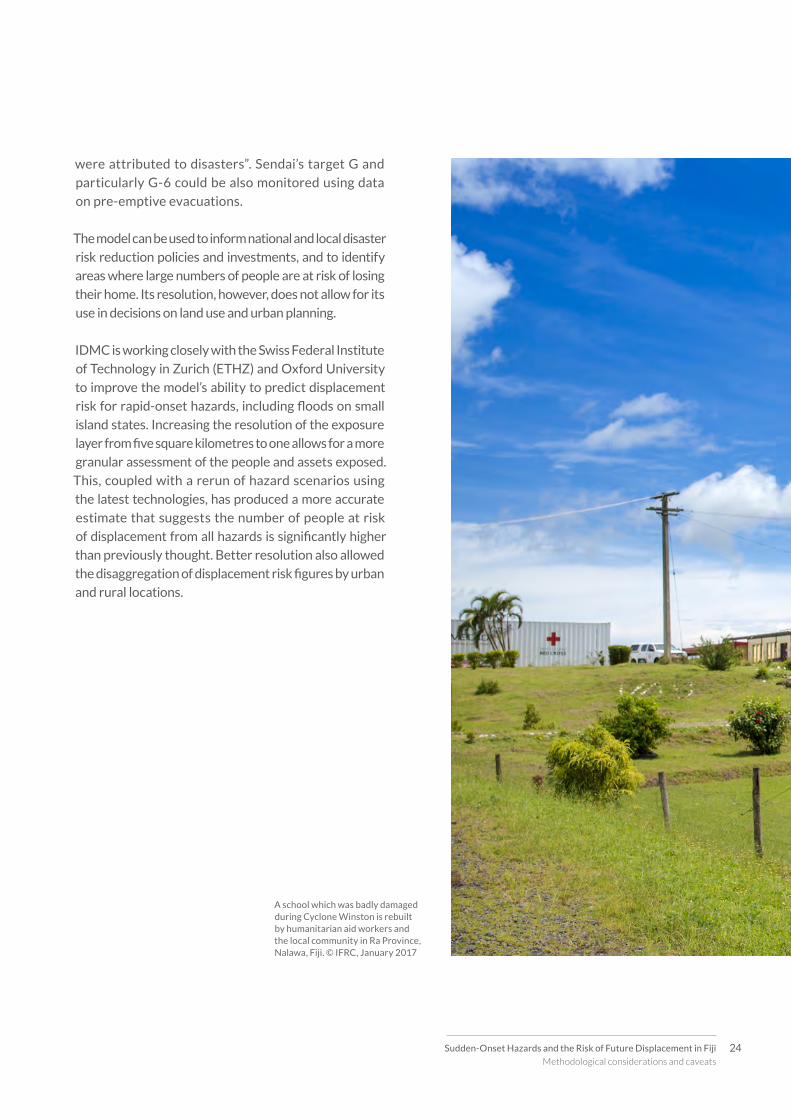
A school which was badly damaged during Cyclone Winston is rebuilt by humanitarian aid workers and the local community in Ra Province, Nalawa, Fiji. © IFRC, January 2017
25 Sudden-Onset Hazards and the Risk of Future Displacement in Fiji
Methodological considerations and caveats
26Sudden-Onset Hazards and the Risk of Future Displacement in Fiji
Endnotes
Endnotes
1 Platform on Disaster Displacement, Key Definitions, 2017
2 UNDRR, Disaster Risk, 2 February 2017
3 UNDP, Fiji, 2020
4 Government of Fiji, Fiji Bureau of Statistics Releases 2017
Census Results, 10 January 2018
5 FAO, Marine fishery resources of the Pacific Islands, 2010
6 UNDRR, Poorly planned urban development, accessed on the
30 November 2020
7 Asian Development Bank, The Emergence of Pacific Urban
Villages, Urbanization Trends in the Pacific Islands, 2016
8 Stephen W. Yeo, Russell J. Blong, Fiji's worst natural disaster:
the 1931 hurricane and flood, 09 June 2010
9 Government of Fiji, Tsunami, accessed on the 30 November
2020
10 GIZ, Overview of Fiji’s Response to International Frameworks on
Human Mobility in the Context of Climate Change, 9 April 2020
11 Fiji Red Cross Society, Fiji Cyclone Winston: One Year On,
2017
12 WMO, Fiji to Implement Flash Flood Guidance System, 28
November 2018
13 Government of Fiji, National Emergency Operation Center,
Tropical Cyclone Winston, Situation Report 51, 4 March 2016
14 Government of Fiji, Tropical Cyclone Winston, Post-Disaster
Needs Assessment, May 2016
15 Government of Fiji, National Emergency Operation Center,
Tropical Cyclone Winston, Situation Report 53, 4 March 2016
16 European Union, European Union - ACP Group of States assist
in Tukuraki Village relocation in Fiji, 27 October 2017
17 UNDRR, Global Assessment Report – Risk Atlas, 2017
18 GFDRR, Understanding Risk, 100 Year Flood, accessed on the
30 November 2020
19 IDMC, Silent Disasters: Preparing For The King Tide, Expert
Opinion, March 2020
20 Smithsonian, Hurricanes, Typhoons, And Cyclones, accessed
on the 30 November 2020
21 Tariq Iqbal Hamid Rahiman, Neotectonics, Seismic and Tsuna-
mi Hazards, Viti Levu, Fiji, 2006
22 Joeli Varo, Tingneyuc Sekac, Sujoy Kumar Jana, Earthquake
Hazard Micro Zonation in Fiji Islands: A Research of VitiLevu
Island, September 2019
23 Government of Fiji, Tsunami, accessed on the 30 November
2020
24 UNDRR, Sendai Framework for Disaster Risk Reduction 2015-
2030, 2015
Acknowledgement:
With funding from the European Union, the Internal Displacement Monitoring Centre (IDMC) is collaborating with
the International Organization for Migration (IOM) and the Platform on Disaster Displacement (PDD) to generate
new evidence to help governments better understand, plan for, prevent and respond to disaster displacement in
the Pacific region. The project will contribute to better policy responses, planning and operational tools.

The Internal Displacement Monitoring Centre
3 rue de Varembé, 1202 Geneva, Switzerland
+41 22 552 3600 | [email protected]
www.internal-displacement.org
www.facebook.com/InternalDisplacement
www.twitter.com/IDMC_Geneva
Every day, people flee conflict and disasters and become displaced inside their own countries. IDMC provides
data and analysis and supports partners to identify and implement solutions to internal displacement.