Embed Size (px)
Citation preview
Success is what counts.
A Better Way to Measure Community College Performance
Presentation about the ATD Cross-State Data WorkgroupNC Community College Planning & Research OrganizationMarch 19, 2010

Success is what counts.
Presentation Summary:
Overview of Achieving the Dream & the Cross-State Data Workgroup
Recommendations for an Alternative Set of Outcome Measures for Community Colleges
Development of Intermediate Milestones
Overview of the Developmental Education Initiative
Implications for Policy and Practice
Success is what counts.
Achieving the Dream Overview
National initiative to help more community college students succeed (earn degrees, earn certificates, or transfer)
Particularly focused on student groups that have faced the most significant barriers to success, including low-income students and students of color
Success is what counts.
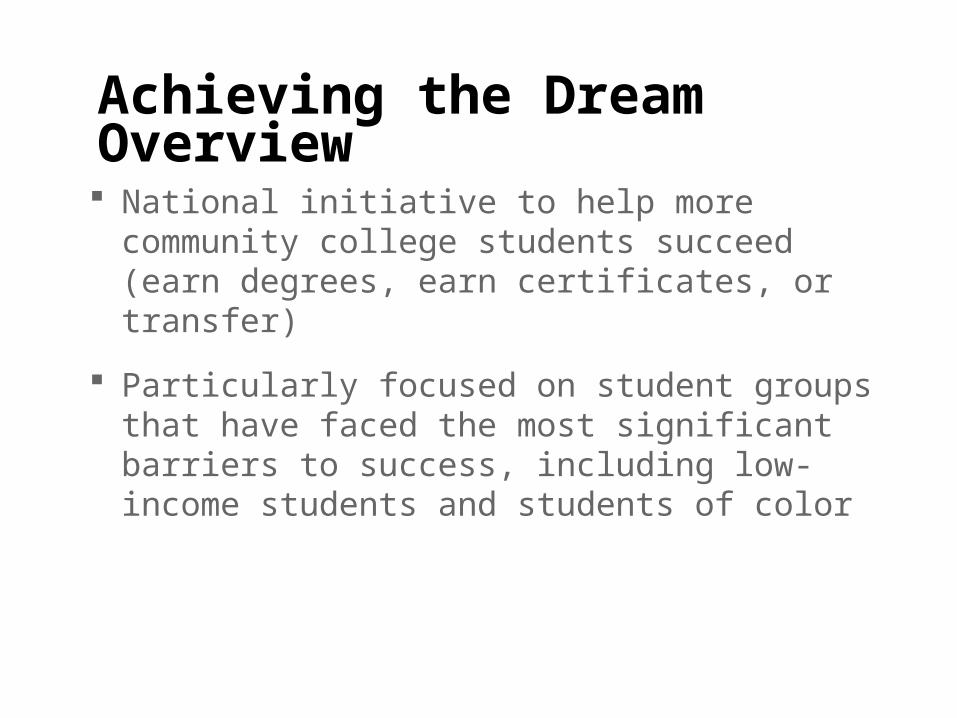
Over 100 Institutions in 22 States
Success is what counts.
Achieving the Dream Values
Student-centered
Equity and excellence
Culture of evidence, inquiry, accountability, and shared responsibility
Success is what counts.
Components of Achieving the Dream
Institutional Change
Policy Development
Knowledge Development
Engagement
Success is what counts.
State Policy Priorities Clear public policy commitment to student success Strong data-driven accountability systems Aligned expectations, standards, and assessments across education sectors Incentives for improving success for underprepared students Financial aid policies that promote persistence Public support
Success is what counts.
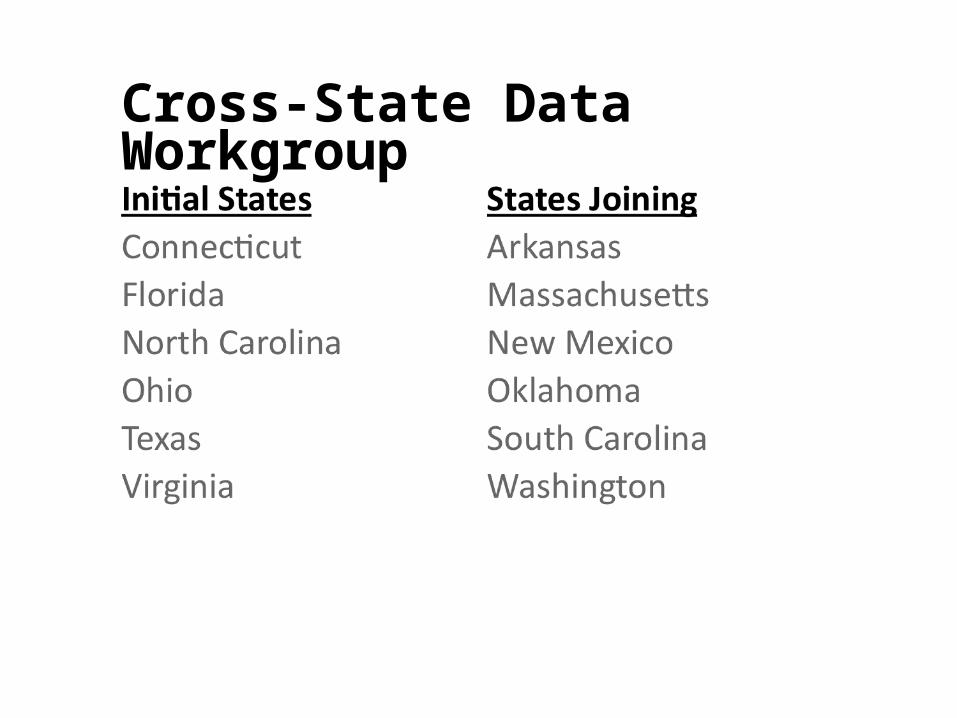
Cross-State Data Workgroup
Success is what counts.
Test Drive: Six States Pilot Better Ways to Measure and Compare Community College Performance

Success is what counts.
Some of the Needed Changes to IPEDS:
Expand success outcomes to include:
Earned degree or certificate
Transferred without an award
Enrolled in with at least 30 hrs
Included full- AND part-time students
Change the timeframe to measuring success from three years to six years
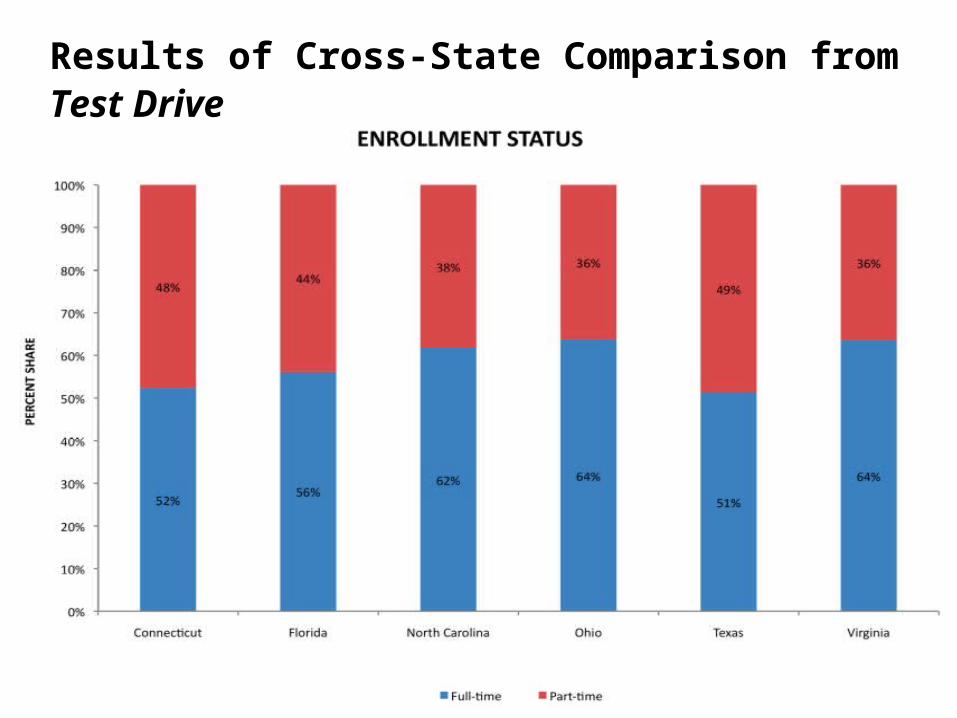
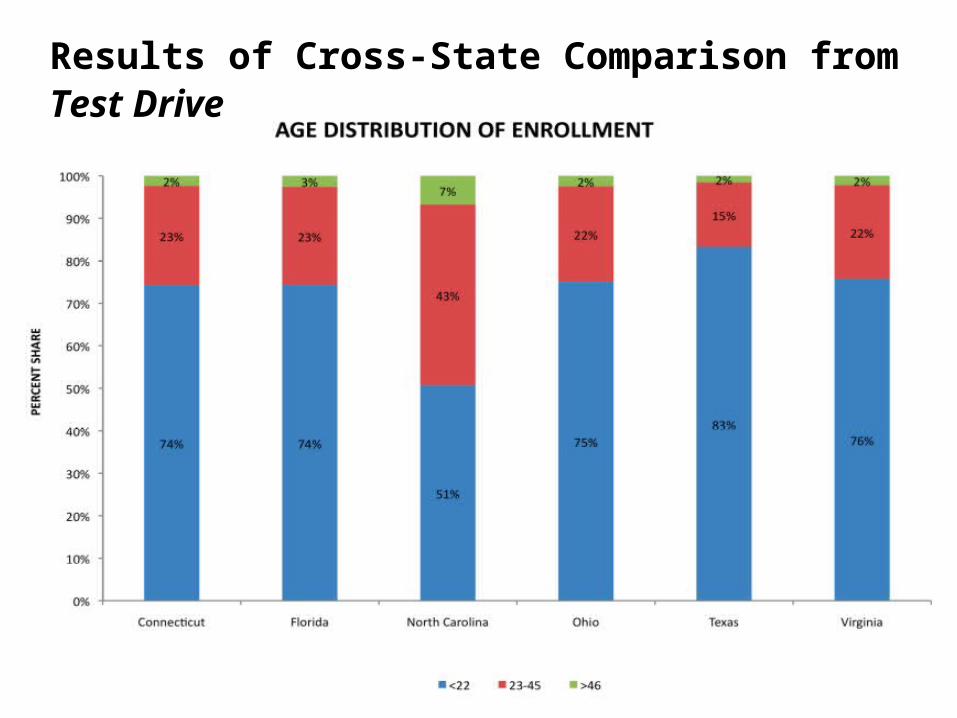
Disaggregate results by age, enrollment status
Success is what counts.
Results of Cross-State Comparison from Test Drive
Success is what counts.
Results of Cross-State Comparison from Test Drive

Success is what counts.
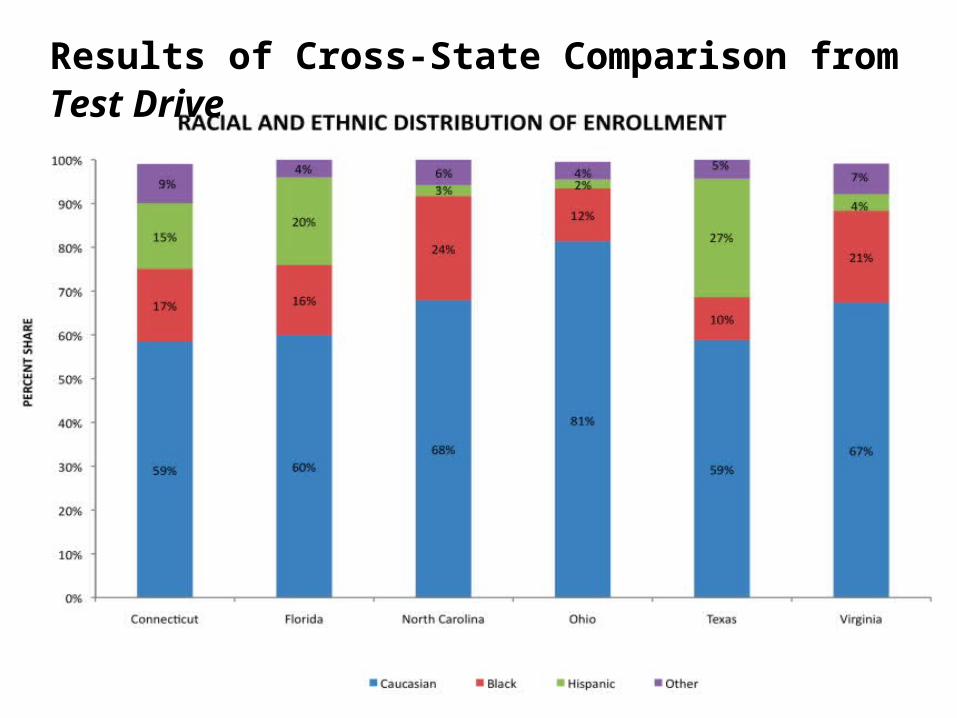
Results of Cross-State Comparison from Test Drive
Success is what counts.
Results of Cross-State Comparison from Test Drive
Success is what counts.
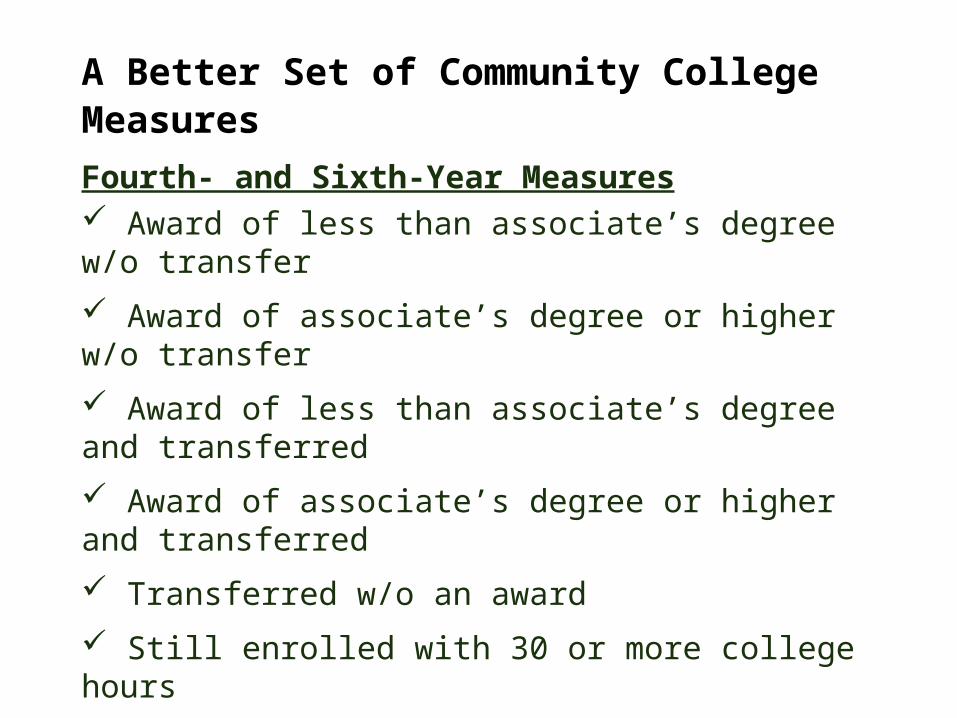
A Better Set of Community College Measures
Fourth- and Sixth-Year Measures Award of less than associate’s degree w/o transfer
Award of associate’s degree or higher w/o transfer
Award of less than associate’s degree and transferred
Award of associate’s degree or higher and transferred
Transferred w/o an award
Still enrolled with 30 or more college hours
Total success rate
Success is what counts.
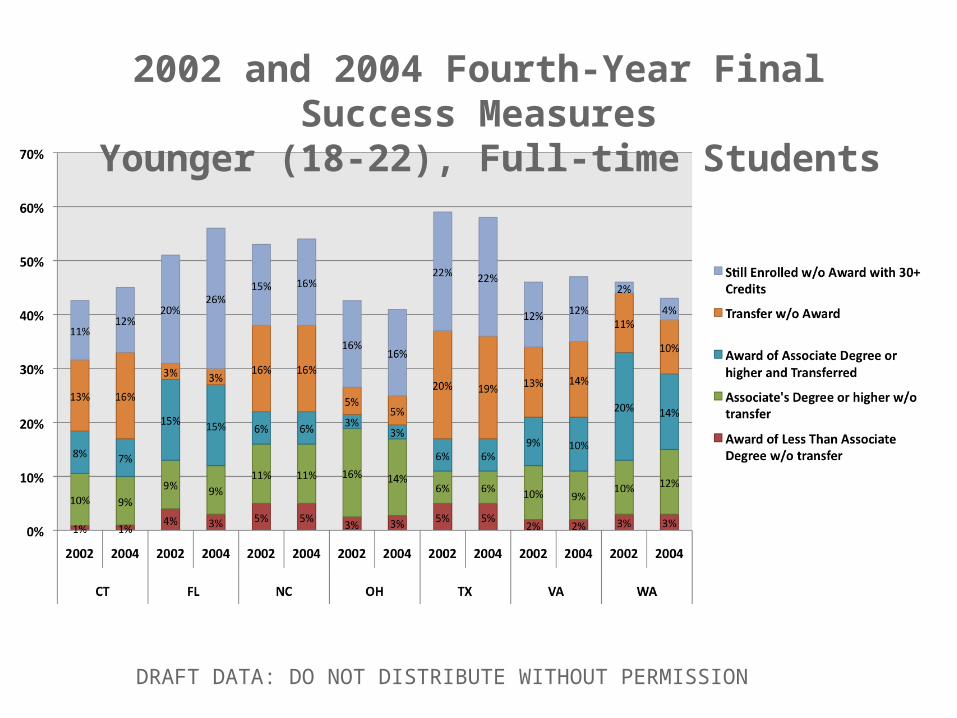
2002 and 2004 Fourth-Year Final Success Measures Younger (18-22), Full-time Students
DRAFT DATA: DO NOT DISTRIBUTE WITHOUT PERMISSION
Success is what counts.
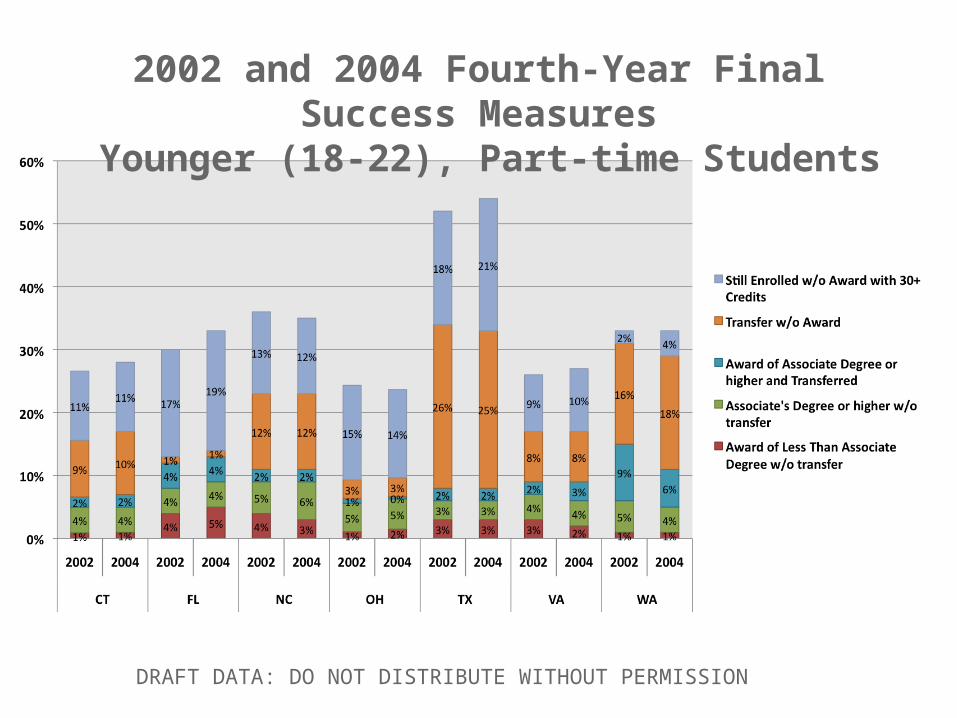
2002 and 2004 Fourth-Year Final Success Measures Younger (18-22), Part-time Students
DRAFT DATA: DO NOT DISTRIBUTE WITHOUT PERMISSION
Success is what counts.
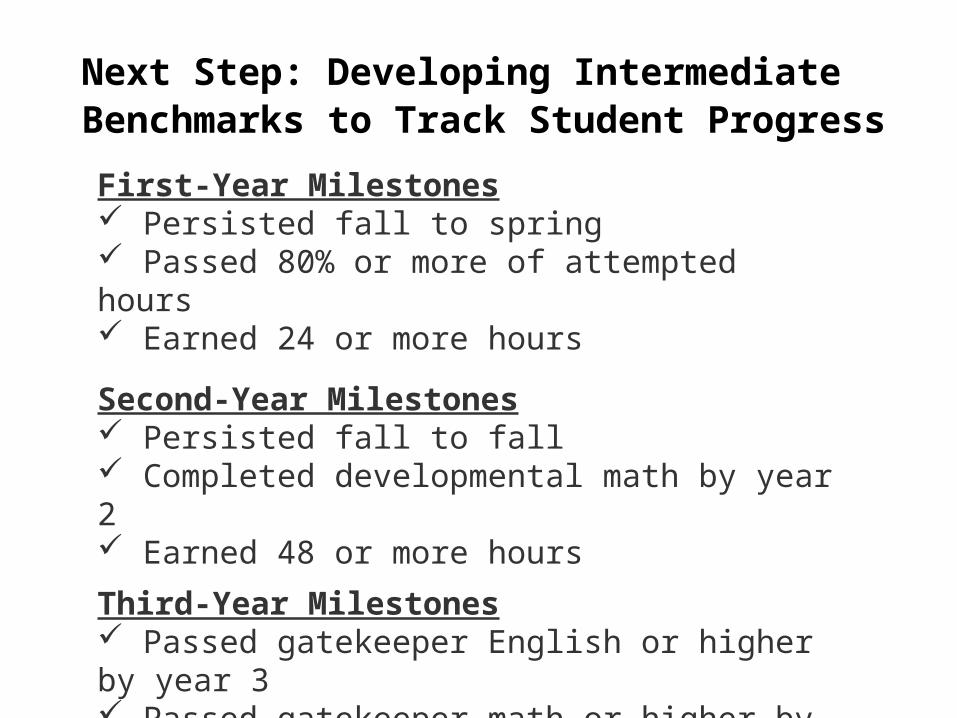
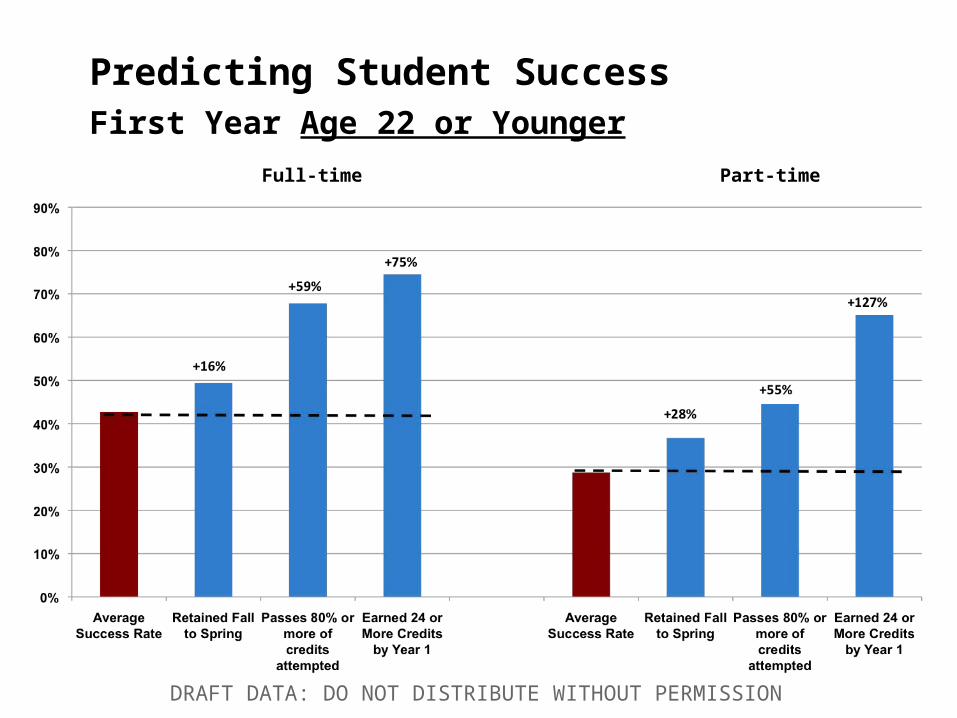
Next Step: Developing Intermediate Benchmarks to Track Student Progress
First-Year Milestones Persisted fall to spring Passed 80% or more of attempted hours Earned 24 or more hours
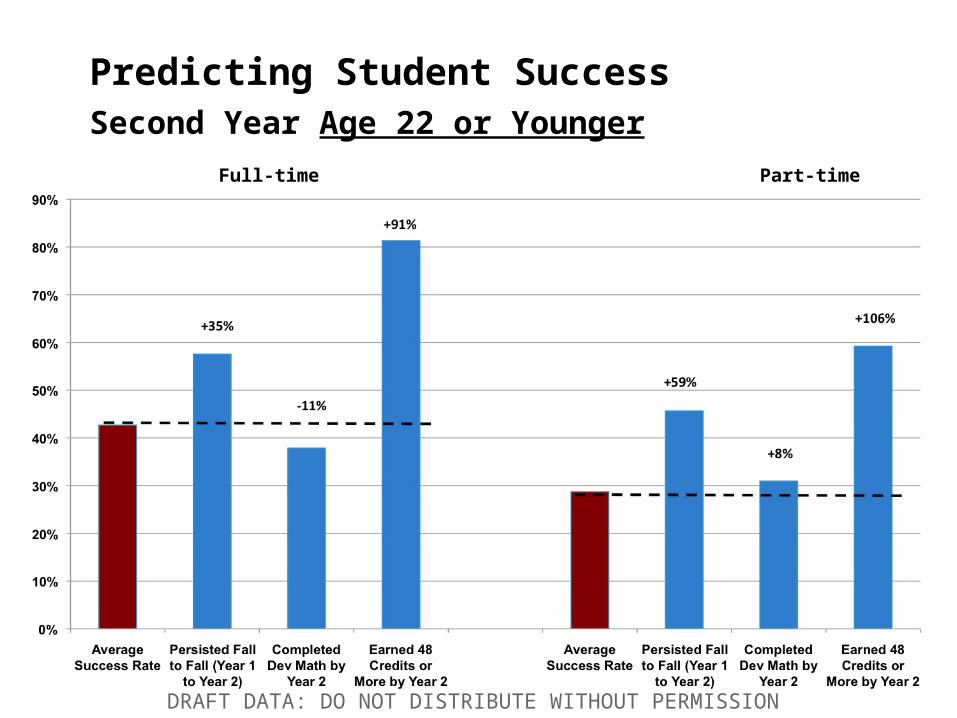
Second-Year Milestones Persisted fall to fall Completed developmental math by year 2 Earned 48 or more hours
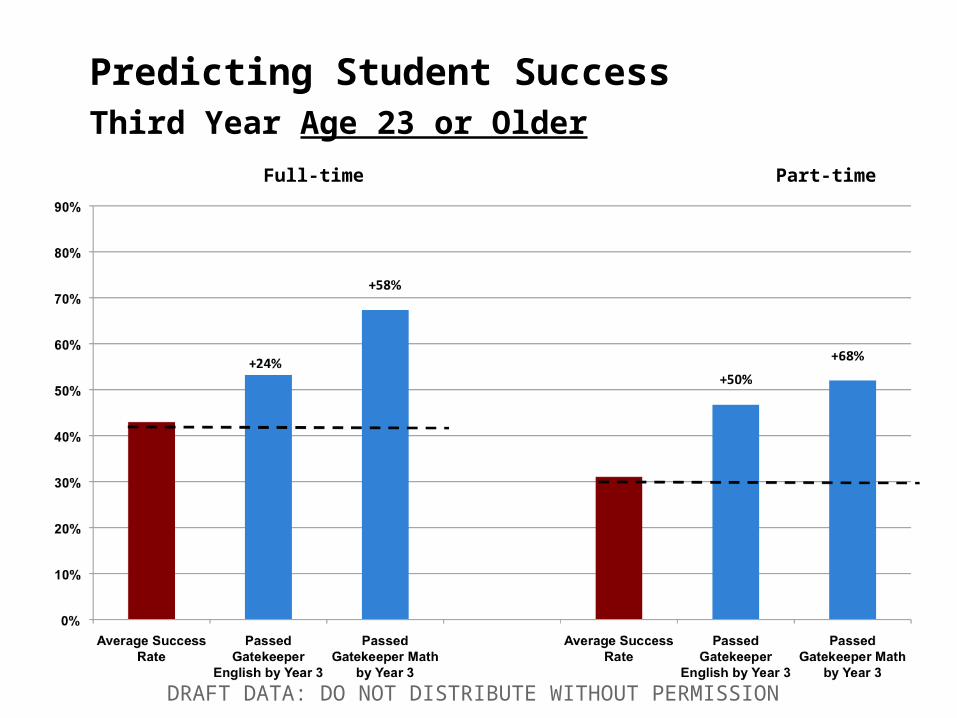
Third-Year Milestones Passed gatekeeper English or higher by year 3 Passed gatekeeper math or higher by year 3
Success is what counts.
Predicting Student SuccessFirst Year Age 22 or Younger
Full-time Part-time
DRAFT DATA: DO NOT DISTRIBUTE WITHOUT PERMISSION
Success is what counts.
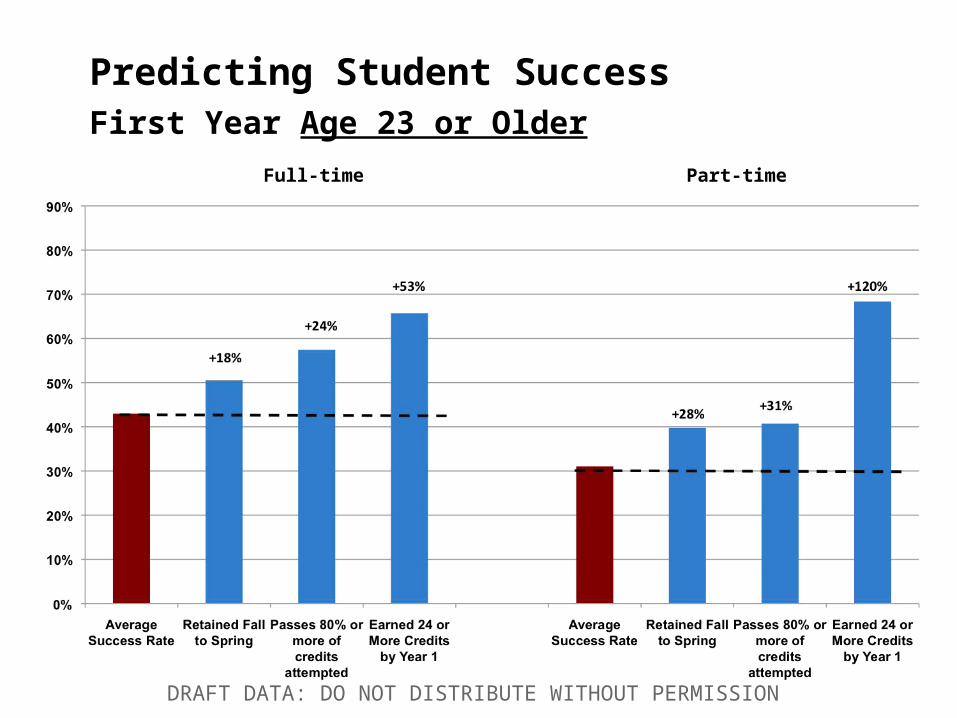
Predicting Student SuccessFirst Year Age 23 or Older Full-time Part-time
DRAFT DATA: DO NOT DISTRIBUTE WITHOUT PERMISSION
Success is what counts.
Predicting Student SuccessSecond Year Age 22 or Younger Full-time Part-time
DRAFT DATA: DO NOT DISTRIBUTE WITHOUT PERMISSION

Success is what counts.
Predicting Student SuccessSecond Year Age 23 or Older Full-time Part-time
DRAFT DATA: DO NOT DISTRIBUTE WITHOUT PERMISSION

Success is what counts.
Predicting Student SuccessThird Year Age 22 or Younger Full-time Part-time
DRAFT DATA: DO NOT DISTRIBUTE WITHOUT PERMISSION
Success is what counts.
Predicting Student SuccessThird Year Age 23 or Older
Full-time Part-time
DRAFT DATA: DO NOT DISTRIBUTE WITHOUT PERMISSION
Success is what counts.
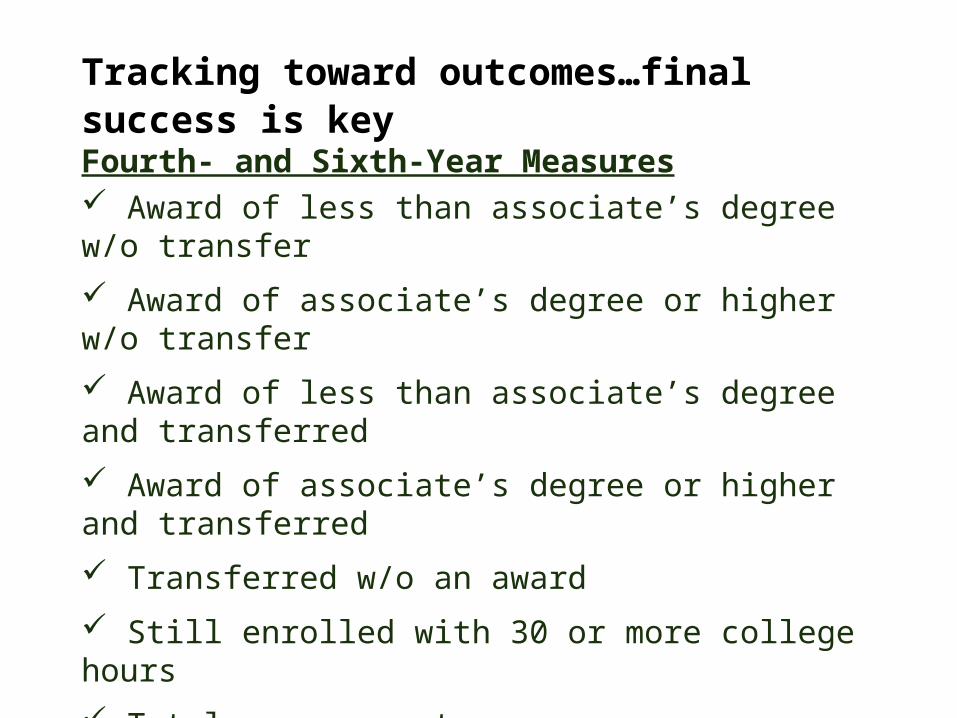
Tracking toward outcomes…final success is key
Fourth- and Sixth-Year Measures Award of less than associate’s degree w/o transfer
Award of associate’s degree or higher w/o transfer
Award of less than associate’s degree and transferred
Award of associate’s degree or higher and transferred
Transferred w/o an award
Still enrolled with 30 or more college hours
Total success rate
Success is what counts.
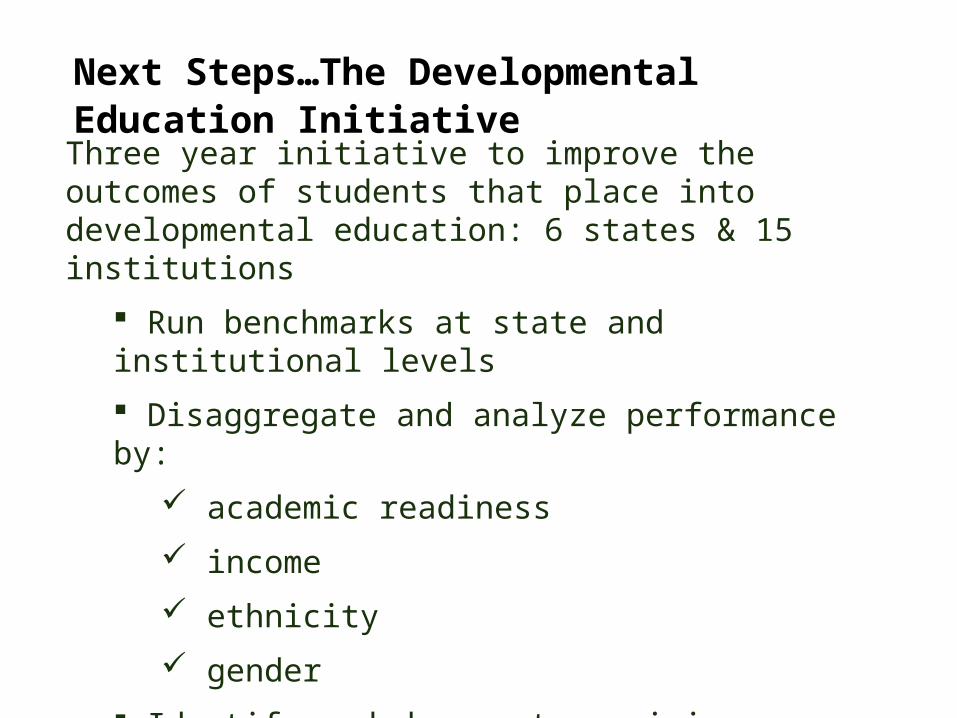
Next Steps…The Developmental Education Initiative
Three year initiative to improve the outcomes of students that place into developmental education: 6 states & 15 institutions
Run benchmarks at state and institutional levels
Disaggregate and analyze performance by:
academic readiness
income
ethnicity
gender
Identify and document promising interventions
Success is what counts.
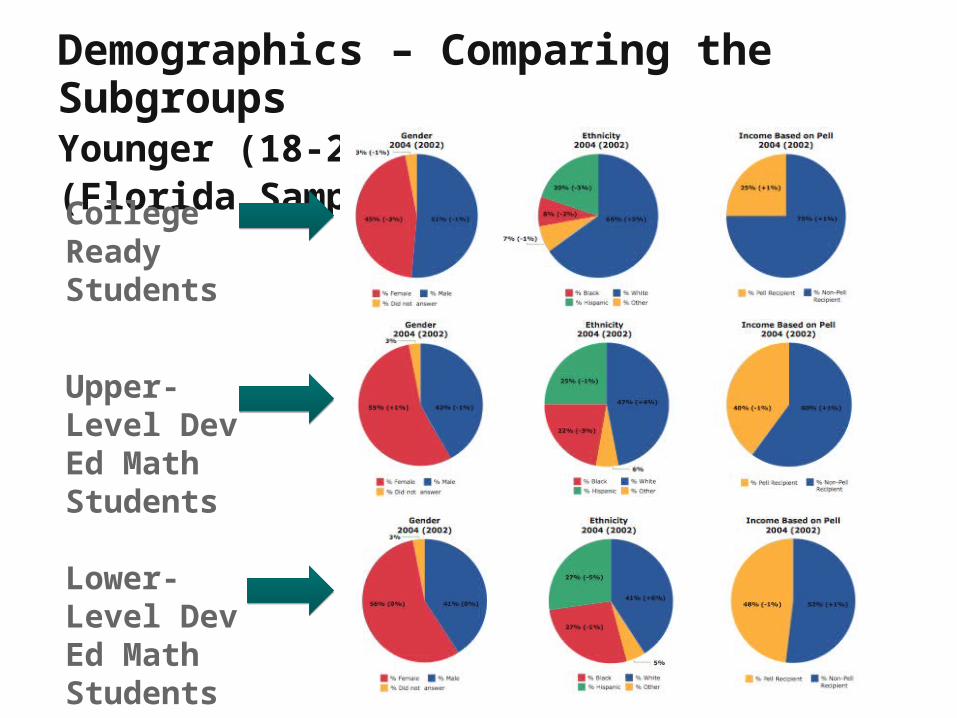
Demographics – Comparing the SubgroupsYounger (18-22), Full-time Students (Florida Sample)
College Ready Students
Upper-Level Dev Ed Math Students
Lower-Level Dev Ed Math Students

Success is what counts.
Looking Across InstitutionsNC Sample: Passing gatekeeper math by year 3
by attendance status & age
Success is what counts.
What does all this mean and what are the implications?
Success is what counts.
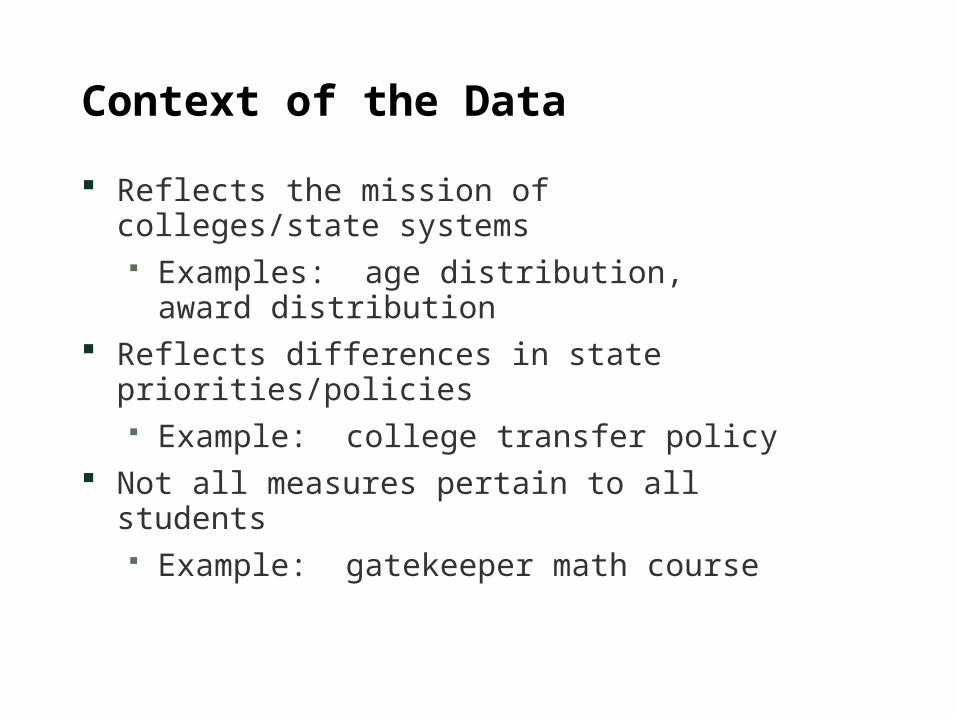
Context of the Data
Reflects the mission of colleges/state systems Examples: age distribution, award distribution
Reflects differences in state priorities/policies Example: college transfer policy
Not all measures pertain to all students Example: gatekeeper math course
Success is what counts.
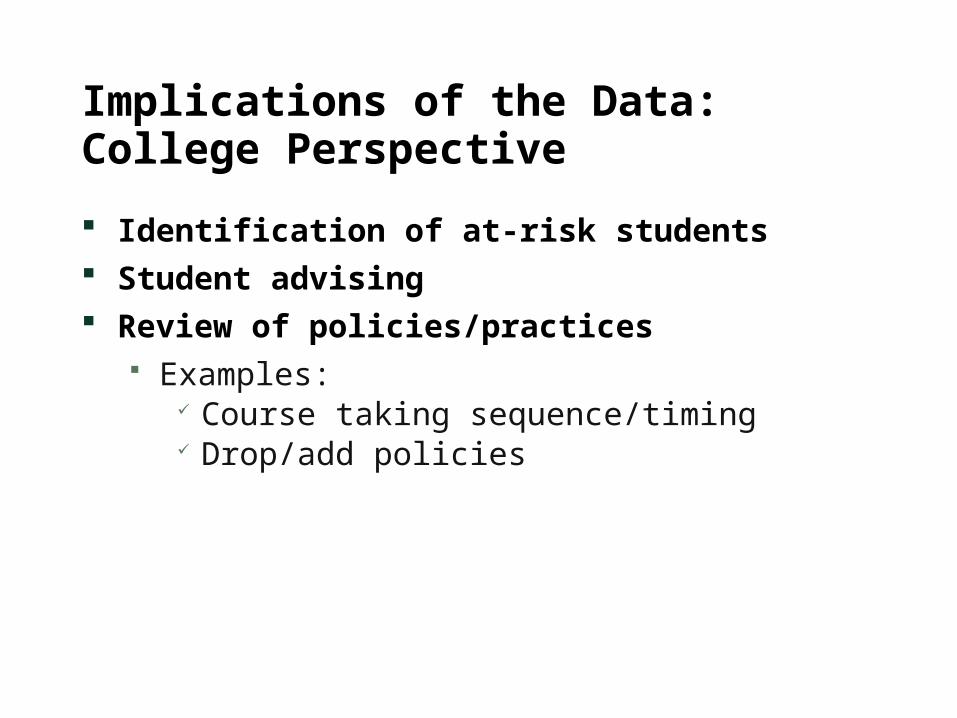
Implications of the Data: College Perspective
Identification of at-risk students Student advising Review of policies/practices
Examples: Course taking sequence/timing Drop/add policies
Success is what counts.
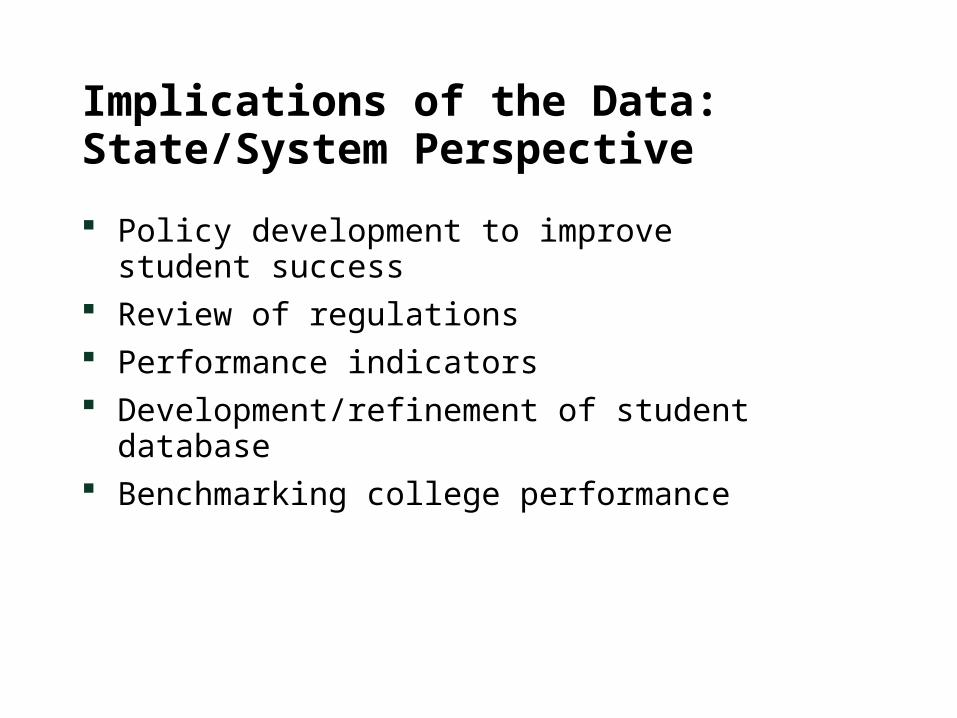
Implications of the Data: State/System Perspective
Policy development to improve student success Review of regulations Performance indicators Development/refinement of student database Benchmarking college performance
Success is what counts.
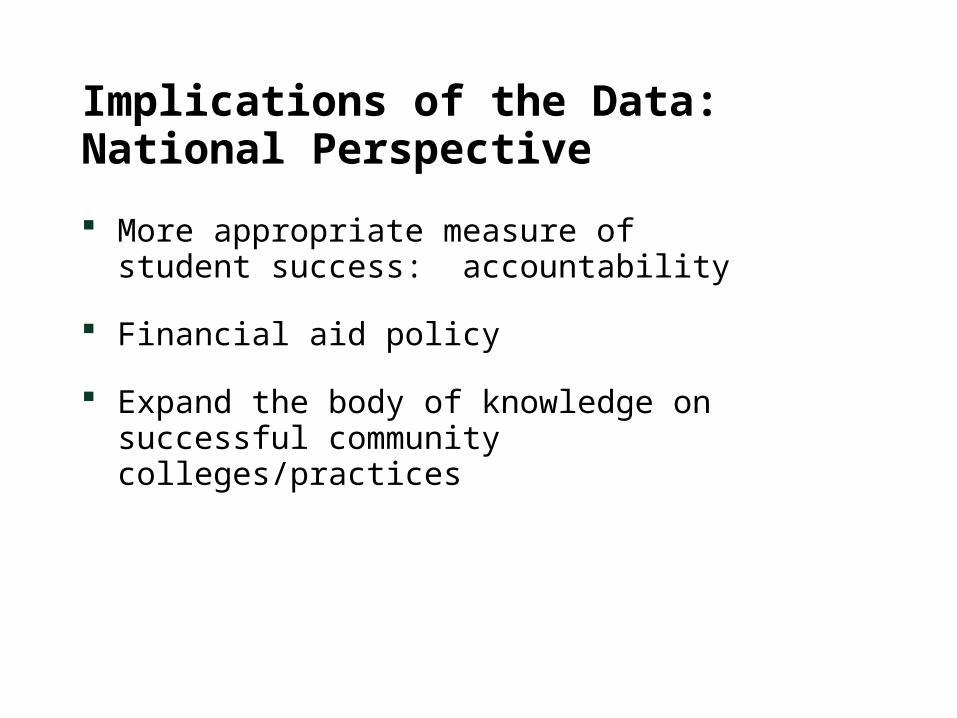
Implications of the Data: National Perspective
More appropriate measure of student success: accountability
Financial aid policy
Expand the body of knowledge on successful community colleges/practices

Success is what counts.
Questions?
Success is what counts.
Achieving the DreamSuccess is what counts.www.achievingthedream.org
Chris Baldwin – [email protected] DirectorJobs for the FutureBoston, MA