Embed Size (px)
Citation preview
New York State Office of the State ComptrollerThomas P. DiNapoli
Division of State Government Accountability
Report 2014-S-23 April 2016
Subway Wait Assessment
Metropolitan Transportation Authority New York City Transit
2014-S-23
Division of State Government Accountability 1
Executive SummaryPurposeTo determine whether New York City Transit (Transit) provides passengers service on all of its lines that meets its minimum service frequency standards; whether those standards take into account demand for service, physical structure, and other factors; and where Transit fails to meet the wait assessment, whether it determines the causes and takes corrective action to address them. The audit primarily covers the period March 1, 2013 through February 6, 2015.
BackgroundTransit is a constituent agency of the Metropolitan Transportation Authority (MTA). It serves an average 5.5 million weekday passengers on its 23 subway lines (which includes three shuttle lines). From the original 28 stations built in Manhattan and opened on October 27, 1904, the subway system has grown to 469 stations, most of which were built by 1940.
Wait assessment is a statistic that measures the ability of Transit to provide evenly spaced subway service in conformance with the headways (time between trains) in the official schedule. The assessment determines the number of intervals between trains that meet the standard (headway plus 25 percent) and those that do not. In terms of its stance on the importance of this statistic, Transit has given it a 60 percent weighting of the three components that make up the Service-Key Performance Indicator.
The System Data & Research Division of Operations Planning at Transit calculates the wait assessment statistic based on computerized train tracking information for the numbered subway lines (except the 7 line) and from random sample observations for the remaining lines. This unit generates reports that are used within the Operations Planning (OP) unit. The reports are also reviewed on a monthly basis at the MTA Transit & Bus Committee Meetings. The Rail Control Center (RCC) of the Department of Subways maintains the evenness of service and compliance with the schedule.
Key Findings • The MTA has stated that “wait assessment” is the best way to measure customer experience
with respect to service reliability. However, wait assessment performance did not improve during our audit period. The goal for meeting the weekday wait assessment standard was 79.4 percent for 2013 and 80.7 percent for 2014 and 2015, with the actual results of 80.3 percent for 2013 and 78.8 percent for 2014. As of June 2015, the year-to-date assessment performance was 78.4 percent or 2.3 percent below the standard.
• Wait assessment was calculated as a simple mathematical average: the wait assessment percentages for each line were added and the sum divided by the number of lines. This approach lets smaller lines that operate less frequently or shuttle services that provide limited service to carry the same weight in the overall average as a line that runs more frequently over a longer distance. For example, the E train with 199 trains and wait assessment of 74.5 percent and the C train with 108 trains per weekday and a wait assessment of 81 percent carry equal weight in the overall system-wide average. This likely resulted in higher system-wide averages for wait
2014-S-23
Division of State Government Accountability 2
assessment, as lines with lower frequency and shuttles tend to have better wait assessment rates than lines that run more frequently. Further, the public is not made aware of this.
• Transit addresses on a day-to-day basis the immediate causes for not meeting wait assessment goals. However, Transit has not developed a full and comprehensive plan to deal with the long-term causes of service disruptions, including matters related to major structural and technology improvements.
Key Recommendations • Formally assess and revise as necessary the methodologies used to calculate and report wait
time performance data. Appropriately weight the performance statistics of the various lines and shuttles and promote full and transparent disclosure of such data.
• Develop a comprehensive and detailed long-term plan to address the reasons wait assessment performance has decreased. Such a plan should include the structural and information technology improvements that are needed, as well as timeframes and cost estimates to make the required improvements.
Other Related Audit/Report of InterestMetropolitan Transportation Authority – New York City Transit: Train On-Time Performance (2014-S-56)
2014-S-23
Division of State Government Accountability 3
State of New YorkOffice of the State Comptroller
Division of State Government Accountability
April 6, 2016
Mr. Thomas F. PrendergastChairman and Chief Executive OfficerMetropolitan Transportation Authority2 BroadwayNew York, NY 10004
Dear Mr. Prendergast:
The Office of the State Comptroller is committed to helping State agencies, public authorities, and local government agencies manage their resources efficiently and effectively. By so doing, it provides accountability for tax dollars spent to support government operations. The Comptroller oversees the fiscal affairs of State agencies, public authorities, and local government agencies, as well as their compliance with relevant statutes and their observance of good business practices. This fiscal oversight is accomplished, in part, through our audits, which identify opportunities for improving operations. Audits can also identify strategies for reducing costs and strengthening controls that are intended to safeguard assets.
Following is a report of our audit of Subway Wait Assessment at the Metropolitan Transportation Authority-New York City Transit. This audit was performed pursuant to the State Comptroller’s authority under Article X, Section 5 of the State Constitution and Section 2803 of the Public Authorities Law.
This audit’s results and recommendations are resources for you to use in effectively managing your operations and in meeting the expectations of taxpayers. If you have any questions about this report, please feel free to contact us.
Respectfully submitted,
Office of the State ComptrollerDivision of State Government Accountability
2014-S-23
Division of State Government Accountability 4
State Government Accountability Contact Information:Audit Director: Carmen MaldonadoPhone: (212) 417-5200Email: [email protected]:
Office of the State Comptroller Division of State Government Accountability 110 State Street, 11th Floor Albany, NY 12236
This report is also available on our website at: www.osc.state.ny.us
Table of ContentsBackground 5
Audit Findings and Recommendations 7
Wait Assessment Data Analysis 7
Planning Actions to Address Wait Assessment Problems 9
Service Frequency Guidance 10
Recommendations 10
Audit Scope and Methodology 11
Authority 12
Reporting Requirements 12
Contributors to This Report 13
Exhibit 14
Agency Comments and State Comptroller’s Comments 15
2014-S-23
Division of State Government Accountability 5
BackgroundNew York City Transit (Transit) is a constituent agency of the Metropolitan Transportation Authority (MTA) that provides bus and subway service within the City of New York. Transit serves an average 5.5 million weekday passengers on its 20 interconnected subway lines and three shuttles.
Transit’s Department of Subways (Subways), Rapid Transit Operations Division (RTO) is responsible for the day-to-day management and operation of the subway, from its Rail Control Center (RCC) to the train operators and conductors who staff the trains. Transit’s Office of the Executive Vice President, Operations Planning Division (OP) is responsible for developing the bus and subway schedules and for collecting and analyzing data regarding system operations.
Subway train schedules are developed to meet approved service guidelines. These guidelines establish the base headway, or the frequency interval between trains of the same line (for example, every 10 minutes). Loading guidelines determine how much subway service should be provided based on the number of customers on a train during certain time periods and may call for more frequent trains and shorter headways based on volume of passengers.
Transit has minimum service frequency guidelines, for weekdays and weekends by time of day, as summarized in the following table.
Wait assessment is measured on all of Transit’s subway lines, however, it is not measured during the midnight to six a.m. period, because service is less frequent. The goal for meeting the weekday wait assessment standard was 79.4 percent for 2013 and 80.7 percent for 2014 and 2015. Transit officials acknowledge that delays and incidents throughout the system can sometimes lead to excessive wait times.
The wait assessment measure is reported to the Transit and Bus Committee of the MTA Board on a monthly basis. The public can view wait assessment data by line on the MTA website under Transparency, Performance Indicators. (Note: The Staten Island Railway does not measure wait assessment, because its priority is for trains to connect with the Staten Island Ferry.)
2014-S-23
Division of State Government Accountability 6
OP’s System Data & Research Division calculates the wait assessment statistic and generates reports that are used within the OP unit and reported to the Board committee. For the numbered subway lines 1-6 and the Times Square-Grand Central Shuttle, the data is taken from the RCC’s Automatic Train Supervision computer system. For the rest of the subway lines, the information is generated from data collected by a staff of traffic checkers who make observations at a random sample of times and locations throughout the subway system to collect information on the actual operation of trains. The traffic checkers serve other functions, including the observations of the number of customers in each train. Traffic checkers record information either electronically or on paper, and report the information to OP for further analysis.
The RCC supervises service throughout the subway system in general, but also tries to maintain the evenness of the service in an attempt to maintain the wait time in accordance with the schedule. It is also responsible for coordinating the handling of train delay incidents, by sending resources such as mechanical personnel, police, and ambulance crews to the site of an incident, and by instructing train crews, tower operators, and field supervision on their activities. For example, RCC can hold back trains if they are early, tell crews to skip stops to catch up if they are late, or order trains to be re-routed around major delays.
2014-S-23
Division of State Government Accountability 7
Audit Findings and RecommendationsAlthough Transit met the overall wait assessment goal for 2013, it did not meet the goal established for 2014. Overall wait time performance declined between March 2013 and August 2014 as well. Further, there were notable deficiencies in the wait assessment data reported by Transit. Specifically, statistical projection methodologies were not disclosed and appropriate weightings of line data were not used to calculate overall system performance. Also, Transit lacks a formal comprehensive long-term plan to address major structural and technology needs directly affecting wait assessment.
Based on Transit’s maximum headway guidelines, shown in the table on page 5, just 57 percent of the week is covered. The transition periods account for another 18 percent of the week. The remaining 25 percent of the week is not covered by a minimum frequency service standard mainly because Saturday and Sunday are undefined. Transit officials told us they provide weekend service using ridership information and they ramp up service during the day, which changes wait assessment. Thus the weekend riders are subject to less assurance related to the minimal interval between trains.
Wait Assessment Data Analysis
As noted previously, Transit had system-wide goals for weekday wait assessment (79.4 percent for 2013 and 80.7 percent for 2014) and individual goals for each line. Although Transit’s actual wait assessment performance met or exceeded system-wide goals for 2013 (80.3 percent of the time), Transit did not meet the overall goal for 2014 (when standards were met only 78.8 percent of the time). Excluding shuttle lines, in the A Division (or numbered lines), the 1 line was the best and the 5 line was the worst in both years. In the B Division (or lettered lines), the best lines were the C in 2013 and the D in 2014, and the A line was the worst in both years (73.7 percent in 2013 and 69.6 percent in 2014).
Riders who depend on the subway system for their daily transportation should be able to ascertain its timeliness on a continuous and current basis. However, at any one time, the official wait assessment data published by Transit is a moving average of the prior 12 months. A moving average tends to smooth out short-term fluctuations. If there is either significant improvement or a spate of problems in a particular month, passengers might expect the wait assessment to show marked change for that month. Instead, because the 11 previous months are included in the results, such changes are muted. Further, Transit can (but does not) provide the Board and the public with actual monthly results for the A division. Also, Transit cannot provide usable monthly statistical results for the B division because the sample sizes for individual months are too small for valid statistical projection.
Often, when sample results are published, the sample methodology is disclosed. However, Transit officials had not formally disclosed their complete sample projection methodology until the auditors requested the information. Generally, users of statistical sample projections need this information so they may properly evaluate the results. For example, pollsters often state
2014-S-23
Division of State Government Accountability 8
pertinent poll characteristics, such as a confidence level of 95 percent and an error rate of plus or minus 3 percent. This would tell the user that the true result of the sample lies between two values. However, Transit only discloses the point estimate (and not the range) of its sample results. Nor does Transit indicate the confidence or precision levels of its estimates. As such, users have limited information about the meaning of Transit’s sample projections.
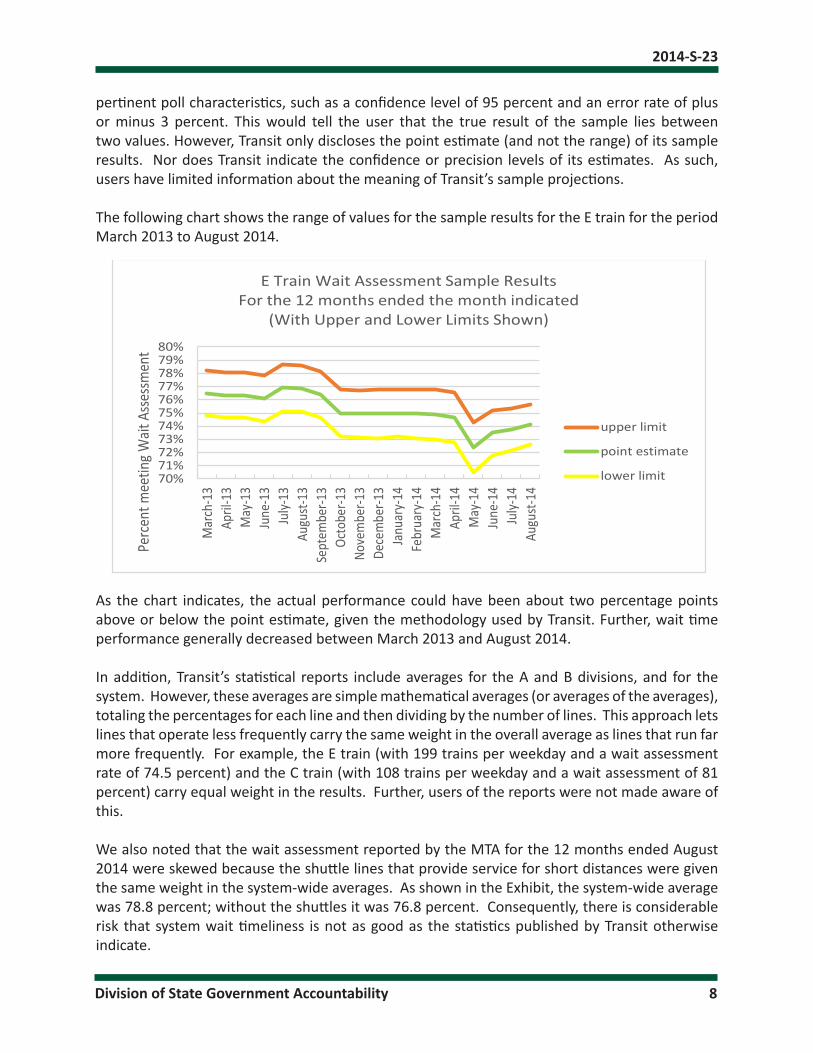
The following chart shows the range of values for the sample results for the E train for the period March 2013 to August 2014.
As the chart indicates, the actual performance could have been about two percentage points above or below the point estimate, given the methodology used by Transit. Further, wait time performance generally decreased between March 2013 and August 2014.
In addition, Transit’s statistical reports include averages for the A and B divisions, and for the system. However, these averages are simple mathematical averages (or averages of the averages), totaling the percentages for each line and then dividing by the number of lines. This approach lets lines that operate less frequently carry the same weight in the overall average as lines that run far more frequently. For example, the E train (with 199 trains per weekday and a wait assessment rate of 74.5 percent) and the C train (with 108 trains per weekday and a wait assessment of 81 percent) carry equal weight in the results. Further, users of the reports were not made aware of this.
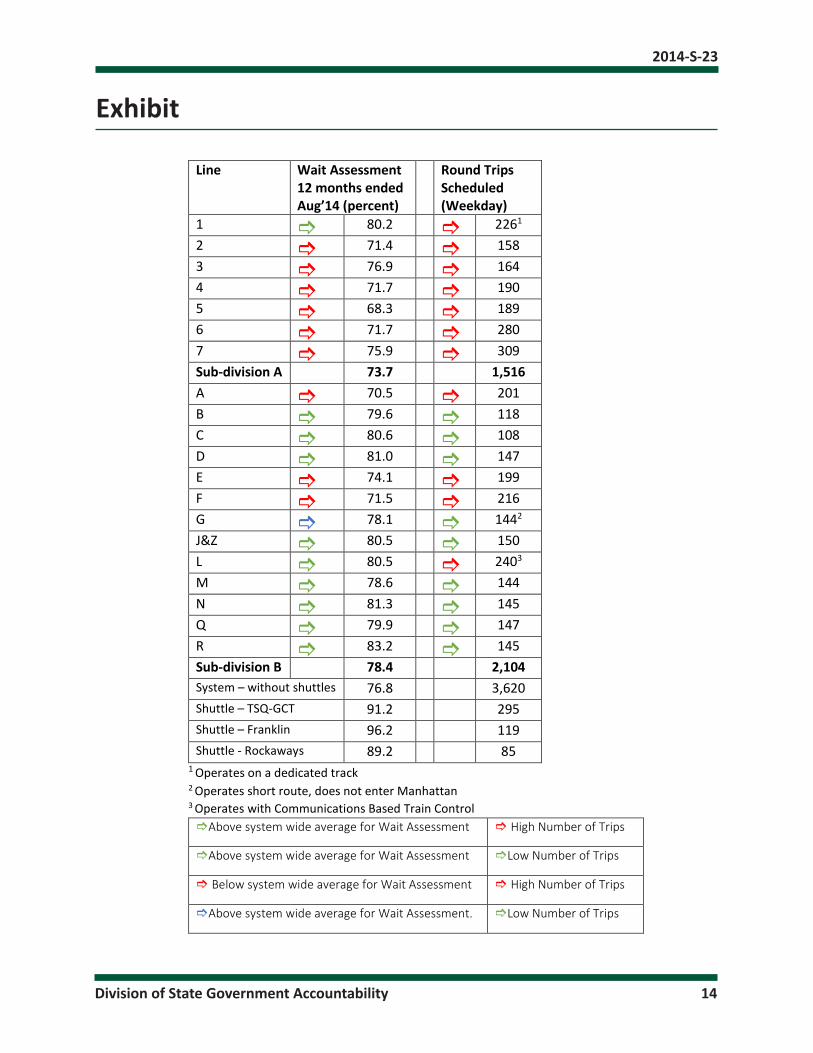
We also noted that the wait assessment reported by the MTA for the 12 months ended August 2014 were skewed because the shuttle lines that provide service for short distances were given the same weight in the system-wide averages. As shown in the Exhibit, the system-wide average was 78.8 percent; without the shuttles it was 76.8 percent. Consequently, there is considerable risk that system wait timeliness is not as good as the statistics published by Transit otherwise indicate.
70%71%72%73%74%75%76%77%78%79%80%
Mar
ch-1
3Ap
ril-1
3M
ay-1
3Ju
ne-1
3Ju
ly-13
Augu
st-13
Sept
embe
r-13
Octo
ber-1
3No
vem
ber-1
3De
cem
ber-1
3Ja
nuar
y-14
Febr
uary
-14
Mar
ch-1
4Ap
ril-1
4M
ay-1
4Ju
ne-1
4Ju
ly-14
Augu
st-14
Perc
ent m
eetin
g Wait
Ass
essm
ent
E Train Wait Assessment Sample ResultsFor the 12 months ended the month indicated
(With Upper and Lower Limits Shown)
upper limit
point estimate
lower limit
2014-S-23
Division of State Government Accountability 9
Planning Actions to Address Wait Assessment Problems
Delays and incidents throughout the subway system caused Transit not to meet the established wait assessment goals. OP’s System Data & Research Division and Subways’ RCC work together to determine the types of incidents that affect wait assessment. The information is passed along to the other divisions of Transit to advise them of their share of responsibility for not meeting the wait assessment goal.
On a daily basis, RCC monitors train operations and manages service delivery. One of its primary functions is to handle service disruptions in a manner that minimizes delays. According to the “Control Center Console Dispatcher Induction Training Unit 3.2 - Delay Management (Protocol),” there are seven steps to follow in the event of a delay that prevents normal train movement. We observed RCC and selected tower personnel who, on February 5 and 6, 2015, managed 41 incidents where personnel manning the console dispatcher’s desk, the towers, or in the field were required to take action to address the incident. We noted that the console operator was in overall compliance with the procedures for handling incidents as they occur.
In regard to causes and corrective action, the MTA’s 2015-2019 Capital Program cites signals as being the leading cause for subway service delays and calls for modernization of signal and communication systems. Modernizing signal technologies could increase line capacity by allowing trains to operate with narrower headways. Further, Transit intends to modernize a number of interlockings (areas where trains can be switched from track to track) within the next four to five years, as a prerequisite to conversion to the newer technology, Communications Based Train Control (CBTC). CBTC is a proven technology that increases train capacity by permitting trains to operate closer together.
However, according to the MTA’s 20-year capital needs assessment, progress toward CBTC will remain slow. The assessment calls for replacement of antiquated signals as well as modernization of half of the system to CBTC by 2034 – nearly two decades away. The currently released assessment does not forecast whether or when the remainder of the system will be changed to CBTC. Moreover, as the current capital plan has decreased the number of interlockings to be modernized in the next five years, it is unclear how this impacts the current timeline.
In response to our preliminary findings, Transit officials wrote about the existence of 11 committees and two task forces that address the delays throughout the subway system. They also presented initiatives, such as the String Line and Gap Table pilot programs, which were established as a result of meetings held within these groups. These pilot programs were developed to provide information to the RCC console operators (numbered lines only) to help maintain the evenness of train service. If gaps in service develop, these tables can advise the operator of uneven headways so the operator can decide to implement actions to correct the headways.
However, this information was neither new (nor contradictory) to our finding, as these only address the immediate issues regarding delays. There was no documentation supplied that noted timeframes for achievement, anticipated cost savings (or costs incurred), or level of improvement in the metric expected or achieved as a result of implemented measures. As such, we could not
2014-S-23
Division of State Government Accountability 10
evaluate plans in place to finish the work that these committees initiated.
Service Frequency Guidance
As previously noted, Transit has minimum service frequency guidelines; however, they do not cover every hour of every day of the week. Specifically, about 25 percent of the week is not covered, mainly because minimum frequency standards have not been established for most of Saturday and Sunday. Transit officials told us they provide weekend service using ridership information, and they ramp up service as needed to manage wait times. Nevertheless, without service frequency standards by time of day, riders have less assurance about the intervals between trains.
Also, loading guidelines (which apply to all lines in the system) stipulate that train frequency, when feasible, should be based on two factors: (1) minimum service frequencies, which vary by time of day and day of week; and (2) maximum average loads, which vary depending on service frequency during peak hours. Service frequencies established by the loading guidelines are based on the number of riders when trains are most crowded during the highest ridership hour. However, according to Transit staff, the adjustments they can make are limited by physical restrictions and other factors, such as construction work.
Adjustments to train frequencies are often initiated based on observations made by “traffic checkers.” Checkers are sent to all lines to survey both the level and times of service throughout the subway system. The data collected by checkers indicates if service needs to be increased or decreased based on the number of customers using the system during a particular period. Transit officials indicated and documented that there are six lines that run at maximum capacity during the weekday peak periods. OP staff advised us that portions of the system are at capacity during parts of the rush hour, meaning that Transit cannot increase the frequency of service to respond to passenger demand. Moreover, capacity improvements, if possible, may require new signal system technology, which is very costly, and MTA estimates in its 20-year capital needs assessment that it will take decades to fully implement.
In the meantime, we concluded that Transit should advise the public of congested areas and times so that passengers can better plan their trips to avoid overcrowding and help alleviate congestion. Transit stated that it lacked the resources to provide real-time information on overcrowding by line, station, and location. However, the real-time data collected by the checkers could be used to advise the public of overcrowding and possible alternatives to enable riders to revise their travel plans, which could ease overcrowding at stations meeting or exceeding maximum capacity.
Recommendations
1. Disclose pertinent details of statistical projection methodologies, including the confidence and error precision levels, when publishing wait time performance data.
2. Formally assess and revise as necessary the methodologies used to calculate and report wait
2014-S-23
Division of State Government Accountability 11
time performance data. Appropriately weight the performance statistics of the various lines and shuttles and promote full and transparent disclosure of such data.
3. Develop a comprehensive and detailed long-term plan to address the reasons wait assessment performance has decreased. Such a plan should include the structural and information technology improvements that are needed, as well as timeframes and cost estimates to make the required improvements.
4. Formally assess and revise as necessary the minimum frequency guidelines to address days (particularly the weekends) and hours not covered by specific standards.
5. Develop and implement a process whereby real-time data obtained by traffic checkers is used to advise patrons of delays and potential alternative lines to help alleviate congestion.
Audit Scope and Methodology We audited Transit to determine whether it provides passengers service on all of its lines that meets its minimum service frequency standards; whether those standards take into account demand for service, physical structure, and other factors; and whether it determines the cause and takes corrective action where it fails to meet the wait assessment. The audit covered the period from March 1, 2013 through February 6, 2015.
To accomplish our objectives, we reviewed policies, procedures, and guidelines related to gathering data, computing, and managing wait assessment. We interviewed Transit’s Operations Planning and Department of Subways officials and employees to obtain an understanding of the internal controls related to wait assessment. We observed data collection by the checkers, maintenance of the evenness of trains by the Rail Control Center, and computation of the wait assessment statistic by the Operations Planning personnel. We reviewed the supporting documentation for the computation of the wait assessment statistic. We surveyed other transit authorities, reviewed the Collective Bargaining Agreement between Transit and the Transport Workers Union, and reviewed the 2010-14 and 2015-19 capital programs.
We conducted our performance audit in accordance with generally accepted government auditing standards. Those standards require that we plan and perform the audit to obtain sufficient, appropriate evidence to provide a reasonable basis for our findings and conclusions based on our audit objectives. We believe that the evidence obtained provides a reasonable basis for our findings and conclusions based on our audit objectives.
In addition to being the State Auditor, the Comptroller performs certain other constitutionally and statutorily mandated duties as the chief fiscal officer of New York State. These include operating the State’s accounting system; preparing the State’s financial statements; and approving State contracts, refunds, and other payments. In addition, the Comptroller appoints members to certain boards, commissions, and public authorities, some of whom have minority voting rights. These duties may be considered management functions for purposes of evaluating organizational
2014-S-23
Division of State Government Accountability 12
independence under generally accepted government auditing standards. In our opinion, these functions do not affect our ability to conduct independent audits of program performance.
AuthorityThe audit was performed pursuant to the State Comptroller’s authority as set forth in Article X, Section 5 of the State Constitution and Section 2803 of the Public Authorities Law.
Reporting RequirementsWe provided a draft copy of this report to MTA officials for their review and formal comment. Their comments were considered in preparing this final report and are attached in their entirety at the end of the report. MTA officials generally disagreed with the audit’s conclusions and recommendations. Officials asserted that current initiatives (including the activities of various committees, task forces, and working groups) were sufficient to address short- and long-term wait assessment concerns, although the tangible benefits of these activities were unclear, and there has been a decline in wait assessment performance in recent years, as detailed in the report. Also, our rejoinders to certain MTA comments are included in the report’s State Comptroller’s Comments, which are embedded within the MTA’s response.
Within 90 days after final release of this report, as required by Section 170 of the Executive Law, the Chairman of the Metropolitan Transportation Authority shall report to the Governor, the State Comptroller, and the leaders of the Legislature and fiscal committees, advising what steps were taken to implement the recommendations contained herein, and where recommendations were not implemented, the reasons why.
2014-S-23
Division of State Government Accountability 13
Division of State Government Accountability
Andrew A. SanFilippo, Executive Deputy Comptroller518-474-4593, [email protected]
Tina Kim, Deputy Comptroller518-473-3596, [email protected]
Brian Mason, Assistant Comptroller518-473-0334, [email protected]
Vision
A team of accountability experts respected for providing information that decision makers value.
Mission
To improve government operations by conducting independent audits, reviews and evaluations of New York State and New York City taxpayer financed programs.
Contributors to This ReportCarmen Maldonado, Audit DirectorRobert C. Mehrhoff, Audit ManagerMyron Goldmeer, Audit Supervisor
Anthony Belgrave, Examiner-in-ChargeJean-Renel Estime, Senior Examiner
Rupert Wilmot-Dunbar, Senior Examiner
2014-S-23
Division of State Government Accountability 14
Exhibit
1
Line Wait Assessment 12 months ended Aug’14 (percent)
Round Trips Scheduled (Weekday)
1 80.2 2261 2 71.4 158 3 76.9 164 4 71.7 190 5 68.3 189 6 71.7 280 7 75.9 309 Sub-division A 73.7 1,516 A 70.5 201 B 79.6 118 C 80.6 108 D 81.0 147 E 74.1 199 F 71.5 216 G 78.1 1442 J&Z 80.5 150 L 80.5 2403 M 78.6 144 N 81.3 145 Q 79.9 147 R 83.2 145 Sub-division B 78.4 2,104 System – without shuttles 76.8 3,620 Shuttle – TSQ-GCT 91.2 295 Shuttle – Franklin 96.2 119 Shuttle - Rockaways 89.2 85
1 Operates on a dedicated track 2 Operates short route, does not enter Manhattan 3 Operates with Communications Based Train Control Above system wide average for Wait Assessment High Number of Trips
Above system wide average for Wait Assessment Low Number of Trips
Below system wide average for Wait Assessment High Number of Trips
Above system wide average for Wait Assessment. Low Number of Trips
2014-S-23
Division of State Government Accountability 15
Agency Comments and State Comptroller’s Comments
2014-S-23
Division of State Government Accountability 16
DNewYorkCityTransit
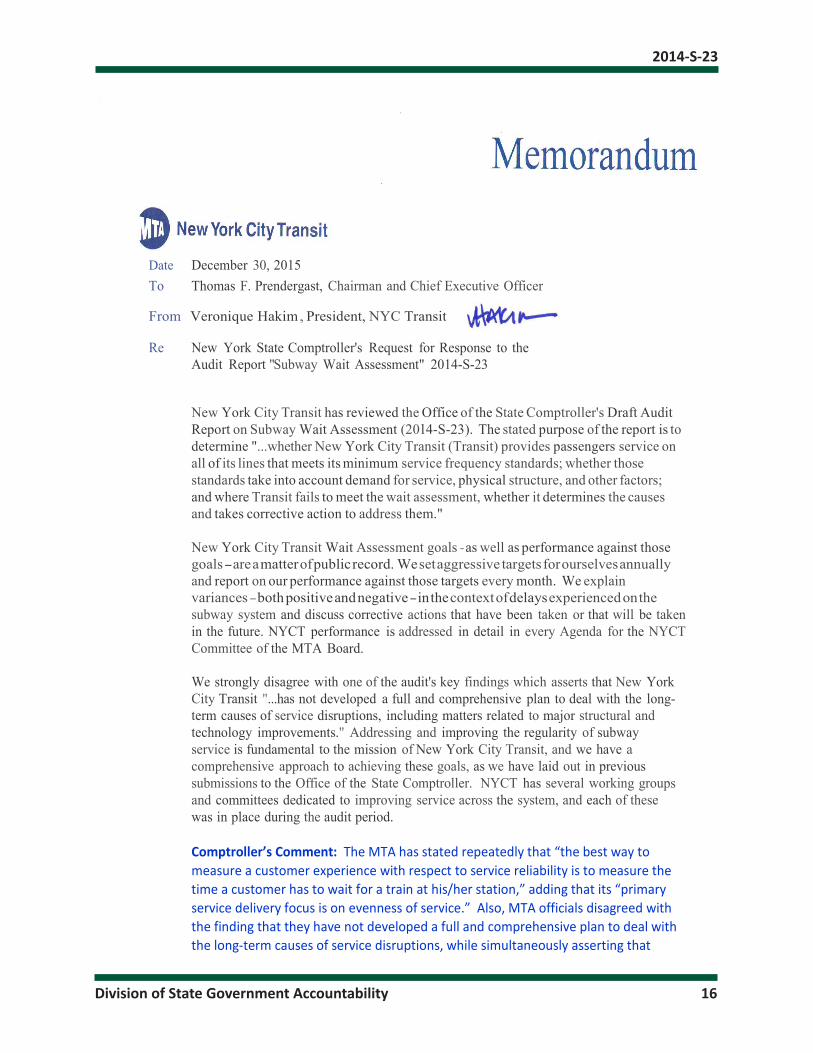
Date December 30, 2015To Thomas F. Prendergast, Chairman and Chief Executive Officer
From Veronique Hakim, President, NYC Transit
Re New York State Comptroller's Request for Response to theAudit Report "Subway Wait Assessment" 2014-S-23
New York City Transit has reviewed the Office of the State Comptroller's Draft AuditReport on Subway Wait Assessment (20l4-S-23). The stated purpose of the report is todetermine "...whether New York City Transit (Transit) provides passengers service onall of its lines that meets its minimum service frequency standards; whether thosestandards take into account demand for service, physical structure, and other factors;and where Transit fails to meet the wait assessment, whether it determines the causesand takes corrective action to address them."
New York City Transit Wait Assessment goals -as well as performance against thosegoals-areamatterofpublicrecord. Wesetaggressive targetsforourselvesannuallyand report on our performance against those targets every month. We explainvariances-bothpositiveandnegative-inthecontextofdelaysexperiencedonthesubway system and discuss corrective actions that have been taken or that will be takenin the future. NYCT performance is addressed in detail in every Agenda for the NYCT Committee of the MTA Board.
We strongly disagree with one of the audit's key findings which asserts that New YorkCity Transit "...has not developed a full and comprehensive plan to deal with the long-term causes of service disruptions, including matters related to major structural and technology improvements." Addressing and improving the regularity of subwayservice is fundamental to the mission of New York City Transit, and we have acomprehensive approach to achieving these goals, as we have laid out in previous submissions to the Office of the State Comptroller. NYCT has several working groupsand committees dedicated to improving service across the system, and each of these was in place during the audit period.
Comptroller’s Comment: The MTA has stated repeatedly that “the best way to measure a customer experience with respect to service reliability is to measure the time a customer has to wait for a train at his/her station,” adding that its “primary service delivery focus is on evenness of service.” Also, MTA officials disagreed with the finding that they have not developed a full and comprehensive plan to deal with the long-term causes of service disruptions, while simultaneously asserting that
2014-S-23
Division of State Government Accountability 17
Audit Report 2014-S-23December 30, 2015
Transit “does not have a single, stand-alone plan or policy to provide timely and even service and to improve wait assessment, nor should we” (page 23 of this report). Officials argue, instead, that they focus on high quality service. However, subway wait assessment, as the MTA has repeatedly stated, is the proxy for high quality service (Transit’s “primary customer service indicator”), and it continues to fall along with on-time performance. Without a plan with specific goals, the steps to achieve those goals, a clear statement of what resources are required to achieve the goals, and a formal timeline for task implementation and completion, it is unclear how the MTA expects to reverse the trend of declining performance.
We also disagree with the Comptroller's finding that calculating Wait Assessment as asystemwide average of the Wait Assessment scores for all subway lines operated resultsin higher system-wide averages for Wait Assessment in any meaningful way. Whilewe agree that weighting line-level Wait Assessment by service frequency to producesubdivision and systemwide averages would be ideal, the difference in how wecalculate Wait Assessment (full data on some lines vs. sampling on others) precludes our doing so at this time. We expect to re-visit the issue as full data becomes available on more lines. We also do not agree with the audit recommendation to exclude short-distance shuttles from the Wait Assessment calculation, particularly since the 42nd
Street shuttle has a high number of scheduled trips.
Comptroller’s Comment: MTA officials agree that weighting service frequency to produce system wide averages would be “ideal.” However, they state that they are precluded from doing so because it would be “methodologically unsound and create the illusion of statistical accuracy” (page 19 of this report). This is puzzling. It is illogical that MTA officials would prefer to keep its current process, which is both methodologically unsound and less accurate than a weighted average, because they do not wish anyone to believe that what they are reporting to the public is statistically accurate.
Below is a summary of the New York City Transit response to the Office of StateComptroller's draft audit findings and recommendations.
Response to Executive Summary Key Findings
Comptroller Key Finding 1: The MTA has stated that "wait assessment" is the best wayto measure customer experience with respect to service reliability. However, waitassessment performance did not improve during our audit period. The goal for meetingthe weekday wait assessment standard was 79.4 percent for 2013 and 80.7 percent for2014, with the actual results of 80.3 percent for 2013 and 78.8 percent for 2014. As ofJune 2015, the year to date was 78.4percent or 2.8percent below the standard.
We agree that Wait Assessment declined during the audit period, and have reported thisdecline in monthly performance reports to the New York City Transit Committee of theMTA Board. Detail on our plan for improving Subway Wait Assessment is discussedfurther within the remainder of this audit response.
2014-S-23
Division of State Government Accountability 18
Audit Report 2014-S-23December 30, 2015
Comptroller Key Finding 2: Wait assessment was calculated as a simple mathematicalaverage: the wait assessment percentages for each line were added and the sum dividedbythenumberof lines.Thisapproachletssmaller linesthatoperate less frequently orshuttleservices thatprovide limitedservice tocarrythesameweight intheoverallaverageasalinethatrunsmorefrequentlyoveralongerdistance.Forexample, theEtrain with 199 trains and wait assessment of 74.5 percent and the C train with 108trainsper weekdayandawaitassessment of81percent carryequalweight intheoverall system-wide average. This likely resulted in higher system-wide averagesforwail assessment, as lines with lowerfrequency tend to have better wait assessmentrates than lines that run more frequently. Further, the public is not made aware of this.
We disagree that New York City Transit's methodology leads to overstatement ofsystemwide Wait Assessment in any meaningful manner. Revising the weightingfactor to utilize the frequency of service has little effect. For example, in August 2014,Wait Assessment would change from 75.9% on the A Division under the current methodology to 76.7% with lines weighted by train frequency and to 73.9% with linesweighted by frequency excluding the Shuttles. Similarly, in August 2014, WaitAssessment would change from 80.3% on the B Division under the currentmethodology to 79.3% with lines weighted by train frequency and to 77.9% with linesweighted by frequency excluding the Shuttles.
Comptroller’s Comment: Based on MTA's own calculations, if service frequency was weighted and shuttles were not included, wait assessment would be decreased by 2 percentage points on the A Division and 2.4 percentage points on the B Division for the month examined. Further, officials claim that these overstatements are not meaningful. However, we believe MTA patrons are entitled to the most accurate data available and should decide what is (or is not) meaningful - and not the MTA.
Over the course of the audit period, Wait Assessment on the A and B Divisions of the subway system was collected using different methodologies:
• On most of the A Division (lines through ), as well as the 42nd StreetShuttle), Wait Assessment is collected automatically based on track occupancydata contained in the Automatic Train Supervision (ATS) system; this allowsfor a 100 percent sample every day, 6:00 a.m. to Midnight.
• On the B Division Lines (lettered lines, plus the Franklin Avenue andRockaway Park Shuttles), as well as theLine of the A Division , WaitAssessment is collected through a statistical sampling of manual field surveysundertaken by NYCT Operations Planning staff (Traffic Checkers). On the BDivision, therefore, individual line Wait Assessment data is not statisticallysignificant on a monthly basis, but must be aggregated over at least twelvemonths to achieve statistical accuracy with an error margin of less than +/- 2%.
We agree that division and systemwide Wait Assessment averages ought to reflect therelative frequencies of service on individual lines. However, given the two divergentmethodologies for collecting Wait Assessment data, aggregating the data into divisionand systemwide averages in any way other than the simple average of the individual
2014-S-23
Division of State Government Accountability 19
Audit Report 2014-S-23December 30, 2015
lines would be methodologically unsound and create an illusion of statistical accuracy.NYCT intends to re-visit this issue as full data collection from electronic sourcesbecomes available on more lines.
Comptroller’s Comment: MTA officials agree that weighting service frequency to produce system wide averages would be “ideal.” However, they state that they are precluded from doing so because it would be “methodologically unsound and create the illusion of statistical accuracy”. This is puzzling. It is illogical that MTA officials would prefer to keep its current process, which is both methodologically unsound and less accurate than a weighted average, because they do not wish anyone to believe that what they are reporting to the public is statistically accurate.
Comptroller Key Finding 3: Transit addresses on a day-to-day basis the immediatecauses for not meeting wait assessment goals. However, Transit has not developed afull and comprehensive plan to deal with the long term causes of service disruptions,including matters related to major structural and technology improvements.
We strongly disagree with the assertion that New York City Transit lacked anunderstanding of the reasons for declining Wait Assessment and that we did not have aplan in place to improve Wait Assessment. On May 18, 2015, New York City Transitmanagement delivered a detailed presentation on this issue to the MTA Transit and BusCommittee that included a summary of root cause delay and service analyses alongwith corresponding action plans to increase service reliability. These analyses wereunderway during the audit period; in fact, on December 15, 2014, during the auditfieldwork, New York City Transit management gave a special report at the MTATransit and Bus Committee meeting outlining our latest service analyses and actionplans.
Comptroller’s Comment: On page 9, our report states that the “MTA’s 2015-19 Capital Program cites signals as being the leading cause for subway delays.” It is therefore unclear why the MTA asserts that the report claims that Transit lacked an understanding of the reasons for declining wait time performance. Also, similar to report 2014-S-56 MTA-Transit “Train On-Time Performance,” the MTA lists (as evidence of its planning efforts) 11 work groups and two task forces to address the issues of service delays. However, as we pointed out in that report, these groups lacked specific time frames for actions to be implemented, measurable goals and outcomes, and detailed information on the results achieved. Consequently, we concluded that the actions of the work groups and task forces fell rather short of what would normally be expected of a comprehensive formal plan.
Thus, contrary to the Draft Audit Report, New York City Transit understands thecauses of the decline in wait assessment and has comprehensive long-term plans toaddress it. This is based on several major studies, ongoing analyses, and other research.Broadly speaking, the decrease in wait assessment can be attributed to three maincauses:
• Crowding and ridership.
2014-S-23
Division of State Government Accountability 20
Audit Report 2014-S-23December 30, 2015
• Ongoing maintenance needs.
• Unplanned work on the right of way.
Changes in subway operating conditions that affect these three areas are the primarydriver of the decrease in wait assessment measures.
First, crowding and ridership caused approximately 40% of service disruptions in 2014.Ridership has been growing steadily since 20 l0, at all times of day, and we continue toreach new ridership records. Ridership growth accelerated in 2014, and the weekdaypeak period saw the greatest increase. Ridership during the peak period has adisproportionate impact on service, as 15 out of 20 trunk lines serving Manhattan arenow at track capacity during the peak hour. Even a brief interruption of service, suchas door holding by passengers , can grow into a major incident because of the self-reinforcing effect of platform crowding and close train spacing.
Second, ongoing maintenance needs caused approximately 26% of disruptions in 2014.As our infrastructure ages, critical maintenance is more important than ever, and therehas been a significant increase in work on the right of way over the past two years.Much of this was driven by increasing Sandy and capital work. In addition, we haveaggressively stepped up our rail defect monitoring efforts, which means we arereplacing more early defects before they cause incidents. Moreover, proceduralchanges at the Rail Control Center streamlined and sped up the process for safelygetting workers onto the right of way to do critical routine maintenance and inspectionwork. Much of this work is done while trains are running. New York City Transit hasa complex roadway worker protection system ("flagging rules") to ensure the safety ofemployees working under traffic conditions. These flagging rules are critical for oursystem and have in many cases been incrementally augmented and improved over thepast 10 years to enhance safety and add additional protection , while worker compliancewith the rules has increased in the same time period. This level of protection comes at acost to service, not only on the tracks where workers are maintaining or inspectingequipment, but in many cases on adjacent tracks as well. Even one small work zonerequires more than 1/3 of a mile of slow train speed. A typical slow speed zone reducestrack capacity from 28 to 18 trains per track per hour. This has a significant impact onservice, especially on weekends and during off-peak hours, when most of our plannedwork occurs.
Third, unplanned work on the right of way, including events like water main breaks,signal failures, and power outages, present challenges to providing regular service.Although such incidents occur relatively infrequently, when they do happen they cansignificantly impact service. The expansion of roadway worker protection rules has alsoincreased the impact to service from unplanned events on the right-of-way, for the samereasons it has increased impacts to service caused by ongoing maintenance needs.
New York City Transit's action plans and initiatives are in direct response to thechanges in operating conditions discussed above. Uneven headways caused bycrowding and ridership are addressed by several initiatives to reduce dwell times suchas additional platform controllers, step-aside boxes, and revised announcements to
2014-S-23
Division of State Government Accountability 21
Audit Report 2014-S-23December 30, 2015
speed door closing. Other initiatives include monitoring platform crowding conditionsvia cameras, staging personnel to respond to real-time conditions, improvingcommunications during service disruptions, and formalizing a partnership with NYPDto assist with platform metering during incidents. These efforts are being carefullymonitored and rolled out in a phased approach after their effectiveness has beendetermined and modified for the unique operating characteristics of each line.
Incidents caused by planned and unplanned work on the right of way are addressed byseveral preventative initiatives designed to reduce response time and to improvecoordination of planned work. This involves strategic deployment of mobileSignals/Track/Third Rail teams, and additional signal maintenance staff coverage onthe Lexington Avenue Corridor. Problematic corridors are targeted with enhancedinspections, increased ultrasonic rail testing, and installation of Continuous WeldedRail. Use of a new flagging database is being phased in to better coordinate work onthe right of way.
In addition to the efforts noted above, numerous New York City Transit senior leveltask forces are continually working on ways to improve the level and evenness ofservice to customers. In particular, the Division of Operations Planning and theDepartment of Subways, prior to and during the audit period, already had severalservice performance work groups, committees, and initiatives established that werecharged with developing action plans and initiatives based on analyses of serviceimprovement. These efforts continue to the present day and represent both long andshort term initiatives. These groups include:
• Department of Subways Senior Vice President Monthly OperationalPerformance Reviews -examine trends in service performance indicators
• Department of Subways/Operations Planning Delay Management Committee -coordinate key service improvement initiatives and studies, especially thosespanning multiple New York City Transit divisions and departments, includingMaintenance of Way and Capital Program Management.
• Department of Subways Rapid Transit Operations Weekly and Bi-weeklyService Performance Meetings -review On-Time Performance and operationalinfractions for the week in question where each District General Superintendentexplains reasons for negative performance and discusses strategies andinitiatives to mitigate problems
• Division of Car Equipment Communications Based Train Control IncidentReview Task Force -review and classify equipment failures and identify stepsto reduce incidents
• Division of Car Equipment/Rapid Transit Operations Monthly Delay Committee Meetings -to reduce incidents and minimize delays to servicethrough a wide range of issues that affect car reliability, road operations, andincident response and handling
• Division of Car Equipment R-188 Train Incident Meetings -monthly review of
2014-S-23
Division of State Government Accountability 22
Audit Report 2014-S-23December 30, 2015
new equipment issues with Kawasaki Management to identify corrective actions
• Operations Planning Running Time Revisions -in-depth analyses of individualline running times undertaken by OP's System Data & Research and SubwaysSchedules units, using Automatic Train Supervision - A Division and IntegratedTrain Register Activity Console/Programmable Logic Controller data, leadingto incorporation of more accurate running times in revised subway timetables
• Rail Control Center-System Data & Research String Line and Gap TableWorking Group -pilot programs and formal training on the use of string linesand gap tables by console dispatchers to visualize gaps in service and achievemore even headways
• Rail Control Center Efficiency Study -improvements to train monitoringprocesses developed by System Data & Research
• Department of Subways Performance Analysis Unit -ongoing analyses of delayroot causes and development of a comprehensive subway performance database
• Rapid Transit Operations Performance Reporting and Operations AnalysisGroup -the statistical reporting, analysis and operational support generated bythis unit provides the Department of Subways and Rapid Transit Operationsmanagement the ability to measure the success of efforts to provide improved transportation service to our customers
• Division of Car Equipment Central Electronics Shop Task Force -developelectronic component design modifications by Car Equipment Engineering
• Division of Car Equipment Door Task Force -strategic upgrades to doorcomponents identified by Car Equipment Engineering to reduce failures
All of the above groups actively pursue many different formal programs, initiatives,and corrective action plans to improve service. They represent a mix of long- and short-term initiatives, and many have budget impacts, which are reflected in New York CityTransit 's operating and capital budgets. The Delay Management Committee, forinstance, has been working on an evolving list of service improvement initiatives, basedon ongoing analyses of the major underlying causes of service disruptions. Theseinitiatives include a new flagging database (to plan maintenance work under traffic inadvance and to reduce the service impact of such work), Combined Action Teams(mobile Maintenance of Way teams with dedicated vehicles to provide a rapid responseto right-of-way failure incidents during p.m. peak hours, to reduce the duration andimpact of such incidents), timetable revisions (to adjust running times system-wide toreflect actual performance and accommodate off-peak maintenance and inspectionwork on the right-of-way), etc. In addition, the MTA's 2015-2019 Capital Programincludes funding for Integrated Service Information and Management (ISIM-B), whichwill automate central monitoring of trains on the B division.
Contrary to the conclusions reached in the Draft Audit Report, many of these effortswere discussed with the auditors on multiple occasions during their fieldwork, the
2014-S-23
Division of State Government Accountability 23
Audit Report 2014-S-23December 30, 2015
auditors attended several committee meetings, and New York City Transit provided allsupporting documentation as requested.
New York City Transit does not have a single stand-alone plan or policy to provide timely and even service and to improve wait assessment, nor should we. Providinghigh-quality service is our central objective, and is inherent in everything we do. It isembodied in the job descriptions of many staff in Operations Planning and in Subways'Rapid Transit Operations and Operations Support Divisions , but -directly or indirectly-it is the responsibility of all of our employees. We do not wish to compartmentalizeresponsibility for improving service performance. Therefore, it is neither practical nordesirable to condense our performance-related activities into a single plan.
Comptroller’s Comment: Stating improving wait assessment is the “responsibility of all employees” is a quaint sentiment; however, from an accountability point of view it can be very problematic. A basic standard of sound management is that responsibilities need to be clearly defined. Only after responsibilities have been defined, can performance be managed and improved. When responsibility is disbursed so widely, it becomes unclear exactly who is responsible.
Response to Executive Summary Key Recommendations
Comptroller Key Recommendation 1 : Formally assess and revise as necessary themethodologies used to calculate and report wait time performance data. Appropriatelyweight the performance statistics of the various lines and shuttles and promote full andtransparent disclosure of such data.
We do not concur with this recommendation, as addressed above, in our response toExecutive Summary Key Finding 2.
Comptroller Key Recommendation 2: Develop a comprehensive and detailed long-termplan to address the reasons wait assessment performance has decreased Such a planshould include the structural and information technology improvements that areneeded, as well as time.frames and cost estimates to make the required improvements.
As noted above, in NYCT's response to Executive Summary Key Finding 3, NYCTalready has in place comprehensive initiatives to improve Wait Assessment. No furtheraction is required on this recommendation.
The remainder of this letter addresses the main body of the report, Audit Findings andRecommendations.
General Comments
NYCT disagrees with the audit interpretation of NYCT's Rapid Transit LoadingGuidelines. The audit asserts that "based on Transit's maximum headwayGuidelines…just 57 percent of the week is covered . The transition periods account foranother 18 percent of the week. The remaining 25 percent of the week is not coveredby a minimum frequency service standard mainly because Saturday and Sunday are
2014-S-23
Division of State Government Accountability 24
Audit Report 2014-S-23December 30, 2015
undefined."
Comptroller’s Comment: In their response, MTA officials disagree with our conclusion that the Guidelines do not cover the entire week. However, a memorandum prepared by MTA officials on November 6, 2014 clearly states: “The guidelines themselves do not, and have never, covered all times of day on weekdays, allowing for transitions between the defined periods of rush hours, middays, evenings and overnights. For weekends, the guidelines do not define the start and end of the applicability for Saturdays and Sundays, allowing for transitions to and from the overnights.”
The conclusion that "Saturday and Sunday are undefined"is incorrect. The Guidelinesare very clear about the maximum headways (also referred to as "policy headways"byNYCT) on weekends -10 minutes between trains on Saturdays and 12 minutesbetween trains on Sundays, where feasible, based on infrastructure capacity asdetermined by signals, terminals, switches, track layouts, traction power, and otherinfrastructural constraints, as well as on the availability of subway cars and onrequirements for track access for maintenance and capital work on the right-of-way.The Guidelines do not specify precise start and end times for the application of thepolicy headways on weekend days because of historical differences by line in the rampup and ramp down of ridership on the weekends. Nevertheless, for the majority of weekend hours, the policy headways are applied on the subway in the base timetableswhere feasible. It is misleading to assert otherwise.
Response to Wait Assessment Data Analysis
This is addressed above, in our response to Executive Summary Key Finding 2.
Response to Planning Actions to Address Wait Assessment Problems
This is addressed above, in our response to Executive Summary Key Finding 3.
Response to Service Frequency Guidance
As addressed above under General Comments, NYCT strongly disagrees with theauditors' conclusions regarding Saturday and Sunday maximum headway Guidelines.
The audit generally captures the process by which the Guidelines are applied inscheduling subway service, namely the consideration of minimum service frequencies(or maximum headways), which vary by time of day and day of week, and of maximum average loads, which vary depending on service frequency during peak hours. Theauditors, however, make no mention that the maximum average loads are differentduring off-peak hours than during rush hours, and instead assert, incorrectly, thataverage load data to schedule service is used only "...when trains are most crowdedduring the highest ridership hour." In fact, Guidelines based on maximum average loaddata are used at all times of day, where feasible, with lower Guideline maximum loadsduring off-peak hours than during rush hours, thereby assuring less crowding duringoff-peak hours.
2014-S-23
Division of State Government Accountability 25
Audit Report 2014-S-23December 30, 2015
The audit does accurately reflect the constraints that NYCT faces in scheduling serviceto meet Guidelines, including "...physical constraints and other factors, such asconstruction work." Sometimes it is not feasible to schedule service to adhere strictlyto Guidelines, and the audit accurately reflects such conditions, noting that capacityimprovements on lines running at maximum frequency "...may require new signalsystem technology, which is very costly, and MTA estimates in its 20-year capital needs assessment that it will take decades to fully implement."
The audit concludes that Transit "...should advise the public of congested areas andtimes so that passengers can better plan their trips to avoid overcrowding and helpalleviate congestion." New York City Transit currently provides timely service statusinformation via Social Media (Twitter and Facebook), Subscriber Text Alerts and theMTA Website . NYCT's Corporate Communications Department has residentpersonnel at the Rail Control Center, who independently provide this information to thepublic immediately as delays occur. The information provided includes detailedrecommendations for alternative travel. When the condition/incident is resolved,Corporate Communication provides an immediate update .
Response to Recommendations
Comptroller Recommendation 1: Disclose pertinent details of statistical projectionmethodologies, including the confidence and error precision levels, when publishingwait time performance data.
As addressed above in our response to Executive Summary Key Finding 2, statisticalsignificance varies by division because of differences in data collection. ATS-A lines havefull data so there is no statistical variance. B-Division and Line statistical significancevaries greatly on a monthly basis but does not change when viewed at the public 12-monthrolling average. Disclosing this information would add more confusion than value.
• The audit report states on page 7 that "Transit officials had not formallydisclosed their complete sample projection methodologies until the auditorsrequested this information." This is not a true statement as the auditors wereprovided the sample methodology that was published by the TransportationResearch Board in a paper issued in 2009.
Comptroller’s Comment: On January 29, 2015, a Transit official provided auditors with an article written in 2009, titled “Performance Measurements on Mass Transit,” that provided information on Transit’s performance indicator program. Although it includes wait assessment as one of the performance indicators, it does not explain how the samples used to check wait assessment were developed or how they were used in terms of reporting monthly and yearly statistics. On May 29, 2015, in response to our request, we met with Transit officials to obtain the sampling methodology. Specifically, we sought to determine how changes in the population (ridership) impacted the sample size and to determine which numbers are reported monthly to the Transit and Bus Committee. At this meeting a Transit official stated that they had not spelled out the formal, complete sample methodology until we asked for it, and it is not contained in any report to the Board Committee.
2014-S-23
Division of State Government Accountability 26
Audit Report 2014-S-23December 30, 2015
• Prior to 2011, the Committee summary included the statistical margin of error atthe system-wide level. At that time the system-wide margin of error was+/-0.5%. Given that 100% of ATS-A data was used for producing WaitAssessment for the thru lines and 42nd Street Shuttle, NYCT determinedthat in order to avoid confusion the error margin would be eliminated fromreporting. Traffic checkers who formerly collected data on the ATS-A lineshave been redeployed to conduct observations on only non-ATS-A lines, whichhas significantly lowered the error margin for those lines. The error margincurrently stands at less than 2% for all non-ATS-A lines.
• On page 8, the audit report lays out a chart highlighting the potential range ofWait Assessment based on the statistical margin of error. Given that the ATS-Alines do not have a margin of error, providing a chart such as this would confusereaders of the report.
Comptroller Recommendation 2: Formally assess and revise as necessary themethodologies used to calculate and report wait time performance data. Appropriatelyweight the performance statistics of the various lines and shuttles and promote full andtransparent disclosure of such data.
We do not concur with this recommendation, as addressed above, in our response toExecutive Summary Key Finding 2.
Comptroller Recommendation 3: Develop a comprehensive and detailed long-term planto address the reasons wait assessment performance has decreased. Such a plan shouldinclude the structural and information technology improvements that are needed, aswell as time.frames and cost estimates to make the required improvements.
As noted above, in NYCT's response to Executive Summary Key Finding 3, NYCT already has in place comprehensive initiatives to improve Wait Assessment. No furtheraction is required on this recommendation.
The remainder of this letter addresses the main body of the report , Audit Findings andRecommendations.
Comptroller Recommendation 4: Formally assess and revise as necessary the minimumfrequency guidelines to address days (particularly the weekends) and hours not coveredbyspecific standards.
It is NYCT's position that the MTA Board-approved Rapid Transit Loading Guidelinesare functioning as intended and no revision by the MTA Board is necessary. It shouldbe noted that the policy headways govern only when ridership levels are so low thatmore frequent service is not required based on passenger loads, where feasible.
While NYCT does not concur with recommendation #4 to "assess and revise" the Guidelines,NYCT will, by the end of 2016, develop a formal Policy/Instruction toaddress areas of ambiguity in the Guidelines, so that the development of timetables canbe consistent across all subway lines. This Policy/Instruction can include (but may notbe limited to) the following:
2014-S-23
Division of State Government Accountability 27
Audit Report 2014-S-23December 30, 2015
• Interpreting "policy headways" as meaning the average headway over a one-hour period. This can accommodate slight variances in headway toaccommodate merges, changes in stopping patterns, and transitions.
• Allowing exceptions in start or end times of maximum headways in each periodto accommodate issues of operational feasibility as well as ridership profiles.This can accommodate later starts or earlier ends to policy headways due tolong line length, train storage locations, and other practicalities.
• Specifying that the policy headways for Saturdays and Sundays are in effect forthe majority of each day, with approximate start and end times, but noting thatthe weekend start and end times may vary by line, depending on ridership.
Comptroller Recommendation 5: Develop and implement a process whereby real-timedata obtained by traffic checkers is used to advise patrons of delays and potentialalternative lines to help alleviate congestion.
New York City Transit currently provides timely service status information via Social Media (Twitter and Facebook), Subscriber Text Alerts and the MTA Website.
NYCT's Corporate Communications Department has resident personnel at the Rail ControlCenter, who independently provide this information to the public immediately as delaysoccur. The information provided includes detailed recommendations for alternative travel.When the condition/incident is resolved, Corporate Communication provides an immediateupdate.
Conclusion
We have carefully reviewed the findings and recommendations in the Draft AuditReport and continue to aim for improvements in processes and procedures that willmake the most effective and efficient use of our resources.
cc: P. CafieroM. ChubakP. FleurangesW. HabershamL. Tendler