Embed Size (px)
Citation preview
Suburb Flyover ReportALEXANDRA HILLS (HOUSE)
PREPARED BY: LJ HOOKER PROPERTY CENTRE, PH: 07 32862500
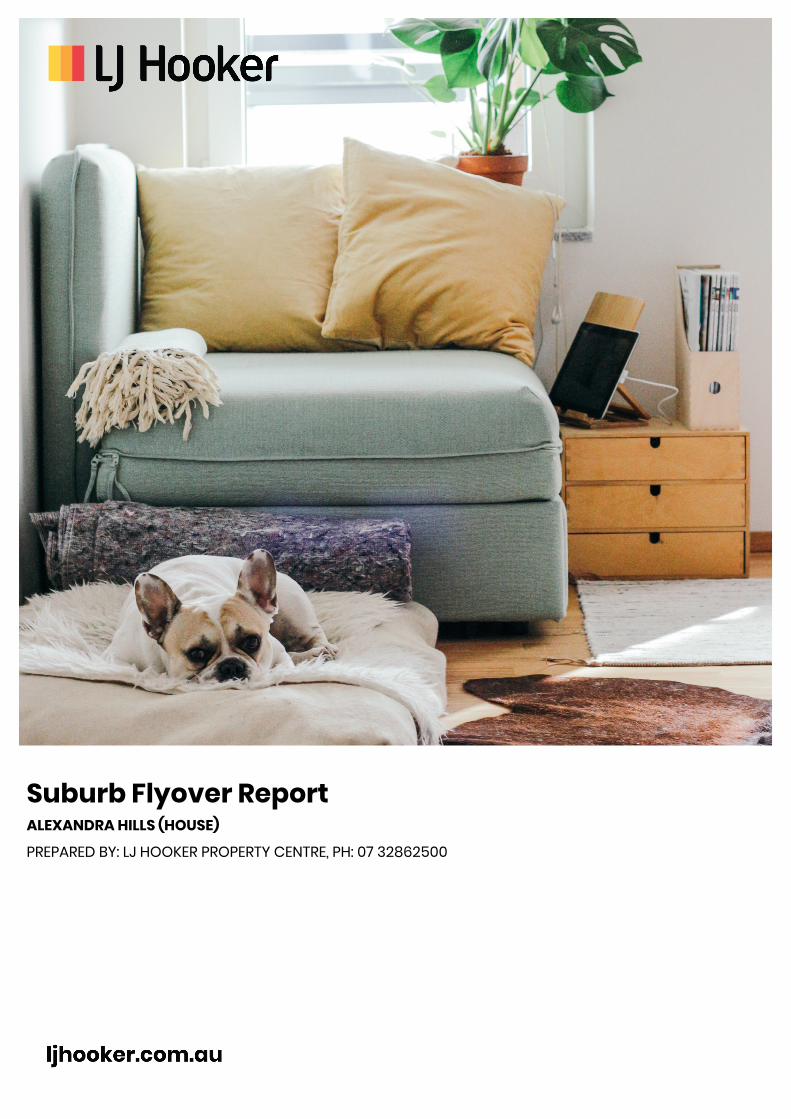
ALEXANDRA HILLS - Suburb Map
Prepared on 05/10/2021 by LJ Hooker Property Centre. © Property Data Solutions Pty Ltd 2021 (pricefinder.com.au)The materials are provided as an information source only. © The State of Queensland (Department of Natural Resources, Mines and Energy) October/2021. Based on or contains data provided by theState of Queensland (Department of Natural Resources, Mines and Energy) 2021. In consideration of the State permitting use of this data you acknowledge and agree that the State gives no warranty inrelation to the data (including accuracy, reliability, completeness, currency or suitability) and accepts no liability (including without limitation, liability in negligence) for any loss, damage or costs (includingconsequential damage) relating to any use of the data. Data must not be used for direct marketing or be used in breach of the privacy laws; more information at www.propertydatacodeofconduct.com.au.
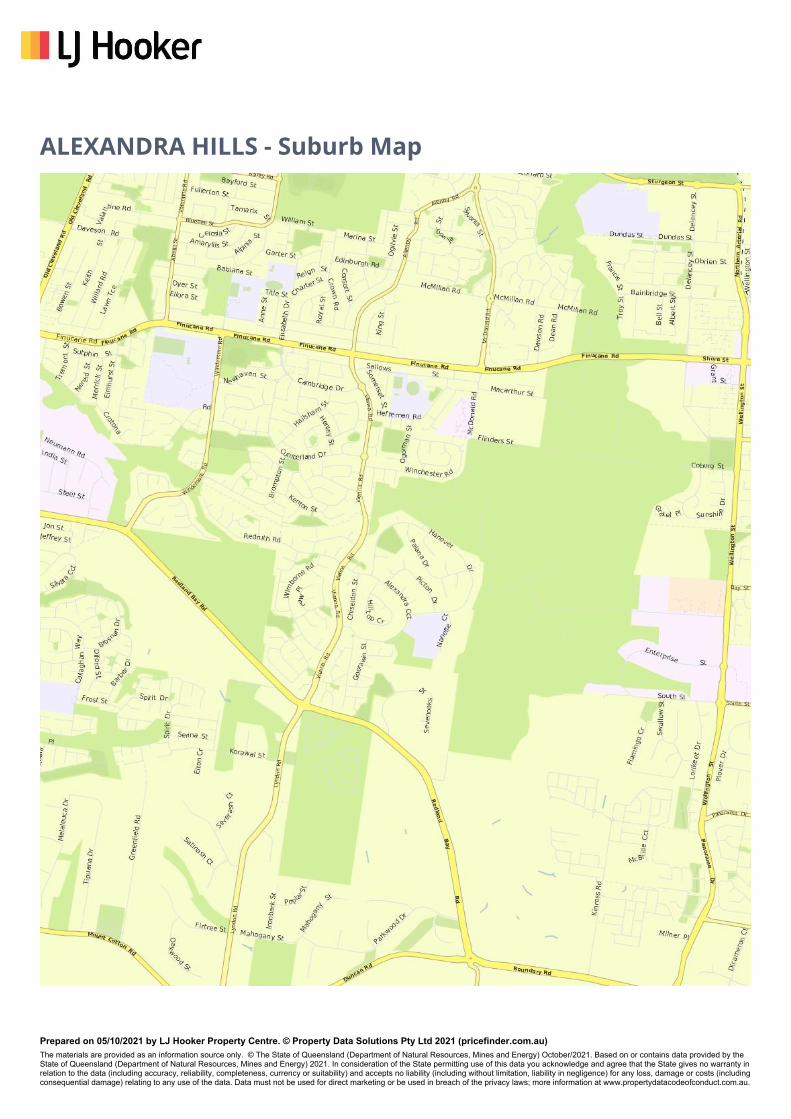
ALEXANDRA HILLS - Sales Statistics (Houses)Year # Sales Median LowGrowth High2003 638 $ 252,750 $ 20,500 $ 2,469,6000.0 %
2004 384 $ 290,000 $ 190,000 $ 650,00014.7 %
2005 413 $ 291,000 $ 170,000 $ 1,075,0000.3 %
2006 411 $ 314,148 $ 210,000 $ 1,500,0008.0 %
2007 476 $ 370,000 $ 240,000 $ 1,950,00017.8 %
2008 276 $ 385,500 $ 180,000 $ 3,000,0004.2 %
2009 330 $ 405,000 $ 290,000 $ 800,0005.1 %
2010 268 $ 415,000 $ 300,000 $ 1,550,0002.5 %
2011 215 $ 390,000 $ 290,000 $ 4,025,000-6.0 %
2012 231 $ 380,000 $ 150,000 $ 665,000-2.6 %
2013 257 $ 399,000 $ 162,750 $ 726,0005.0 %
2014 275 $ 412,000 $ 250,000 $ 1,010,0003.3 %
2015 307 $ 425,000 $ 93,000 $ 1,744,5003.2 %
2016 297 $ 444,800 $ 250,000 $ 975,0004.7 %
2017 286 $ 470,000 $ 325,000 $ 950,0005.7 %
2018 288 $ 475,000 $ 320,000 $ 2,100,0001.1 %
2019 273 $ 460,000 $ 270,000 $ 1,162,500-3.2 %
2020 277 $ 495,000 $ 321,000 $ 1,150,0007.6 %
2021 204 $ 560,500 $ 165,000 $ 1,300,00013.2 %
Suburb Growth
+15.8%Previous Median Price: $475,000Current Median Price: $550,000
Based on 552 recorded House sales compared over the last tworolling 12 month periods
Median Sale Price
$550kBased on 302 recorded House sales within
the last 12 months (Oct '20 - Sep '21)
Based on a rolling 12 month period and may differfrom calendar year statistics
Prepared on 05/10/2021 by LJ Hooker Property Centre. © Property Data Solutions Pty Ltd 2021 (pricefinder.com.au)The materials are provided as an information source only. © The State of Queensland (Department of Natural Resources, Mines and Energy) October/2021. Based on or contains data provided by theState of Queensland (Department of Natural Resources, Mines and Energy) 2021. In consideration of the State permitting use of this data you acknowledge and agree that the State gives no warranty inrelation to the data (including accuracy, reliability, completeness, currency or suitability) and accepts no liability (including without limitation, liability in negligence) for any loss, damage or costs (includingconsequential damage) relating to any use of the data. Data must not be used for direct marketing or be used in breach of the privacy laws; more information at www.propertydatacodeofconduct.com.au.
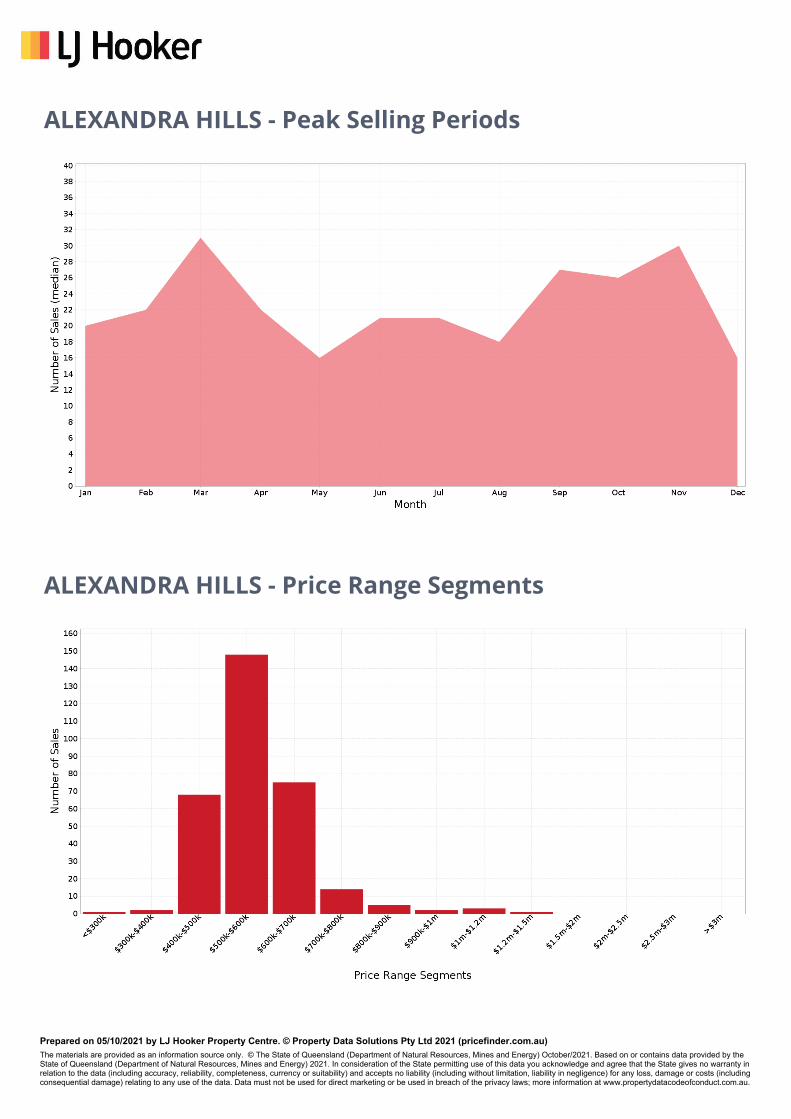
ALEXANDRA HILLS - Peak Selling Periods
ALEXANDRA HILLS - Price Range Segments
Prepared on 05/10/2021 by LJ Hooker Property Centre. © Property Data Solutions Pty Ltd 2021 (pricefinder.com.au)The materials are provided as an information source only. © The State of Queensland (Department of Natural Resources, Mines and Energy) October/2021. Based on or contains data provided by theState of Queensland (Department of Natural Resources, Mines and Energy) 2021. In consideration of the State permitting use of this data you acknowledge and agree that the State gives no warranty inrelation to the data (including accuracy, reliability, completeness, currency or suitability) and accepts no liability (including without limitation, liability in negligence) for any loss, damage or costs (includingconsequential damage) relating to any use of the data. Data must not be used for direct marketing or be used in breach of the privacy laws; more information at www.propertydatacodeofconduct.com.au.
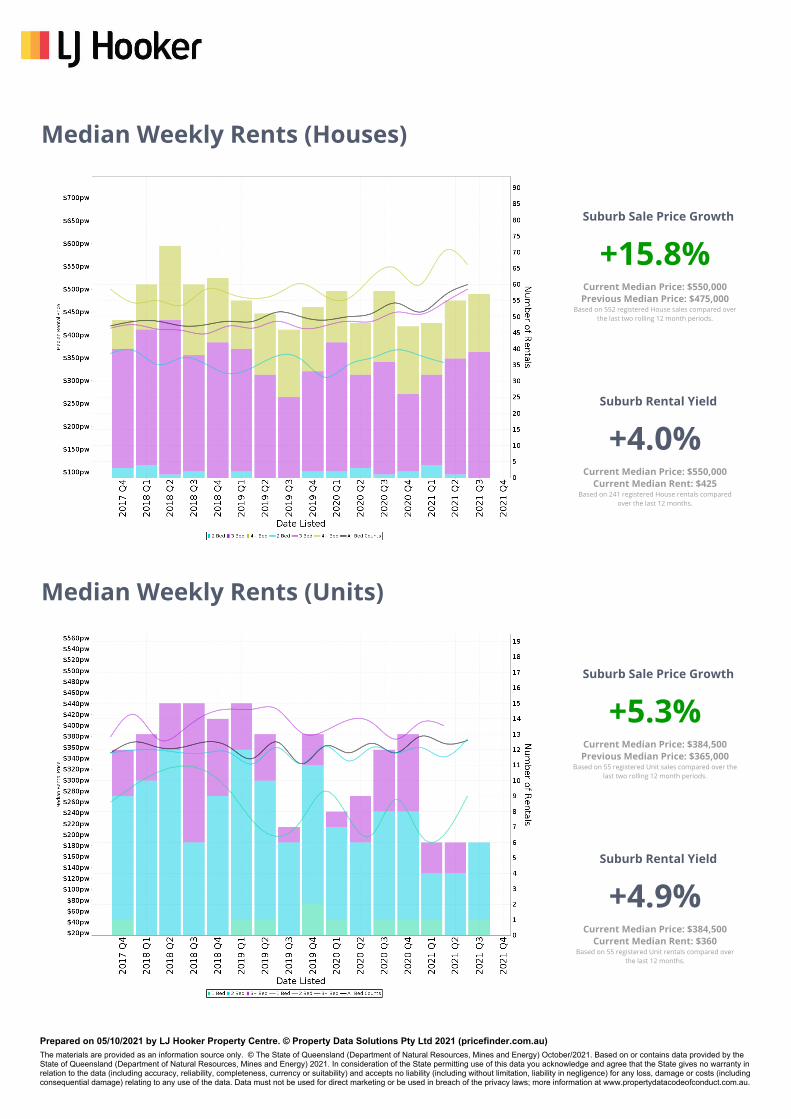
Median Weekly Rents (Houses)
Suburb Rental Yield
+4.0%Current Median Price: $550,000
Current Median Rent: $425Based on 241 registered House rentals compared
over the last 12 months.
+15.8%Current Median Price: $550,000Previous Median Price: $475,000
Based on 552 registered House sales compared overthe last two rolling 12 month periods.
Suburb Sale Price Growth
Median Weekly Rents (Units)
Suburb Rental Yield
+4.9%Current Median Price: $384,500
Current Median Rent: $360Based on 55 registered Unit rentals compared over
the last 12 months.
+5.3%Current Median Price: $384,500Previous Median Price: $365,000
Based on 55 registered Unit sales compared over thelast two rolling 12 month periods.
Suburb Sale Price Growth
Prepared on 05/10/2021 by LJ Hooker Property Centre. © Property Data Solutions Pty Ltd 2021 (pricefinder.com.au)The materials are provided as an information source only. © The State of Queensland (Department of Natural Resources, Mines and Energy) October/2021. Based on or contains data provided by theState of Queensland (Department of Natural Resources, Mines and Energy) 2021. In consideration of the State permitting use of this data you acknowledge and agree that the State gives no warranty inrelation to the data (including accuracy, reliability, completeness, currency or suitability) and accepts no liability (including without limitation, liability in negligence) for any loss, damage or costs (includingconsequential damage) relating to any use of the data. Data must not be used for direct marketing or be used in breach of the privacy laws; more information at www.propertydatacodeofconduct.com.au.
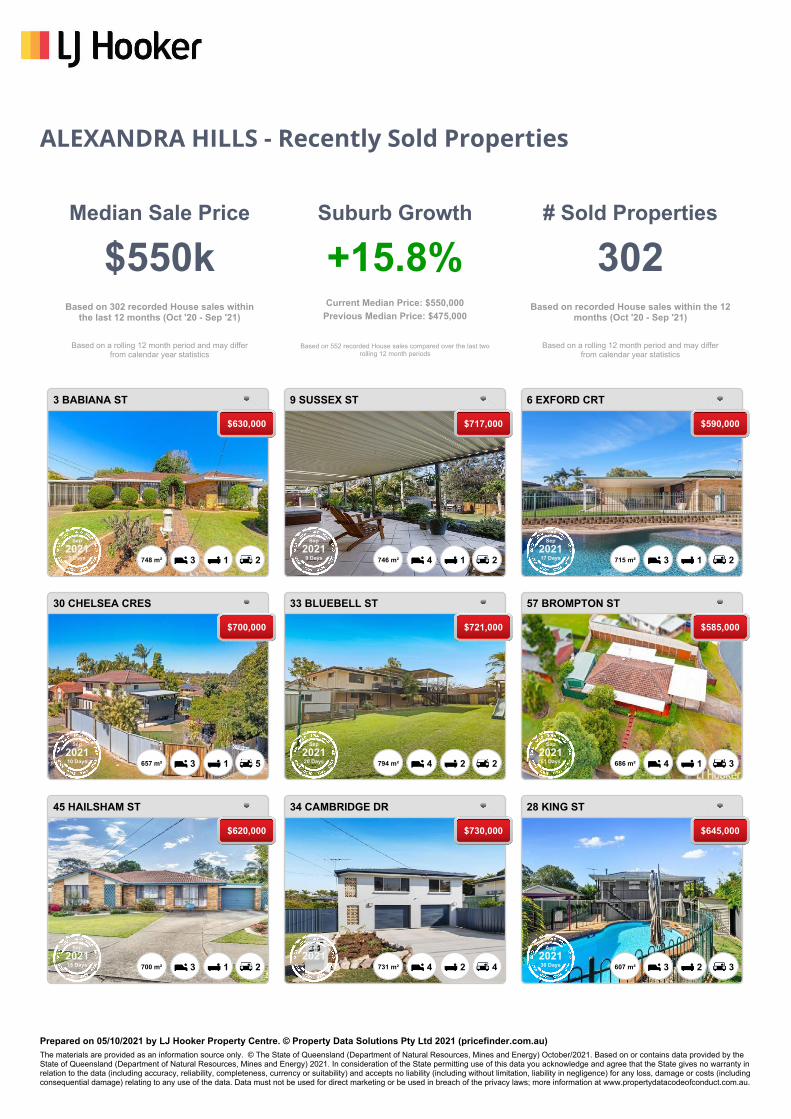
ALEXANDRA HILLS - Recently Sold Properties
# Sold Properties
302Based on recorded House sales within the 12
months (Oct '20 - Sep '21)
Based on a rolling 12 month period and may differfrom calendar year statistics
Suburb Growth
+15.8%Previous Median Price: $475,000Current Median Price: $550,000
Based on 552 recorded House sales compared over the last tworolling 12 month periods
Median Sale Price
$550kBased on 302 recorded House sales within
the last 12 months (Oct '20 - Sep '21)
Based on a rolling 12 month period and may differfrom calendar year statistics
3 BABIANA ST
213748 m²
$630,000
Sep
20215 Days
9 SUSSEX ST
214746 m²
$717,000
Sep
20219 Days
6 EXFORD CRT
213715 m²
$590,000
Sep
202117 Days
30 CHELSEA CRES
513657 m²
$700,000
Sep
202110 Days
33 BLUEBELL ST
224794 m²
$721,000
Sep
202120 Days
57 BROMPTON ST
314686 m²
$585,000
Sep
202151 Days
45 HAILSHAM ST
213700 m²
$620,000
Sep
202115 Days
34 CAMBRIDGE DR
424731 m²
$730,000
Sep
2021
28 KING ST
323607 m²
$645,000
Aug
202130 Days
Prepared on 05/10/2021 by LJ Hooker Property Centre. © Property Data Solutions Pty Ltd 2021 (pricefinder.com.au)The materials are provided as an information source only. © The State of Queensland (Department of Natural Resources, Mines and Energy) October/2021. Based on or contains data provided by theState of Queensland (Department of Natural Resources, Mines and Energy) 2021. In consideration of the State permitting use of this data you acknowledge and agree that the State gives no warranty inrelation to the data (including accuracy, reliability, completeness, currency or suitability) and accepts no liability (including without limitation, liability in negligence) for any loss, damage or costs (includingconsequential damage) relating to any use of the data. Data must not be used for direct marketing or be used in breach of the privacy laws; more information at www.propertydatacodeofconduct.com.au.
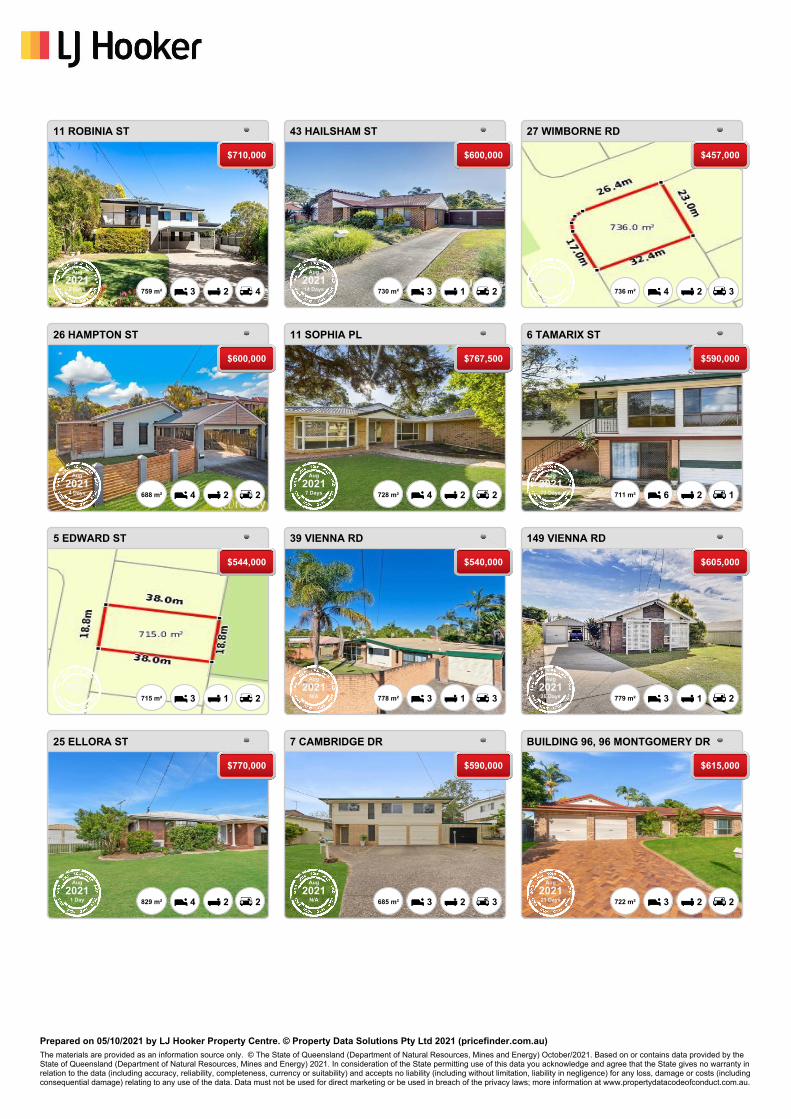
11 ROBINIA ST
423759 m²
$710,000
Aug
20213 Days
43 HAILSHAM ST
213730 m²
$600,000
Aug
202114 Days
27 WIMBORNE RD
324736 m²
$457,000
Aug
2021N/A
26 HAMPTON ST
224688 m²
$600,000
Aug
20214 Days
11 SOPHIA PL
224728 m²
$767,500
Aug
20217 Days
6 TAMARIX ST
126711 m²
$590,000
Aug
202173 Days
5 EDWARD ST
213715 m²
$544,000
Aug
2021N/A
39 VIENNA RD
313778 m²
$540,000
Aug
2021N/A
149 VIENNA RD
213779 m²
$605,000
Aug
202136 Days
25 ELLORA ST
224829 m²
$770,000
Aug
20211 Day
7 CAMBRIDGE DR
323685 m²
$590,000
Aug
2021N/A
BUILDING 96, 96 MONTGOMERY DR
223722 m²
$615,000
Aug
202121 Days
Prepared on 05/10/2021 by LJ Hooker Property Centre. © Property Data Solutions Pty Ltd 2021 (pricefinder.com.au)The materials are provided as an information source only. © The State of Queensland (Department of Natural Resources, Mines and Energy) October/2021. Based on or contains data provided by theState of Queensland (Department of Natural Resources, Mines and Energy) 2021. In consideration of the State permitting use of this data you acknowledge and agree that the State gives no warranty inrelation to the data (including accuracy, reliability, completeness, currency or suitability) and accepts no liability (including without limitation, liability in negligence) for any loss, damage or costs (includingconsequential damage) relating to any use of the data. Data must not be used for direct marketing or be used in breach of the privacy laws; more information at www.propertydatacodeofconduct.com.au.
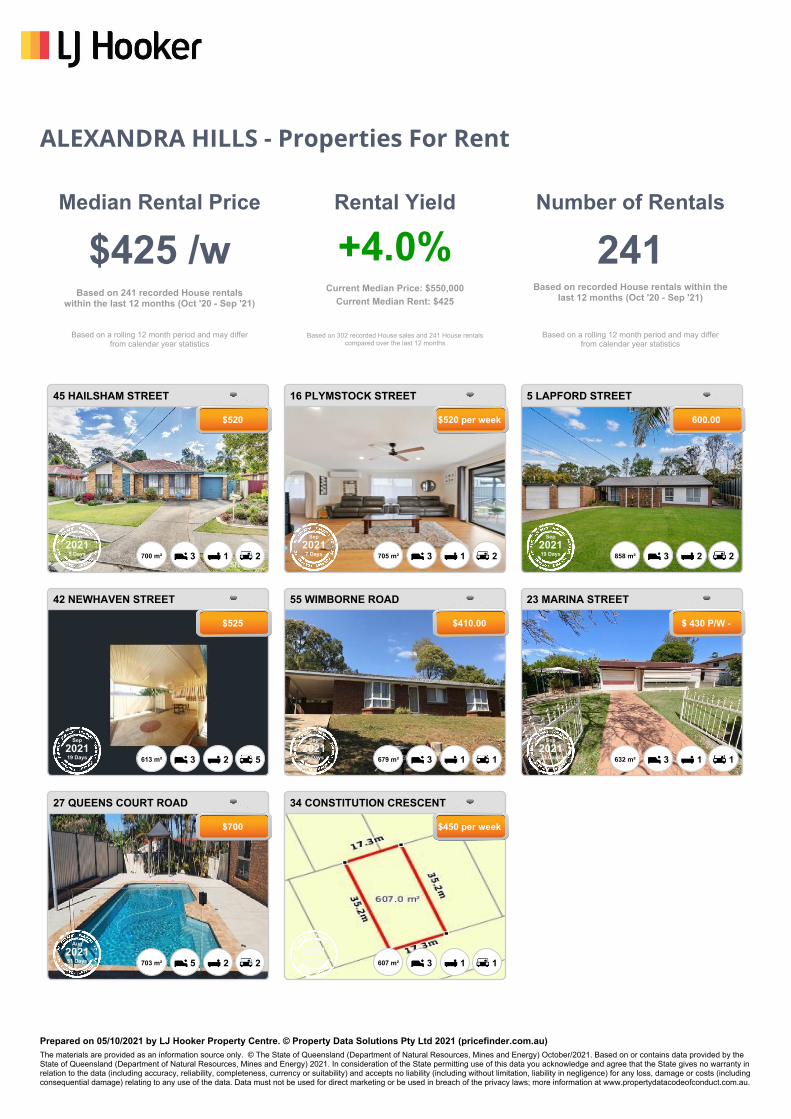
ALEXANDRA HILLS - Properties For Rent
241Number of Rentals
Based on recorded House rentals within thelast 12 months (Oct '20 - Sep '21)
Based on a rolling 12 month period and may differfrom calendar year statistics
Rental Yield
+4.0%Current Median Price: $550,000
Based on 302 recorded House sales and 241 House rentalscompared over the last 12 months
Current Median Rent: $425
Median Rental Price
$425 /wBased on 241 recorded House rentals
within the last 12 months (Oct '20 - Sep '21)
Based on a rolling 12 month period and may differfrom calendar year statistics
45 HAILSHAM STREET
213700 m²
Sep
20215 Days
$520
16 PLYMSTOCK STREET
213705 m²
Sep
20217 Days
$520 per week
5 LAPFORD STREET
223858 m²
Sep
202119 Days
600.00
42 NEWHAVEN STREET
523613 m²
Sep
202119 Days
$525
55 WIMBORNE ROAD
113679 m²
Sep
202120 Days
$410.00
23 MARINA STREET
113632 m²
Sep
202123 Days
$ 430 P/W -
27 QUEENS COURT ROAD
225703 m²
Aug
202151 Days
$700
34 CONSTITUTION CRESCENT
113607 m²
Feb
2021239 Days
$450 per week
Prepared on 05/10/2021 by LJ Hooker Property Centre. © Property Data Solutions Pty Ltd 2021 (pricefinder.com.au)The materials are provided as an information source only. © The State of Queensland (Department of Natural Resources, Mines and Energy) October/2021. Based on or contains data provided by theState of Queensland (Department of Natural Resources, Mines and Energy) 2021. In consideration of the State permitting use of this data you acknowledge and agree that the State gives no warranty inrelation to the data (including accuracy, reliability, completeness, currency or suitability) and accepts no liability (including without limitation, liability in negligence) for any loss, damage or costs (includingconsequential damage) relating to any use of the data. Data must not be used for direct marketing or be used in breach of the privacy laws; more information at www.propertydatacodeofconduct.com.au.