Embed Size (px)
Citation preview
Use of a GIS tool for sustainable management
of aquifer 08-29 resources in La Mancha,
Spain
A. Calera, J. Medrano, C. Martinez & J.R. Ruiz
Institute de Desarrollo Regional UCLM.Av. Campus Universitario sn. 02071 Albacete Spain.
jmedrano@idr-ab. uclm. es
Abstract
Geographic Information Systems enable us to manage projects ascomplex as the sustainable exploitation of subterranean aquifers foragricultural use. This is the case of the extensive hydrologic system 08-29, located on the eastern side of La Mancha (Spain). The integration ofRemote Sensing into the GIS, which allows us to identify, discriminateand study irrigated crops in the semiarid environment of this area, is doneby the intersection of a classified image with the polygon layer of therural cadastre.This union of Remote Sensing and GIS, using the rural cadastre as ageographic base, proves to be highly useful as it combines thecapabilities of both tools.
1 Introduction
The irrigation agriculture of La Mancha (Spain) is almost exclusivelybased on the exploitation of subterranean waters through wells that crossthe permeable beds of the underlying aquifer system. The decisions aboutthe volume of water to be extracted depend on the individual landowners,and are a function of the crop, the meteorological conditions and theirrigation systems used. Currently, the extractions for agriculturalpurposes (mainly irrigation) clearly represent the highest waterconsumption. This way, in the 08-29 aquifer system, an area withsemiarid climate where this study has been carried out; 92.4% of the
Transactions on Information and Communications Technologies vol 18, © 1998 WIT Press, www.witpress.com, ISSN 1743-3517

64 GIS Technologies and their Environmental Applications
subterranean water extracted is used for agriculture, and the remaining7.6% for urban supply and industrial uses.
This aquifer located on eastern side of La Mancha and considered oneof the most important in Spain MOPTMA [1], has more than 100,000 haof irrigated lands is settled over the aquifer system 08-29 (with a surfaceof 8500 Km2). (figure. 1). Presently, most of the sectors implied insubterranean water management, such as farmers, administration and
society as a whole, are convinced that preservation of such a valuable
natural resource as water is truly needed, specially in this areacharacterised by a semiarid climate, and seriously threatened bydesertification. This goal can only be achieved by means of sustainable
exploitation.For the sustainable exploitation of an aquifer, planning and control
methods allowing the integration of a great amount of spatial andtemporal variables are needed. Currently, the Geographic InformationSystems (GIS) are a quickly spreading technology in several scientificfields and applications. The GIS capabilities to integrate spatially
georeferenced data from different sources, with diverse formats,
structures, projections or resolution levels, constitute the main feature ofthese systems Goodchild, [2]. These features make the GIS a useful toolwhen making decisions for improved management of the available waterresources.
In this study, a set of GIS tools have been developed which respond tothe specific management needs of the JCRMO, the farming associationco-responsible for aquifer management. In this process, the experienceobtained from the application of exploitation plans from previous years,which were the first attempt at regulation of extracted volumes, has given
us highly valuable information.
Figure 1. - Location of the study area, also showing the pilot area.
Transactions on Information and Communications Technologies vol 18, © 1998 WIT Press, www.witpress.com, ISSN 1743-3517

GIS Technologies and their Environmental Applications 65
Special attention has been paid to the integration of Remote Sensing inthis GIS, this technology being very useful for crop identification and
control in real time Moran et al [3] when dealing with relatively extensive
surfaces. The integration of these two techniques increases the
capabilities of each Menenti et al. [4].
2 GIS description
FLOW CHART FOR THE AREAS WITH AVAILABLE DIGITAL CADASTER
REMOTE SENSING
LAND USE CLASSIFICATION(IRRIGATED CROPS)
EXTRACTION OF \NFORMATION AND ITS PLOT
REFERENCE(CARTOGRAPHIC BASE: DIGITAL
CADASTER) J
CROP SPATIALANALYSIS
IRRIGATIONSYSTEMS
IRRIGATIONSYSTEMS SPATIALANALISYS
ALPHANUMERIC DATABASE
DIGITAL CADASTER
PLOTCROP DIGITAL MAPPING(CROPS AND IRRIGATION SYSTEMS)
PLOTCROPRJUQS
\
I
I'
WATERCONSUMPTION
CHART
EFFICIENCY CHART
f*0? ANALISYS BLOCK(DIGITAL MAP OF WATER CONSUMPTION PER PLOT) CROP
SPATIAL ANALISYSCONSUMPTION IN APARTICUIARZONEMEDIOOWBAL
ANALISYS BYADMINISTRATIVEEXPLOITATION. ANALISYS BY
HYDRAULICEXPLOITATION.WATER CONSUMPTIONPER WELL
ACQUIFER MODELLING
Figure 2
Transactions on Information and Communications Technologies vol 18, © 1998 WIT Press, www.witpress.com, ISSN 1743-3517
66 GIS Technologies and their Environmental Applications
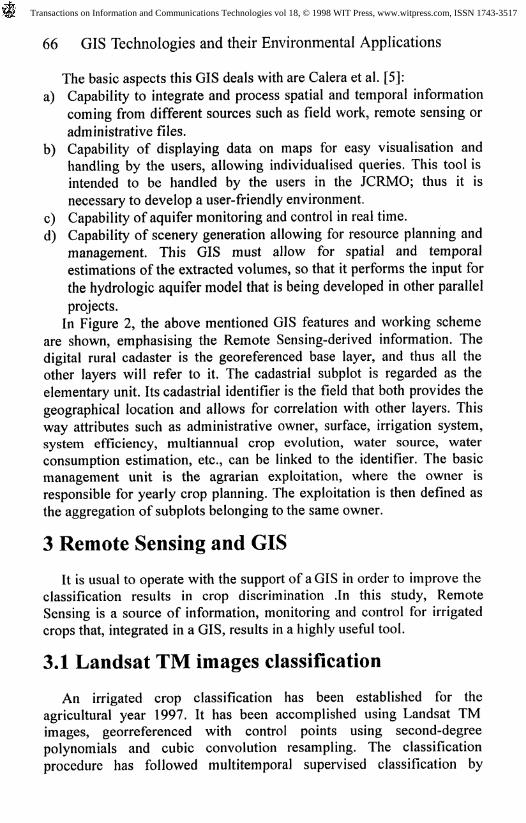
The basic aspects this GIS deals with are Calera et al. [5]:a) Capability to integrate and process spatial and temporal information
coming from different sources such as field work, remote sensing or
administrative files.b) Capability of displaying data on maps for easy visualisation and
handling by the users, allowing individualised queries. This tool isintended to be handled by the users in the JCRMO; thus it is
necessary to develop a user-friendly environment,c) Capability of aquifer monitoring and control in real time.d) Capability of scenery generation allowing for resource planning and
management. This GIS must allow for spatial and temporalestimations of the extracted volumes, so that it performs the input for
the hydrologic aquifer model that is being developed in other parallel
projects.In Figure 2, the above mentioned GIS features and working scheme
are shown, emphasising the Remote Sensing-derived information. Thedigital rural cadaster is the georeferenced base layer, and thus all theother layers will refer to it. The cadastrial subplot is regarded as the
elementary unit. Its cadastrial identifier is the field that both provides the
geographical location and allows for correlation with other layers. Thisway attributes such as administrative owner, surface, irrigation system,system efficiency, multiannual crop evolution, water source, waterconsumption estimation, etc., can be linked to the identifier. The basicmanagement unit is the agrarian exploitation, where the owner isresponsible for yearly crop planning. The exploitation is then defined asthe aggregation of subplots belonging to the same owner.
3 Remote Sensing and GIS
It is usual to operate with the support of a GIS in order to improve theclassification results in crop discrimination .In this study, RemoteSensing is a source of information, monitoring and control for irrigatedcrops that, integrated in a GIS, results in a highly useful tool.
3.1 Landsat TM images classification
An irrigated crop classification has been established for theagricultural year 1997. It has been accomplished using Landsat TMimages, georreferenced with control points using second-degreepolynomials and cubic convolution resampling. The classificationprocedure has followed multitemporal supervised classification by
Transactions on Information and Communications Technologies vol 18, © 1998 WIT Press, www.witpress.com, ISSN 1743-3517
GIS Technologies and their Environmental Applications 67
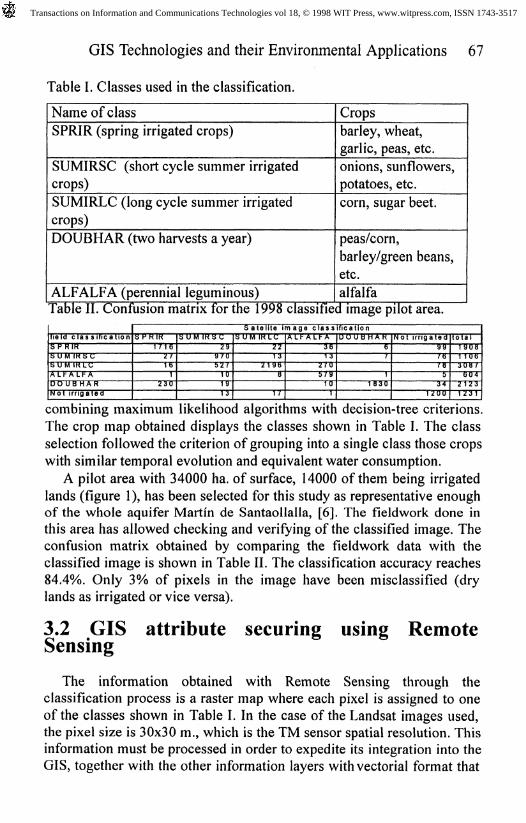
Table I. Classes used in the classification.
Name of class
SPRIR (spring irrigated crops)
SUMIRSC (short cycle summer irrigated
crops)
SUMIRLC (long cycle summer irrigated
crops)
DOUBHAR (two harvests a year)
ALFALFA (perennial leguminous)
Crops
barley, wheat,garlic, peas, etc.
onions, sunflowers,potatoes, etc.
corn, sugar beet.
peas/corn,
barley/green beans,
etc.
alfalfaTable II. Confusion matrix for the 1998 classified image pilot area.
5 P R IR
SUMIRLCA L F A L F A
Not irrigated
Satelite image classification
1716Z 71 61
230
299705 7
093
221 3
2195B
1 7
361 3
2705791 01
67
11830
99767 85
341 200
to ta I1 90811063087604
2 1 231231
combining maximum likelihood algorithms with decision-tree criterions.
The crop map obtained displays the classes shown in Table I. The classselection followed the criterion of grouping into a single class those cropswith similar temporal evolution and equivalent water consumption.
A pilot area with 34000 ha. of surface, 14000 of them being irrigatedlands (figure 1), has been selected for this study as representative enoughof the whole aquifer Martin de Santaollalla, [6]. The fieldwork done inthis area has allowed checking and verifying of the classified image. Theconfusion matrix obtained by comparing the fieldwork data with theclassified image is shown in Table II. The classification accuracy reaches84.4%. Only 3% of pixels in the image have been misclassified (drylands as irrigated or vice versa).
3.2 GIS attribute securing using RemoteSensing
The information obtained with Remote Sensing through theclassification process is a raster map where each pixel is assigned to oneof the classes shown in Table I. In the case of the Landsat images used,the pixel size is 30x30 m., which is the TM sensor spatial resolution. Thisinformation must be processed in order to expedite its integration into theGIS, together with the other information layers with vectorial format that
Transactions on Information and Communications Technologies vol 18, © 1998 WIT Press, www.witpress.com, ISSN 1743-3517
68 GIS Technologies and their Environmental Applications
are linked to the administrative data (cadastrial subplots) and also have ageographical location, allowing them to be grouped into exploitations.This way, a process to extract information from a raster layer and to
integrate it in a vector layer has been developed. This process has beenapplied to the crossing of the classified raster map and the digital rural
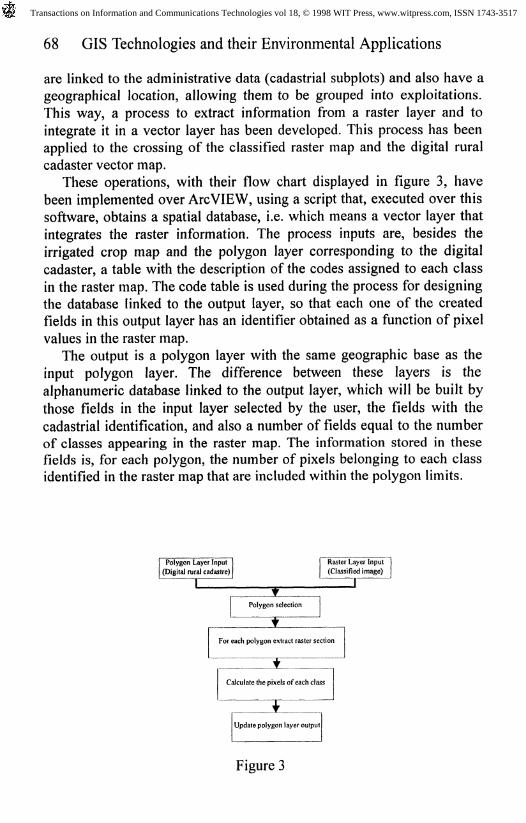
cadaster vector map.These operations, with their flow chart displayed in figure 3, have
been implemented over ArcVIEW, using a script that, executed over thissoftware, obtains a spatial database, i.e. which means a vector layer thatintegrates the raster information. The process inputs are, besides theirrigated crop map and the polygon layer corresponding to the digital
cadaster, a table with the description of the codes assigned to each class
in the raster map. The code table is used during the process for designingthe database linked to the output layer, so that each one of the createdfields in this output layer has an identifier obtained as a function of pixel
values in the raster map.The output is a polygon layer with the same geographic base as the
input polygon layer. The difference between these layers is the
alphanumeric database linked to the output layer, which will be built by
those fields in the input layer selected by the user, the fields with the
cadastrial identification, and also a number of fields equal to the numberof classes appearing in the raster map. The information stored in thesefields is, for each polygon, the number of pixels belonging to each classidentified in the raster map that are included within the polygon limits.
Figure 3
Transactions on Information and Communications Technologies vol 18, © 1998 WIT Press, www.witpress.com, ISSN 1743-3517
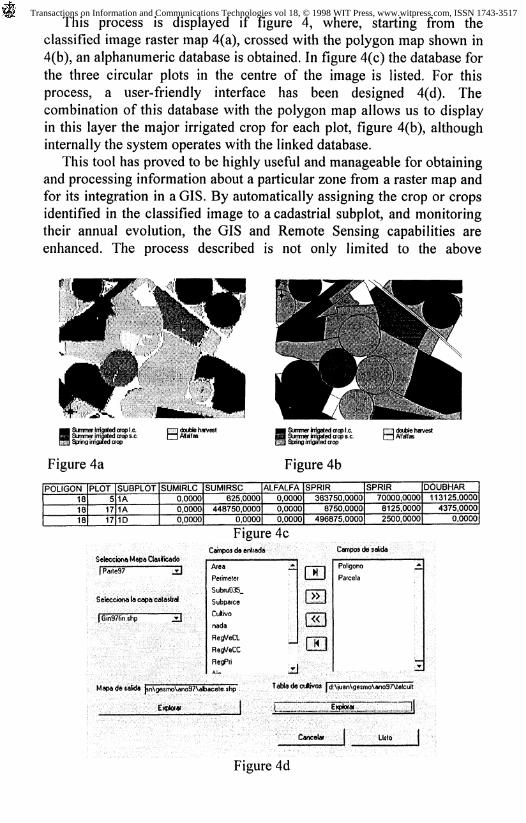
This process is displayed if figure 4, where, starting from theclassified image raster map 4(a), crossed with the polygon map shown in
4(b), an alphanumeric database is obtained. In figure 4(c) the database for
the three circular plots in the centre of the image is listed. For thisprocess, a user-friendly interface has been designed 4(d). Thecombination of this database with the polygon map allows us to displayin this layer the major irrigated crop for each plot, figure 4(b), althoughinternally the system operates with the linked database.
This tool has proved to be highly useful and manageable for obtainingand processing information about a particular zone from a raster map andfor its integration in a GIS. By automatically assigning the crop or cropsidentified in the classified image to a cadastrial subplot, and monitoringtheir annual evolution, the GIS and Remote Sensing capabilities areenhanced. The process described is not only limited to the above
Figure 4a
v irrigated crop I.e.-_._..2r irrigated crop s.c.
Figure 4b
Hdaite harvest/Walfas
POLIGON181818
PLOT51717
SUBPLOT1A1A10
SUMIRLC0,00000,00000,0000
SUMIRSC625,0000
448750,00000,0000
ALFALFA0,00000,00000,0000
SPRIR363750,00008750,0000
496875,0000
SPRIR70000,00008125,00002500,0000
DOUBHAR113125,00004375,0000
0,0000
3a«ciond Mapa uatf K&OQJPaile97 jd
Selecciona la capa catatbal
j Gin97fin.shp jsJ
Figure 4cCampos d@ enliadaArea •*PerimeterSubiu035_Subpaice
nadaRegrVeCtRetf/eCCRegPriA;- -H
s
.
Campo* tte $alidaPoliaono •*Parcela
......
MapadesaWa j»n\gesrrxAano97\abacete shp
Exptow |
TaWadocuftivo* j d:\juan\gesmo\ano97Melcult
Cancel*
Figure 4d
Transactions on Information and Communications Technologies vol 18, © 1998 WIT Press, www.witpress.com, ISSN 1743-3517

70 GIS Technologies and their Environmental Applications
mentioned layers, but can be extended to any raster or vector map, or
even two vector maps with the geographic intersection criterion.
4 Temporal evolution of subterranean water
extraction
One of the GIS capabilities is the estimation of aquifer water
extraction for agricultural uses, which represents most of the totalextracted volume. This is an especially relevant datum for sustainable
aquifer management and constitutes in itself an input for the
hydrogeologic model. Within these estimations, an important parameter
is the interannual variation produced by changes in the surface destinedfor each type of crop, and the agrometeorological conditions thatdetermine the water demands for each campaign. It is also important toconsider the annual evolution during the agrarian campaign, regardingthe date when the water extractions are made, which is a function of thecrop water demands. In figure 5, the water extraction annual evolution in
the pilot area for the 1997 campaign is given. The estimations shown inthis figure are based on the knowledge of hydric needs for each crop(quantified week by week), calculated by the Irrigation Advisory Service
belonging to Diputacion de Albacete Lopez [7] on the basis of the crop
Figure 5
Transactions on Information and Communications Technologies vol 18, © 1998 WIT Press, www.witpress.com, ISSN 1743-3517
GIS Technologies and their Environmental Applications 71
phenology, agrometeorological conditions and the direct monitoring of alarge number of control plots. The surfaces estimated for each different
crop are those identified by Remote Sensing, thus the same calculation
can be accomplished for any zone in the aquifer where images are
available.
Conclusions
The GIS has proved to be a suitable tool for managing complexsystems, where a great number of variables whose main feature is spatiallocation are involved. Such is the case of aquifer system 08-29 describedin this study. Remote Sensing has been useful for producing land use
maps in which the different irrigated crops are identified and
discriminated by a multitemporal classification process in which images
from different dates are used.The integration of Remote Sensing in the GIS has been accomplished
by a process that assigns the crop or crops previously identified as classesto each cadastrial plot. This process consists in the intersection of apolygon layer (the digital cadaster) with the classified image raster map.Each polygon corresponds to a spatially delimited subplot, the
assignment of other attributes also being possible.This integration process notably increases the GIS and Remote
Sensing tool capabilities and usefulness. The GIS capabilities increasebecause it accesses and manages a great amount of information whoseacquisition would be economically unapproachable by other ways, sinceit deals with large land surfaces. Furthermore, it facilitates the checkingof fieldwork plot by plot, and the plots can be grouped as exploitations,which are the elementary aquifer management units, allowing themonitoring of exploitations interannually. Remote Sensing also increasesits potential as an information source for the monitoring and control of
irrigated crops.One of the basic GIS utilities is the aquifer water extraction estimation
for agricultural purposes that represent a percentage higher than 80% ofthe total subterranean water extractions. This analysis needs informationabout the crop water needs. It is made spatially, either at the level of thewhole aquifer or other smaller units, making it possible to monitor thetemporal evolution of subterranean water extractions for agriculturaluses, either between years or within the agricultural campaign.
Transactions on Information and Communications Technologies vol 18, © 1998 WIT Press, www.witpress.com, ISSN 1743-3517
72 GIS Technologies and their Environmental Applications
Acknowledgements
This research is financed by the CICYT project n° HID96-1373. Our
acknowledgement specially to the JCRMO ( General Board of Irrigation
Users of Eastern La Mancha).
References
[1]MOPTMA, 1995. Libro bianco de las aguas subterraneas. Ed.
Ministerio de Obras Publicas, Transposes y Medio Ambiente y
Ministerio de Industria y Energfa, Madrid, 135 pp.
[2]Goodchild, M. F., 1993. The state of GIS for environmental problem-solving. In: M. F. Goodchild, B.O. Parks, L.T. Steyaert (Editors),Environmental Modeling with GIS. Oxfor University Press, pp 8-15.
[3]Moran, M. S. , Inoue, Y., and Barnes, E. M., 1997. Opportunities and
limitations for image-based remote sensing in precision crop
management. Remote Sens. Environm., 61:319-346
[4]Menenti, M.; Azzali, S.; d'Urso, G., 1996. Remote Sensing, GIS andHidrological Modelling for Irrigation Management. In: L.S. Pereira; R.A. Feddes; J.R. Gilley and B. Lesaffre (Editors), Sustainability ofIrrigated Agriculture, Kluwer Academic Publishers, Dordrech, pp 453-
472
[5]Calera, A.; Medrano, J.; Vela, A.;Castano, S.. GIS Tool Applied to theSustainable Management of Hydric Resources. Application to theAquifer System 08-29. Agri. Water Management. Special Issue of theWorkshop "The Use of Water in Sustainable Agriculture"2-4 June 1997,Albacete, Spain
[6]Martin de Santaolalla Manas, F.; Brasa Ramos, A.; Fabeiro Cortes, C.;Fernandez Gonzalez D.; Lopez Corcoles, H. Integrated managementsystem of an aquifer in Castilla La Mancha, Spain. The role of IrrigationAdvisory Service of Albacete. Agric. Water Manag. Special Issue of theWorkshop "The Use of Water In Sustainable Agriculture" 2-4 June 1997,Albacete, Spain (submitted)
[7] Lopez, P. and Lopez, H., 1993. Servicio de asesoramiento de riegos.In: Agronomia del Riego, Ed. Mundi Prensa, Madrid.
Transactions on Information and Communications Technologies vol 18, © 1998 WIT Press, www.witpress.com, ISSN 1743-3517