Embed Size (px)
Citation preview
Project Numbers: 41910-01 Loan Number: 2364 September 2014
Subordinated Loan International Bank of Azerbaijan (Azerbaijan)
This is an abbreviated version of the XARR which excludes commercially sensitive and confidential business information that is subject to exceptions to disclosure set forth in ADB's Public Communications Policy 2011.
Extended Annual Review Report

CURRENCY EQUIVALENTS Currency Unit – Azerbaijan manat/s (AZN)
At Appraisal At Project Completion
14 September 2007 24 June 2011 AZN1.00 – US$1.09529 US$1.27242 US$1.00 – AZN0.91300 AZN0.78590
ABBREVIATIONS
ADB – Asian Development Bank CAGR – compounded annual growth rate CAR – capital adequacy ratio CBAR – Central Bank of Azerbaijan EMS – environmental management system EROIC – economic return on invested capital GDP – gross domestic product IBA – International Bank of Azerbaijan LIBOR – London interbank-offered rate NPL – non-performing loan ROIC – return on invested capital SMEs – small and medium-sized enterprises
NOTE
(i) The fiscal year ends on 31 December. FY before a year denotes the year in which the fiscal year ends, e.g., FY2010 ends on 31 December 2010.
Vice-President L. Venkatachalam, Private Sector and Cofinancing Operations Director General T. Freeland, Private Sector Operations Department (PSOD) Director C. Engstrom, Private Sector Financial Institutions Division, PSOD Team leader S. Hruschka, Principal Investment Specialist, PSOD
In preparing any country program or strategy, financing any project, or by making any designation of or reference to a particular territory or geographic area in this document, the Asian Development Bank does not intend to make any judgments as to the legal or other status of any territory or area.

CONTENTS
Page BASIC DATA i EXECUTIVE SUMMARY ii
I. THE PROJECT 1
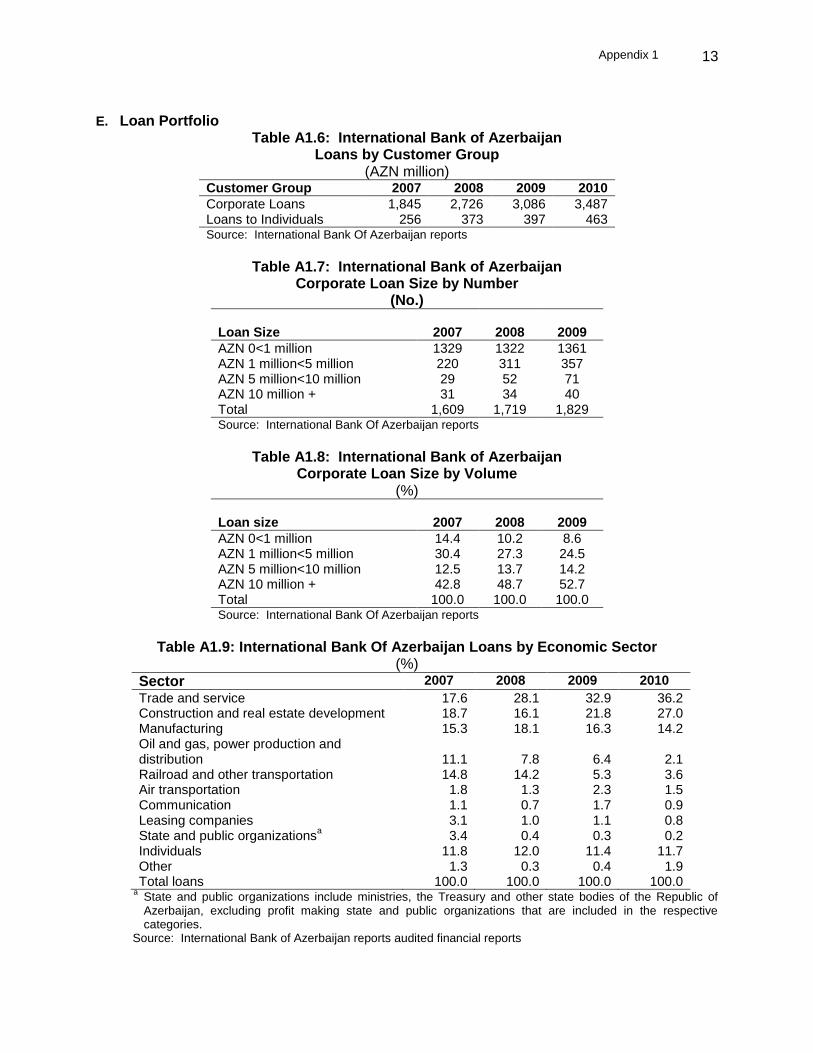
A. Project Background 1 B. Key Project Features 1 C. Progress Highlights 1
II. EVALUATION 2
A. Project Rationale and Objectives 2 B. Development Impact and Outcome 3 C. ADB Investment Profitability 7 D. ADB Work Quality 8 E. ADB’s Additionality 9 F. Overall Evaluation 9
III. ISSUES, LESSONS, AND RECOMMENDED FOLLOW-UP ACTIONS 10
A. Issues and Lessons 10 B. Recommended Follow-Up Actions 10
APPENDIXES 1. Project Related Data 11 2. Funding from International Finance Institutions 14 3. Private Sector Development Indicators and Ratings: Financial Intermediaries 15 4. Sector and Operations Review 18 5. Comparative Financial Statements 22 6. Estimation of Return on Invested Capital 24 7. Strengthened Capitalization and Portfolio Quality, Update 2014 27

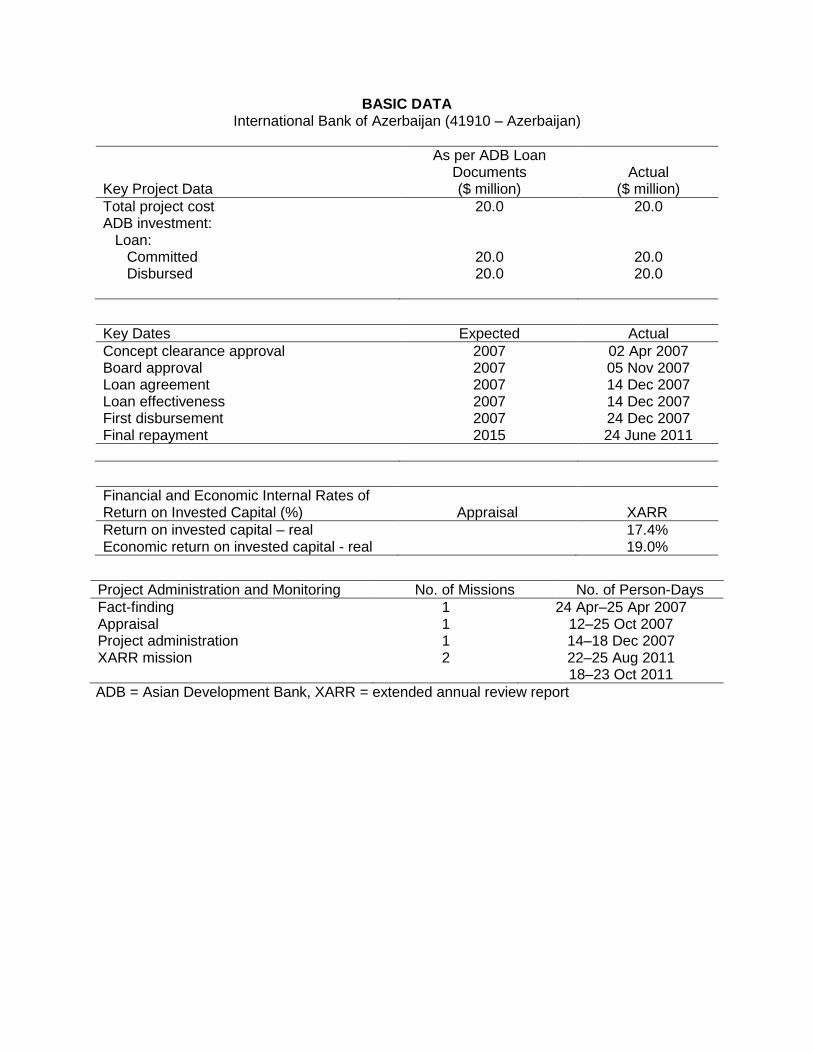
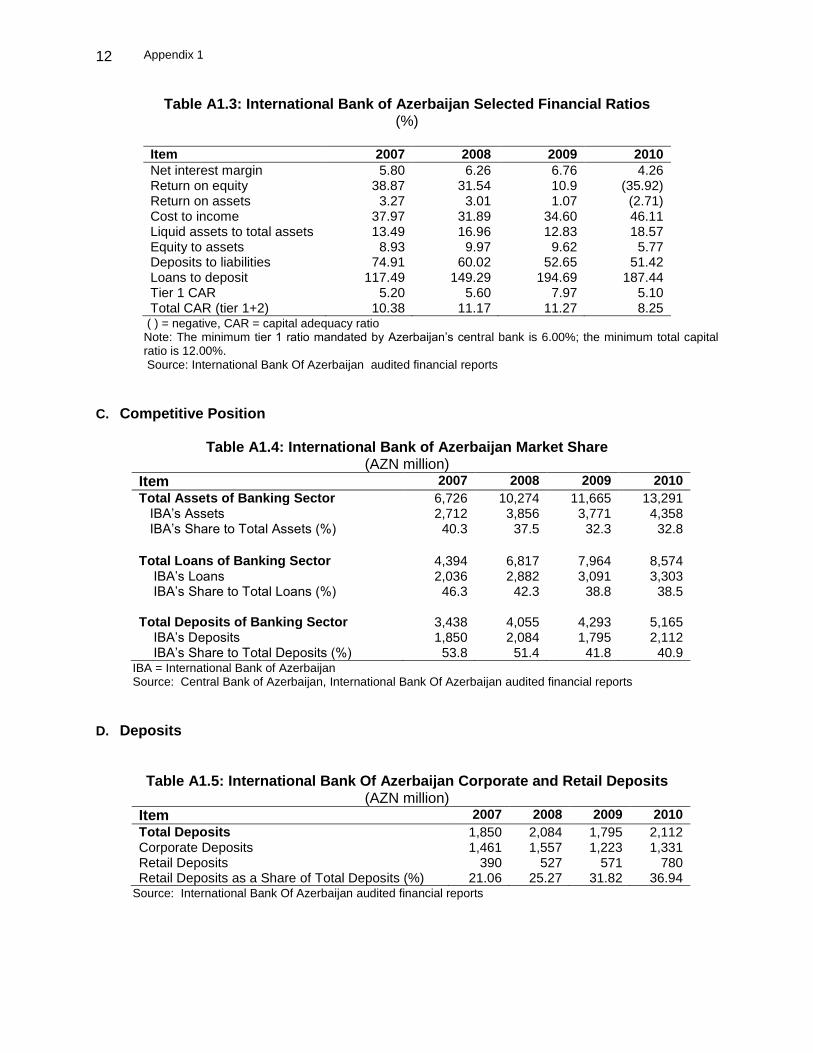
BASIC DATA International Bank of Azerbaijan (41910 – Azerbaijan)
Key Project Data
As per ADB Loan Documents ($ million)
Actual ($ million)
Total project cost ADB investment:
Loan: Committed Disbursed
20.0
20.0 20.0
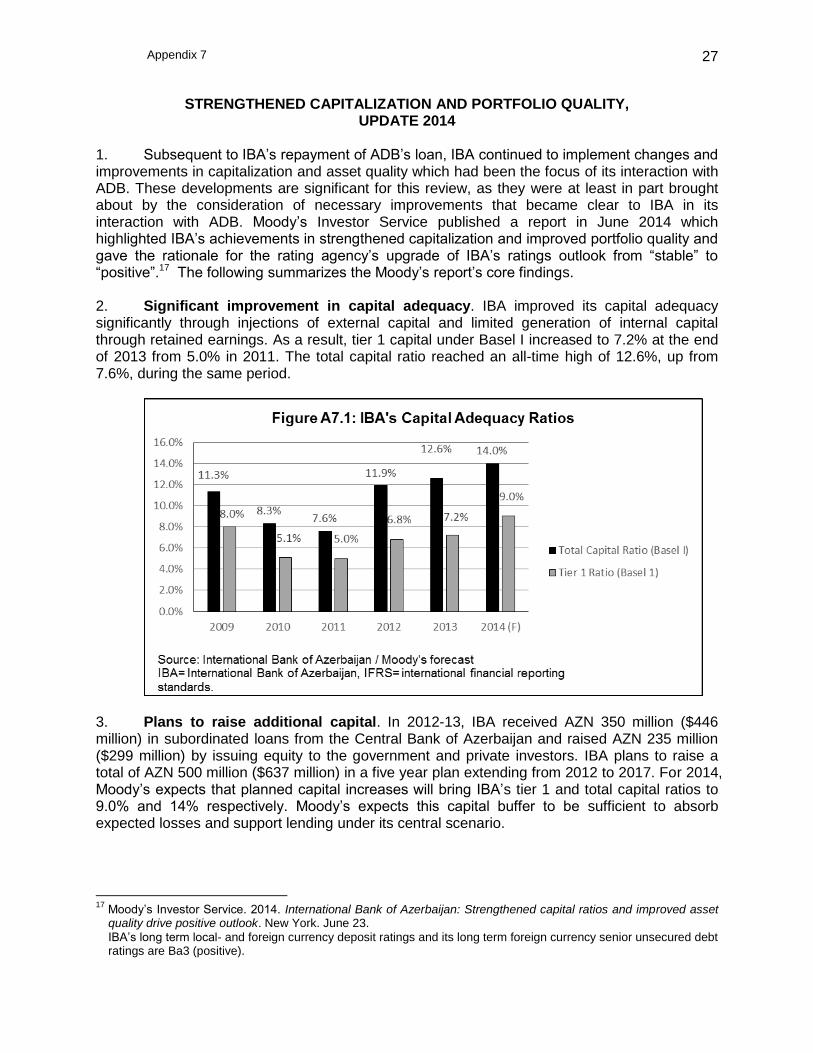
20.0
20.0 20.0
Key Dates Expected Actual
Concept clearance approval Board approval Loan agreement Loan effectiveness First disbursement Final repayment
2007 2007 2007 2007 2007 2015
02 Apr 2007 05 Nov 2007 14 Dec 2007 14 Dec 2007 24 Dec 2007 24 June 2011
Financial and Economic Internal Rates of Return on Invested Capital (%) Appraisal XARR
Return on invested capital – real Economic return on invested capital - real
17.4% 19.0%
Project Administration and Monitoring No. of Missions No. of Person-Days
Fact-finding Appraisal Project administration XARR mission
1 1 1 2
24 Apr–25 Apr 2007 12–25 Oct 2007 14–18 Dec 2007 22–25 Aug 2011 18–23 Oct 2011
ADB = Asian Development Bank, XARR = extended annual review report
ii
EXECUTIVE SUMMARY
The Republic of Azerbaijan joined the Asian Development Bank (ADB) in 1999 and
signed ADB’s Private Sector Operations Framework Agreement in November 2004. In 2005, ADB missions to Azerbaijan identified intervention opportunities in the financial sector. This led to ADB’s first private sector project in the country in 2006, in the form of a financing package of up to $15 million to privately owned banks and leasing companies. A subsequent ADB mission in January 2007 met with Azerbaijani banks to explore areas of cooperation for private sector development. Following a meeting with the mission, the International Bank of Azerbaijan (IBA)—a state-owned bank and the largest bank in the country—formally requested ADB to submit a proposal for subordinated debt financing, as part of its 2007 recapitalization strategy and ongoing diversification into lending to small and medium-sized enterprises (SME) and retail businesses.
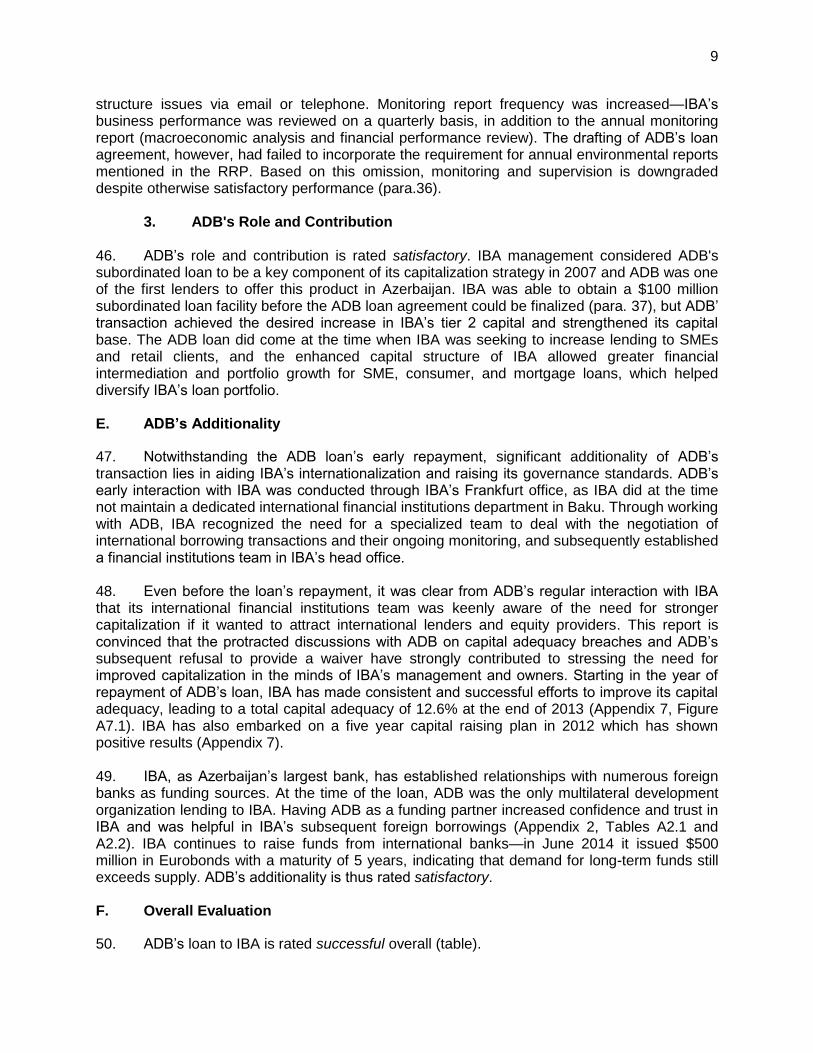
On 14 December 2007, ADB signed a facility agreement with IBA for a $20 million subordinated loan, the proceeds of which were fully disbursed on 24 December 2007. The loan was to be repaid in 8 years, with a 5-year grace period. During the course of the loan, IBA had breaches of reporting (timely submission of financial statements) and financial covenants (capital adequacy ratios), for which ADB granted waivers. In December 2010, ADB refused to grant further waivers for IBA’s covenant breaches. The waivers were needed to allow IBA to access loan facilities from other financial institutions. As a result, in January 2011, IBA decided to fully prepay the subordinated loan, which it did on 24 June 2011.
ADB’s subordinated loan to IBA was aimed at strengthening its capital base, which
would enhance IBA’s ability to expand lending, particularly to SMEs and retail clients, and increase financial intermediation in Azerbaijan. The strengthening of IBA's capital base would also increase investor confidence in IBA and expand the pool of potential investors, thereby increasing the potential for successful future privatization of IBA. The loan would also support the development and growth of a sustainable banking sector by introducing the tier 2 subordinated capital model.
Despite the shorter than expected life of the loan, the overall impact of ADB’s loan to IBA
on private sector development is rated satisfactory. ADB’s subordinated loan helped enhance the capital structure of IBA. Although IBA quickly outgrew its regulatory capital adequacy measures due to rapid asset growth, ADB’s loan supported the growth of IBA. IBA’s continued expansion underpinned banking industry growth and enabled it to fulfill its development mandate of providing support to priority areas, particularly non-oil industries. IBA’s support for non-oil companies, from big corporates to SMEs, contributed to the government’s goal of broad-based, sustainable economic growth.
IBA’s business and economic performance is rated satisfactory. Although IBA’s capital
position has been below regulatory norms because of rapid asset growth, it has historically reported good profitability, supported by robust interest margins and a relatively strong capacity to generate revenue from fees and commissions. IBA’s operations also benefit from relatively low operating costs resulting from the predominantly wholesale nature of IBA’s business, and its low-cost funding base, which is mainly sourced from the current accounts of the bank’s large customers. After the repayment of ADB’s loan, IBA embarked on a number of recapitalization efforts with significantly improved the bank’s capital position and thus security and attractiveness to international investors. ADB’s efforts, including its decision to accept IBA’s early repayment, contributed in some measure to convincing IBA of the need for reform.
iii
The investment profitability of the project is rated satisfactory. The margin charged by
ADB to IBA was higher by a factor of 1.2–1.3 than a commercially priced subordinated loan facility obtained by IBA in 2007.
The project’s environmental, social, health, and safety performance is rated satisfactory. ADB’s loan to IBA was classified in the financial intermediary category under ADB's Environment Policy (2002) and category C under ADB's Involuntary Resettlement Policy (1995) and ADB's Policy on Indigenous Peoples (1998). IBA has an environmental management system in place to ensure that only environmentally and socially sound projects and businesses are financed and that borrowers comply with applicable environmental laws and regulations. IBA’s environmental management system procedures are integrated into the entire loan cycle: pre-approval, loan approval and agreement, monitoring, and audit stages.
ADB’s work quality is rated satisfactory. This is based on its (i) screening, appraisal, and structuring; (ii) monitoring and supervision; and (iii) ADB’s role and contribution. IBA was selected as the recipient of ADB’s first subordinated loan in Azerbaijan because it was the dominant and most influential bank in the industry, and thus a loan to IBA would produce strong demonstration effects. IBA’s plans to increase financial intermediation to SMEs and retail clients were also aligned with ADB’s strategy to support SMEs and non-oil sector growth in Azerbaijan.
ADB’s additionality is rated satisfactory. IBA management considered ADB's subordinated loan the cornerstone of its capitalization strategy in 2007. The subordinated loan increased IBA’s tier 2 capital and strengthened its capital base, although subsequent rapid asset growth weakened IBA’s capital position. ADB’s interaction with IBA directly led to the creation of a dedicated international financial institutions department in its head office, covering borrowing and loan monitoring, and reinforced the need for measures to sustainably increase IBA’s capital base. The ADB loan also helped raise awareness of the need to improve IBA’s governance standards. ADB’s enforcement of reporting and financial covenants encouraged IBA to foster proper disclosure and transparency, which contributed to improved governance.
This review rates ADB’s subordinated loan facility to IBA as successful overall. The transaction was evaluated in 2011, but publication of the report was delayed due to
staffing limitations. Financial data available in 2011 were used for the most part. However, to illustrate progress made by IBA in capitalization and portfolio quality to which ADB has contributed, some current 2014 information was provided in the report’s body and in Appendix 7.

1
I. THE PROJECT
A. Project Background
1. The Republic of Azerbaijan joined the Asian Development Bank (ADB) in 1999 and signed ADB’s Private Sector Operations Framework Agreement in November 2004. In 2005, ADB missions to Azerbaijan identified intervention opportunities in the financial sector. This led to ADB’s first private sector project in the country in 2006, in the form of a financing package of up to $15 million to privately owned banks and leasing companies (Bank Respublika, Azerigazbank, and AccessBank, formerly Microfinance Bank of Azerbaijan).1 2. A subsequent ADB mission in January 2007 met with Azerbaijani banks to explore areas of cooperation for private sector development. Following a meeting with the ADB mission, the International Bank of Azerbaijan (IBA)—a state-owned bank and the largest bank in the country—formally requested ADB to submit a proposal for subordinated debt financing, as part of its 2007 recapitalization strategy, and ongoing diversification into lending to small and medium-sized enterprises (SMEs) and retail businesses. On 14 December 2007, ADB signed a facility agreement with IBA for a $20 million subordinated loan, the proceeds of which were fully disbursed on 24 December 2007. B. Key Project Features
3. The $20 million subordinated loan to IBA had a maturity of 8 years with a 5-year grace period. The loan was priced at a floating rate of 385 basis points over the 6-month London interbank-offered rate (LIBOR) for the first 5 years and 535 basis points over the 6-month LIBOR for the remaining 3 years. 4. During the course of the loan, IBA had breaches of timely reporting and financial covenants (capital adequacy ratios), for which ADB granted waivers. In December 2010, ADB refused to grant further waivers for IBA’s breaches of the capital adequacy covenants. The waivers were needed to allow IBA to access loan facilities from other financial institutions. As a result, in January 2011, IBA decided to fully prepay the subordinated loan, which it did on 24 June 2011. C. Progress Highlights
5. IBA showed good profitability during 2007–2009, followed by a loss in 2010 because of greater loan loss provisioning (Appendix 1, Table A1.2). In 2008, IBA posted a record high net income of AZN98.8 million as a result of robust lending growth under favorable macroeconomic conditions. Amidst rising non-performing loans (NPLs) that required higher provisioning, IBA recorded a net profit of AZN41 million in 2009. Following high profitability in 2008 and 2009, Fitch Ratings raised IBA’s long-term foreign currency Issuer Default Rating in May 2010 to BBB-from BB+ after Azerbaijan’s sovereign rating was increased to investment grade. Also in 2010, Moody’s Investor Service changed the outlook on IBA’s Baa3 long-term local currency deposit rating and Ba1 long-term foreign currency subordinated debt rating from negative to stable, citing sufficient 2009 earnings to cover higher level of provisions.2
1 ADB. 2006. Report and Recommendation of the President to the Board of Directors: Proposed Assistance to
Private Banks and Leasing Companies in Azerbaijan. Manila. 2 Moody’s Investor Service. 10 August 2010. Rating Action: Moody’s Changes Outlook on International Bank of
Azerbaijan Ratings to Stable from Negative. https://www.moodys.com/research/Moodys-changes-outlook-on-International-Bank-of-Azerbaijan-ratings-to--PR_203892
2
6. Despite recording profits and capital injections during 2007–2009, IBA’s capitalization remained weak due to rapid asset growth and dividend payments. As a result, the bank’s tier 1 capital adequacy ratio (CAR) and total CAR failed to meet regulatory standards (Appendix 1, Table A1.3), leading to repeated breaches of ADB’s covenants beginning at the end of 2007. 7. ADB granted waivers for IBA’s breaches of capital covenants based on IBA’s pledges and plans to resolve capital adequacy issues, which IBA was subsequently unable to adequately address. ADB indicated that further waivers would not be granted unless IBA demonstrated credible indications of plans to address the issue and develop a solution to the capital structure problem.
8. Beginning in 2008 IBA failed to meet reporting covenants, in particular relating to timely submission of audited financial statements. In March 2010, in consideration of the size of IBA’s operations, the grace period for submitting required financial reports was extended to 120 days (from 90 days) for audited annual and semi-annual financial statements, and to 45 days (from 30 days) for first quarter and third quarter management reports. However, even with the extended time limit, IBA was unable to comply with the reporting requirement as of 30 June 2010, citing delays caused by a change in external auditors. 9. ADB’s decision not to waive additional covenant breaches in the absence of a strategy to increase capitalization temporarily prevented IBA in June 2010 from utilizing a $50 million loan facility from Deutsche Bank that carried a cross-default provision. In January 2011, IBA proposed to prepay the $20 million subordinated loan on 24 June 2011. ADB agreed to prepayment of the subordinated loan.3 The prepayment became the condition for the waiver of existing breaches.
10. In 2011, the government actively evaluated plans for IBA’s privatization in order to address its capitalization issues by selecting a consortium of consultants. No timeframe for the completion of a privatization was been announced. During the first half of 2012, IBA received capital injections comprising AZN50 million from the Ministry of Finance and a AZN150 million subordinated loan from the Central Bank of Azerbaijan, both which helped IBA augment its capital position. Overall, IBA received AZN 350 million ($446 million) in subordinated loans and equity in 2012-13 and embarked on a five year capitalization plan in 2012, which is expected to lead to a total capital adequacy of 14% in 2014 (Appendix 7 describes IBA’s efforts to improve capitalization and portfolio quality after ADB’s repayment).
II. EVALUATION
A. Project Rationale and Objectives
11. ADB’s subordinated loan to IBA was aimed at strengthening its capital base, which would in turn enhance the bank's ability to expand its lending, particularly to SMEs and retail clients, and increase financial intermediation in Azerbaijan. The strengthening of IBA's capital base would also increase investor confidence in IBA and expand the pool of potential investors, thereby increasing the potential for successful future privatization of IBA. The loan would also support the development and growth of a sustainable banking sector by introducing the tier 2 subordinated capital model.
3 ADB. March 2011. Annual Monitoring Report International Bank of Azerbaijan. Manila.
3
B. Development Impact and Outcome
12. The development impact and outcome are rated satisfactory when evaluated using the following criteria: (i) private sector development, (ii) business success, (iii) economic sustainability, and (iv) environmental, social, health, and safety performance.
1. Private Sector Development a. Overall Assessment of Private Sector Development
13. ADB’s subordinated loan helped enhance the capital structure of IBA. Although IBA outgrew its regulatory capital adequacy measures due to rapid asset growth, ADB’s loan made a significant contribution to supporting the growth of IBA. IBA’s continued expansion underpinned banking industry growth and enabled IBA to fulfill its development mandate of providing support to priority areas, particularly non-oil industries. IBA’s support for non-oil companies, from big corporate entities to SMEs, contributed to the government’s goal of broad-based, sustainable economic growth. In this regard, the contribution of ADB assistance to private sector development is rated satisfactory.
b. Beyond Company Impact
14. Strengthen the banking sector. IBA is the sole remaining state-owned bank in Azerbaijan.4 Robust economic growth coupled with the reforms and guidance of the Central Bank of Azerbaijan (CBAR) have enabled private banks to grow rapidly and challenge the dominant position of IBA. Although the strong performance of private banks reduced IBA’s dominance, IBA continues to occupy a leading position in the banking sector. As of the end of 2010, IBA remains the largest bank in Azerbaijan by most key indicators, controlling 33% of banking sector assets, 39% of loans and 41% of deposits (Appendix 1, Table A1.4). 15. Given its size and importance, IBA plays a significant role in the development of Azerbaijan’s financial system. During 2007–2010 IBA’s assets grew by a compounded annual growth rate (CAGR) of 17.1%. Loan portfolio expanded by a CAGR of 17.5%, helping strengthen the banking sector’s role in the domestic economy during this period. The banking sector assets–gross domestic product (GDP) ratio increased from 25.6% in 2008 to 31.9% in 2010. Similarly, the loan–GDP ratio rose from 17.9% in 2008 to 22.0% in 2010 (Appendix 3, Figures A1.1 and A1.2). 16. IBA helped increase public confidence in the banking system. Since 2007, IBA’s deposits have increased by AZN261.1 million to reach AZN2.1 billion by the end of 2010. Growth was driven by consumer or retail deposits, which increased by a CAGR of 26.0% during 2007–2010. IBA’s retail deposits as a percentage of its total deposits increased from 21% in 2007 to 37% in 2010, indicating increased trust in IBA, and by extension the banking system in general (Appendix 1, Table A1.5).
17. IBA has enhanced the international image of Azerbaijan’s banking sector. Since 2007, IBA has opened four overseas representative offices, bringing the total to six as of the end of 2010. Together with its two subsidiaries in Russia and Georgia, IBA’s international presence has helped promote the sector’s integration into the international banking arena. IBA has also received several international awards and accolades, promoting visibility of the Azerbaijan
4 In 2008, the other state-owned bank, Kapital Bank, was completely privatized.
4
banking sector. Moreover, the banking sector received a boost with the revival in 2011 of the long-planned privatization of IBA. 18. Promote development of non-oil sector. A key economic challenge for Azerbaijan is development of the non-oil sector, with the goal of achieving sustainable growth by creating income-generating and employment opportunities, in areas that include trade, banking and finance, and SMEs. IBA has supported the government’s policy of promoting the non-oil sector by increasing lending to non-oil industries. During 2007–2010, loans to the trade and services sector grew by a CAGR of 55.5%, followed by the construction and real estate development sector (CAGR of 38.0%) and the manufacturing sector (CAGR of 19.1%). Table A1.9 in Appendix 1 illustrates the increase in IBA loans to non-oil industries. 19. IBA helped finance key projects in construction, agribusiness, and glassware production. Apart from providing financing, IBA’s banking expertise and international experience in trade and investment have enabled it to support non-oil companies as a consultant and financial advisor. Moreover, IBA’s strong relations with international financial institutions and foreign businesses have been helpful in marketing non-oil companies abroad and attracting investments into non-oil industries. 20. Accord, one of Azerbaijan’s largest private construction companies, globalized its operations with the help of IBA funding and trade finance guarantees. IBA continues to support Accord’s projects in Georgia and Kazakhstan. IBA is helping CTS Agro (cotton production) and Bakfem (hazelnut production) access international funding by promoting these companies to international investors. Bakfem’s success has revived hazel production as a booming industry, which produces and exports its own hazelnuts and sources supplies from other local producers. It sells local products to Russia and is preparing to expand into China and other parts of Europe. Bakfem has helped consolidate an industry that was previously fragmented and dominated by many small producers. 21. The support provided by IBA to non-oil companies has helped improve the performance of the non-oil sector. Table A4.1 in Appendix 4 compares GDP growth in the oil and non-oil sectors with total GDP growth during 2007–2010. The growth of the non-oil sector has strengthened, outperforming oil sector growth in 2008 and 2010. The drop of the non-oil sector’s contribution to GDP in 2009 resulted from the effects of the global recession, during which the rise in oil prices overshadowed non-oil sector growth. However, in 2010 the non-oil sector rebounded, registering growth of 7.9% growth versus 1.8% growth for the oil sector. The non-oil sector’s growth and increased contribution to GDP has helped sustain employment, maintaining the average unemployment rate at 0.9%–1.0% during 2006–2010. 22. Provide a standard for other banks to raise subordinated debt. Azerbaijan’s rapidly growing economy and banking sector places inevitable pressure on capital adequacy. Subordinated debt, which counts as tier 2 capital, can be used as a capital instrument to achieve regulatory capital requirements. The subordinated loan provided by ADB to IBA was envisaged as having important demonstration effects that would highlight the benefits of using tier 2 capital for undercapitalized Azerbaijani banks. As the leading bank in Azerbaijan and an early adopter of tier 2 capital, IBA was in a key position to promote the use of the tier 2 subordinated debt capital management model by other banks. A number of Azerbaijani banks used subordinated debt from international financial institutions in 2007 and 2008 with the goal of achieving adequate capitalization supportive of rapid asset growth (Appendix 2, Table A2.4).
5
c. Direct Company Impact
23. Strengthen capital position. ADB’s subordinated loan, which qualified as tier 2 capital, aimed to strengthen IBA’s capital base and enable it to sustain and expand its operations, and meet regulatory capitalization requirements. The subordinated loan improved the capital position of IBA and underpinned its continued growth, but capitalization was repeatedly depleted by strong asset growth, rendering IBA unable to meet regulatory and ADB CAR requirements. 24. During 2007–2010, IBA’s tier 1 capital grew by a CAGR of 21.0%, and total regulatory capital by a CAGR of 12.8%, more slowly than risk-weighted assets (CAGR of 21.8%) and the loan portfolio (CAGR of 22.5%). During this period IBA was not in compliance with CBAR regulatory norms (but not sanctioned in its CBAR audit report) for both tier 1 CAR and total CAR (Table A1.3). IBA was also in breach of ADB capital covenants during 2007, 2008 and 2010. In 2009, IBA was able to meet the tier 1 CAR requirements of CBAR (6.0%) and ADB (8.0%), but failed to meet the limit set for total CAR (12.0%). IBA’s capitalization was further weakened by annual dividend payments. In 2009, IBA paid dividends amounting to AZN73.6 million, equivalent to 153.3% of reported earnings.5 25. Although this report extends only through 2011, it is worth noting that in the first half of 2012, IBA received capital injections comprising AZN50 million (tier 1) from the Ministry of Finance and a AZN150 million (tier 2) subordinated loan from the CBAR. The capital infusion improved IBA’s CARs (as of the end of June 2012) as follows: tier 1 CAR reached 6.03% (versus 4.95% at the end of 2011), and total CAR 10.78% (versus 7.60% at the end of 2011). IBA has since 2011 made consistent and successful efforts to improve its capital adequacy, leading at the end of 2013 to a total capital adequacy of 12.6% (Appendix 7, Figure A7.1) and has also embarked on a five year capital raising plan in 2012 which has shown positive results (Appendix 7, Figure A7.2).6
26. Impact on corporate culture. IBA’s interaction with ADB led to the establishment of a dedicated financial institutions team in charge of international borrowing and transaction monitoring, whereas previously such functions had been exercised on an ad-hoc basis through treasury staff and IBA’s Frankfurt office. ADB’s refusal to continue waiving capital adequacy breaches, while challenging for both parties at the time, almost certainly reinforced in the minds of management and IBA’s owners the need for reforms. See further discussion on impact on corporate culture in ADB Additionality and the results of recent reforms on portfolio quality and capitalization in Appendix 7.
27. Expand lending to small and medium-sized enterprises and the retail sector. Corporate banking has been IBA’s core business, with large corporations, both private and state-owned, constituting its major clients. At the time of the ADB loan in 2007, one of IBA’s key strategic objectives was the development of SME and retail lending to diversify its loan portfolio.7 During 2007–2010, IBA’s retail loans rose by a CAGR of 21.7%. Corporate loans (which include SME loans) grew by a CAGR of 23.7%. As of the end of 2009 IBA had 806,320 retail clients, up from 550,618 in 2007. IBA successfully expanded its portfolio of retail loans alongside its corporate loans (Appendix 1, Table A1.6).
5 Had IBA not paid dividends in 2009, tier 1 CAR would have been 8.5% and total CAR 12.8%, thereby making IBA
compliant with capital adequacy requirements of both the CBAR and the ADB. 6 Moody's Investor Service. 2014. Credit Focus: International Bank of Azerbaijan: Strengthened capital ratios and
improved asset quality drive positive outlook. New York. 23 June. 7 While there are clear definitions for small entrepreneurs in Azerbaijan, there is no official definition of midsize legal
entities. Therefore except for the large companies, all other registered businesses fall within the category of SMEs.
6
28. IBA does not maintain an internal definition for SMEs to enable them to be tracked separately from large corporations, but its strong support for SMEs is reflected by its active involvement in the government’s National Entrepreneurship Fund. The fund was set up in 1992 to deliver concessionary loans to SME entrepreneurs through authorized banks and non-bank credit institutions. In 2010, IBA extended loans amounting to AZN36.4 million under the fund.
29. Furthermore, IBA’s corporate loan size and economic categories exhibit trends favoring SMEs in general. In 2007 IBA made 1,549 corporate loans of less than AZN5 million, a suitable proxy for SME loans (Appendix 1, Table A1.7). In 2009, the number of loans less than AZN5 million had increased to 1,718, even though the absolute share of large loans increased in IBA’s portfolio (Appendix 1, Table A1.8). The share of IBA’s loans to the oil, gas and energy sectors, which are typically large corporations, shrank from 11.1% in 2007 to 2.1% in 2010. During the same period loans to trade and service establishments increased from 17.6% to 36.2%, and real estate and construction loans went up from 18.7% to 27.0% (Table A1.9.); both categories are typically characterized by SMEs.
2. Business Success
30. Financial performance. IBA’s financial highlights and ratios from the end of 2007 to 2010 are in Tables A1.2 and A1.3 (Appendix 1). IBA has historically reported good profitability, supported by robust interest margins and a relatively strong capacity to generate revenue from fees and commissions. IBA’s operations also benefit from relatively low operating costs resulting from the predominantly wholesale nature of IBA’s business, and its low-cost funding base, which is mainly sourced from the current accounts of the bank’s large customers. 31. Profitability. The financial crisis affected IBA’s corporate customers, resulting in rising NPLs that necessitated higher provisioning. IBA reported a net loss of AZN110 million in 2010, from net profits of AZN41 million in 2009 and AZN98.8 million in 2008. The bank’s margins also came under pressure as it turned to more costly sources of funding such as term borrowings from financial institutions because of a reduction in lower-cost corporate deposits. Earnings remained weak in 2011, but with lower provision charges, IBA posted a net income of AZN19.5 million. 32. Asset Quality. The deteriorating operating environment during 2009–2010 affected the quality of IBA’s loan portfolio. The proportion of loans more than 90 days overdue rose slightly to 14.4% of the total portfolio, from 13.8% in 2009. Restructured or rolled over loans grew to 13% of gross loans in 2010, from 2.2% in 2009. IBA extended maturities and renegotiated repayment schedules to help avoid arrears. Starting in 2011, IBA has been able to improve the quality of its loan portfolio through a significant reduction of non-performing loans and increase in its loan loss reserve coverage. Loans more than 90 days overdue stood at 6.5% at year-end 2013, with a loan loss reserve coverage at around 1.5 times (see Appendix 7, Figure A7.3). 33. Liquidity. The loan–deposit ratio decreased to 187.4% in 2010, from 194.7% in 2009. IBA’s liquidity eased in 2010 as deposits grew faster than loans during the year. In 2009, deposits contracted while loans expanded. IBA’s funding base has historically consisted of customer deposits, which comprised 52.3% of total liabilities as of the end of 2010. IBA has been the largest borrower among Azerbaijani banks; as of the end of 2010, total borrowings equaled AZN1.02 billion, or 48% of non-equity funding.
7
34. Return on invested capital. This review used inflation-adjusted return on invested capital (ROIC) as an indicator in assessing the project’s business success.8 The real ROIC is 17.4% (Appendix 6, Table A6.4). Using the standard variables required to estimate the cost of equity and the historical average cost of debt, the weighted average cost of capital to IBA is 10.34%. Based on the extended annual review report guidelines, IBA’s real ROIC exceeds its cost of capital by a margin adequate to qualify for a satisfactory rating for business success. 9
3. Economic Sustainability 35. Economic return on invested capital. To quantitatively assess the contribution to economic development of ADB's subordinated loan to IBA, the economic return on invested capital (EROIC) was used as a proxy, because ADB's loan was not targeted at specific capital investment projects. IBA’s real EROIC after adjusting for inflation was 19.0%, above the hurdle rate of 10.0% to qualify for a satisfactory rating (Appendix 6, Table A6.4). 36. IBA has contributed to the development of the non-oil sector of the economy through the expansion and diversification of its loan portfolio (Appendix 1, Table A1.9). IBA increased its lending to SMEs directly and by way of supporting the government’s National Entrepreneurship Fund (paras. 27 and 28). The bank has also made a positive contribution to the Azerbaijan economy by way of payment of corporate income taxes of AZN58 million during 2007–2011.
4. Environmental, Social, Health, and Safety Performance
37. The project’s environmental, social, health, and safety performance is rated satisfactory. ADB’s loan to IBA was classified as category FI (financial intermediary) under ADB's Environment Policy (2002) and category C under its Involuntary Resettlement Policy (1995) and Policy on Indigenous Peoples (1998). IBA has an environmental management system (EMS) in place based on the Black Sea Trade and Development Bank's environmental safeguards that sets out procedures for screening proposed borrowers and permissible activities that can be financed by a loan. Adherence to EMS standards was stipulated in the ADB loan agreement, but it should be noted that the agreement did not require the submission of annual EMS reports to ADB.10 During the XARR mission, IBA management confirmed verbally that no breaches of IBA’s EMS occurred during the life of ADB’s loan. C. ADB Investment Profitability
38. ADB’s investment profitability is rated satisfactory. The loan to IBA was priced at a margin of 385 basis points over the 6-month London interbank offered rate (LIBOR) for the first 5 years and 535 basis points for the following 3 years. ADB’s loan was benchmarked against a $100 million subordinated loan facility obtained by IBA in May 2007 from European and US institutional investors. The loan facility was structured through an offshore vehicle, Rubrika Finance Company, and priced at an annual fixed interest rate of 8.4% for 10 years. Rubrika’s
8 The real ROIC of IBA’s business was determined by calculating the return on all invested capital (share capital and
long-term loans), net income generated, and its terminal valuation derived using market-based variables. See Appendix 6 for methodology.
9 ADB. 2007. Guidelines for Preparing Performance Evaluation Reports on Nonsovereign Operations. Manila.
10 The report and recommendation of the President (footnote 1) mentions, in para. 83, that ADB would be furnished with annual environmental reports from IBA. However, this statement contrasts with Clause 22.9 of the Loan Facility Agreement, which requires IBA to only “maintain in force and diligently implement the EMS.”
ADB. 2007. Loan contract: ADB Term Facility Agreement Dated 14 December 2007 between The Open Joint Stock Company “International Bank of Azerbaijan” and Asian Development Bank.
8
pricing when converted to a floating rate would be equivalent to 320–330 basis points over LIBOR.11 ADB’s subordinated loan to IBA is considered better than the Rubrika loan due to the (i) lower amount, (ii) shorter tenor, (iii) lower risk, and (iv) better pricing. ADB’s loan had a margin multiple of 1.2–1.3 over the Rubrika loan. 39. IBA paid all the interest due on its loan in a timely manner. Because IBA was unable to obtain further waivers on its covenant breaches, it requested voluntary prepayment of the loan. On 24 June 2011, IBA paid ADB $20.4 million, consisting of principal outstanding ($20 million), interest ($428,326), and a prepayment premium ($30,000).
D. ADB Work Quality
40. ADB's work quality is rated satisfactory based on (i) screening, appraisal, and structuring of the project; (ii) monitoring and supervision; and (iii) ADB’s role and contribution.
1. Screening, Appraisal, and Structuring of the Project
41. The subordinate loan to IBA was in line with ADB’s aim to play a greater role in private sector development in Azerbaijan. Building on the impact of a $15 million ADB financing package to private banks in 2006, a new and more sophisticated product, such as subordinated debt to IBA, was a logical extension of ADB’s financial sector development efforts in Azerbaijan. Subordinated debt (tier 2 capital) is considered an important capital instrument, particularly for Azerbaijani banks, whose capital adequacy has come under pressure due to rapid asset growth amidst a favorable economic environment. 42. IBA was selected as the recipient of ADB’s first subordinated loan in Azerbaijan because IBA was the dominant, most influential bank in the country, and the loan would thus produce a strong demonstration effect. IBA’s plans to increase financial intermediation to SMEs and retail clients were also aligned with ADB’s strategy to support SMEs and non-oil sector growth in Azerbaijan. ADB carried out due diligence with the assistance of an external consultant with strong expertise in the Azerbaijani banking sector. IBA was advised of ADB’s anticorruption, anti-money laundering and anti-terrorism policies.
43. ADB's screening, appraisal, and structuring of its loan facility are rated satisfactory.
2. Monitoring and Supervision
44. ADB's monitoring and supervision is rated less than satisfactory. ADB’s Private Sector Operations Department regularly monitored IBA’s overall business and financial performance following loan approval and disbursement. The bank submitted unaudited financial statements on a quarterly basis and audited financial statements on a yearly basis, together with the required compliance certificate. IBA had recurring breaches of reporting (timely submission of financial statements) and financial covenants (capital adequacy ratios). ADB granted waivers for these breaches after provision by IBA of explanations and credible solutions. 45. ADB was vigilant and proactive in response to IBA’s recurring breaches. ADB maintained open lines of communication with IBA, requesting updates on the bank’s capital
11
The conversion assumes an 8.5-year average life for the Rubrika loan. Based on pricing effective 2 April 2007, 7-year and 10-year historical swap rates were obtained from http://www.swap-rates.com/USRATES_Historic.html. Swap rates around the time the Rubrika loan was granted were stable and the difference between 7-year and 10-year swap rates was around 10 basis points.
9
structure issues via email or telephone. Monitoring report frequency was increased—IBA’s business performance was reviewed on a quarterly basis, in addition to the annual monitoring report (macroeconomic analysis and financial performance review). The drafting of ADB’s loan agreement, however, had failed to incorporate the requirement for annual environmental reports mentioned in the RRP. Based on this omission, monitoring and supervision is downgraded despite otherwise satisfactory performance (para.36).
3. ADB's Role and Contribution 46. ADB’s role and contribution is rated satisfactory. IBA management considered ADB's subordinated loan to be a key component of its capitalization strategy in 2007 and ADB was one of the first lenders to offer this product in Azerbaijan. IBA was able to obtain a $100 million subordinated loan facility before the ADB loan agreement could be finalized (para. 37), but ADB’ transaction achieved the desired increase in IBA’s tier 2 capital and strengthened its capital base. The ADB loan did come at the time when IBA was seeking to increase lending to SMEs and retail clients, and the enhanced capital structure of IBA allowed greater financial intermediation and portfolio growth for SME, consumer, and mortgage loans, which helped diversify IBA’s loan portfolio. E. ADB’s Additionality
47. Notwithstanding the ADB loan’s early repayment, significant additionality of ADB’s transaction lies in aiding IBA’s internationalization and raising its governance standards. ADB’s early interaction with IBA was conducted through IBA’s Frankfurt office, as IBA did at the time not maintain a dedicated international financial institutions department in Baku. Through working with ADB, IBA recognized the need for a specialized team to deal with the negotiation of international borrowing transactions and their ongoing monitoring, and subsequently established a financial institutions team in IBA’s head office. 48. Even before the loan’s repayment, it was clear from ADB’s regular interaction with IBA that its international financial institutions team was keenly aware of the need for stronger capitalization if it wanted to attract international lenders and equity providers. This report is convinced that the protracted discussions with ADB on capital adequacy breaches and ADB’s subsequent refusal to provide a waiver have strongly contributed to stressing the need for improved capitalization in the minds of IBA’s management and owners. Starting in the year of repayment of ADB’s loan, IBA has made consistent and successful efforts to improve its capital adequacy, leading to a total capital adequacy of 12.6% at the end of 2013 (Appendix 7, Figure A7.1). IBA has also embarked on a five year capital raising plan in 2012 which has shown positive results (Appendix 7). 49. IBA, as Azerbaijan’s largest bank, has established relationships with numerous foreign banks as funding sources. At the time of the loan, ADB was the only multilateral development organization lending to IBA. Having ADB as a funding partner increased confidence and trust in IBA and was helpful in IBA’s subsequent foreign borrowings (Appendix 2, Tables A2.1 and A2.2). IBA continues to raise funds from international banks—in June 2014 it issued $500 million in Eurobonds with a maturity of 5 years, indicating that demand for long-term funds still exceeds supply. ADB’s additionality is thus rated satisfactory. F. Overall Evaluation
50. ADB’s loan to IBA is rated successful overall (table).
10
Evaluation of ADB's Subordinated Loan to the International Bank of Azerbaijan
Item Unsatisfactory Less than
Satisfactory Satisfactory Excellent
A. Development Impact and Outcome √ 1. Private sector development √ 2. Business success √ 3. Contribution to economic development √ 4. Environment, social, health, and safety √ B. ADB's Investment Profitability √ C. ADB's Work Quality √ 1. Screening, appraisal and structuring √ 2. Monitoring and supervision √ 3. ADB's role and contribution √ D. ADB's Additionality √
Overall Rating
Successful
ADB = Asian Development Bank. Source: ADB Reports.
III. ISSUES, LESSONS, AND RECOMMENDED FOLLOW-UP ACTIONS
A. Issues and Lessons
51. ADB discussed participation in its trade finance program with IBA, but the latter was reluctant because of its capitalization issues and the outstanding covenant breaches associated with the ADB subordinated loan. Following full settlement of the ADB loan and the recent capital injections by the Ministry of Finance and the CBAR, resumption of trade finance program talks or other areas of cooperation could be explored. 52. ADB’s decision to refuse a waiver of IBA’s capital adequacy covenant was not made lightly. To IBA, which at that time had limited international borrowing experience, this was likely a first time event and cannot have failed to leave an impression on its management. PSOD chose to stress the need for reforms by refusing a waiver, rather than through pursuing the same goal through continued interaction. IBA’s subsequent reform efforts imply that ADB’s decision was a contributing factor. In retrospect, however, it seems recommendable to seek direct interaction with the Azeri government, perhaps with the support of CWRD, before making a final decision. CWRD advised at the time that it did not object to PSOD’s decision to refuse a waiver, but a visit to Baku might have added additional force to ADB’s views, even if the ultimate decision, i.e. to refuse a waiver, might have been the same. B. Recommended Follow-Up Actions
53. None.
Appendix 1 11
PROJECT-RELATED DATA A. Ownership
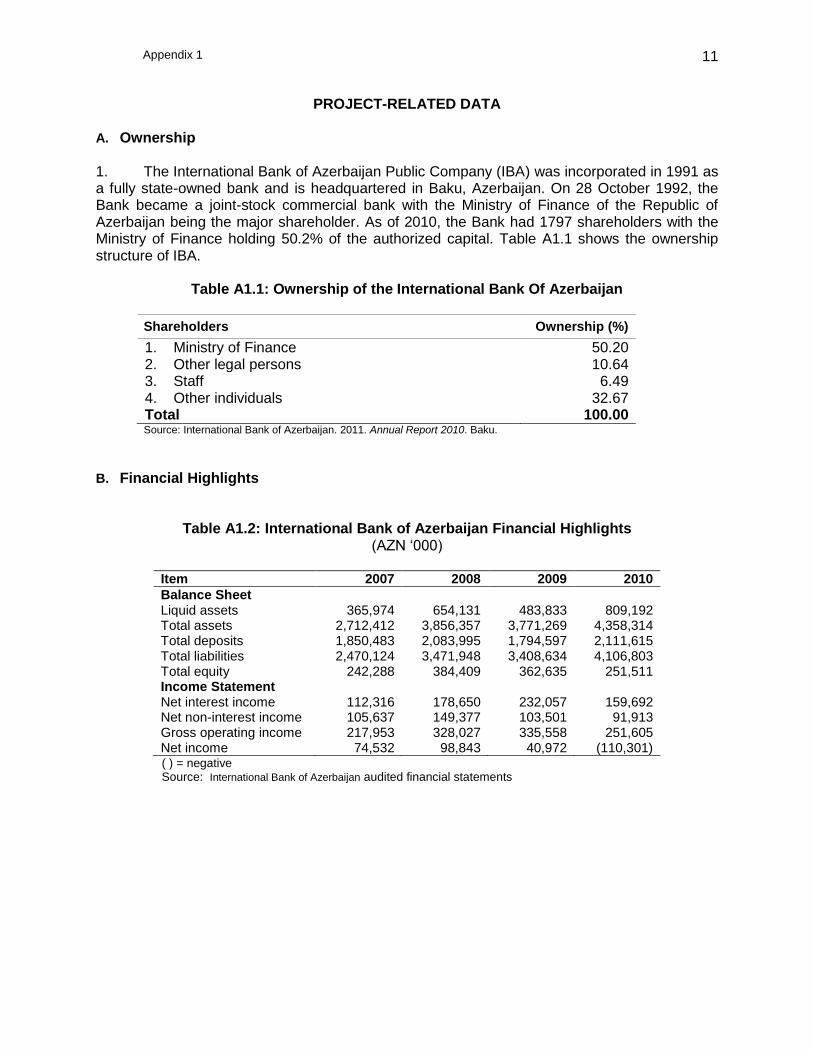
1. The International Bank of Azerbaijan Public Company (IBA) was incorporated in 1991 as a fully state-owned bank and is headquartered in Baku, Azerbaijan. On 28 October 1992, the Bank became a joint-stock commercial bank with the Ministry of Finance of the Republic of Azerbaijan being the major shareholder. As of 2010, the Bank had 1797 shareholders with the Ministry of Finance holding 50.2% of the authorized capital. Table A1.1 shows the ownership structure of IBA.
Table A1.1: Ownership of the International Bank Of Azerbaijan
Shareholders Ownership (%)
1. Ministry of Finance 50.20 2. Other legal persons 10.64 3. Staff 6.49 4. Other individuals 32.67 Total 100.00 Source: International Bank of Azerbaijan. 2011. Annual Report 2010. Baku.
B. Financial Highlights
Table A1.2: International Bank of Azerbaijan Financial Highlights (AZN ‘000)
Item 2007 2008 2009 2010
Balance Sheet Liquid assets 365,974 654,131 483,833 809,192 Total assets 2,712,412 3,856,357 3,771,269 4,358,314 Total deposits 1,850,483 2,083,995 1,794,597 2,111,615 Total liabilities 2,470,124 3,471,948 3,408,634 4,106,803 Total equity 242,288 384,409 362,635 251,511 Income Statement Net interest income 112,316 178,650 232,057 159,692 Net non-interest income 105,637 149,377 103,501 91,913 Gross operating income 217,953 328,027 335,558 251,605 Net income 74,532 98,843 40,972 (110,301) ( ) = negative Source: International Bank of Azerbaijan audited financial statements
Appendix 1 12
Table A1.3: International Bank of Azerbaijan Selected Financial Ratios (%)
Item 2007 2008 2009 2010
Net interest margin 5.80 6.26 6.76 4.26 Return on equity 38.87 31.54 10.9 (35.92) Return on assets 3.27 3.01 1.07 (2.71) Cost to income 37.97 31.89 34.60 46.11 Liquid assets to total assets 13.49 16.96 12.83 18.57 Equity to assets 8.93 9.97 9.62 5.77 Deposits to liabilities 74.91 60.02 52.65 51.42 Loans to deposit 117.49 149.29 194.69 187.44 Tier 1 CAR 5.20 5.60 7.97 5.10 Total CAR (tier 1+2) 10.38 11.17 11.27 8.25
( ) = negative, CAR = capital adequacy ratio Note: The minimum tier 1 ratio mandated by Azerbaijan’s central bank is 6.00%; the minimum total capital ratio is 12.00%.
Source: International Bank Of Azerbaijan audited financial reports
C. Competitive Position
Table A1.4: International Bank of Azerbaijan Market Share (AZN million)
Item 2007 2008 2009 2010
Total Assets of Banking Sector 6,726 10,274 11,665 13,291 IBA’s Assets 2,712 3,856 3,771 4,358 IBA’s Share to Total Assets (%) 40.3 37.5 32.3 32.8
Total Loans of Banking Sector 4,394 6,817 7,964 8,574 IBA’s Loans 2,036 2,882 3,091 3,303 IBA’s Share to Total Loans (%) 46.3 42.3 38.8 38.5 Total Deposits of Banking Sector 3,438 4,055 4,293 5,165 IBA’s Deposits 1,850 2,084 1,795 2,112 IBA’s Share to Total Deposits (%) 53.8 51.4 41.8 40.9
IBA = International Bank of Azerbaijan Source: Central Bank of Azerbaijan, International Bank Of Azerbaijan audited financial reports
D. Deposits
Table A1.5: International Bank Of Azerbaijan Corporate and Retail Deposits (AZN million)
Item 2007 2008 2009 2010
Total Deposits 1,850 2,084 1,795 2,112 Corporate Deposits 1,461 1,557 1,223 1,331 Retail Deposits 390 527 571 780 Retail Deposits as a Share of Total Deposits (%) 21.06 25.27 31.82 36.94
Source: International Bank Of Azerbaijan audited financial reports
Appendix 1 13
E. Loan Portfolio
Table A1.6: International Bank of Azerbaijan Loans by Customer Group
(AZN million) Customer Group 2007 2008 2009 2010
Corporate Loans 1,845 2,726 3,086 3,487 Loans to Individuals 256 373 397 463 Source: International Bank Of Azerbaijan reports
Table A1.7: International Bank of Azerbaijan
Corporate Loan Size by Number (No.)
Loan Size 2007 2008 2009
AZN 0<1 million 1329 1322 1361 AZN 1 million<5 million 220 311 357 AZN 5 million<10 million 29 52 71 AZN 10 million + 31 34 40 Total 1,609 1,719 1,829 Source: International Bank Of Azerbaijan reports
Table A1.8: International Bank of Azerbaijan
Corporate Loan Size by Volume (%)
Loan size 2007 2008 2009
AZN 0<1 million 14.4 10.2 8.6 AZN 1 million<5 million 30.4 27.3 24.5 AZN 5 million<10 million 12.5 13.7 14.2 AZN 10 million + 42.8 48.7 52.7 Total 100.0 100.0 100.0 Source: International Bank Of Azerbaijan reports
Table A1.9: International Bank Of Azerbaijan Loans by Economic Sector
(%)
Sector 2007 2008 2009 2010
Trade and service 17.6 28.1 32.9 36.2 Construction and real estate development 18.7 16.1 21.8 27.0 Manufacturing 15.3 18.1 16.3 14.2 Oil and gas, power production and distribution 11.1 7.8 6.4 2.1 Railroad and other transportation 14.8 14.2 5.3 3.6 Air transportation 1.8 1.3 2.3 1.5 Communication 1.1 0.7 1.7 0.9 Leasing companies 3.1 1.0 1.1 0.8 State and public organizations
a 3.4 0.4 0.3 0.2
Individuals 11.8 12.0 11.4 11.7 Other 1.3 0.3 0.4 1.9 Total loans 100.0 100.0 100.0 100.0
a State and public organizations include ministries, the Treasury and other state bodies of the Republic of Azerbaijan, excluding profit making state and public organizations that are included in the respective categories.
Source: International Bank of Azerbaijan reports audited financial reports
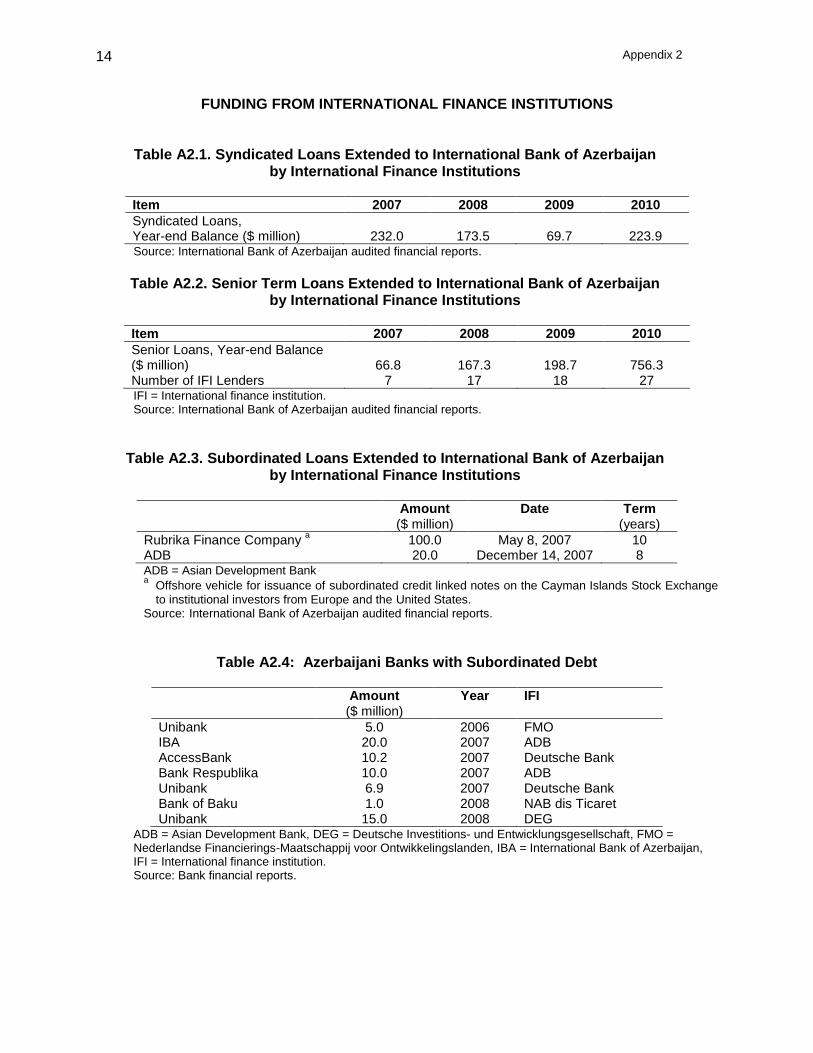
Appendix 2 14
FUNDING FROM INTERNATIONAL FINANCE INSTITUTIONS
Table A2.1. Syndicated Loans Extended to International Bank of Azerbaijan by International Finance Institutions
Item 2007 2008 2009 2010
Syndicated Loans, Year-end Balance ($ million) 232.0 173.5 69.7 223.9 Source: International Bank of Azerbaijan audited financial reports.
Table A2.2. Senior Term Loans Extended to International Bank of Azerbaijan
by International Finance Institutions
Item 2007 2008 2009 2010
Senior Loans, Year-end Balance ($ million) 66.8 167.3 198.7 756.3 Number of IFI Lenders 7 17 18 27 IFI = International finance institution. Source: International Bank of Azerbaijan audited financial reports.
Table A2.3. Subordinated Loans Extended to International Bank of Azerbaijan by International Finance Institutions
Amount ($ million)
Date Term (years)
Rubrika Finance Company a 100.0 May 8, 2007 10
ADB 20.0 December 14, 2007 8 ADB = Asian Development Bank a
Offshore vehicle for issuance of subordinated credit linked notes on the Cayman Islands Stock Exchange
to institutional investors from Europe and the United States. Source: International Bank of Azerbaijan audited financial reports.
Table A2.4: Azerbaijani Banks with Subordinated Debt
Amount ($ million)
Year IFI
Unibank 5.0 2006 FMO IBA 20.0 2007 ADB AccessBank 10.2 2007 Deutsche Bank Bank Respublika 10.0 2007 ADB Unibank 6.9 2007 Deutsche Bank Bank of Baku 1.0 2008 NAB dis Ticaret Unibank 15.0 2008 DEG
ADB = Asian Development Bank, DEG = Deutsche Investitions- und Entwicklungsgesellschaft, FMO = Nederlandse Financierings-Maatschappij voor Ontwikkelingslanden, IBA = International Bank of Azerbaijan, IFI = International finance institution. Source: Bank financial reports.
Appendix 3 15
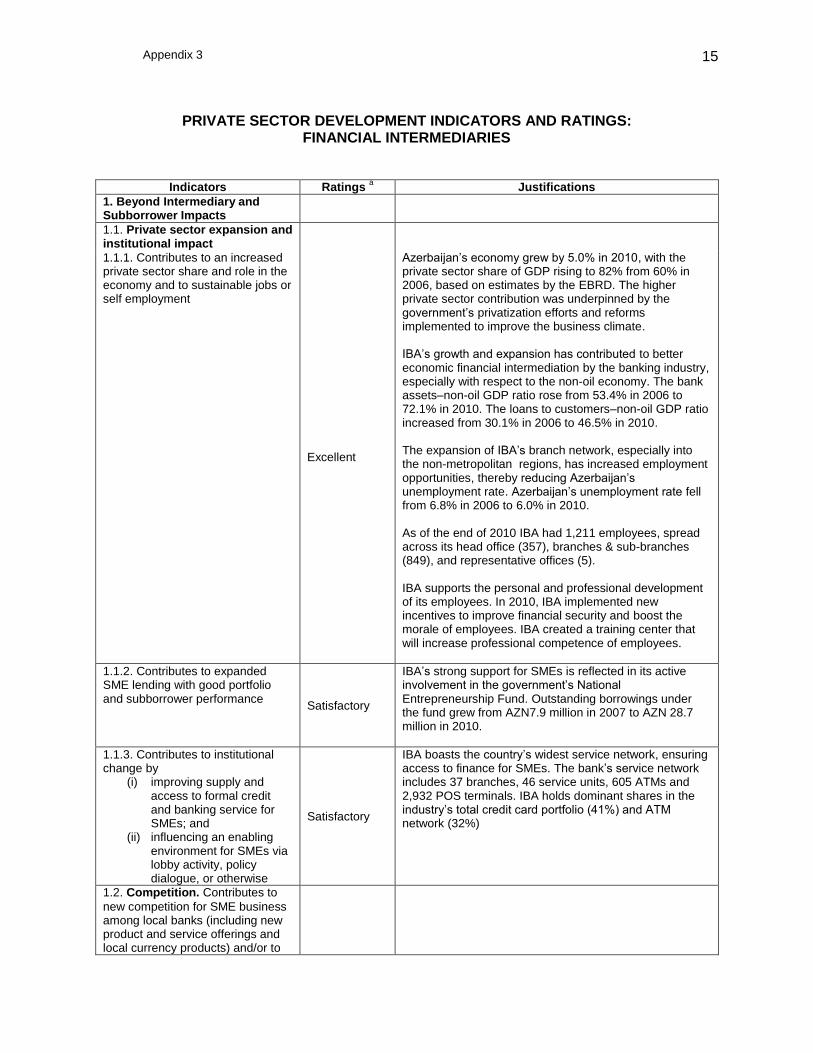
PRIVATE SECTOR DEVELOPMENT INDICATORS AND RATINGS:
FINANCIAL INTERMEDIARIES
Indicators Ratings a Justifications
1. Beyond Intermediary and Subborrower Impacts
1.1. Private sector expansion and institutional impact
1.1.1. Contributes to an increased private sector share and role in the economy and to sustainable jobs or self employment
Excellent
Azerbaijan’s economy grew by 5.0% in 2010, with the private sector share of GDP rising to 82% from 60% in 2006, based on estimates by the EBRD. The higher private sector contribution was underpinned by the government’s privatization efforts and reforms implemented to improve the business climate. IBA’s growth and expansion has contributed to better economic financial intermediation by the banking industry, especially with respect to the non-oil economy. The bank assets–non-oil GDP ratio rose from 53.4% in 2006 to 72.1% in 2010. The loans to customers–non-oil GDP ratio increased from 30.1% in 2006 to 46.5% in 2010. The expansion of IBA’s branch network, especially into the non-metropolitan regions, has increased employment opportunities, thereby reducing Azerbaijan’s unemployment rate. Azerbaijan’s unemployment rate fell from 6.8% in 2006 to 6.0% in 2010. As of the end of 2010 IBA had 1,211 employees, spread across its head office (357), branches & sub-branches (849), and representative offices (5). IBA supports the personal and professional development of its employees. In 2010, IBA implemented new incentives to improve financial security and boost the morale of employees. IBA created a training center that will increase professional competence of employees.
1.1.2. Contributes to expanded SME lending with good portfolio and subborrower performance
Satisfactory
IBA’s strong support for SMEs is reflected in its active involvement in the government’s National Entrepreneurship Fund. Outstanding borrowings under the fund grew from AZN7.9 million in 2007 to AZN 28.7 million in 2010.
1.1.3. Contributes to institutional change by
(i) improving supply and access to formal credit and banking service for SMEs; and
(ii) influencing an enabling environment for SMEs via lobby activity, policy dialogue, or otherwise
Satisfactory
IBA boasts the country’s widest service network, ensuring access to finance for SMEs. The bank’s service network includes 37 branches, 46 service units, 605 ATMs and 2,932 POS terminals. IBA holds dominant shares in the industry’s total credit card portfolio (41%) and ATM network (32%)
1.2. Competition. Contributes to
new competition for SME business among local banks (including new product and service offerings and local currency products) and/or to
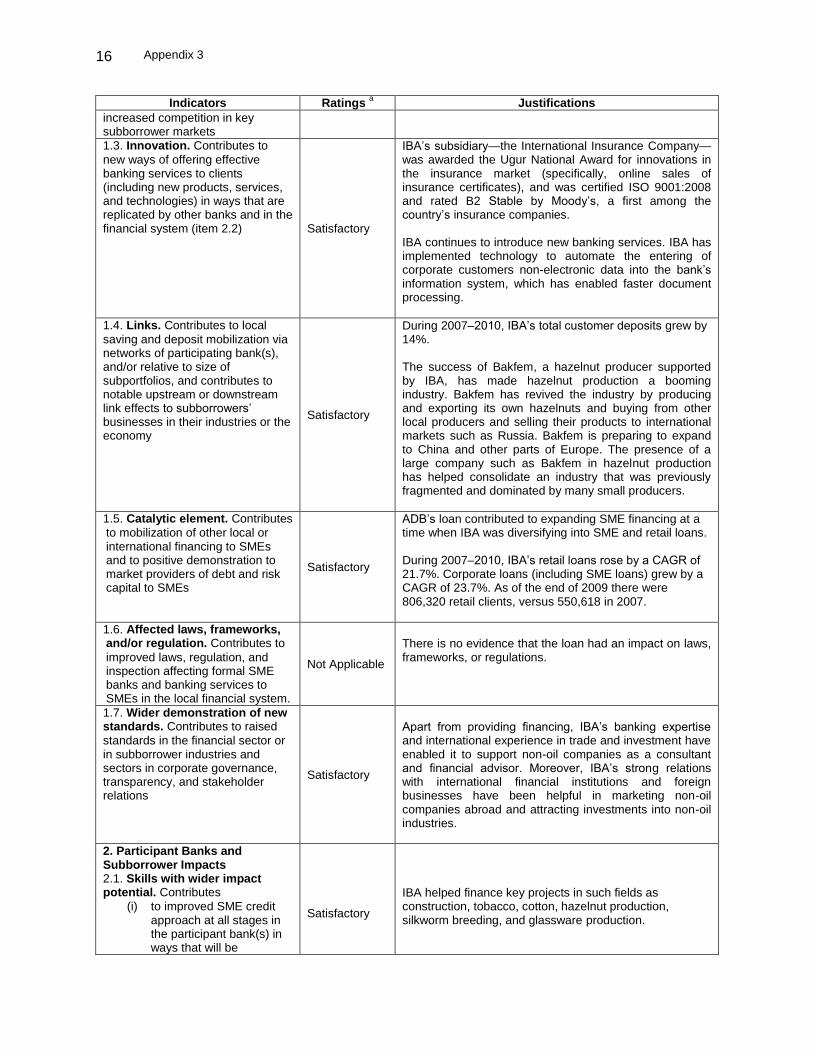
Appendix 3 16
Indicators Ratings a Justifications
increased competition in key subborrower markets
1.3. Innovation. Contributes to
new ways of offering effective banking services to clients (including new products, services, and technologies) in ways that are replicated by other banks and in the financial system (item 2.2)
Satisfactory
IBA’s subsidiary—the International Insurance Company— was awarded the Ugur National Award for innovations in the insurance market (specifically, online sales of insurance certificates), and was certified ISO 9001:2008 and rated B2 Stable by Moody’s, a first among the country’s insurance companies. IBA continues to introduce new banking services. IBA has implemented technology to automate the entering of corporate customers non-electronic data into the bank’s information system, which has enabled faster document processing.
1.4. Links. Contributes to local
saving and deposit mobilization via networks of participating bank(s), and/or relative to size of subportfolios, and contributes to notable upstream or downstream link effects to subborrowers’ businesses in their industries or the economy
Satisfactory
During 2007–2010, IBA’s total customer deposits grew by 14%. The success of Bakfem, a hazelnut producer supported by IBA, has made hazelnut production a booming industry. Bakfem has revived the industry by producing and exporting its own hazelnuts and buying from other local producers and selling their products to international markets such as Russia. Bakfem is preparing to expand to China and other parts of Europe. The presence of a large company such as Bakfem in hazelnut production has helped consolidate an industry that was previously fragmented and dominated by many small producers.
1.5. Catalytic element. Contributes
to mobilization of other local or international financing to SMEs and to positive demonstration to market providers of debt and risk capital to SMEs
Satisfactory
ADB’s loan contributed to expanding SME financing at a time when IBA was diversifying into SME and retail loans. During 2007–2010, IBA’s retail loans rose by a CAGR of 21.7%. Corporate loans (including SME loans) grew by a CAGR of 23.7%. As of the end of 2009 there were 806,320 retail clients, versus 550,618 in 2007.
1.6. Affected laws, frameworks, and/or regulation. Contributes to
improved laws, regulation, and inspection affecting formal SME banks and banking services to SMEs in the local financial system.
Not Applicable
There is no evidence that the loan had an impact on laws, frameworks, or regulations.
1.7. Wider demonstration of new standards. Contributes to raised
standards in the financial sector or in subborrower industries and sectors in corporate governance, transparency, and stakeholder relations
Satisfactory
Apart from providing financing, IBA’s banking expertise and international experience in trade and investment have enabled it to support non-oil companies as a consultant and financial advisor. Moreover, IBA’s strong relations with international financial institutions and foreign businesses have been helpful in marketing non-oil companies abroad and attracting investments into non-oil industries.
2. Participant Banks and Subborrower Impacts
2.1. Skills with wider impact potential. Contributes
(i) to improved SME credit approach at all stages in the participant bank(s) in ways that will be
Satisfactory
IBA helped finance key projects in such fields as construction, tobacco, cotton, hazelnut production, silkworm breeding, and glassware production.
Appendix 3 17
Indicators Ratings a Justifications
replicated by other providers of SME finance and banking services; and
(ii) via the participating bank(s) to improved subborrower skills in operation of their businesses, e.g., via good appraisal, and monitoring by the bank(s)
2.2. Demonstration and new standards-setting potential.
Demonstrates potential through improved and achieved standards in corporate governance, transparency, stakeholder relations, and environmental, social, health, and safety spheres
Satisfactory
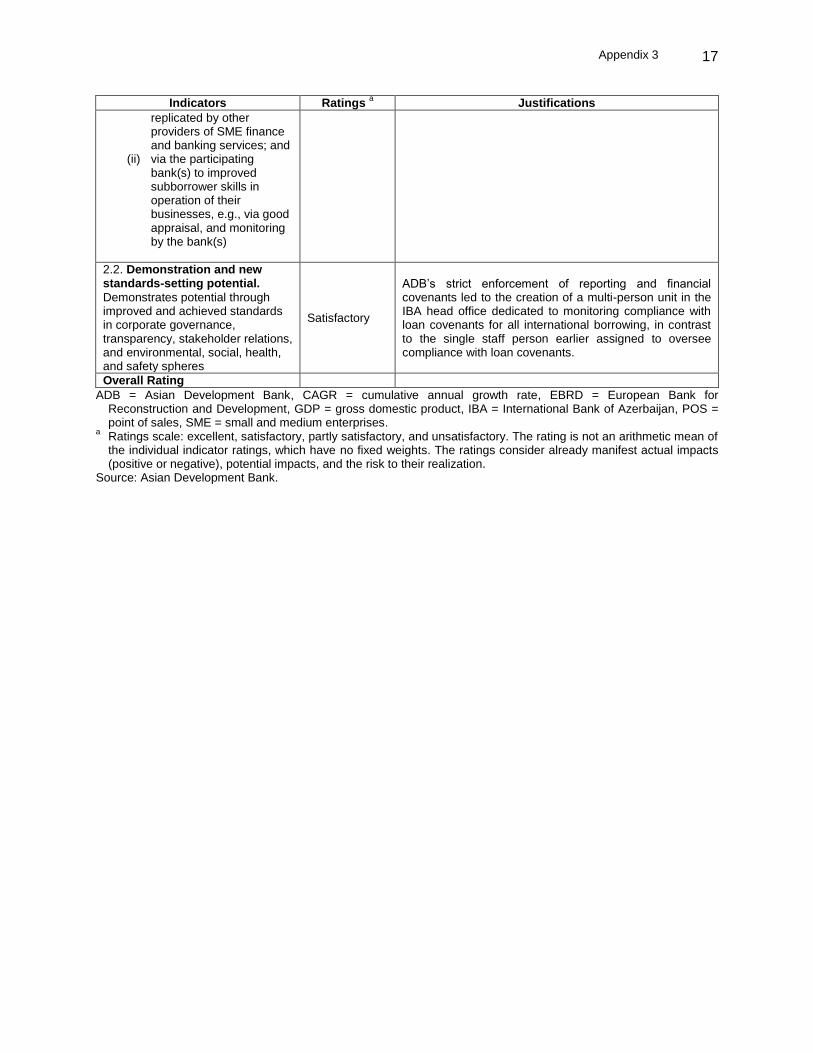
ADB’s strict enforcement of reporting and financial covenants led to the creation of a multi-person unit in the IBA head office dedicated to monitoring compliance with loan covenants for all international borrowing, in contrast to the single staff person earlier assigned to oversee compliance with loan covenants.
Overall Rating
ADB = Asian Development Bank, CAGR = cumulative annual growth rate, EBRD = European Bank for Reconstruction and Development, GDP = gross domestic product, IBA = International Bank of Azerbaijan, POS = point of sales, SME = small and medium enterprises.
a Ratings scale: excellent, satisfactory, partly satisfactory, and unsatisfactory. The rating is not an arithmetic mean of the individual indicator ratings, which have no fixed weights. The ratings consider already manifest actual impacts (positive or negative), potential impacts, and the risk to their realization.
Source: Asian Development Bank.
Appendix 4 18
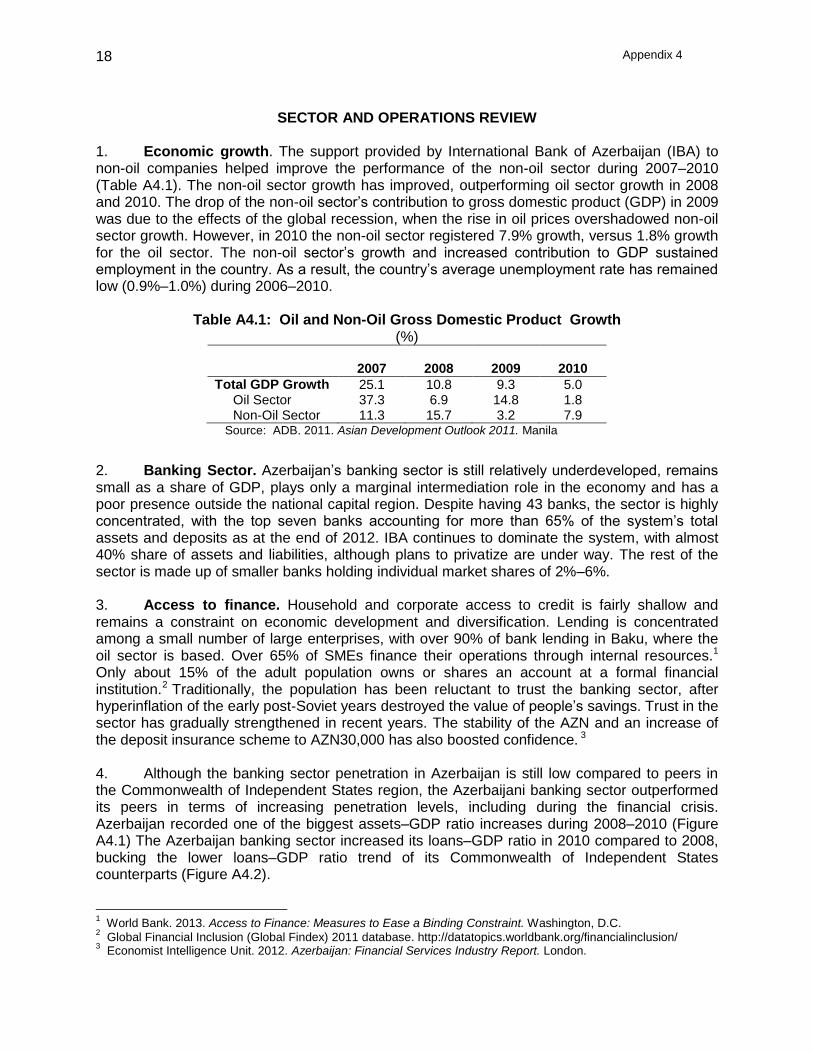
SECTOR AND OPERATIONS REVIEW 1. Economic growth. The support provided by International Bank of Azerbaijan (IBA) to non-oil companies helped improve the performance of the non-oil sector during 2007–2010 (Table A4.1). The non-oil sector growth has improved, outperforming oil sector growth in 2008 and 2010. The drop of the non-oil sector’s contribution to gross domestic product (GDP) in 2009 was due to the effects of the global recession, when the rise in oil prices overshadowed non-oil sector growth. However, in 2010 the non-oil sector registered 7.9% growth, versus 1.8% growth for the oil sector. The non-oil sector’s growth and increased contribution to GDP sustained employment in the country. As a result, the country’s average unemployment rate has remained low (0.9%–1.0%) during 2006–2010.
Table A4.1: Oil and Non-Oil Gross Domestic Product Growth
(%) 2007 2008 2009 2010
Total GDP Growth 25.1 10.8 9.3 5.0 Oil Sector 37.3 6.9 14.8 1.8 Non-Oil Sector 11.3 15.7 3.2 7.9
Source: ADB. 2011. Asian Development Outlook 2011. Manila
2. Banking Sector. Azerbaijan’s banking sector is still relatively underdeveloped, remains small as a share of GDP, plays only a marginal intermediation role in the economy and has a poor presence outside the national capital region. Despite having 43 banks, the sector is highly concentrated, with the top seven banks accounting for more than 65% of the system’s total assets and deposits as at the end of 2012. IBA continues to dominate the system, with almost 40% share of assets and liabilities, although plans to privatize are under way. The rest of the sector is made up of smaller banks holding individual market shares of 2%–6%. 3. Access to finance. Household and corporate access to credit is fairly shallow and remains a constraint on economic development and diversification. Lending is concentrated among a small number of large enterprises, with over 90% of bank lending in Baku, where the oil sector is based. Over 65% of SMEs finance their operations through internal resources.1 Only about 15% of the adult population owns or shares an account at a formal financial institution.2 Traditionally, the population has been reluctant to trust the banking sector, after hyperinflation of the early post-Soviet years destroyed the value of people’s savings. Trust in the sector has gradually strengthened in recent years. The stability of the AZN and an increase of the deposit insurance scheme to AZN30,000 has also boosted confidence. 3
4. Although the banking sector penetration in Azerbaijan is still low compared to peers in the Commonwealth of Independent States region, the Azerbaijani banking sector outperformed its peers in terms of increasing penetration levels, including during the financial crisis. Azerbaijan recorded one of the biggest assets–GDP ratio increases during 2008–2010 (Figure A4.1) The Azerbaijan banking sector increased its loans–GDP ratio in 2010 compared to 2008, bucking the lower loans–GDP ratio trend of its Commonwealth of Independent States counterparts (Figure A4.2). 1 World Bank. 2013. Access to Finance: Measures to Ease a Binding Constraint. Washington, D.C.
2 Global Financial Inclusion (Global Findex) 2011 database. http://datatopics.worldbank.org/financialinclusion/
3 Economist Intelligence Unit. 2012. Azerbaijan: Financial Services Industry Report. London.
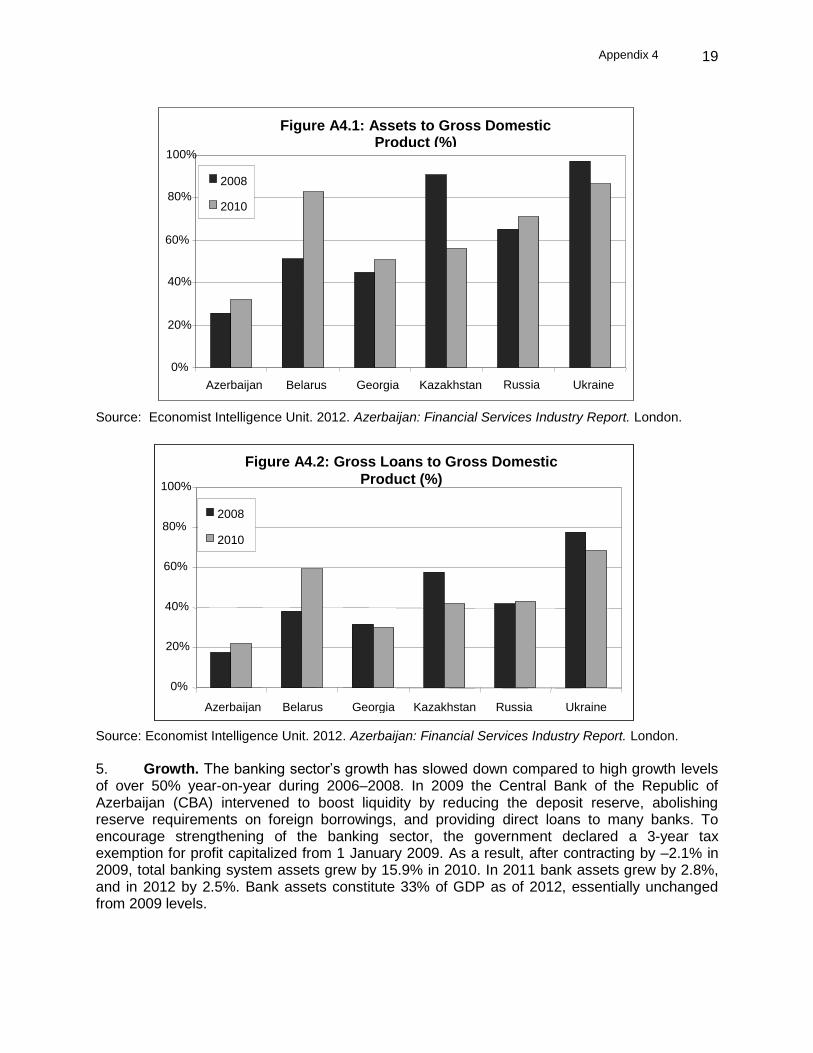
Appendix 4 19
Source: Economist Intelligence Unit. 2012. Azerbaijan: Financial Services Industry Report. London.
Source: Economist Intelligence Unit. 2012. Azerbaijan: Financial Services Industry Report. London.
5. Growth. The banking sector’s growth has slowed down compared to high growth levels of over 50% year-on-year during 2006–2008. In 2009 the Central Bank of the Republic of Azerbaijan (CBA) intervened to boost liquidity by reducing the deposit reserve, abolishing reserve requirements on foreign borrowings, and providing direct loans to many banks. To encourage strengthening of the banking sector, the government declared a 3-year tax exemption for profit capitalized from 1 January 2009. As a result, after contracting by –2.1% in 2009, total banking system assets grew by 15.9% in 2010. In 2011 bank assets grew by 2.8%, and in 2012 by 2.5%. Bank assets constitute 33% of GDP as of 2012, essentially unchanged from 2009 levels.
Figure A4.1: Assets to Gross Domestic Product (%)
0%%
20%
40%
60%
80%
100%
Azerbaijan Belarus Georgia Kazakhstan Russia Ukraine
2008
2010
Figure A4.2: Gross Loans to Gross Domestic
Product (%)
0%
20%
40%
60%
80%
100%
Azerbaijan Belarus Georgia Kazakhstan Russia Ukraine
2008
2010
Appendix 4 20
6. Profitability. In 2012, the aggregate net income of banks declined to AZN102.4 million, 37% lower than the AZN161.5 million in 2011. The average return on assets declined to 0.8% in 2012 versus 1.2% for 2011. Return on equity declined to 5.2% in 2012 from 7.0% in 2011. The slow growth in business activities coupled with the increases in banks’ loan-loss charges put pressure on the banks’ bottom lines. Net interest income, at 5% in 2012, has declined steadily from 6.6% in 2009, although cost–income ratios remain high at 62%. For 2013, overall profitability is expected to improve for most banks as a result of increased business volumes, healthy interest margins, and a gradual decline in credit costs. 7. Asset quality. Problem loans, which include those that are 90+ days overdue and restructured loans, declined to 14% of gross loans in 2012, from 20% in 2011 and 24% in 2010. Problem loans are expected to decline further by the end of 2013 given a more favorable economic environment, moderate credit growth, and recovery of problem loans. In addition, losses from loans granted before the global financial crisis have been taken into account, reducing the chance of incurring considerable losses in the short term.
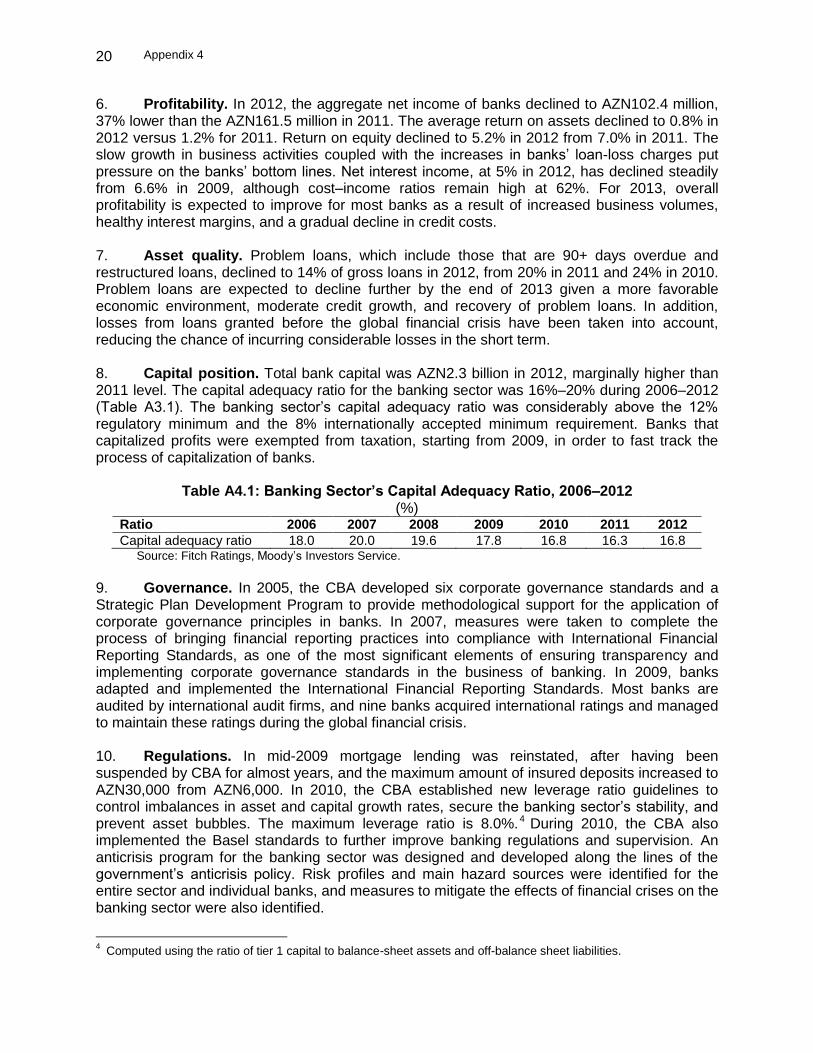
8. Capital position. Total bank capital was AZN2.3 billion in 2012, marginally higher than 2011 level. The capital adequacy ratio for the banking sector was 16%–20% during 2006–2012 (Table A3.1). The banking sector’s capital adequacy ratio was considerably above the 12% regulatory minimum and the 8% internationally accepted minimum requirement. Banks that capitalized profits were exempted from taxation, starting from 2009, in order to fast track the process of capitalization of banks.
Table A4.1: Banking Sector’s Capital Adequacy Ratio, 2006–2012
(%) Ratio 2006 2007 2008 2009 2010 2011 2012
Capital adequacy ratio 18.0 20.0 19.6 17.8 16.8 16.3 16.8 Source: Fitch Ratings, Moody’s Investors Service.
9. Governance. In 2005, the CBA developed six corporate governance standards and a Strategic Plan Development Program to provide methodological support for the application of corporate governance principles in banks. In 2007, measures were taken to complete the process of bringing financial reporting practices into compliance with International Financial Reporting Standards, as one of the most significant elements of ensuring transparency and implementing corporate governance standards in the business of banking. In 2009, banks adapted and implemented the International Financial Reporting Standards. Most banks are audited by international audit firms, and nine banks acquired international ratings and managed to maintain these ratings during the global financial crisis.
10. Regulations. In mid-2009 mortgage lending was reinstated, after having been suspended by CBA for almost years, and the maximum amount of insured deposits increased to AZN30,000 from AZN6,000. In 2010, the CBA established new leverage ratio guidelines to control imbalances in asset and capital growth rates, secure the banking sector’s stability, and prevent asset bubbles. The maximum leverage ratio is 8.0%.4 During 2010, the CBA also implemented the Basel standards to further improve banking regulations and supervision. An anticrisis program for the banking sector was designed and developed along the lines of the government’s anticrisis policy. Risk profiles and main hazard sources were identified for the entire sector and individual banks, and measures to mitigate the effects of financial crises on the banking sector were also identified.
4 Computed using the ratio of tier 1 capital to balance-sheet assets and off-balance sheet liabilities.
Appendix 4 21
11. Outlook. The outlook for Azerbaijan’s banking system is stable—particularly in terms of credit growth, higher profitability, and improving asset quality—and favorable economic conditions augur well for the growth of banks over the short term.5 High oil prices will continue to be the driver of ongoing government spending, boosting the non-oil sector and creating business opportunities for domestic banks. The Azerbaijan banking sector was largely shielded from the effects of the global financial crisis, in comparison to its peers in Central and Eastern Europe, due to limited international financial integration and a low level of foreign borrowings. 12. Offsetting the sector’s positive outlook are (i) high system-wide dollarization and high credit concentrations; (ii) sustained, high problem-loan levels; and (iii) the undercapitalization of the largest and sole state-owned bank, the IBA, which dominates the banking system. The absence of competition is also a source of concern, as the IBA has a near-monopoly on the provision of banking services to the government, in addition to the majority of large corporate accounts.
5
Moody’s Investors Services. 2013. Azerbaijan: Banking System Outlook. https://www.moodys.com/research /Moodys-Azerbaijans-banking-system -outlook-remains-stable--PR_277910
22
Ap
pe
ndix
5
COMPARATIVE FINANCIAL STATEMENTS
Table A5.1: Comparative Balance Sheets, 2007–2011
(AZN million) 2007 2008 2009 2010 2011
ASSETS
Cash and cash equivalents 180 527 317 678 391 Mandatory cash balances with the Central Bank of Azerbaijan
170 108 9 12 104
Due from other banks 174 127 167 131 102 Loans and advances to customers (net) 2,036 2,882 3,091 3,303 4,008 Other debt securities 0 0 0 0 0 Financial assets at fair value through profit or loss
0 0 0 1 6
Investment in associates 1 2 2 1 1 Available-for-sale investments 13 0 0 0 4 Current income tax asset 0 0 0 2 6 Deferred income tax asset 1 1 9 49 39 Premises and equipment 113 151 148 155 156 Intangible assets 8 7 5 5 6 Other financial and insurance assets 9 37 13 7 5 Other assets 9 16 10 14 16 Total Assets 2,712 3,856 3,771 4,358 4,844 LIABILITIES Due to other banks 147 828 1,140 1,022 937 Customer accounts 1,850 2,084 1,795 2,112 2,757 Debt securities in issue 17 11 7 7 7 Other borrowed funds 263 290 245 826 756 Current income tax liability 2 15 7 0 1 Deferred income tax liability 19 23 3 2 2 Other financial and insurance liabilities 56 110 137 61 53 Other Liabilities 13 14 7 10 7 Subordinated debt 102 97 67 67 50 Total Liabilities 2,470 3,472 3,409 4,107 4,571 STOCKHOLDERS EQUITY Share capital 100 190 240 240 240 Retained earnings 110 162 102 (6) 14
Ap
pe
ndix
5
23
( ) = negative Source: International Bank of Azerbaijan Audited Financial Statements
Table A5.2: Comparative Income Statements, 2007–2011
(AZN million) 2007 2008 2009 2010 2011
Interest income 185 279 346 328 310 Interest expense (73) (100) (114) (169) (194) Net interest income 112 179 232 160 116 Fee and commission income 87 127 83 81 81 Fee and commission expense (8) (18) (11) (16) (22) Net fee and commission income 79 110 72 65 59 FX income, net (2) 4 0 (6) (6) Trading income, net 25 33 27 28 29 Dividend income Other operating income 3 3 4 4 3 Net non-interest income 106 149 104 92 84 Total operating income 218 328 336 252 201 Pre-provision income 135 223 219 136 79 Loan loss provision (loans to customers)
(29) (91) (173) (252) (37)
Income after loan loss provisions 106 132 46 (116) 42 Other provisions 0 (0) (1) (5) (1) (Other) non-operating income 0 0 3 0 0 Share of earnings of associate (0) 1 0 (0) (1) (Other) non-operating expense (8) 0 (1) (12) (6) Pre-tax income 99 133 48 (133) 35 Taxes (25) (34) (7) 23 (15) Extraordinary items, net 0 0 0 0 0 Minority interest 0 0 (0) 0 (0) Net Income 75 99 41 (110) 20
( ) = negative, Fx = foreign exchange Source: International Bank of Azerbaijan, various annual reports.
Revaluation reserve for premises 28 33 22 20 21 Cumulative translation reserve 2 (1) (3) (3) (4) Minority Interest 2 1 2 1 2 Total Equity 242 384 363 252 273 Total Liabilities and Equity 2,712 3,856 3,771 4,358 4,844
24
Ap
pe
ndix
6
ESTIMATION OF RETURN ON INVESTED CAPITAL A. Cost of Equity
Table A6.1: Revised Cost of Equity for 2011 (%)
… = not available, PRC = People’s Republic of China. 1 Azerbaijan’s cost of equity increased by 3.24 percentage points as a result of increasing the preliminary cost of equity by its adjustment premium of 20%.
Source: Asian Development Bank, Office of Risk Management memo dated 2 December 2011.
B. Weighted Average Cost of Capital 1. The weighted average cost of capital is derived using the formula below, where MVe is the market value of equity and MVd is the market value of debt. The results are found in the table.
WACC = �MVe
MVe + MVd
× Cost of Equity
+ �MVd
MVe + MVd
× Cost of
Debt × 1 –
Tax
Rate
Table A6.2: Reevaluation of the Weighted Average Cost of Capital
Item
Value
Market value of equity (AZN million) 373.7 Market value of debt (AZN million) 1,003.2 Cost of equity (%) 19.4
Cost of debt (%) 8.69 Corporate income tax rate (%) 20.00 Weighted Average Cost of Capital (%) 10.34
Source: International Bank of Azerbaijan financial reports and Asian Development Bank staff calculations.
Country (Proxy) Risk Free
Rate Equity
Premium Country Risk
Premium Inflation Premium
Preliminary Cost of Equity
Adjustment Premium
2010 Cost of Equity
2009 Cost of Equity
PRC 1.68 7.50 0.71 0.96 10.85 10.85 11.70 Malaysia 1.68 7.50 1.00 0.74 10.92 10.92 11.58 Thailand 1.68 7.50 1.80 1.15 12.14 12.14 13.48 Philippines 1.68 7.50 1.10 2.50 12.78 12.78 15.21 India (Brazil) Indonesia
1.68 1.68
7.50 7.50
0.65 1.76
3.72 3.46
13.55 14.40
13.55 14.40
16.61 …
Kazakhstan (Russia) 1.68 7.50 2.20 5.00 16.38 16.38 16.50 Azerbaijan (Russia) 1.68 7.50 2.20 4.82 16.20 3.24
1 19.44 …
Ap
pe
ndix
6
25
C. Terminal Value and Return on Invested Capital
TableA6.3: Cash Flow Projection Computation, 2012–2017 (AZN'000)
Item
Present Value Free Cash Flow 2012 2013 2014 2015 2016 2017
Projections
Revenue
214,195 232,297 253,334 282,629 316,402 354,671
Interest expense (loan)
107,266 103,572 93,380 93,380 93,380 87,638
Interest expense (deposit)
105,010 121,807 139,871 160,852 184,979 212,726
Net income
46,543 42,489 22,919 34,653 49,131 66,294 D&A and interest expense (on interest bearing debt)
121,301 117,607 107,415 107,415 107,415 101,673
Free cash flow to firm
167,844 160,096 130,333 142,067 156,546 167,967
Terminal value
1,797,442 Total
1,965,286 160,096 130,333 142,067 156,546 167,967
Discount period
0 1 2 3 4 5
Discount factor
1 0.91 0.82 0.74 0.67 0.61
Present value free cash flow 2,428,482 1,965,286 145,093 107,049 105,752 105,608 102,694
D&A = depreciation and amortization Source: Asian Development Bank projections.
Table A6.4: Return on Invested Capital Computation
(AZN ‘000) IRR (%) 2007 2008 2009 2010 2011 2012
Equity capital (100,000)
Change in equity capital
(89,737) (50,263)
Long-term debt (681,599) Change in long-term debt 84,038 26,469 (506,230) 413,205
Net income 88,949 112,273 53,782 (96,701) 33,596
Terminal value 1,797,442
ROIC (nominal) 20.2% (692,650) 106,574 29,988 (602,931) 446,801 1,797,442
Inflation rates 16.7% 20.8% 1.5% 5.7% 7.8% 10.5%
ROIC (real) 17.4% (692,650) 88,224 29,545 (570,417) 414,318 1,626,527
ROIC = return on invested capital. Source: Asian Development Bank staff calculations.
26
Ap
pe
ndix
6
Table A6.5: Economic Return on Invested Capital Computation 2007–2011 (AZN ‘000)
IRR (%) 2007 2008 2009 2010 2011 2012
ROIC nominal 20.2% (692,650) 106,574 29,988 (602,931) 446,801 1,797,442
Taxes paid 24,681 34,315 6,912 (22,881) 15,072
EROIC nominal 22.0% (667,969) 140,889 36,900 (625,812) 461,873 1,797,442
EROIC (real) 19.0% (667,969) 116,630 36,355 (592,064) 428,295 1,626,527
( ) = negative, EROIC = economic return on invested capital, IRR = internal rate of return, ROIC = return on invested capital. Source: Asian Development Bank staff calculations.
Appendix 7
27
STRENGTHENED CAPITALIZATION AND PORTFOLIO QUALITY, UPDATE 2014
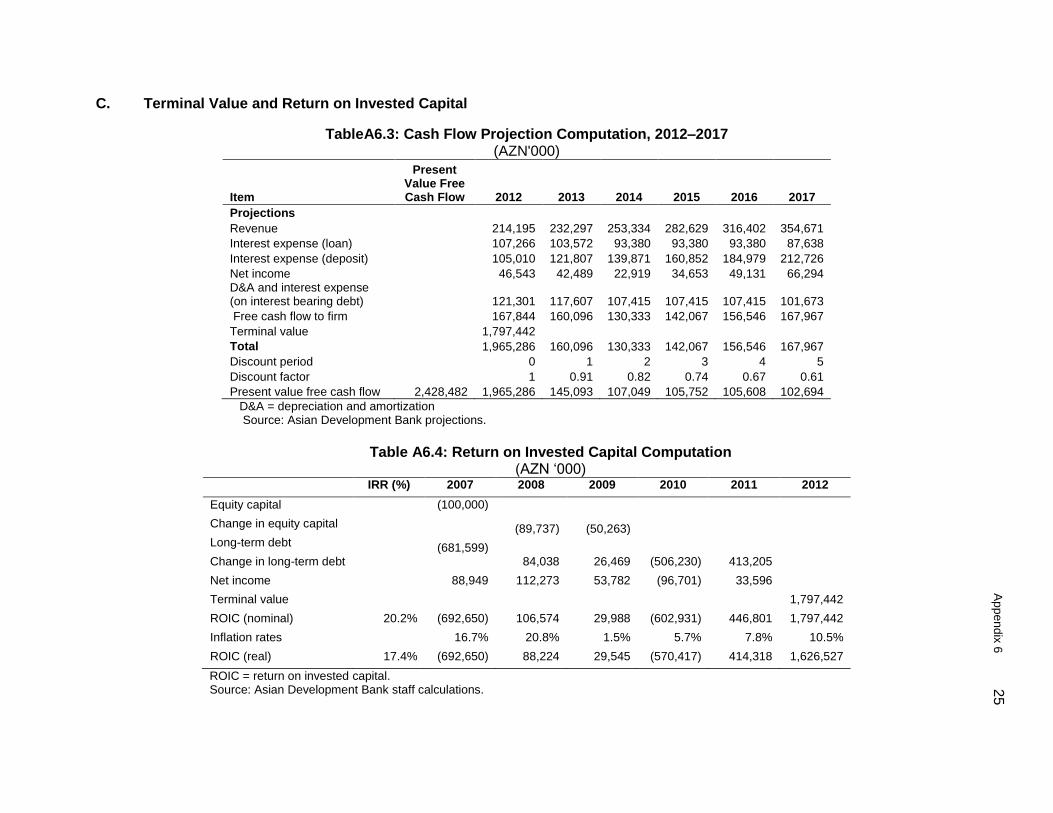
1. Subsequent to IBA’s repayment of ADB’s loan, IBA continued to implement changes and improvements in capitalization and asset quality which had been the focus of its interaction with ADB. These developments are significant for this review, as they were at least in part brought about by the consideration of necessary improvements that became clear to IBA in its interaction with ADB. Moody’s Investor Service published a report in June 2014 which highlighted IBA’s achievements in strengthened capitalization and improved portfolio quality and gave the rationale for the rating agency’s upgrade of IBA’s ratings outlook from “stable” to “positive”.17 The following summarizes the Moody’s report’s core findings. 2. Significant improvement in capital adequacy. IBA improved its capital adequacy significantly through injections of external capital and limited generation of internal capital through retained earnings. As a result, tier 1 capital under Basel I increased to 7.2% at the end of 2013 from 5.0% in 2011. The total capital ratio reached an all-time high of 12.6%, up from 7.6%, during the same period.
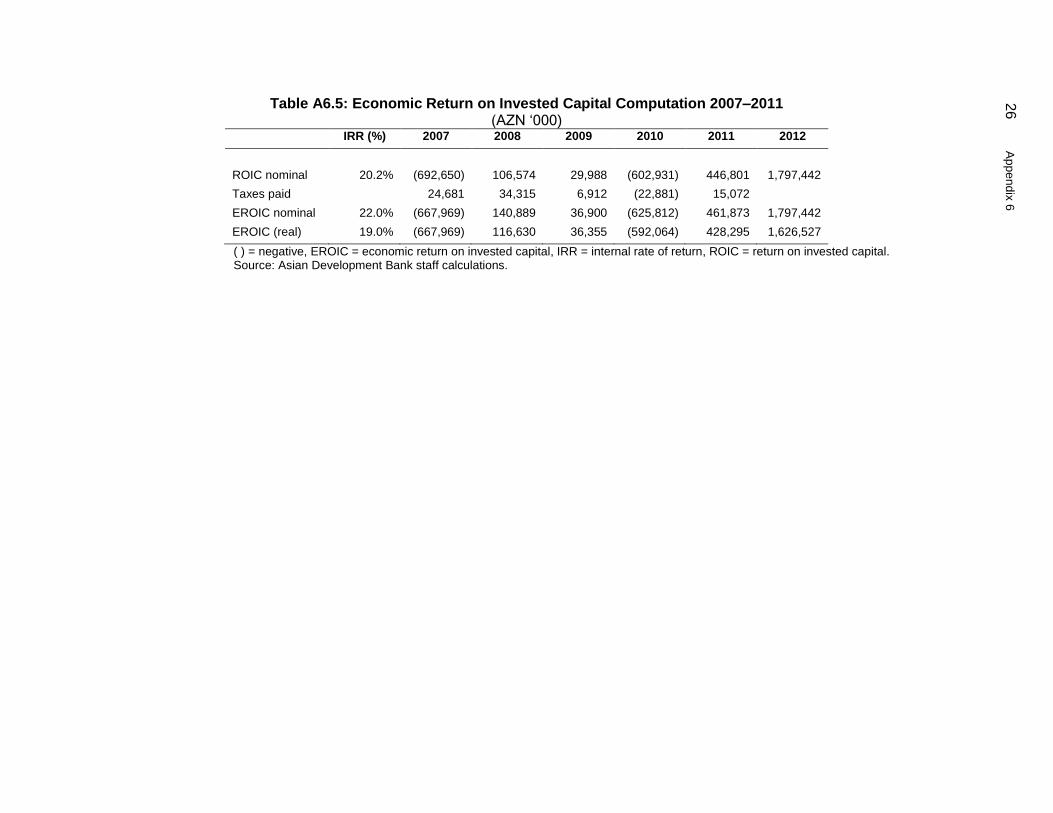
3. Plans to raise additional capital. In 2012-13, IBA received AZN 350 million ($446 million) in subordinated loans from the Central Bank of Azerbaijan and raised AZN 235 million ($299 million) by issuing equity to the government and private investors. IBA plans to raise a total of AZN 500 million ($637 million) in a five year plan extending from 2012 to 2017. For 2014, Moody’s expects that planned capital increases will bring IBA’s tier 1 and total capital ratios to 9.0% and 14% respectively. Moody’s expects this capital buffer to be sufficient to absorb expected losses and support lending under its central scenario.
17
Moody’s Investor Service. 2014. International Bank of Azerbaijan: Strengthened capital ratios and improved asset quality drive positive outlook. New York. June 23.
IBA’s long term local- and foreign currency deposit ratings and its long term foreign currency senior unsecured debt ratings are Ba3 (positive).
28
A
pp
en
dix
6
4. Generating capital from retained earnings. Although improving, IBA’s profitability remains constrained by its currently low margins, limiting IBA’s internal capital generation and capital payout until the end of 2015. IBA’s net interest margin is expected to improve during the 2014 to 2016 period from 2% at the beginning of the period to around 4%, aided by improved focus on retail lending and by attracting lower cost market funding.
5. Improved asset quality. Due to loan workouts and the positive influence of robust economic conditions in Azerbaijan, asset quality has improved and is expected to remain stable for the 2014 to 2016 period. Particularly the non-oil sector, where IBA is particularly active, is contributing to this trend.