Embed Size (px)
Citation preview
SUBOPTIMALITY OF SALES PROMOTIONS AND IMPROVEMENT THROUGH CHANNEL COORDINATION
BEREND WIERENGA AND HAN SOETHOUDT
ERIM REPORT SERIES RESEARCH IN MANAGEMENT ERIM Report Series reference number ERS-2002-10-MKT Publication January 2002 Number of pages 42 Email address corresponding author [email protected] Address Erasmus Research Institute of Management (ERIM)
Rotterdam School of Management / Faculteit Bedrijfskunde Erasmus Universiteit Rotterdam P.O. Box 1738 3000 DR Rotterdam, The Netherlands Phone: +31 10 408 1182 Fax: +31 10 408 9640 Email: [email protected] Internet: www.erim.eur.nl
Bibliographic data and classifications of all the ERIM reports are also available on the ERIM website:
www.erim.eur.nl
ERASMUS RESEARCH INSTITUTE OF MANAGEMENT
REPORT SERIES RESEARCH IN MANAGEMENT
BIBLIOGRAPHIC DATA AND CLASSIFICATIONS Abstract This paper deals with sales promotions in the form of consumer price discounts in fast-moving
consumer goods. First, we show analytically that suboptimality is to be expected with respect to the size of the consumer price discount. This is due to the separate decision making of the retailer and the manufacturer. We then compute the impact of this suboptimality for a database of eighty-six sale promotions, and we find that it is substantial. On average, the actual profitability of the sales promotions is only about one fourth of its potential profitability. The suboptimality problem can be solved through specific arrangements between retailer and manufacturer, which have the purpose of better channel coordination. One of these is a proportional discount sharing arrangement, in which each party contributes to the consumer price discount in proportion to its original margin (without sales promotion). Several other winwin arrangements are possible also. 5001-6182 Business 5410-5417.5 Marketing
Library of Congress Classification (LCC) HF 5438.5 Sales Promotion
M Business Administration and Business Economics M 31 C 44
Marketing Statistical Decision Theory
Journal of Economic Literature (JEL)
M 31 Marketing 85 A Business General 280 G 255 A
Managing the marketing function Decision theory (general)
European Business Schools Library Group (EBSLG)
290 S 290 B
Selling Product pricing
Gemeenschappelijke Onderwerpsontsluiting (GOO) 85.00 Bedrijfskunde, Organisatiekunde: algemeen 85.40 85.03
Marketing Methoden en technieken, operations research
Classification GOO
85.40 Marketing Bedrijfskunde / Bedrijfseconomie Marketing / Besliskunde
Keywords GOO
Verkoopbevordering, Distributiekanalen, Prijzen (economie) Free keywords Sales promotions, Channels of distribution, Consumer price discounts, Channel coordination
Suboptimality of Sales Promotions and Improvement through Channel Coordination
Berend Wierenga Rotterdam School of Management
Erasmus University Rotterdam1
Han Soethoudt ATO Wageningen UR
1 Berend Wierenga Rotterdam School of Management/Faculteit Bedrijfskunde Erasmus University Rotterdam P.O. Box 1738 3000 DR Rotterdam The Netherlands [email protected]

Acknowledgement This paper has benefitted significantly from comments and suggestions made by Marnik Dekimpe and Gerrit Van Bruggen in reaction to earlier versions of the work.
1
Suboptimality of Sales Promotions and Improvement through Channel
Coordination
Abstract
This paper deals wi th sales promotions in the form of consumer price discounts in fast-moving consumer
goods. First, we show analytically that suboptimality is to be expected with respect to the size of the
consumer price discount. This is due to the separate decision making of the retailer and the manufacturer.
We then compute the impact of this suboptimality for a database of eighty-six sale promotions, and we
find that it is substantial. On average, the actual profitability of the sales promotions is only about one
fourth of its potential profitability. The suboptimality problem can be solved through specific
arrangements between retailer and manufacturer, which have the purpose of better channel coordination.
One of these is a proportional discount sharing arrangement, in which each party contributes to the
consumer price discount in proportion to its original margin (without sales promotion). Several other win-
win arrangements are possible also.
Keywords
Sales promotions
Channels of distribution
Consumer price discounts
Channel coordination
2
1 Introduction
Sales promotions are a frequently used instrument to stimulate the sales of products and brands. Current
annual expenditures on sales promotions in the U.S.A. have recently been estimated at $ 112 billion, and
comprise about 75% of total marketing communication expenditures2. In the Netherlands, total annual
expenditures oo sales promotions are currently around 10 billion guilders ($4.5 billion)3.
This study is about consumer price discounts, which is the dominant form of sales promotions. About half
of all sales promotions in the Netherlands are price discounts1. For sales promotions in supermarkets,
which is the subject of this study, the share of price discounts in sales promotions is even higher. A price
discount is a decrease in the price that a consumer has to pay for a product, which lasts for a limited
period of time. A typical discount offer in a supermarket lasts for one or two weeks. The usual effect of a
price discount is an increase in sales of the product under discount. This sales increase can be small or
large (Blattberg, Briesch and Fox 1995). Whatever its size, a sales increase does not automatically imply
an increase in profit. And if a sales promotion does generate a profit, this may be a profit for the retailer, a
profit for the manufacturer, or for both.
Over the last two decades, a substantial amount of academic work has been carried out on measuring the
sales effects of price promotions. Especially since the advent of scanner data there has been an upsurge in
this type of work (Wittink et.al. 1988; Blattberg and Neslin 1990; Blattberg, Briesch and Fox 1995; Van
Heerde 1999; Van Heerde, Leeflang and Wittink 2001). This research is mainly devoted to the
measurement of the effects of sales promotions in terms of extra volumes of the product sold because of
the sales promotion. Much less empirical work has been done on the profitability of sales promotions. An
exception is the recent paper by Srinivasan, Pauwels, Hanssens and Dekimpe (2001), which looks
explicitly at revenue and profit impact of sales promotions. Profitability is also the aspect of sales
promotions that we are interested in here. Whereas Srinivasan et.al. concentrate on measuring current
2 Van Heerde (1999) 3 Incentive Magazine
3
profitability (for both manufacturer and retailer) of actual sales promotions, we extend the analysis to the
issue of how large the suboptimality is in current sales promotions and how the profitability can be
increased by means of better channel coordination (Jeuland and Shugan 1983).
Often, doubts can be heard about the profitability of sales promotions, especially for the manufacturer,
who allegedly would often be forced to participate through the power of the retailer (Achenbaum and
Mitchel 1987; Farris and Ailawadi 1992; Ailawadi 2001; Nijs, Dekimpe, Steenkamp and Hanssens 2001).
A sales promotion typically is the result of decisions of the manufacturer and the retailer. With
suboptimality of a sales promotion we mean that the actual sales promotion does not exhaust the profit
possibilities for the channel, or, put in a somewhat popular way, that the two parties together “leave
money on the table”. With respect to suboptimalities, we are especially interested in the mechanism that
might underlie such suboptimalities, as well as the occurrence of suboptimality in practice. We also deal
with the question of possible ways to overcome suboptimality, and how, through better channel
coordination, to find win-win sales promotion arrangements for both parties.
In this paper we deal with price discounts in the context of retailer promotions (Blattberg and Neslin
1990). This means that a retailer temporarily reduces the price of a product to consumers. This can be
done even in absence of a discount to the retailer from the manufacturer. However, in most cases both the
retailer and the manufacturer pay a part of the consumer price discount. A sales promotion for a specific
product, in a specific retail chain, during a specific period, including the agreement of how the costs of
this promotion are carried by each of the two partners, is the result of a specific arrangement between
manufacturer and retailer. Whether or not a price discount is profitable at the channel level depends on the
extra sales (volume) it generates and the margin sacrificed on the regular sales, because of the price
discount (see also Dekimpe and Hanssens 1999). If and how each of the two parties, the retailer and the
4
manufacturer respectively, profit from the sales promotion is dependent on how the burden of the
consumer price discount is shared, i.e. how much each party contributes to the consumer price discount. 4
2 Research Questions
The retailer and the manufacturer have their own profit functions. These two profit functions generally do
not have their maximum at the same value of the consumer discount, nor will each maximum
automatically coincide with the maximum of the profit for the channel. The price discount that the
consumer is confronted with, is the sum of the price discount of the manufacturer and the price discount
of the retailer. Most often, each party determines its contribution to the consumer price discount
maximizing its own interest. Hence, sales promotions arrangements, will not automatically lead to
“efficient sales promotions”, i.e. sales promotions that maximize the profit for the channel. This
suboptimality problem, its consequences, and the possibilities for solving it constitute the core of the
present paper.
To understand the mechanism underlying possible suboptimalities, we will start by applying economic
theory in order to deal with the following questions:
• What are the conditions for optimal (i.e. profit maximizing) price discounts, for the channel as a
whole, and also for the retailer and the manufacturer separately?
• How serious is the danger of suboptimality if each party maximizes its own profit function? Is it
possible to formulate conditions with respect to the sharing of the costs of the discount that steer both
parties to the same, overall optimum?
4 In addition to the costs of the discount itself (i.e. the price reduction for the consumer), a sales promotion involves planning and execution costs: organization costs, extra warehouse handling costs, costs of features (advertisements) in local newspapers, etc. (Verstappen, Van de Vorst and Wierenga 1998). While taking into account these costs, in this paper we concentrate on the two variables of the arrangement between manufacturer and retailer that are most important for the profitability of sales promotions: the size of the discount and the contribution to the discount by the retailer and the manufacturer.
5
In the empirical part we use data from actual sales promotions. In order to determine the profitability of
actual sales promotions, as they have taken place in the market, not only information about the sales
effects of the promotion is needed (additional volumes sold), but also information about its costs. And to
determine the profitability of a sales promotion for the retailer and the manufacturer separately, we need
information about production costs (cost price), the purchasing price of the retailer (regular and during the
promotion), and the way planning and execution costs of sales are shared. For this research, we had
access to a unique database containing the information, mentioned above, for eighty-six sales promotions
in a food product category. These data were collected in the context of an ECR project. ECR stand for
“Efficient Consumer Response” and is a movement in which trade partners work together in order to
optimize the distribution channel
Our empirical questions are:
• How successful have retailers and manufacturers been, as measured from the profitability of the sales
promotions in the database, and how large is the room to do better?
• To what extent are the interests of the retailer and the manufacturer in our database parallel or
opposite and how does this affect the outcomes of sales promotions?
After both the theoretical and the empirical analysis, we will deal with the final question of this paper:
• Is it possible to improve channel coordination and to formulate arrangements between retailer and
manufacturer, which are advantageous for both parties (“win-win arrangements”) and how large
would these improvements be, compared to the actual situation?
In order to address the first two issues, the paper continues with the (micro-economic) theory of optimal
discounts. We will derive the conditions for the optimal discount, for the channel, the manufacturer and
the retailer, respectively. Then we will look at the actual sales promotions in our database.
6
3 Economic Analysis of Sales Promotions
Research on channel relation often takes the perspective of one party, mostly the manufacturer. Marketing
scholars have used the (Stackelberg) leader-follower model, with the manufacturer as the leader (McGuire
and Staelin 1983; Coughlan 1985; Moorthy 1988). The issue is then how to maximize the results of the
sales promotion for the manufacturer, taking into account information about the behavior of the retailer.
In such a context, important questions are: which factors determine whether or not the retailer will agree
or comply with a sales promotion initiated by the manufacturer (Murry and Heide 1998), or, what will be
the pass-through rate of the price discount (Silva-Risso, Bucklin and Morrison 1999)?
Following Jeuland and Shugan (1983), we take a symmetric approach to the role of the two parties,
retailers and manufacturers, that are involved in a sales promotion. In this approach it is assumed that
manufacturers and retailers make optimal reactions to each other. Such manufacturer-retailer interaction
has been called a vertical Nash equlibrium (Choi 1991). In a recent paper, based on an experimental study
where the manufacturer sets the wholesale price and the retailer sets the retail margin, Messinger and
Chen (2001) found that the symmetrical vertical Nash equilibrium describes their data better than the
manufacturer Stackelberg leadership model.
In their by now “classic” article Jeuland and Shugan (1983) have dealt with the roots of the coordination
problem in channels. They formulate this as follows: “ Each channel member has its own decision
variables. However, each channel member’s decisions affect the other channel members’ profits, and as a
consequence, actions. A lack of coordination can lead to undesrable consequences.” (p 239). We think
that this mechanism also applies to decision making of manufacturers and retailers with respect to sales
promotions. Our theoretical model is an extension of the Jeuland and Shugan approach to the case of sales
promotions. We also make an empirical contribution by studying the suboptimality phenomenon in the
context of actual sales promotions. Furthermore, we propose forms of arrangements between retailer and
manufacturer that can help to prevent suboptimality and are beneficial for both parties.
7
A price discount has two effects on the profitability of a product: the profit is increased with the margin
made on the extra volume generated by the discount (1), and the profit is decreased by the loss in margin
on the baseline sales, i.e. the volume that would also have been sold under the (higher) non-discount price
(2). As long as the discount does not erase the complete margin, effect (1) is positive (Dekimpe and
Hanssens 1999). Assuming that this is the case, the sales promotion is profitable if effect (1) is larger than
effect (2), i.e. if the additional profit on the extra sales outweighs the loss in profit on the baseline sales. If
the difference between effect (1) and effect (2) is larger than the planning and execution costs of the sales
promotion, a sales promotion is profitable.
In our analysis we assume that both parties, i.e. the manufacturer and the retailer, each pay a part of the
costs of the consumer discount. The resulting discount at the channel level, the price discount of the
consumer, is the sum of the discount given by the retailer and the discount given by the manufacturer.
Sometimes the manufacturer offers a particular discount and “invites” the retailer to add his discount to
this. In other cases the retailer takes the initiative and asks the manufacturer to do his part. However the
actual arrangement comes about, in the end there is a consumer discount, and both parties, the
manufacturer and the retailer contribute to this discount. It is clear that the allocation of the burden of the
discount over retailer and distributor is an important determinant of the profit that each party derives from
the sales promotion.
We define the following variables.
p = regular consumer price q = volume of the product sold (in units) s = selling price of the manufacturer to the retailer (regular, i.e.in the absence of sales promotions) c = cost price of the product for the manufacturer dr = price discount given by the retailer (in guilders) dm = price discount given by the manufacturer (in guilders) dc = total price discount for the consumer (dc = dr + dm ) pd = consumer discount price (pd = p - dc) rsd = retailer’s share in the consumer discount (rsd=(dr/ dc)
8
B = baseline sales, i.e. the sales volume of the product in the absence of the sales promotion Fr = fixed costs of the retailer Fm = fixed costs of the manufacturer FSr = fixed costs of the sales promotion for the retailer (planning & execution costs) FSm = fixed cost of the sales promotion for the manufacturer (pl. & exec. costs) Πr = profit from the sales promotion for the retailer Πm = profit from the sales promotion for the manufacturer Πc = profit from the sales promotion for the channel (Πc = Πr + Πm)
Maximizing the channel profit
From a channel point of view, the goal of a sales promotion should be to generate as much profit for the
channel as possible. This goal is identical to the ECR norm of “maximizing total system efficiency”,
referred to earlier. This means that the price (after discount) should be the price that maximizes channel
profit, given the cost price of the product. This is a standard micro-economic problem, which can be
analytically solved when the function describing the relationship between the (discount) price and the
volume sold is known. Here we assume that this function is linear, i.e. of the form:
q(pd) = α + βpd (1),
with α, β parameters.
A linear demand function is in agreement with utility maximizing consumers with quadratic utility
functions (Shubik and Levitan 1980), and has been applied succesfully in many marketing studies, e.g.
Brodie and De Klyver (1984), Bolton (1989) and Sayman, Hoch and Raju (2001). In empirical work on
price functions in the context of sales promotions sometimes deviations from linearity have been
encountered, however, for exanple threshold effects, saturation effects and even non-monotonicity (Gupta
and Cooper 1992; Kalyanam and Shively 1998; Van Heerde, Leeflang and Wittink 2001). On the other
hand, it can be observed that in many cases a linear function is at least an acceptable approximation over a
considerable interval of the prices, see for example Van Heerde, et. al. 2001). Our purpose here is not
sophisticated estimation, but the derivation of conclusions about optimal sales promotions with a
reasonable robustness.
9
In the situation of no discount pd = p (dc=0). Hence the baseline profit (i.e. the profit without sales
promotion) at the channel level can be written as:
(α +βp)(p-c)-Fm-Fr (2).
The channel profit with the price discount is:
[α + β(p-dc)](p-c- dc) –Fr-Fm-FSr-FSm (3).
The channel profit due to the sales promotion is obtained by subtracting expression (2) from expression
(3). After rearranging terms, this results in:
Πc = -βdc(p-c-dc) - dc(α +βp) -FSr-FSm (4).
The interpretation of Equ (4) is straigthforward. The first term of the right-hand side is the margin made
on the extra volume generated by the discount, whereas the second term is the loss in margin on the
baseline sales (B= α +βp).
To find the optimal discount at the channel level, δπc/δdc should be set equal to zero. This results in:
- βp + βc + 2βdc –B=0 (5),
or,
dc*(chan) = (p-c)/2 + B/(2β) (6),
where dc*(chan) is the optimal consumer discount from the perspective of the channel. Note that usually
β<0, hence we have a maximum.
Equation (6) implies that the channel discount should be larger as the initial consumer price is higher and
the (manufacturing) cost price is lower. Since usually: β<0, the optimal discount is smaller as the baseline
sales are larger. This is clear, since on every unit of the baseline sales the loss in margin caused by the
discount is felt.
10
Next, we derive the expressions for the optimal consumer discount for the retailer and the manufacturer,
respectively.
Maximizing the profit of the retailer
The baseline profit (i.e. without sales promotion) of the retailer is:
(α +βp)(p-s)-Fr . (7).
The retailer’s profit with the price discount is:
(α+ βp-βdm-βdr)(p-s-dr)-Fr-FSr. (8).
The retailer’s profit due to the sales promotion, Πr, is the difference between expression (8) and
expression (7). After rearranging terms, we have:
Πr = -β(dm+dr)(p-s-dr) - (α + βp)dr -FSr (9).
Eqation (9) makes shows that the profit of the retailer due to the sales promotion is the extra margin on
the additional sales, generated by the price discount (first term of the right hand side) minus the loss on
the baseline sales and the fixed costs of the sales promotion (second and third term, respectively).
This formulation of the profit function makes clear that we do not take into account the effect of forward
buying in our analyses. Forward buying means that a part of the goods for which the retailer receives a
discount from the manufacturer are sold to the consumer at the regular price, which implies an additional
profit for the retailer. Also we do not take into account cannibalization effects of sales promotions.
Forward buying and cannibalization are important factors that also influence the profitability of sales
promotions. However they are not the focus of the research here. The present study concentrates on the
effect of the consumer price discount, and the way the retailer and the manufacturer contribute to the
consumer price discount, on the profitability of sales promotions.
11
If the retailer would be able to set the consumer discount, which value would he choose in order to
maximize Πr? In Equ (9) we substitute (dm+dr) by dc and dr by rsd*dc. So we have:
Πr = -βdc(p-s- rsd*dc) - (α + βp) rsd*dc -FSr (10).
Equ (10) writes the profit of the retailer, due to the sales promotion, as a function of the consumer
discount dc , and the share of the consumer discount that the retailer pays (rsd).
After rearranging term in Equ (10), and substituting (α + βp) by B, we have:
Πr = -β(p-s)dc-B*rsd*dc+ rsd*dc**2 (11).
Differentiating Equ (11) to dc, setting the derivative equal to zero, and solving for dc gives:
dc*(ret) =(p-s)/(2*rsd)+B/(2β) (12),
where dc*(ret) is the optimal consumer discount from the perspective of the retailer.
The interpretation of Equ (12) is straightforward. According to the first term on the right hand side, the
optimal discount for the retailer is larger as his regular margin (p-s)) is larger. This margin (minus the
discount) is earned on each extra unit sold through the discount. Also, naturally, as the retailer pays a
larger share of the discount (rsd), his optimal discount is smaller. Furthermore, as in the case of the
optimal channel discount (Eq 6), the retailer would strive for a smaller dis count, as the baseline sales B
are larger.
Maximizing the profit of the manufacturer
The profit of the manufacturer, due to the sales promotion, can be writt (13).
Substituting (dm+dr) by dc, dm by (1-rsd)dc , (α+βp) by B, and rearranging terms, we obtain:
Πm= -β(s-c)dc-(B*rsd-B)dc+(β-β*rsd)dc**2 (14).
Setting the first derivative of Πm to dc equal to zero, and solving for dc , gives:
dc*(man)= (s-c)/(2*(1-rsd)) +B/(2β) (15),
where, dc*(man) is the optimal consumer discount from the perspective of the manufacturer. Equ (15)
implies that, similar to the retailer, the optimal discount for the manufacturer is larger as his regular
12
margin, in this case (s -c), is larger. Also in agreement with the situation for the retailer, the optimal
discount for the manufacturer is smaller as the baseline sales (B) are higher. However, in contrast to the
retailer, the optimal discount for the manufacturer is larger if the retailer pays a larger share of the
discount (rsd).
Potential suboptimality
Notwithstanding the similarity in strucure of the equations for the optimal consumer discount (equations
12 and 15), these equations also show that the chance of arriving at the same optimum discount is slim.
Usually the regular margin, (p-s) for the retailer and (s-c) for the manufacturer, will bedifferent for the
tow parties. moreover the share in the discount (rsd) has opposite effects for the retailer and the
manufacturer. Therefore, there is no reason to expect that the retailer and the manufacturer would opt for
the same consumer discount, nor that a discount they might agree on, would automatically coincide with
the optimal consumer discount for the channel. It is therefore quite likely that a resulting consumer
discount is “uboptimal”, i.e. it does not realize the maximum possible profit for the channel.
Example
A numerical example can illustrate these phenomena. For this purpose, we use one of the sales promotion
cases from our database. For this particular case the baseline sales were 989 (units), and a discount of Dfl
0.40 on the regular price of Dfl 2.19 resulted in a sales increase to 4676. The cost price is 0.92, and the
regular selling price from the manufacturer to the retailer is 1.32. The retailer paid 50% of the discount.
We will use this particular real-life illustration as a running example throughout the remainder of the text.
We will refer to this sample case as Case S. Table 1 gives the basic data on Case S.
13
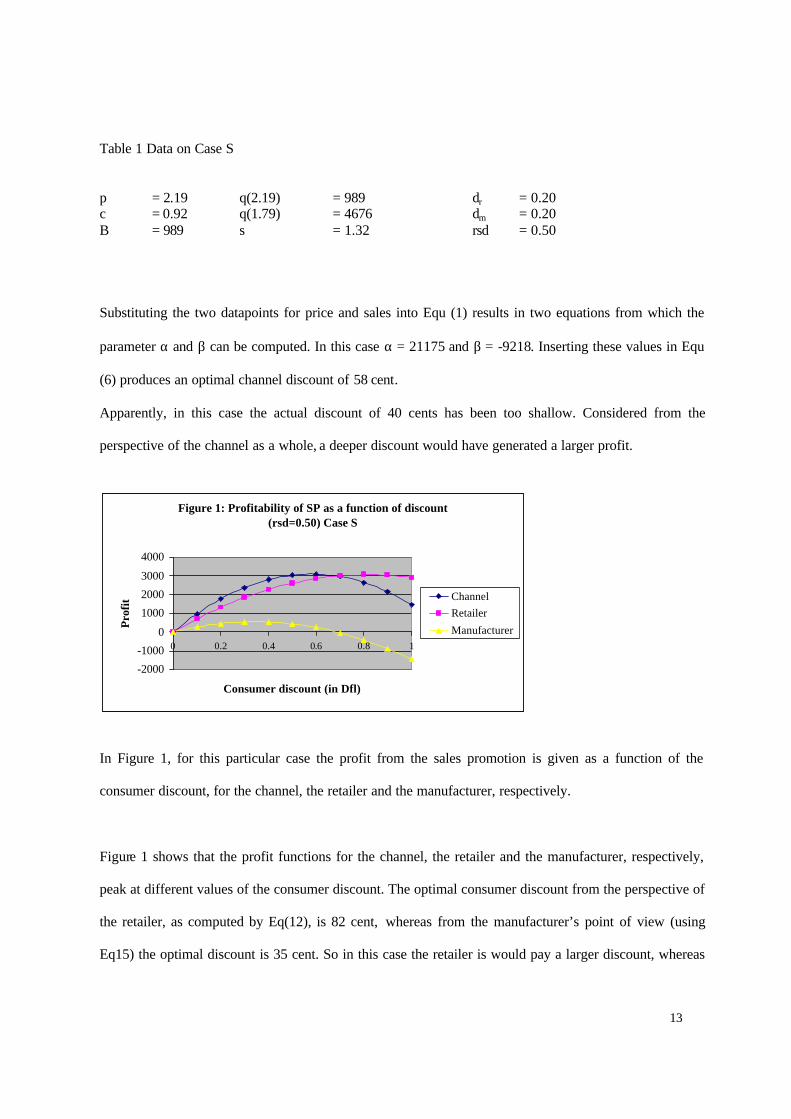
Table 1 Data on Case S
p = 2.19 q(2.19) = 989 dr = 0.20 c = 0.92 q(1.79) = 4676 dm = 0.20 B = 989 s = 1.32 rsd = 0.50
Substituting the two datapoints for price and sales into Equ (1) results in two equations from which the
parameter α and β can be computed. In this case α = 21175 and β = -9218. Inserting these values in Equ
(6) produces an optimal channel discount of 58 cent.
Apparently, in this case the actual discount of 40 cents has been too shallow. Considered from the
perspective of the channel as a whole, a deeper discount would have generated a larger profit.
In Figure 1, for this particular case the profit from the sales promotion is given as a function of the
consumer discount, for the channel, the retailer and the manufacturer, respectively.
Figure 1 shows that the profit functions for the channel, the retailer and the manufacturer, respectively,
peak at different values of the consumer discount. The optimal consumer discount from the perspective of
the retailer, as computed by Eq(12), is 82 cent, whereas from the manufacturer’s point of view (using
Eq15) the optimal discount is 35 cent. So in this case the retailer is would pay a larger discount, whereas
Figure 1: Profitability of SP as a function of discount (rsd=0.50) Case S
-2000
-1000
0
1000
2000
3000
4000
0 0.2 0.4 0.6 0.8 1
Consumer discount (in Dfl)
Prof
it ChannelRetailer
Manufacturer
14
the manufacturer would like to temper it. The actual consumer discount of 40 cent is closer to the optimal
value of the manufacturer, than the optimal value of the retailer. It is possible that this is due to a
relatively strong negotiation position of the manufacturer in this particular case. However this may be, by
applying the suboptimal consumer discount of 40 cent, the channel profit from the sales promotion (i.e.
the profit of retailer and manufacturer together) is lower than if the channel-optimal consumer discount of
58 cent would have been chosen.
Systematic suboptimality
The last section has shown that there is no guarantee that the consumer discount, which results from the
decisions of the manufacturer and the retailer, is the discount that maximizes the channel profit from the
sales promotion. However, even if individual sales promotions might be off compared to the optimal
channel discounts, it could still be that on average consumer discounts would not systematically be too
low or too high. We will show that this is not the case, and that there is a built-in tendency of a systematic
deviation from optimality.
Interdepence of the channel members’ decisions
In the last section, we have approached the optimization problem of one particular party by determining
the optimal value of the consumer discount for that party, given the share of the discount that he has to
pay. Another way of looking at this problem is to ask what the optimal discount is for one party, given the
discount paid by the other party. For example what is the optimal discount, dr , of the retailer, given that
the discount given by the manufacturer is dm? Equ (9) gives the retailer’s profit, Πr , as function of dr and
dm. This equation shows that the profit of the retailer due to a sales promotion is larger as the
manufacturer’s discount, dm , is larger. Equ (13) shows that also the opposite is true: the manufacturer’s
profit is larger as the retailer gives a larger discount. The reason that one party profits from a larger
discount by the other party, is that it reaps the benefits in the form of a margin on the additional sales
generated by the lower price, caused by the price discount of the other party.
15
The partial derivative of Equ (9) with respect to dr is:
δΠr/δdr= -β(p-s-dm-2dr)-B (16).
Setting this expression equal to zero and solving for dr, leads to the optimal value of dr, given a particular
value of dm:
dr*|dm (ret) = B/(2β) + (p-s-dm)/2 (17).
Equ (17) shows that the optimal value of the retailer’s discount is dependent on the discount that is given
by the manufacturer. The larger the discount of the manufacturer, the smaller the optimal discount of the
retailer.
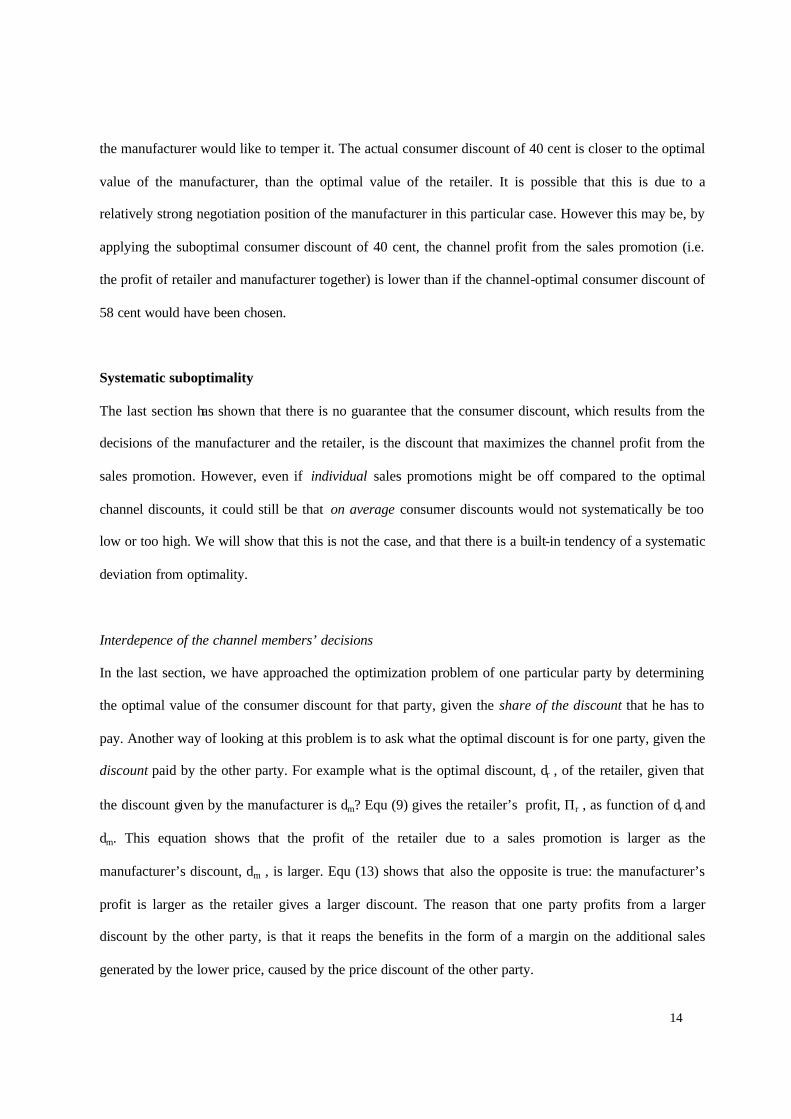
Figure 2, depicts, for Case S, the profitability of the sales promotion for the retailer as a function of the
retailer’s own discount. This profitability function is displayed for several values of the discount given by
the manufacturer (dm). Figure 2 shows that for a particular value of the retailer’s discount, his profit is
always larger as the manufacturer’s discount is larger. Secondly, the optimal discount of the retailer
decreases, as the manufacturer gives a larger discount. If the manufacturer would not give a discount at
all, the retailer should give a discount of 38 cents. However, if the manufacturer would give a discount of
50 cents, the retailer should add a discount of his own of 13 cents only. So, the optimal value of the own
discount is dependent on the discount given by the other party.
16
4000
3000
2000
1000
0
0.10 0.20 0.30 0.40 0.50
13.0*dr =
)50.0dd( mrr =∏
Figure 2: Profitability of a sales promotion for the retailer as function of dr, for different values of dm (Case S)
18.0*dr =
28.0*dr =
38.0*dr =
)40.0dd( mrr =∏
)20.0dd( mrr =∏
)0dd( mrr =∏
We can derive a similar expression as Eq (17) for the optimal value of the discount of the manufacturer,
dm, given the discount by the retailer. Setting the partial derivative of Eq (13) with respect to dm equal to
zero, and solving for dm, leads to:
dm*|dr (man) = B/(2β) + (s-c- dr)/2 (18).
So, the manufacturer should set his discount at a lower value, as the retailer gives a higher discount. So if
one party sets a larger discount, this not only has a direct positive effect on the profit of the other party,
but also induces the other party to lower its discount.
We have seen earlier that the outcome of the decisions of the different parties together does not
automatically result in a channel-optimal size of the discount, The question can be asked, if one party will
tend to “restore” the optimal situation, if he explicitly uses knowledge of the discount of the other party
in determining his own an optimal discount. The answer is only partially. This can be demonstrated once
more with the example of Case S. In this case both the manufacturer and the retailer give a discount of 20
cent. So the consumer discount is 40 cent. We have seen earlier that for Case S the channel-optimal
17
consumer discount is 58 cent. If the retailer would use the information that the manufacturer has set his
discount at 20 cent in determining his own optimal discount (Equ 17), he will set his own discount at 28.
So, the consumer discount would then be 48 (20+28) cent, closer to the channel optimum of 58 cent, than
the original consumer discount of 40 cent, but still a suboptimal situation. Also the opposite situation, if
the manufacturer knows what the retailer’s discount will be, and then maximizes his own profit (the
popular Stackelberg leader-follower model), will generally not lead to the channel-optimal consumer
discount.
Myopic optimization
The fundamental problem is that each party, by looking only at its own profit function, fails to take into
account the effect of his decision on the profit of his channel partner. By doing so, the full channel effects
are not taken into consideration, and therefore no overall, i.e. channel optimization, takes place. Jeuland
and Shugan (1983) have identified this phenomenon as the main cause of a the lack of coordination in the
channel. Gerstner and Hess (1995, p 44)) have called this cause the “double marginalization” problem:
each party concentrates on its own marginal profit in setting its decision variables.
In the case of sales promotions this works as follows. Let’s take the perspective of the retailer. The
optimal price discount of the retailer, given the discount, dm of the manufacturer, is given by Equ (17).
However, in choosing this discount, the retailer ignores that every increase in his discount, will generate
more units through the channel, and in this way will increase the profit of the manufacturer. In other
words, he is ignoring the gain from his action for the manufacturer. If the retailer would own the whole
channel (i.e. also the manufacturer), he would also take the effect on the manufacturer’s side into account.
The effect of the retailer’s discount on the manufacturer’s profit is given by (Equ 13, with α+βp
substituted by B):
Πm= -β(dm+dr)(s-c-dm)-Bdm-FSm (19).
18
The effect of change in the retailer’s discount on the profit of the manufacturer is given by:
δΠm/δdr = -β(s-c-dm) (20).
So, if the retailer would set his discount dr in such a way that the channel profit is maximized, he would
choose the value that makes the sum of the right-hand-sides of Equ(16) and Equ(20) equal to zero. Hence,
the retailer’s discount that maximize the profit of the channel, given the discount given by the
manufacturer is:
dr*|dm (chan) = B/(2β) + (p-s-dm)/2 + (s-c-dm)/2 (21).
A comparison of Equ (21) with Equ (17), reveals, that the difference between the value of the retailer’s
discount, that maximizes the (myopic) retail profit and the value that maximizes overall channel profit is:
(s-c-dm)/2.
So, as long as this expression is positive (which is the case if the margin of the manufacturer during the
sales promotion is positive), the retailer’s discount will be too small, considered from the overall channel
perspective. In Case S, we have seen that for the current value of the manufacturer’s discount (20 cent),
the retailer will set his discount at 28 cent if he only maximizes his own profit, i.e. when using Equ 17. If
he would set his discount at the value that maximizes the channel profit, using Equ 21, the optimal size of
his discount is 38 cent. In this case total channel discount, dc, would be 58 cent (20 +38) which is the
optimal channel value, as we saw earlier. Here we have taken, the retailer’s perspective, but the same
analysis applies when taking the manufacturer’s point of view. By setting his discount at the value that
maximizes his own profit, this value will be too low, if considered from the point of view of the channel
(as long as the margin for the other channel member is positive).
Jeuland and Shugan (1983) looked at the determination of price in the channel, and found that the lack of
channel coordination leads to a price that is too high from the perspective of the channel. This result is
mirrored by our finding for sales promotions, that when each party makes its own price discount decision,
19
the total consumer discount will be too small (i.e. the consumer price is too high). However, this is only
the case if the margin for the other party, (s-c-dm) in the analysis given above, is positive Therefore, we
have extend this result, with the conclusion that a party can also be induced to press in the direction of a
consumer discount that is too high , resulting in a consumer price that is to low. This is the case if the
other’s party margin is negative, as will be illustrated shortly.
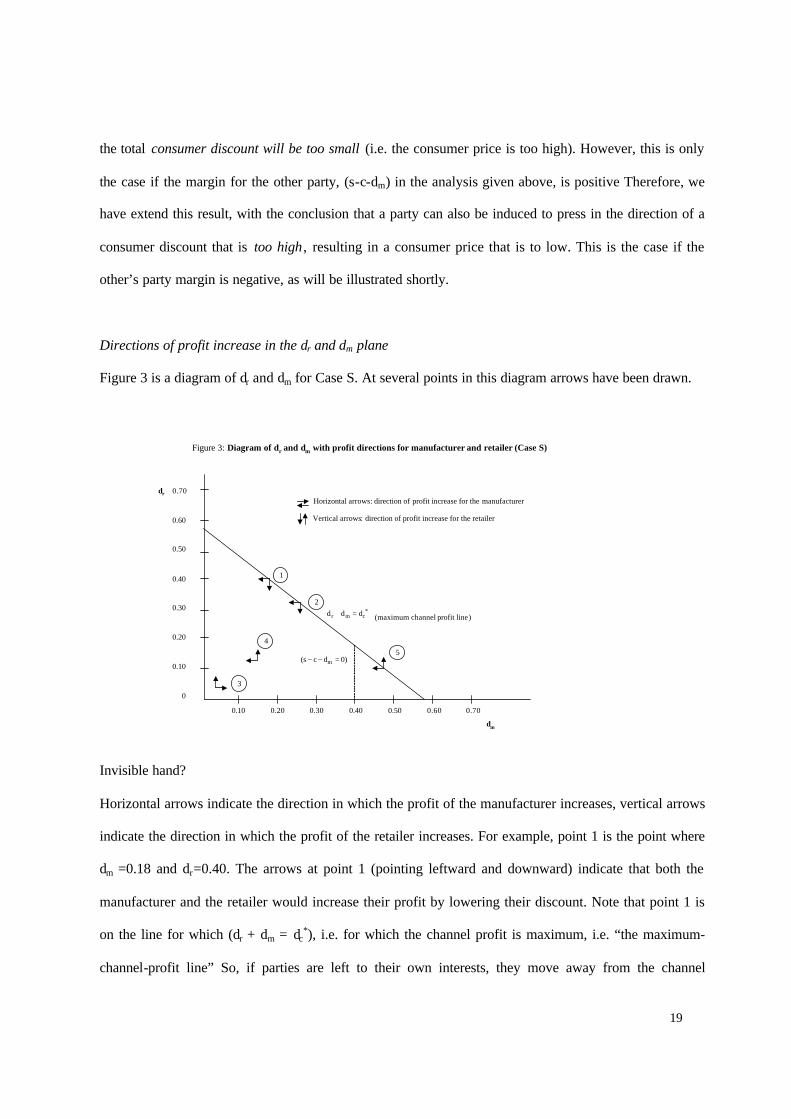
Directions of profit increase in the dr and dm plane
Figure 3 is a diagram of dr and dm for Case S. At several points in this diagram arrows have been drawn.
Invisible hand?
Horizontal arrows indicate the direction in which the profit of the manufacturer increases, vertical arrows
indicate the direction in which the profit of the retailer increases. For example, point 1 is the point where
dm =0.18 and dr=0.40. The arrows at point 1 (pointing leftward and downward) indicate that both the
manufacturer and the retailer would increase their profit by lowering their discount. Note that point 1 is
on the line for which (dr + dm = dc*), i.e. for which the channel profit is maximum, i.e. “the maximum-
channel-profit line” So, if parties are left to their own interests, they move away from the channel
Figure 3: Diagram of dr and dm with profit directions for manufacturer and retailer (Case S)
dr 0.70
0.60
0.50
0.40
0.30
0.20
0.10
0
0.10 0.20 0.30 0.40 0.50 0.60 0.70
Horizontal arrows: direction of profit increase for the manufacturer
Vertical arrows: direction of profit increase for the retailer
)0dcs( m =−−
*cmr ddd =+
2
1
4
3
5
(maximum channel profit line)
dm
20
optimum. The same is true for other points on the maximum-channel-profitability line, e.g. point 2. If
there is an “invisible hand” here, this tends to lead parties away from, rather than towards, their common
interest. Only if the actual discounts become very small, both parties have an incentive to increase their
discount. This is the case, for example, for point 3, where both discount are as low as 5 cents.There are
also locations in the diagram where one party has the incentive to increase its discount, and the other
party to decrease it. This, for example is the case for point 4, where both the discount of the manufacturer
and the discount of the retailer are 15 cents. At this point the retailer will increase his profit by making
his discount larger, whereas for the manufacturer the opposite is true.
Discounts can also become too large
Interestingly, not at all locations of the maximum channel profit line have both parties an incentive to
decrease their discount. Take for example point 5, where dm= 50 cent and dr = 8 cent. Although here the
manufacturer has an incentive to decrease his discount, whereas for the retailer a higher discount would
be profitable. Apparently, here we have a situation where one party has the incentive to set the total
consumer discount at a level that is higher than the channel optimum. The reason is that in this case (s-c-
dm )<0, i.e. the manufacturer has a negative margin. Now the retailer, by only taking into account his own
profit ignores that every additional unit sold through the channel caused by his discount, will generate an
additional loss (instead of a gain) at the side of the manufacturer. So, in general both parties are induced
to make the channel discount too small, and only in the case that one party has a negative margin, the
other party, by pursuing only its own interest, will be induced to a discount that is too large from a
channel point of view.
At this point, we leave the theoretical domain to take a look at the actual sales promotion cases in the
database. So far, our conclusions from the theoretical analysis can be summarized as follows:
21
• Generally, the optimal value of the consumer discount will be different for the channel, the retailer
and the manufacturer. This makes it unlikely that the actual consumer discount will be equal to the
channel-optimal discount.
• if each party takes into consideration the effect of its discount on its own profit only (myopic
optimization), the result will be suboptimalization. Generally, this will lead to consumer price
discounts that are not deep enough from a channel point-of-view.
4 Profitability of the Sales Promotions in the Database
We look at a large database of eighty-six sales promotions to examine how profitable these sales
promotions have been, to see if the suboptimality of price discounts that we expect from the theoretical
analysis does occur, and if so, to examine the size and direction of these suboptimalities.
The data
The data consist of eighty-six sales promotions in a food category that took place in a medium sized
retailing chain (about one hundred shops) during the period of week 42 of 1996 to week 12 of 1997. All
sales promotions are price discounts, and all sales promotions were supported by feature advertisements
in door-to-door circulars distributed around the stores. Each sales promotion lasted one week. The eighty-
six sales promotions are all the sales promotions that took place in the particular food product category,
during the period under study in the specific retail chain. The data were collected in the context of an
ECR project. The participants in this ECR project made all the relevant information available: regular
consumer price, price discount given to the consumer, regular purchasing price for the retailer and
purchasing price during discount (this makes it possible to compute rsd, the retailer’s share in the
discount). The information about the cost price of the manufacturer was incomplete. Based on the
available data, we set the cost price of the manufacturer equal to 70% of the regular purchasing price of
the retailer. (This was based on the detailed data that we did have for two cases. In companies exact cost
prices are often not known either, and managers often work with similar assumptions.) The sales data are
22
scanner data collected by the retailer. These scanner data were also used to calculate baseline sales for
each sales promotion, i.e. the predicted level of sales if no sales promotion would have taken place.
Costs
One purpose of the ECR project for which these data were collected, was to get a better insight in the
costs of sales promotions. After a painstaking analysis of all the activities involved in the preparation and
execution of sales promotions, both in the organization of the manufacturer and the organization of the
retailer, using Activity-Based-Costing a cost figure was calculated for the “average” sales promotion with
price discount, for the manufacturer as well as the retailer (Verstappen, Van de Vorst and Wierenga
1998). In the present study these average cost figures for the preparation and execution of sales
promotions were subtracted from the extra profits generated by a sales promotion for the retailer and the
manufacturer (Πr, and Πm respectively.) Since these costs are “fixed” per sales promotion, they do not
affect the impact on profit of different discount levels or different allocation schemes of the discount over
retailer and manufacturer, which we will consider later. In the situation of these eighty-six sales
promotions the costs of feature advertisements in local circulars were fully paid by the manufacturer.
These were included in the fixed costs of a sales promotion for the manufacturer.
Computation of profit
In the computation of the profitability of sales promotions that we carry out in this paper, we consider the
extra profit for the specific item due to the sales promotion, i.e. the increase in the difference between
revenue and purchasing costs, diminished with the fixed costs per sales promotion. As mentioned earlier,
in this study we do not take into account forward buying. The product category consists of food products
with a short shelf life, so that forward buying is not an important phenomenon here anyway.
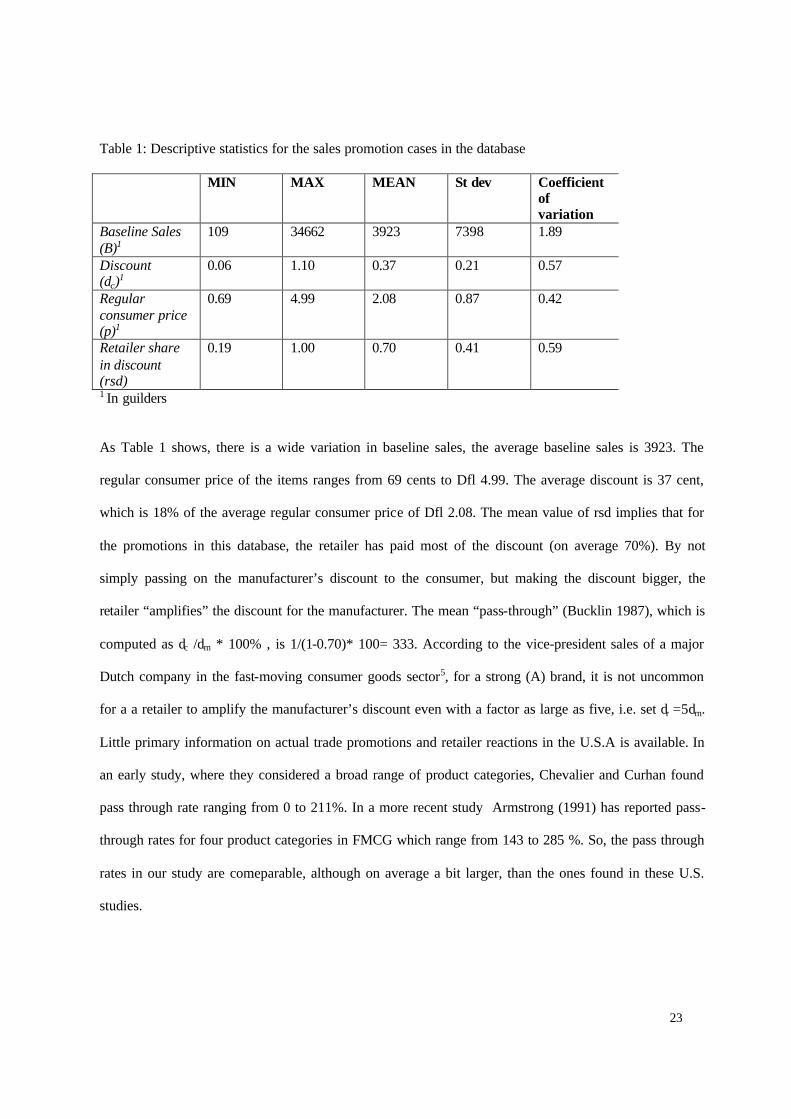
Table 1 provides descriptive statistics for the eighty-six sales promotions.
23
Table 1: Descriptive statistics for the sales promotion cases in the database MIN MAX MEAN St dev Coefficient
of variation
Baseline Sales (B)1
109 34662 3923 7398 1.89
Discount (dc)1
0.06 1.10 0.37 0.21 0.57
Regular consumer price (p)1
0.69 4.99 2.08 0.87 0.42
Retailer share in discount (rsd)
0.19 1.00 0.70 0.41 0.59
1 In guilders As Table 1 shows, there is a wide variation in baseline sales, the average baseline sales is 3923. The
regular consumer price of the items ranges from 69 cents to Dfl 4.99. The average discount is 37 cent,
which is 18% of the average regular consumer price of Dfl 2.08. The mean value of rsd implies that for
the promotions in this database, the retailer has paid most of the discount (on average 70%). By not
simply passing on the manufacturer’s discount to the consumer, but making the discount bigger, the
retailer “amplifies” the discount for the manufacturer. The mean “pass-through” (Bucklin 1987), which is
computed as dc /dm * 100% , is 1/(1-0.70)* 100= 333. According to the vice-president sales of a major
Dutch company in the fast-moving consumer goods sector5, for a strong (A) brand, it is not uncommon
for a a retailer to amplify the manufacturer’s discount even with a factor as large as five, i.e. set dr =5dm.
Little primary information on actual trade promotions and retailer reactions in the U.S.A is available. In
an early study, where they considered a broad range of product categories, Chevalier and Curhan found
pass through rate ranging from 0 to 211%. In a more recent study Armstrong (1991) has reported pass-
through rates for four product categories in FMCG which range from 143 to 285 %. So, the pass through
rates in our study are comeparable, although on average a bit larger, than the ones found in these U.S.
studies.
24
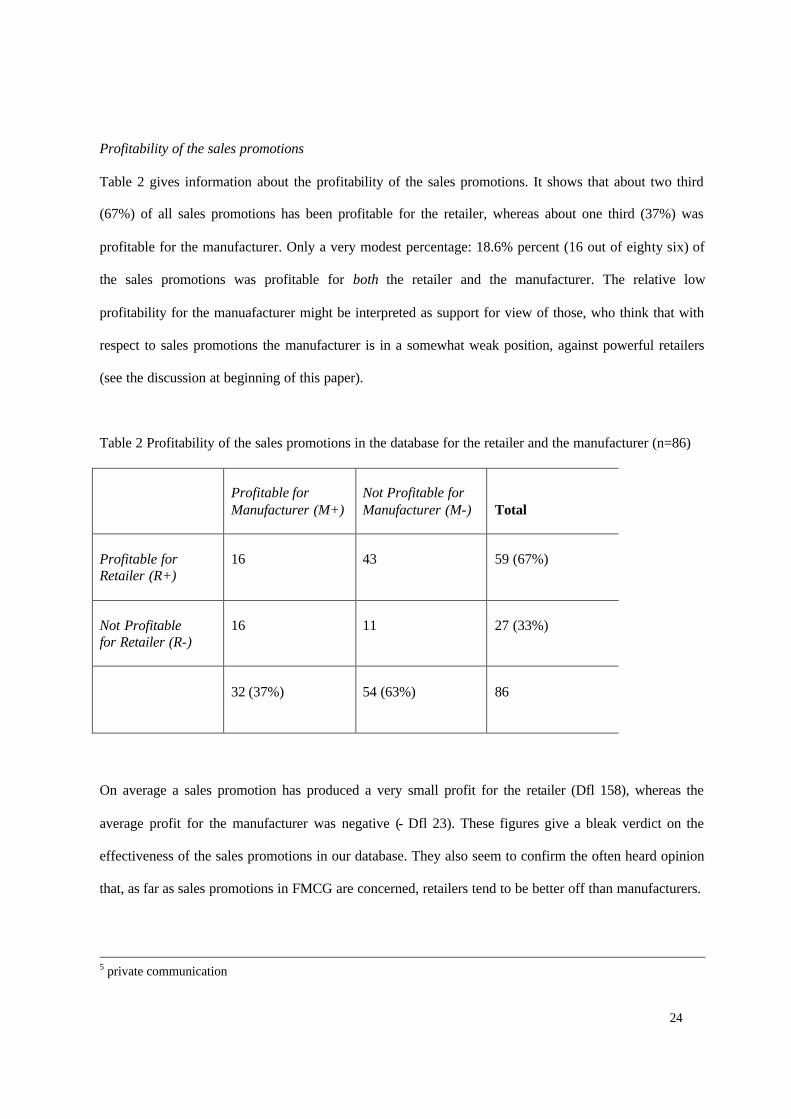
Profitability of the sales promotions
Table 2 gives information about the profitability of the sales promotions. It shows that about two third
(67%) of all sales promotions has been profitable for the retailer, whereas about one third (37%) was
profitable for the manufacturer. Only a very modest percentage: 18.6% percent (16 out of eighty six) of
the sales promotions was profitable for both the retailer and the manufacturer. The relative low
profitability for the manuafacturer might be interpreted as support for view of those, who think that with
respect to sales promotions the manufacturer is in a somewhat weak position, against powerful retailers
(see the discussion at beginning of this paper).
Table 2 Profitability of the sales promotions in the database for the retailer and the manufacturer (n=86)
Profitable for Manufacturer (M+)
Not Profitable for Manufacturer (M-)
Total
Profitable for Retailer (R+)
16
43
59 (67%)
Not Profitable for Retailer (R-)
16
11
27 (33%)
32 (37%)
54 (63%)
86
On average a sales promotion has produced a very small profit for the retailer (Dfl 158), whereas the
average profit for the manufacturer was negative (- Dfl 23). These figures give a bleak verdict on the
effectiveness of the sales promotions in our database. They also seem to confirm the often heard opinion
that, as far as sales promotions in FMCG are concerned, retailers tend to be better off than manufacturers.
5 private communication
25
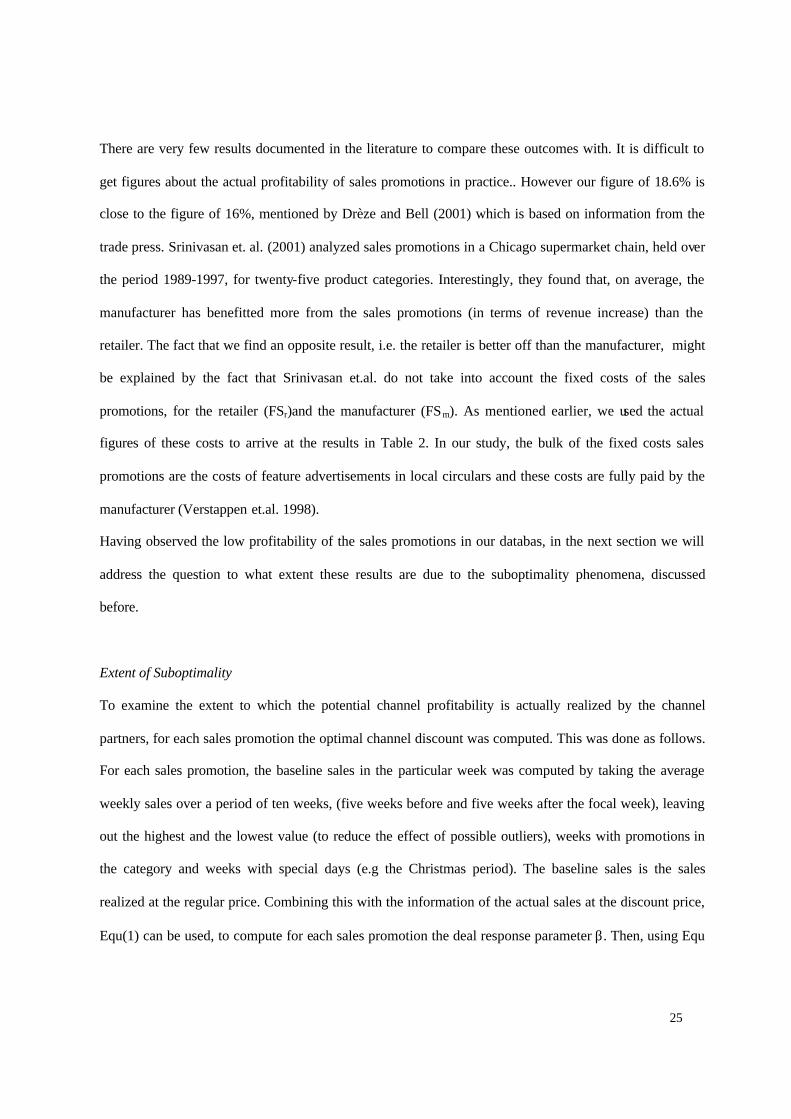
There are very few results documented in the literature to compare these outcomes with. It is difficult to
get figures about the actual profitability of sales promotions in practice.. However our figure of 18.6% is
close to the figure of 16%, mentioned by Drèze and Bell (2001) which is based on information from the
trade press. Srinivasan et. al. (2001) analyzed sales promotions in a Chicago supermarket chain, held over
the period 1989-1997, for twenty-five product categories. Interestingly, they found that, on average, the
manufacturer has benefitted more from the sales promotions (in terms of revenue increase) than the
retailer. The fact that we find an opposite result, i.e. the retailer is better off than the manufacturer, might
be explained by the fact that Srinivasan et.al. do not take into account the fixed costs of the sales
promotions, for the retailer (FSr)and the manufacturer (FSm). As mentioned earlier, we used the actual
figures of these costs to arrive at the results in Table 2. In our study, the bulk of the fixed costs sales
promotions are the costs of feature advertisements in local circulars and these costs are fully paid by the
manufacturer (Verstappen et.al. 1998).
Having observed the low profitability of the sales promotions in our databas, in the next section we will
address the question to what extent these results are due to the suboptimality phenomena, discussed
before.
Extent of Suboptimality
To examine the extent to which the potential channel profitability is actually realized by the channel
partners, for each sales promotion the optimal channel discount was computed. This was done as follows.
For each sales promotion, the baseline sales in the particular week was computed by taking the average
weekly sales over a period of ten weeks, (five weeks before and five weeks after the focal week), leaving
out the highest and the lowest value (to reduce the effect of possible outliers), weeks with promotions in
the category and weeks with special days (e.g the Christmas period). The baseline sales is the sales
realized at the regular price. Combining this with the information of the actual sales at the discount price,
Equ(1) can be used, to compute for each sales promotion the deal response parameter β. Then, using Equ
26
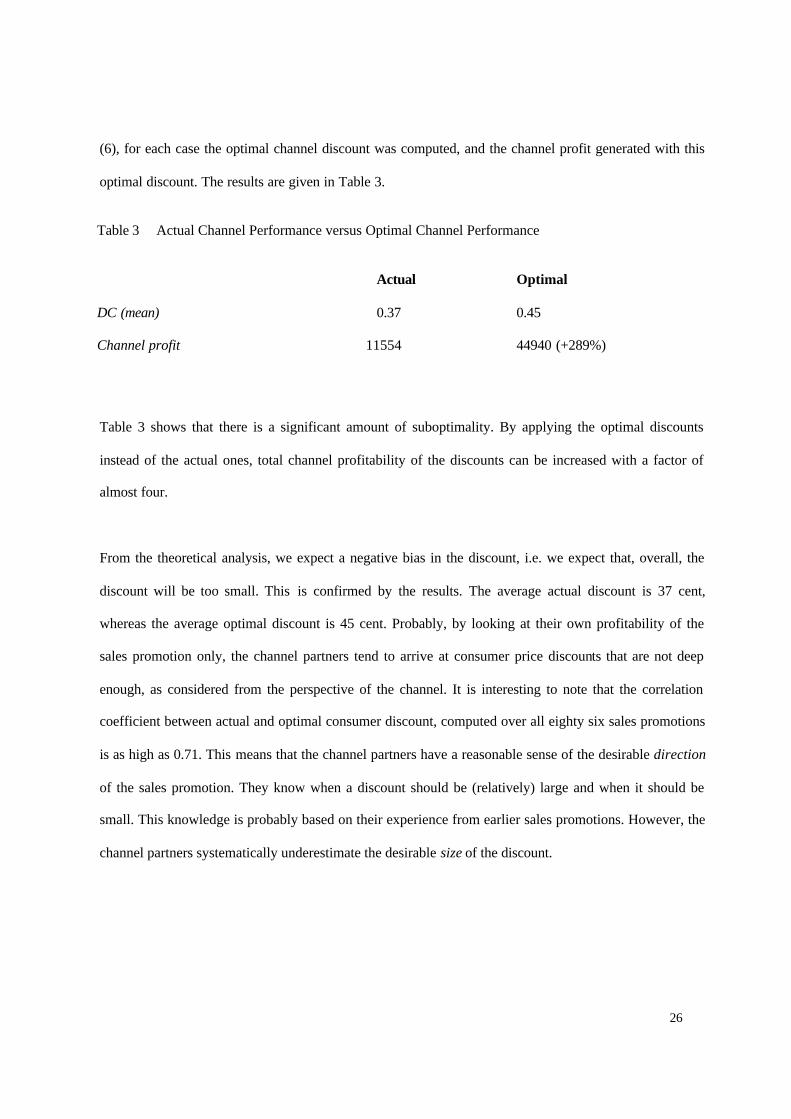
(6), for each case the optimal channel discount was computed, and the channel profit generated with this
optimal discount. The results are given in Table 3.
Table 3 Actual Channel Performance versus Optimal Channel Performance Actual Optimal DC (mean) 0.37 0.45 Channel profit 11554 44940 (+289%)
Table 3 shows that there is a significant amount of suboptimality. By applying the optimal discounts
instead of the actual ones, total channel profitability of the discounts can be increased with a factor of
almost four.
From the theoretical analysis, we expect a negative bias in the discount, i.e. we expect that, overall, the
discount will be too small. This is confirmed by the results. The average actual discount is 37 cent,
whereas the average optimal discount is 45 cent. Probably, by looking at their own profitability of the
sales promotion only, the channel partners tend to arrive at consumer price discounts that are not deep
enough, as considered from the perspective of the channel. It is interesting to note that the correlation
coefficient between actual and optimal consumer discount, computed over all eighty six sales promotions
is as high as 0.71. This means that the channel partners have a reasonable sense of the desirable direction
of the sales promotion. They know when a discount should be (relatively) large and when it should be
small. This knowledge is probably based on their experience from earlier sales promotions. However, the
channel partners systematically underestimate the desirable size of the discount.
27
Opposite Interest of Manufacturer and Retailer
We have shown that the channel parties currently do not tap the discount possibilities in an adequate way,
and “leave money on the table”. The question is how to arrive at a situation that is more attractive than the
current one. It would help, of course, if the interests of both parties are parallel, but in the theoretical part
of this paper, we saw that this is not necessarily the case. We examined this empirically for the cases in
our database. First, we looked at regular sales occasions, i.e. without discounts. For this purpose, we
computed for each of the eighty-six cases what the profit for the retailer and the manufacturer would have
been without the sales promotions (using the baseline sales as the actual sales figure) and correlated these
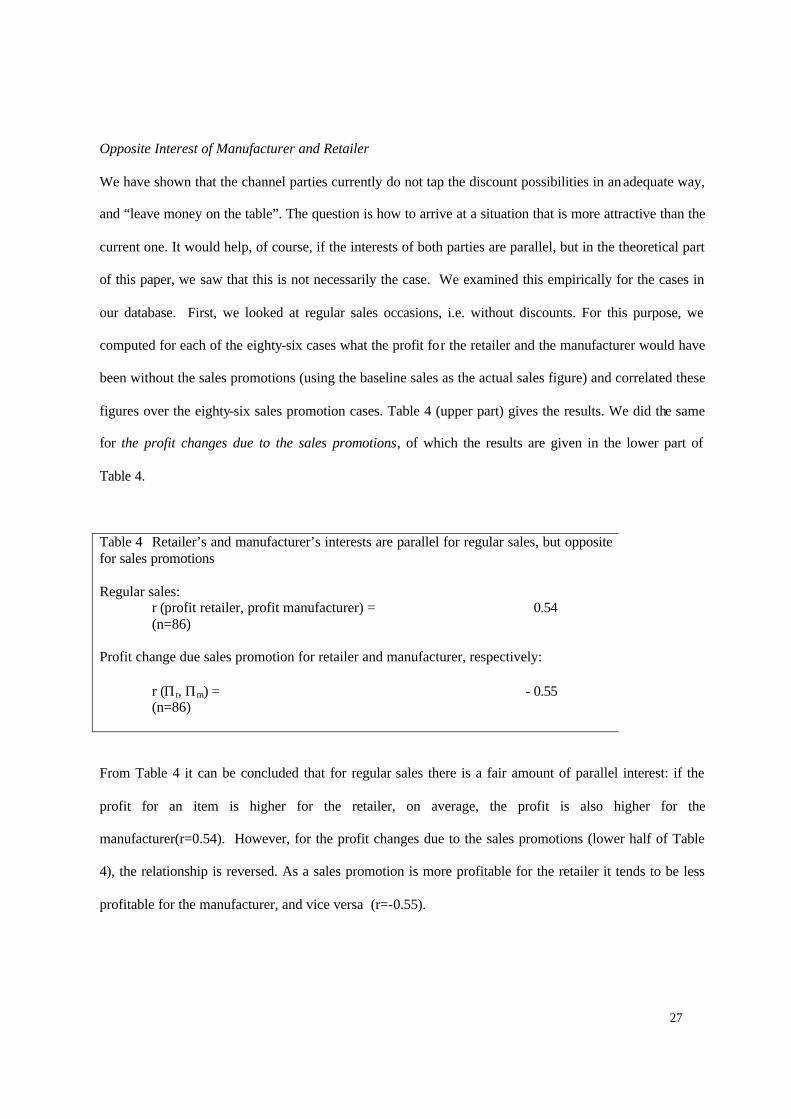
figures over the eighty-six sales promotion cases. Table 4 (upper part) gives the results. We did the same
for the profit changes due to the sales promotions, of which the results are given in the lower part of
Table 4.
Table 4 Retailer’s and manufacturer’s interests are parallel for regular sales, but opposite for sales promotions Regular sales: r (profit retailer, profit manufacturer) = 0.54 (n=86) Profit change due sales promotion for retailer and manufacturer, respectively: r (Πr, Πm) = - 0.55 (n=86)
From Table 4 it can be concluded that for regular sales there is a fair amount of parallel interest: if the
profit for an item is higher for the retailer, on average, the profit is also higher for the
manufacturer(r=0.54). However, for the profit changes due to the sales promotions (lower half of Table
4), the relationship is reversed. As a sales promotion is more profitable for the retailer it tends to be less
profitable for the manufacturer, and vice versa (r=-0.55).
28
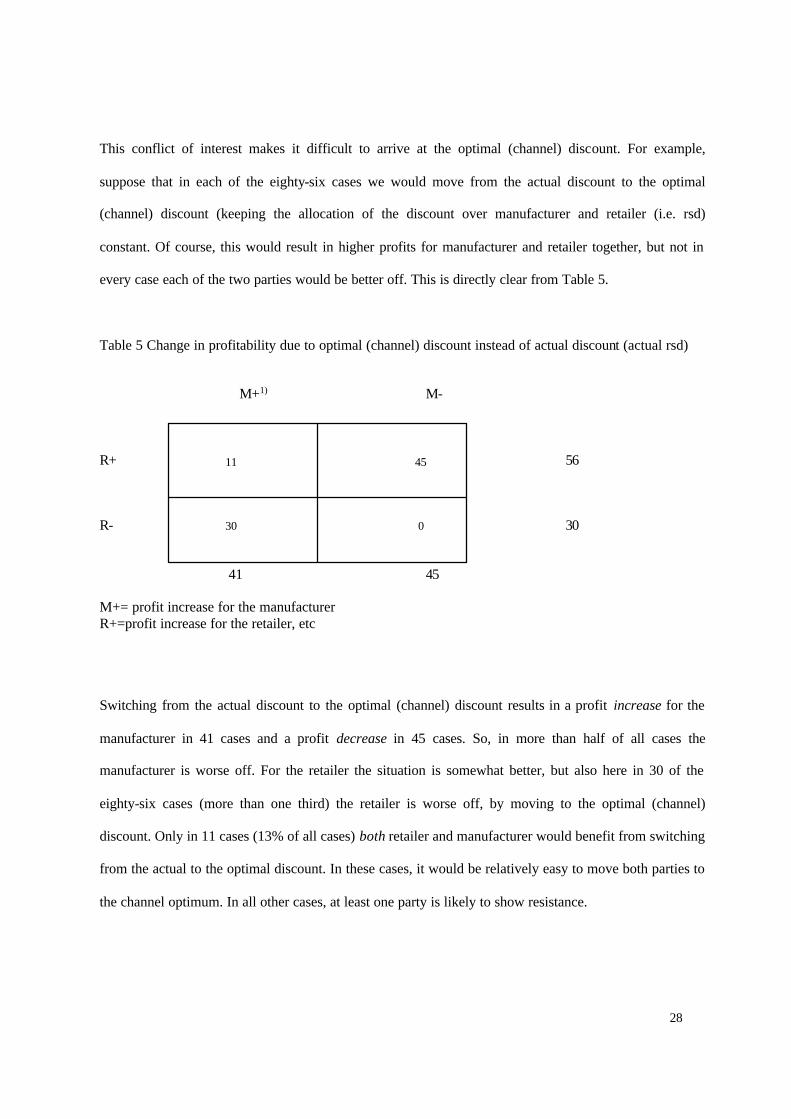
This conflict of interest makes it difficult to arrive at the optimal (channel) discount. For example,
suppose that in each of the eighty-six cases we would move from the actual discount to the optimal
(channel) discount (keeping the allocation of the discount over manufacturer and retailer (i.e. rsd)
constant. Of course, this would result in higher profits for manufacturer and retailer together, but not in
every case each of the two parties would be better off. This is directly clear from Table 5.
Table 5 Change in profitability due to optimal (channel) discount instead of actual discount (actual rsd) M+1) M- R+ 56 56 R- 30 41 45 M+= profit increase for the manufacturer R+=profit increase for the retailer, etc
Switching from the actual discount to the optimal (channel) discount results in a profit increase for the
manufacturer in 41 cases and a profit decrease in 45 cases. So, in more than half of all cases the
manufacturer is worse off. For the retailer the situation is somewhat better, but also here in 30 of the
eighty-six cases (more than one third) the retailer is worse off, by moving to the optimal (channel)
discount. Only in 11 cases (13% of all cases) both retailer and manufacturer would benefit from switching
from the actual to the optimal discount. In these cases, it would be relatively easy to move both parties to
the channel optimum. In all other cases, at least one party is likely to show resistance.
11 45
30 0
29
At this stage the conclusions from the empirical analysis of the cases in our database can be summarized
as follows:
• The profitability of the sales promotions is modest at best. For the manufacturer only one third of the
sales promotions is profitable, for the retailer two third is profitable, whereas less than twenty percent
of all sales promotions is profitable for manufacturer and retailer.
• There is a significant amount of suboptimality in the current sales promotions. If in each case the
channel-optimal consumer discount had applied instead of the actual consumer discount, total channel
profits would have been about four times higher.
• As expected from the theory, there is an evident conflict of interest between the manufacturer and the
retailer. As a sales promotion is more profitable for the manufacturer, it is less profitable for the
retailer, and the other way around.
• Also in agreement with the theory, there is a systematic (downward) bias in the size of the consumer
discount. On average, the discount has been too small, compared to the optimal channel discount.
So there is every reason to look for sales promotion arrangements that will remove these suboptimalities.
This will be done in the next part of the paper.
5 Proportional discount sharing arrangement
Given that in the current situation the channel possibilities for discounts are not used to their full
potential, we should look for ways to improve this situation. Can we devise “coordination mechanisms”
(Jeuland and Shugan 1983, i.e. arrangements between retailers and manufacturers, that would
systematically lead to more effective sales promotions for both parties? Such an arrangement should
fulfill two conditions: it should (i) simultaneously make both the retailer and the manufacturer better off
(i.e. make their interests parallel); and (ii) steer in the direction of the channel optimum.
30
We present what we call a “proportional discount sharing arrangement”, which is an arrangement where
the costs of the discount are allocated over retailer and manufacturer in proportion to their original
margins. We will show that for a proportional discount sharing arrangement, the (profit) interests of
retailer and manufacturer are parallel, in that they will aim for the same consumer discount, which is then
also the discount that maximizes the channel profit. Therefore a proportional discount sharing
arrangement provides an interesting option for solving the suboptimality problem of sales promotions
through a win-win procedure.
Assume that the retailer’s discount is set proportional to the manufacturer’s discount, i.e.:
dr = tdm (22).
Now we can prove that the optimal discount of each party will coincide with each other and with the
channel optimum, if:
t=(p-s/s-c), (23),
or, put differently, if
dr /dm = (p-s)/(s-c) (24),
i.e. the cost of the discount is allocated to the channel members in proportion to their margins before the
sales promotion. We will call this a proportional discount sharing arrangement. The proof that such an
arrangement leads both parties simultaneously to the channel optimum is given below.
From Equ (13) we have:
Πm= -β(dm+dr)(s-c-dm)-Bdm-FSm (25).
Using Equ (22), and defining a new parameter τ, according to:
τ =(1+t) (26),
we have:
Πm = -βτdm (s-c- dm) - Bdm - FSm (27).
31
Setting δΠm/δdm = 0 and solving for dm , gives:
dm* = B/(2βτ) + (s-c)/2 (28).
Using Equ (22) and Equ (26), we have:
dr = (τ - 1) [B/(2βτ) + (s-c)/2] (29).
Therefore:
(dm* + dr ) = B/(2) + τ (s-c)/2 (30).
Now if we set t= (p-s)/(s-c), which implies τ = (p-c)/(s-c),
(dm* + dr ) = B/(2β) + (p-c)/2 (31).
Observe that the right hand side of Equ (31) is identical to the expression for the optimal consumer
discount, as given by Equ (6). So, in a proportional discount sharing arrangement, the manufacturer will
strive for a value of his discount which guarantees that the channel optimum is reached. In this case we
have taken the perspective of the manufacturer, but starting with the retailer would have produced the
symmetric result.
There is another way to show that a proportional discount sharing arrangement makes the interests of
manufacturer and retailer parallel. Equ (12) is the expression for the optimal consumer discount from the
perspective of the retailer, whereas Equ (15) gives the optimal consumer discount from the perspective of
the manufacturer. This implies that:
dc*(ret) = dc
*(man) (32),
if
(p-s)/(2*rsd) = (s-c)/(2*(1-rsd)) (34),
or if
rsd = (p-s)/(p-c) (35).
The numerator of Equ (35) is equal to the retailer’s margin before the discount. The denominator is the
channel margin before the discount. Thus, Equ (35) says that the optimal value of consumer discount of
32
the retailer coincides with the optimal value of the consumer discount of the manufacturer in the case of a
proportional discount sharing arrangement. We have just seen that this optimal value for retailer and
manufacturer also coincides with optimal value for the channel.
So, we can now formulate the following theorem.
Theorem of Proportional Discount Sharing (PDS):
For a linear price function, the optimal price discount for the retailer is equal to the optimal price
discount for the manufacturer, if the costs of the discount are shared among retailer and manufacturer in
the same proportion as the margin before the price discount. This price discount is equal to the optimal
price discount for the channel
Example
We can demonstrate the effect of rsd on the optimum for the retailer and the manufacturer for Case S. If
the sharing of the costs of the discount occurs proportionally to the shares in the (original) margin, we
have, according to Equ(35):
rsd =(2.19-1.32)/(2.19-0.92)=0.69.
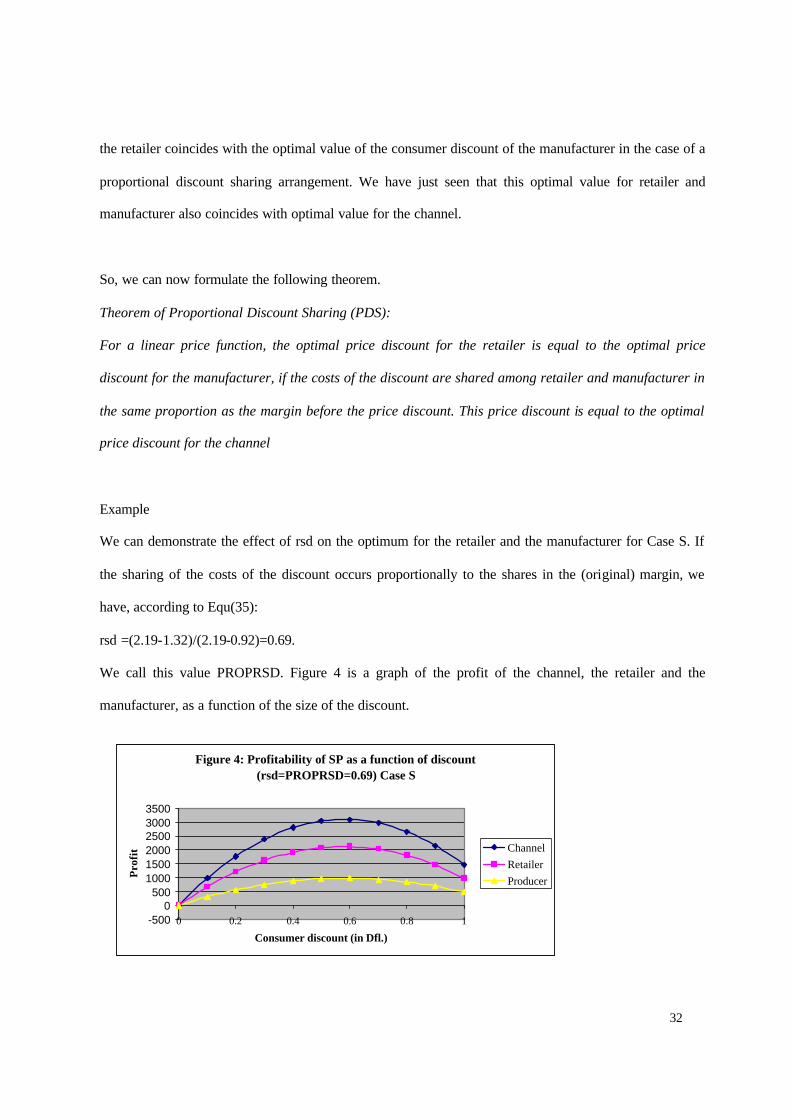
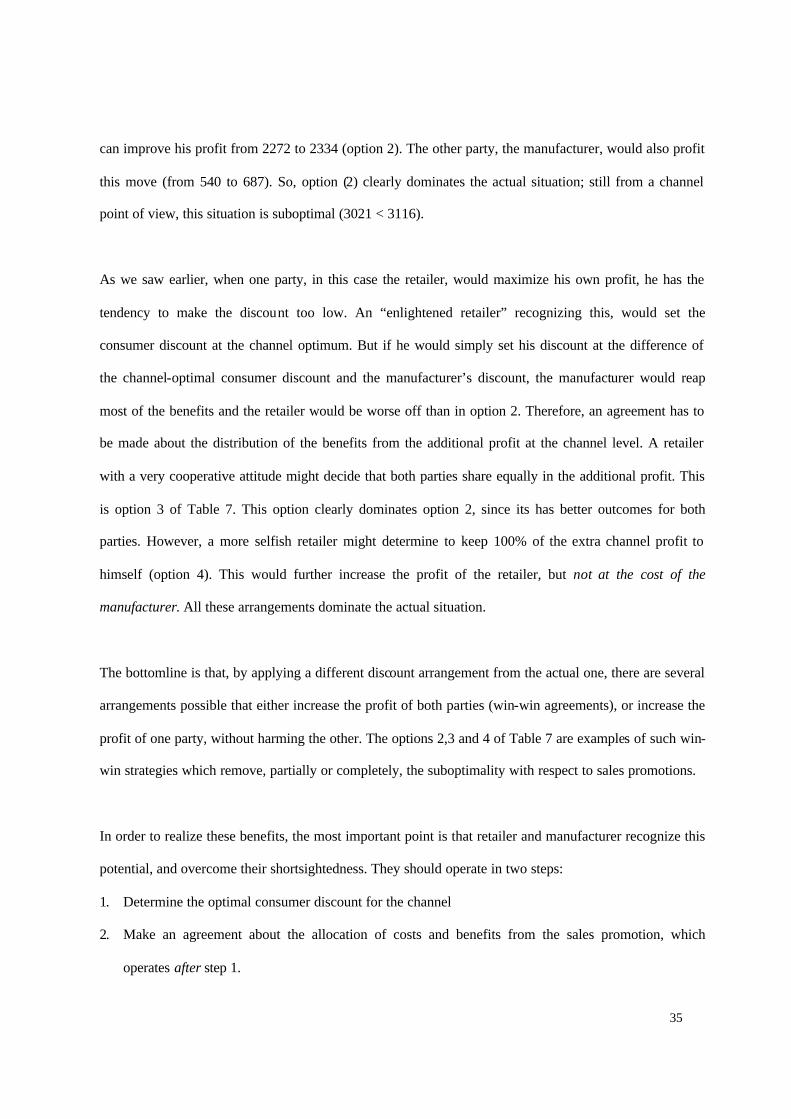
We call this value PROPRSD. Figure 4 is a graph of the profit of the channel, the retailer and the
manufacturer, as a function of the size of the discount.
Figure 4: Profitability of SP as a function of discount (rsd=PROPRSD=0.69) Case S
-5000
500100015002000250030003500
0 0.2 0.4 0.6 0.8 1
Consumer discount (in Dfl.)
Pro
fit Channel
RetailerProducer
33
In Figure 4, the profit curve of the retailer, the profit curve of the manufacturer and profit curve for the
channel have a peak at a discount of 58 cent.
Comparison of Figure 4 with Figure 1 shows how the proportional discount sharing causes the three
maximums to coincide. So, such an agreement is an effective way to make the interests of the retailer and
the manufacturer parallel and, at the same time, get the most out of the channel.
For our dataset it can easily be illustrated how a PDS arrangement makes the interest of retailers and
manufacturs parallel. For this purpose, we calculate what the correlation coefficient between the retailer’s
profit and the manufacturer’s profit for the actual sales promotions in our case base would have been
under PDS (assuming that the size of the consumer discount remains the same). This correlation
coefficient is + 0.68, which compares very favorably to the actual value of -. 0.55, mentioned earlier.
This demonstrates how effective the PDS arrangement is in making the interests of the retailer and the
manufacturer parallel. Such an arrangement is easy to administer. Of the basic numbers that are needed
for its execution, two items are known to both parties anyway: the regular consumer price (p) end the
regular selling price of the manufacturer to the retailer (s). The third item needed, the cost price of the
manufacturer (c), is a piece of information that should not be too difficult to share in a cooperative ECR-
relationship. In principle, if a proportional discount arrangement is in force, it is not so important who of
the two parties actually determines the size of the consumer discount. After all, it will automatically also
serve the best interest of the other party. The best way would be to assign this task to the party who has
the best knowledge of the consumer discount response curve.
6 Other Win-Win Arrangements
A proportional discount arrangement is an attractive method of cooperation for retailer and manufacturer
who jointly want to realize the best possible sales promotion results from their market. However,
sometimes it may not be in the best interest of one of the individual parties to enter into such an
34
agreement. This, for example, could be the case, if one party, by virtue of its market power, can enforce to
pay a smaller share of the discount than the discount according to the proportional discount rule. For
example, in Case S the retailer actually paid only 50% (20 cents) of the discount. According to the
proportional discount rule, the retailer would have paid 69%.6 In this situation the retailer might not have
an incentive to switch to the proportional discount rule, even if this would lead to a channel-optimal
discount. Suppose that for Case S the retailer is the stronger party and that he can in fact determine the
consumer discount price. In this situation we can think of several options that the retailer has. The profit
implications of some of these options, for himself and also for the manufacturer and the channel as a
whole, are given in Table 7.
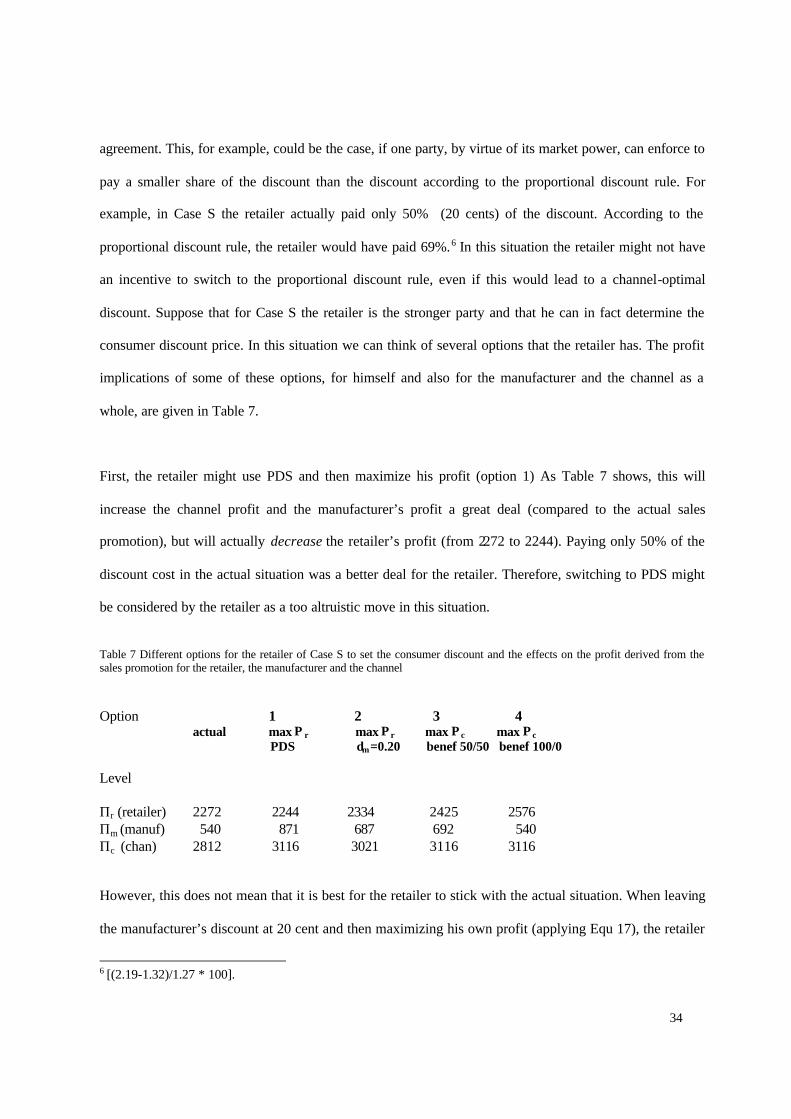
First, the retailer might use PDS and then maximize his profit (option 1) As Table 7 shows, this will
increase the channel profit and the manufacturer’s profit a great deal (compared to the actual sales
promotion), but will actually decrease the retailer’s profit (from 2272 to 2244). Paying only 50% of the
discount cost in the actual situation was a better deal for the retailer. Therefore, switching to PDS might
be considered by the retailer as a too altruistic move in this situation.
Table 7 Different options for the retailer of Case S to set the consumer discount and the effects on the profit derived from the sales promotion for the retailer, the manufacturer and the channel Option 1 2 3 4 actual max Πr max Πr max Πc max Πc
PDS dm=0.20 benef 50/50 benef 100/0
Level Πr (retailer) 2272 2244 2334 2425 2576 Πm (manuf) 540 871 687 692 540 Πc (chan) 2812 3116 3021 3116 3116 However, this does not mean that it is best for the retailer to stick with the actual situation. When leaving
the manufacturer’s discount at 20 cent and then maximizing his own profit (applying Equ 17), the retailer
6 [(2.19-1.32)/1.27 * 100].
35
can improve his profit from 2272 to 2334 (option 2). The other party, the manufacturer, would also profit
this move (from 540 to 687). So, option (2) clearly dominates the actual situation; still from a channel
point of view, this situation is suboptimal (3021 < 3116).
As we saw earlier, when one party, in this case the retailer, would maximize his own profit, he has the
tendency to make the discount too low. An “enlightened retailer” recognizing this, would set the
consumer discount at the channel optimum. But if he would simply set his discount at the difference of
the channel-optimal consumer discount and the manufacturer’s discount, the manufacturer would reap
most of the benefits and the retailer would be worse off than in option 2. Therefore, an agreement has to
be made about the distribution of the benefits from the additional profit at the channel level. A retailer
with a very cooperative attitude might decide that both parties share equally in the additional profit. This
is option 3 of Table 7. This option clearly dominates option 2, since its has better outcomes for both
parties. However, a more selfish retailer might determine to keep 100% of the extra channel profit to
himself (option 4). This would further increase the profit of the retailer, but not at the cost of the
manufacturer. All these arrangements dominate the actual situation.
The bottomline is that, by applying a different discount arrangement from the actual one, there are several
arrangements possible that either increase the profit of both parties (win-win agreements), or increase the
profit of one party, without harming the other. The options 2,3 and 4 of Table 7 are examples of such win-
win strategies which remove, partially or completely, the suboptimality with respect to sales promotions.
In order to realize these benefits, the most important point is that retailer and manufacturer recognize this
potential, and overcome their shortsightedness. They should operate in two steps:
1. Determine the optimal consumer discount for the channel
2. Make an agreement about the allocation of costs and benefits from the sales promotion, which
operates after step 1.
36
It is essential that step 2 is separated from step 1. The mechanisms for sharing costs and/or benefits that
are currently in use do not make this separation and, as we have seen, lead the channel partners to
suboptimal decisions. If each party follows its own (myopic) interest, suboptimality is inevitable.
However, reaching the channel optimum has to be made attractive for both parties. This should be done
by means of an agreement that regulates how costs and benefits will be allocated. The most efficient way
is to do this through the height of the selling price from the manufacturer to the retailer during the sales
promotion. When setting this selling price in agreement with a proportional discount arrangement, we
combine the advantages of a procedure that is administratively efficient and induces both parties to strive
for the channel optimum. In other cases (e.g. the other win-win arrangements just discussed) separate
money transfers between parties may be necessary. When so-called “scan-back” arrangement are in force
(Drèze and Bell 2001), i.e. where manufacturer and retailer settle the results of a sales promotion on the
basis of actual sales figures from scanner data, care has to be taken that conditions of such a scan-back
arrangement do not distract parties from striving for the channel optimum.
7 Conclusions, Implications, and Further Research
The subject of this paper is price discount sales promotions in FMCG. First, we have shown that from the
point of view of (economic) theory, it is not to be expected that manufacturers and retailers strive for the
same size of the consumer discount, nor that either one of these parties would strive for the channel-
optimal consumer discount. In general, opposite interests between manufacturers and retailers exist,
which makes it very unlikely that the result of their (independent) decisions will lead to the price discount
that maximizes the channel profit from a sales promotion. So, there is a high likelihood that the two
parties leave money on the table. Another important result from the theoretical analysis is that, if each
party maximizes its own profit without looking at the interest of the channel, there is a systematic bias in
the size of the consumer discount, usually resulting in a consumer price discount that is too low.
37
In our empirical analysis over more than eighty real life promotions, we found that these sales promotions
as currently implemented, have a modest profitability, and that the channel profit on all sales promotions
together could have been almost four times higher. So the expectation from the theoretical analysis of
suboptimality is confirmed. This is also true for the expectation of opposite interests of the manufacturer
and the retailer, which is clearly manifest in the data. Finally, as theoretically expected, in the actual sale
promotions there is a negative bias in the size of the consumer discount, i.e. the discount are, on average,
not deep enough.
Subsequently, we looked for arrangements between manufacturers and retailers that can remove
suboptimality and lead to sales promotion arrangements that are more profitable for both parties (“win-
win arrangements”) than the current sales promotions. We found that a proportional discount sharing
arrangement, i.e. an arrangement where the cost of the discount are shared by manufacturer and retailer in
proportion to their original margin, automatically steers the interests of the manufacturer and the retailer
in the same direction as far as the size of the consumer discount is concerned. This jointly optimal
consumer discount is also the channel-optimal discount. Therefore, the PDS arrangement, is an
interesting way of preventing suboptimality. We have also shown that various win-win arrangements are
possible that constitute significant improvements compared to the actual outcomes for both parties.
From an academic point of view these results are important since they add to our insight of the
mechanisms that determine the size of consumer price discounts, and their profit implications for both
retailer and manufacturer. The results are also relevant for practice. It is important that retailers and
manufacturers are aware of the mechanisms observed in this paper. If through independent partial
optimization by both parties, the resulting discount is not optimal at the channel level, both parties
together stand to loose. Especially within the framework of a long-term relationship between retailer and
manufacturer, it should be possible to find more satisfactory arrangements. An attractive possibility is to
use the proportional discount sharing arrangement. Such an arrangement can be implemented and
38
managed very easily. Especially if parties have to decide on many sales promotions, possibly in different
product categories, over an extended period of time, this may be a very practical way of operating.
However, even if parties would not be willing to engage in such an arrangement, as we have shown, there
are win-win arrangements possible that clearly dominate the current way of “each party for itself”.
Making this type of arrangement is in the spirit of the ECR movement of better results through
cooperation in the channel, and also in agreement with the ideas about working partnerships between
distributors and manufacturers (Anderson and Narus 1990).
Limitations and further research
The theoretical results of this paper were derived using a linear discount-price demand function. Although
this may be a reasonable approximation in many situations (an indication for this is the confirmation of
the theoretical expectations in our database), it is worthwhile to explore the implications of non-linear
demand curves. Whatever the specific form of the discount -price demand curve, the phenomenon that the
action of one party (applying a specific price discount and in this way creating additional consumer sales)
affects the revenue of the other party, remains the same. This is the very root of the suboptimality
problem, caused by the myopic behavior of the parties. Moreover, both parties are affected in the same
way by the shape of the discount-price demand curve, since for both parties the extra sales from a price
discount is determined by the (local) derivative of this curve. Therefore, in the case of non-linear demand
curves, the situation is not different in principle. But the actual magnitude of the consequences of
suboptimality for each party (and also the gains and losses they will derive from particular sales
promotion arrangements) will depend on the precise form of the discount-price response function. If
retailers and manufacturers want to arrive at the best discount policy in a given situation (possibly using
the multi-party decision support tools, to be referred to shortly), they should apply the best knowledge
about the demand response function that is available for that situation. The recent advances with respect
to estimation techniques ( Van Heerde et.al. 2001) are very important here. The decision support tools
should be able to accommodate all kinds of discount-price demand curves (parametric as well as non-
39
parametric). An interesting extension of the present work would be to compute the precise effects of
different specific demand curves on the magnitude of the suboptimality and the gains and losses from
particular sales promotion arrangements.
In this paper we have abstracted from phenomena such as forward buying and cannibalization. Through
forward buying, a retailer can realize an additional profit, because he sells a part of the goods that he has
purchased at a discount price from the manufacturer, at the regular price to the consumer. In an overall
consideration of a particular sales promotion arrangement, the retailer should weigh the additional profits
from forward buying. Another issue is cannibalization. The additional sales (and profit) from the product
under discount may replace the sales of other products, on which the supplier would have earned a profit
too. This phenomenon is particularly important for the retailer, who typically offers many different
products in the same category. The effects of forward buying and cannibalization should be superimposed
on the effects of consumer price discounts as analyzed in this paper. It would be interesting, as a follow-
up study, to examine how different schemes of forward buying and cannibalization affect the magnitude
of suboptimality and the outcomes of specific sales promotion arrangements. Preferably, this should be
done both analytically and empirically, as we did in the present paper. Of course, if the relevant
information is available, these effects should also be incorporated in the decision support tools that
retailers and manufacturers use to determine their price discounts.
As we have seen, to arrive at more profitable sales promotions, it is necessary that retailers and
manufacturers enter into agreements about how to partition the burdens and benefits of sales promotions.
The approach in the present paper is purely economical. However, in agreements about sales promotions
also more behavioral variables such as trust and commitment between channel partners play a role
(Geyskens, Steenkamp and Kumar 1998). Therefore, the present research should be extended by taking
these variables into account, and see to what extent relationship quality variables (also including variables
such as cooperation and conflict) have an effect on the actual conditions agreed upon in sales promotion
40
arrangements. For sure, also the relative power of each party (Kadiyali, Chintagunta and Vilcassim 2000)
is an important explanatory variable here. Therefore, an interesting research avenue is to study how sales
promotion arrangements between manufacturers and retailers actually come about, and the role of the
relationship quality variables, just mentioned, in this process. Interesting questions are: what are the
conditions agreed upon in these arrangements (e.g. in terms of price cuts, duration, agreements about
features costs, range of products covered, etc), what are their antecedents (i.e. under what conditions do
we see which type of arrangement) and what are their consequences in terms (profitability, relative gains
of each party)? This will produce insight, which is important for realizing the type of win-win
arrangements as discussed in this paper. We have found that (myopic) economic stimuli have the effect of
moving parties away from the (channel) optimum. Some form of agreement or cooperation is needed to
overcome this, and the potential for such agreements depends heavily on the psychological climate (trust,
commitment, etc) between parties.
Finally, it seems important to provide retailers and manufacturers with tools for supporting their decisions
with respect to price discounts. Parties should have access to models for computing the effects of
alternative price discounts. They should also be able to compute the effects of different profit and cost
sharing arrangements, for both the retailer and the manufacturer. The results of such simulations might
help the retailer and the manufacturer to decide (if possible, jointly) on a consumer price discount
arrangement in a particular situation. This would entail an extension of sales promotion support tools for
one party, such as the manufacturers’ sales promotion calendar tool of Silva-Risso et.al. (1999), to multi-
party tools. The availability of a decision support system to help retailers and manufacturers to (jointly)
determine the optimal consumer price discount would fill an obvious need.
References 1. Achenbaum A.A. and K.F. Mitchel. 1987. “Pulling Awayfrom Push Marketing,” Harvard Business
Review, (May-June), 38-40
41
2. Ailawadi, K.L. 2001. “The Retail Power-Performance Conundrum: What have we Learned?”, Journal of Retailing, forthcoming.
3. Anderson, J.C. and J.A. Narus. 1990. “A Model of Distributor Firm and Manufacturer Firm Working
Partnerships,” Journal of Marketing , Vol 54, January, 42-58. 4. Armstrong, M.K. 1991. “Retail Response to Sales Promotions: an Incremental Analysis of Forward
Buying and retail Promotion.” Unpublished PhD dissertation, University of Texas at Dallas. 5. Blattberg, R.C., R. Briesch and E.J. Fox. 1995. “How Promotions Work,” Marketing Science , 14, no
3, part 2 of 2, g 122-132. 6. Blattberg, R.C. and S.A. Neslin. 1990. Sales Promotions, Concepts, Methods and Strategies.
Englewoodn Cliffs, N.J. : Prentice Hall. 7. Bolton, R.N. 1989. “The Robustness of Retail-Level Price Elasticity Estimates.” Journal of Retailing,
Vol 65, no 2, 193-219. 8. Brodie, R. and C.A. De Kluyver. 1984. “Attraction versus Linear and Multiplicative Market Share
Models.” Journal of Marketing Research, Vol 21, no 2, 194-201. 9. Bucklin, R.E. 1987. “Pass-through of Manufacturer Trade Promotions by Grocery Retailers.”
Working Paper, Stanford University, Oct 1987. 10. Chevalier, M. and R.C. Curhan. 1976. “Retail Promotions as a Function of Trade Promotions: a
Descriptive Analysis.” Sloan Management Review, 18 (3), 19-32. 11. Choi, S.C. 1991. “Price Competition in a Channel Structure with a Common Retailer.” Marketing
Science, 10, (Spring), 271-296. 12. Coughlan, A.T. 1985. “Competition and Cooperation in Marketing Channel Choice: Theory and
Application.” Marketing Science , 4, (Spring), 110-129. 13. Dekimpe, M.G and D.M. Hanssens. 1999. “Sustained Spending and Persistent Response: A New
Look al Long-Term Marketing Profitability.” Journal of Marketing Research, 36, (November) , 397-412.
14. Drèze, X. and D.R. Bell. 2001. “Creating Win-Win Trade Promotions: Theory and Empirical
Analysis of Scan-back Trade Deals. Working Paper, The Wharton School, University of Pennsylvania, Philadelphia
15. Farris, P. and K. L. Ailawadi. 1992. “Retail Power: Monster or Mouse?”, Journal of Retailing, Vol
68, No 4, 351-369. 16. Gerstner, E. and J.D. Hess. 1995. “Pull Promotion and Channel Coordination,” Marketing Science ,
Vol 14, no 1 (Winter), 43-60. 17. Geyskens, I., J.B.E.M. Steenkamp and N. Kumar. 1998. “Generalizations about trust in marketing
channel relationships using meta-analysis,” International Journal of Research in Marketing, Vol 15, 223-248.
42
18. Gupta, S. and L.G. Cooper. 1992. “The Discounting of Discounts and Promotion Thresholds”, Journal of Consumer Research , Vol 19 (December), 401-411.
19. Jeuland, A.P. and S. M. Shugan. 1983. “Managing Channel Profits”, Marketing Science, Vol 2, no 3
(Summer), 239-272. 20. Kadyaly, V. , P. Chintagunta, and N. Vilcassim. 2000. “Manufacturer-Retailer Channel Interactions
and Implications for Channel Power: An Empirical Investigation of Pricing in a Local Market,” Marketing Science, Vol 19, Spring, 127-148.
21. Kalyanam, K. and T.S. Shively. 1998. “Estimating Irregular Price Effects: A Stochastic Spline
Regression Approach,” Journal of Marketing, Vol 35, (Febr), 16-29. 22. McGuire, T.W. and R. Staelin. 1983. “An Industry Equilibrium Analysis of Downstream Vertical
Integration.” Marketing Science , 2 (Spring), 161-191. 23. Messinger, P.R. and Y. Chen. 2001. “Who Leads the Channel: Manufacturer or Retailer?” Working
Paper University of Alberta, Edmonton (Can). 24. Moorthy, K.S. 1987. “Strategic Decentralization in Channels.” Marketing Science, 7, (Fall), 335-355. 25. Murry, J.P. and J.B. Heide. 1998. “Managing Promotion Program Participation Within Manufacturer-
Retailer Relationships,” Journal of Marketing, Vol 62, (January), 58-68. 26. Nijs, V., M. Dekimpe, J.B.E.M. Steenkamp, and D. Hanssens. 2001. “The Category Demand Effects
of Price Promotions,” Marketing Science , Vol 20, no 1, 1-22. 27. Sayman, S. , S. J. Hoch and J.S. Raju. 2001. Positioning of Store Brands. Working Paper Koç
University , Istanbul. 28. Silva-Russo, J.M., R.E. Bucklin, and D.G. Morrison. 1999. “A Decision Support Systems for
Planning Manufacturers’ Sales Promotion Calendars,” Marketing Science , Vol 18, no 3, 274-300. 29. Srinivasan, S., K.Pauwels, D.M. Hanssens and M. Dekimpe. 2001. “Do promotions benefit
manufacturers, retailers or both?”, Working paper Graduate School of Management, Univ. of California, Riverside.
30. Verstappen, C.D.G., A.G.A.L. van der Vorst and B. Wierenga. 1998. “Cost, Revenues and Profits of
Sales Promotion Activities in a Grocery Channel.” Management Report 1998-12, Rotterdam School of Management, Erasmus University Rotterdam.
31. Van Heerde, H. J. 1999. Models for Sales Promotion Effects Based on Store-Level Scanner Data..
Dissertation, University of Groningen, the Netherlands. 32. Van Heerde, H.J, P.S.H. Leeflang and D.R. Wittink. 2001. “Semiparametric Analysis to Estimate the
Deal Effect Curve,” Journal of Marketing Research, Vol 38, May, 197-215. 33. Wittink, D. R., M.J. Addona, W.J.Hawkes and J.C. Porter. 1988. “The Estimation, Validation, and
Use of Promotional Effects Based on Scanner Data.” Working Paper, Johnson Graduate School of Management, Cornell University, Itaca (N.Y)
Publications in the Report Series Research� in Management ERIM Research Program: “Marketing” 2002 Suboptimality of Sales Promotions and Improvement through Channel Coordination Berend Wierenga & Han Soethoudt ERS-2002-10-MKT 2001 Predicting Customer Potential Value. An application in the insurance industry Peter C. Verhoef & Bas Donkers ERS-2001-01-MKT Modeling Potenitally Time-Varying Effects of Promotions on Sales Philip Hans Franses, Richard Paap & Philip A. Sijthoff ERS-2001-05-MKT Modeling Consideration Sets and Brand Choice Using Artificial Neural Networks Björn Vroomen, Philip Hans Franses & Erjen van Nierop ERS-2001-10-MKT Firm Size and Export Intensity: A Transaction Costs and Resource-Based Perspective Ernst Verwaal & Bas Donkers ERS-2001-12-MKT Customs-Related Transaction Costs, Firm Size and International Trade Intensity Ernst Verwaal & Bas Donkers ERS-2001-13-MKT The Effectiveness of Different Mechanisms for Integrating Marketing and R & D Mark A.A.M. Leenders & Berend Wierenga ERS-2001-20-MKT Intra-Firm Adoption Decisions: Departmental Adoption of the Common European Currency Yvonne M. van Everdingen & Berend Wierenga ERS-2001-21-MKT Econometric Analysis of the Market Share Attraction Model Dennis Fok, Philip Hans Franses & Richard Paap ERS-2001-25-MKT Buying High Tech Products: An Embeddedness Perspective Stefan Wuyts, Stefan Stremersch & Philip Hans Franses ERS-2001-27-MKT Changing Perceptions and Changing Behavior in Customer Relationships Peter C. Verhoef, Philip Hans Franses & Bas Donkers ERS-2001-31-MKT � A complete overview of the ERIM Report Series Research in Management:
http://www.ers.erim.eur.nl ERIM Research Programs: LIS Business Processes, Logistics and Information Systems ORG Organizing for Performance MKT Marketing F&A Finance and Accounting STR Strategy and Entrepreneurship
How and Why Decision Models Influence Marketing Resource Allocations Gary L. Lilien, Arvind Rangaswamy, Katrin Starke & Gerrit H. van Bruggen ERS-2001-33-MKT An Equilibrium-Correction Model for Dynamic Network Data David Dekker, Philip Hans Franses & David Krackhardt ERS-2001-39-MKT Aggegration Methods in International Comparisons: What Have We Learned? Bert M. Balk ERS-2001-41-MKT The Impact of Channel Function Performance on Buyer-Seller Relationships in Marketing Channels Gerrit H. van Bruggen, Manish Kacker & Chantal Nieuwlaat ERS-2001-44-MKT Incorporating Responsiveness to Marketing Efforts when Modeling Brand Choice Dennis Fok, Philip Hans Franses & Richard Paap ERS-2001-47-MKT Competitiveness of Family Businesses: Distinghuising Family Orientation and Business Orientation Mark A.A.M. Leenders & Eric Waarts ERS-2001-50-MKT The Effectiveness of Advertising Matching Purchase Motivation: An Experimental Test ERS-2001-65-MKT Joost Loef, Gerrit Antonides & W. Fred van Raaij Using Selective Sampling for Binary Choice Models to Reduce Survey Costs ERS-2001-67-MKT Bas Donkers, Philip Hans Franses & Peter Verhoef Deriving Target Selction Rules from Edogenously Selected Samples ERS-2001-68-MKT Bas Donkers, Jedid-Jah Jonker, Philip Hans Franses & Richard Paap 2000 Impact of the Employee Communication and Perceived External Prestige on Organizational Identification Ale Smidts, Cees B.M. van Riel & Ad Th.H. Pruyn ERS-2000-01-MKT Forecasting Market Shares from Models for Sales Dennis Fok & Philip Hans Franses ERS-2000-03-MKT The Effect of Relational Constructs on Relationship Performance: Does Duration Matter? Peter C. Verhoef, Philip Hans Franses & Janny C. Hoekstra ERS-2000-08-MKT Informants in Organizational Marketing Research: How Many, Who, and How to Aggregate Response? Gerrit H. van Bruggen, Gary L. Lilien & Manish Kacker ERS-2000-32-MKT The Powerful Triangle of Marketing Data, Managerial Judgment, and Marketing Management Support Systems Gerrit H. van Bruggen, Ale Smidts & Berend Wierenga ERS-2000-33-MKT
ii
Consumer Perception and Evaluation of Waiting Time: A Field Experiment Gerrit Antonides, Peter C. Verhoef & Marcel van Aalst ERS-2000-35-MKT Broker Positions in Task-Specific Knowledge Networks: Effects on Perceived Performance and Role Stressors in an Account Management System David Dekker, Frans Stokman & Philip Hans Franses ERS-2000-37-MKT Modeling Unobserved Consideration Sets for Household Panel Data Erjen van Nierop, Richard Paap, Bart Bronnenberg, Philip Hans Franses & Michel Wedel ERS-2000-42-MKT A Managerial Perspective on the Logic of Increasing Returns Erik den Hartigh, Fred Langerak & Harry Commandeur ERS-2000-48-MKT The Mediating Effect of NPD-Activities and NPD-Performance on the Relationship between Market Orientation and Organizational Performance Fred Langerak, Erik Jan Hultink & Henry S.J. Robben ERS-2000-50-MKT Sensemaking from actions: Deriving organization members’ means and ends from their day-to-day behavior Johan van Rekom, Cees B.M. van Riel & Berend Wierenga ERS-2000-52-MKT
iii