Embed Size (px)
Citation preview
Synthesis and Characterization of Homo and Amphiphilic
Block Copolymers of Poly(2-vinylpyridine) Stabilized
Metallic Nanoparticles
Submitted by
Sana Rahim
Dissertation for the Partial Fulfilment of the Degree of
Doctor of Philosophy
H. E. J. Research Institute of Chemistry,
International Center for Chemical and Biological Sciences,
University of Karachi, Karachi-75270, Pakistan.
2018
ii
CERTIFICATE
To Whom It May Concern
It is certified that the thesis entitled, ―Synthesis and Characterization of Homo and
Amphiphilic Block Copolymers of Poly(2-vinylpyridine) Stabilized Metallic Nanoparticles”,
submitted to the Board of Advance Studies and Research, University of Karachi, by Ms. Sana
Rahim, satisfies the requirements for the Ph.D. degree in Chemistry.
Dr. Muhammad Imran Malik
Supervisor
H. E. J. Research Institute of Chemistry,
International Center for Chemical and Biological Sciences,
University of Karachi, Karachi, Pakistan
Dr. Muhammad Raza Shah (T.I.)
Co-supervisor
H. E. J. Research Institute of Chemistry,
International Center for Chemical and Biological Sciences,
University of Karachi, Karachi, Pakistan

iii
DEDICATION
Dedicated to My Beloved Parents,
Mr. Rahim Gul
&
Mrs. Madiha
iv
ABSTRACT
This Ph. D. dissertation deals with the synthesis of metallic nanoparticles with P2VP homo-
and block copolymers (BCP) as stabilizing agent, their characterization, and applications. As
a summary of the research conducted during the course of Ph. D., a series of homopolymers
of poly(2-vinylpyridine) and amphiphilic block copolymers of poly(2-vinylpyridine),
including poly(2-vinylpyridine)-block-poly(methyl methacrylate) and polystyrene-block-
poly(2-vinylpyridine) were used to stabilize metallic nanoparticles (gold and silver).
Polymers containing pyridine moiety have been utilized as a stabilizing agent for the
metallic nanoparticles. Among them poly(2-vinylpyridine) (P2VP) is the excellent
candidates because nitrogen atoms of the pyridine moiety have a strong affinity for the
metal ions and metallic nanoparticles that restrains the aggregation of the metal
nanoparticles through steric stabilization. Furthermore, P2VP prompts the reaction at
ambient temperature and reduction of the particle size with the increase in its molar mass.
AuNPs stabilized by P2VP ligands were designed to offer atomic level control and an
efficient scale-up production through control of the molar mass of P2VP. Molar mass of
the P2VP has enormous effect on the stabilization, size and size distribution of AuNPs.
The reducing activity of P2VP increased with the increase in its molar mass. The P2VP
stabilized AuNPs are evaluated for their stability and applications using UV-visible
spectrophotometry, FTIR, DLS and AFM. Moreover, the drug encapsulation efficiency of
P2VP-stablized AuNPs increased with the molar mass of P2VP.
P(S-VP)-AgNPs were used as nanosensor for the rapid quantitative assay of pesticide,
cartap. P(S-VP)-AgNPs and its interaction with cartap was studied using UV-visible
spectroscopy, FTIR, zetasizer and AFM. The synthesized nanosensor is selective towards
cartap in the presence of other interfering pesticides in real samples. The LoD of the
nanosensor for cartap is far below already reported sensors for cartap.
Furthermore, P(2VP-MMA)-AuNPs modified GCE electrode was used as a novel
electrochemical sensor for nicotine. It was found that sensitivity of bare GCE is
v
significantly enhanced by coating with P(2VP-MMA)-AuNPs. The P(2VP-MMA)-
AuNPs modified GCE is more sensitive towards nicotine and gave more intense
electrochemical response with reference to bare GCE.
In addition, the morphology of P(2VP-MMA) copolymer thin films was studied using
AFM. It was observed that both P2VP and PMMA block lengths, total molar mass of
block copolymer, solvent used for casting, and substrate play an important role in the
morphology of block copolymer thin film. Gold nanoparticles incorporated with the
polymer are completely shielded by P2VP chains and influenced the morphology of
block copolymer organization by enlarging the polymer domain. Furthermore, surface
roughness and thickness increased with the increase in molar mass of the block
copolymers.
vi
KHULASA
vii

viii
ACKNOWLEDGEMENTS
I am gratified to Almighty Allah who endowments me the power and courage to fulfil all
my tasks. Primarily, I am thankful to the H.E.J. Research Institute of Chemistry
(I.C.C.B.S), University of Karachi, for providing all the research facilities, infrastructure
and also the financial support for the successful completion of the current dissertation. I
pay to thanks its great pillars Prof. Dr. Atta ur Rahman (FRS, N.I., H.I., S.I., T.I.), and
Prof. Muhammad Iqbal Choudhary (H.I., S.I., T.I.), who are keen to improve its
standards, and their breathtaking leadership to make it one of the finest academic
establishments in the developing world.
It is indeed the greatest pleasure to extend my gratitude to my supervisor, Dr. Muhammad
Imran Malik and co-supervisor Prof. Dr. Muhammad Raza Shah (T.I.), for their
cooperation, reinforcement and advices. They become a source of inspiration and role
model for me to accomplish this task and to achieve my goals.
I would like to extend my thanks to all the collaborating groups; Dr. Muhammad Iqbal
Bhanger and Dr. Asma Rauf for their precious attention and providing a facility of cyclic
voltammetry and other lab staff.
All my research became possible due to the friendly environment and positive attitude of
my lab fellows, Muhammad Khurram Tufail, Rubina Abdul Karim, Adnan Murad,
Tehsin Ahmed, Sidra Safdar Durrani, Ayaz Anwar, Kiramat, Farid Ahmed, Dania
Ahmed, Sadia, Faiza, Zara Aslam, Shama Noureen, Imkaan and Imdad. I also very
thanks to my other friends Rabia Aslam, Saira Yasmeen, Ruqaiya Khalil for support,
kindness and most memorable moments. I am thankful to Mr. Hussain our lab assistant
for his help.
I have no words to express my appreciations for my beloved parents for their great
contribution in my life. I heartedly grateful for their cooperation, support and prayers. I
am also acknowledge my all siblings by my heart for their financial and moral support.
Sana Rahim,
Karachi, 2018

ix
CURRICULUM VITAE
I was born in Gujranwala (Punjab) Pakistan on 6th of March
1985, belonging to a middle class family. I started my formal
education career in Peshawar. My first year of education was too
much hard because I joined the school from class 2, without
going from the preprimary section and totally unfamiliar how to
write, read and learn the things in a class like other children did.
My teachers scolded and beated me every time on my mistakes,
therefore, I felt the embarrassment in front of other students and was afraid from the
name of teacher. I was little but decided to work hard and became like other children. I
made efforts and unimaginably after four to five months I was able to write, read and
learn all the stuff taught in the class. I think, it was the moment when I learnt how to
become a successful person in life.
After two years, my father was posted to Karachi, so I continued my further education
here in Karachi and passed the Matric examination from nearby school named, Shaheen
High School in 2000. I joined Khursheed Government Girls College for F. Sc. (Pre
medical) in 2001 and did B.Sc. from B.A.M.M P.E.C.H.S Government College For
Women in 2003. At that point, I discontinued my studies because of some family issues
but after 2 years, I got a degree of B.Ed. from Jamia Millia College Malir in 2008 and
then passed the M.Sc. (Analytical Chemistry) from University of Karachi, in 2010.
During M.Sc. in summer vacations, I had an opportunity of internship in Associated
Industries Limited, Nowshera, Pakistan and also after M.Sc. did internship in
multinational company Clariant Pakistan Limited, currently named as Archroma Pakistan
Limited.
Where I realized the importance of Ph.D. but unfortunately for two years I did not get the
chance to enroll.
In July 2013, I joined the polymer chemistry department of H.E.J. Research Institute of
Chemistry, International Center for Chemical and Biological Sciences, University of

x
Karachi, for Ph.D. studies under the supervision of Dr. Muhammad Imran Maik and co-
supervision of Dr. Muhammad Raza Shah. My research mainly devoted to the application
of polymer based metallic nanoparticles as a nanosensor and morphological studies of
polymer thin films using AFM. During my Ph.D. research, I have attended many
conferences and workshops and presented scientific findings as posters. I will always
remember my stay at this institute. It has been an extraordinary life so far. My hobbies
are reading books (historical books and scientific literatures) making drawing, watching
movies and listening music.
xi
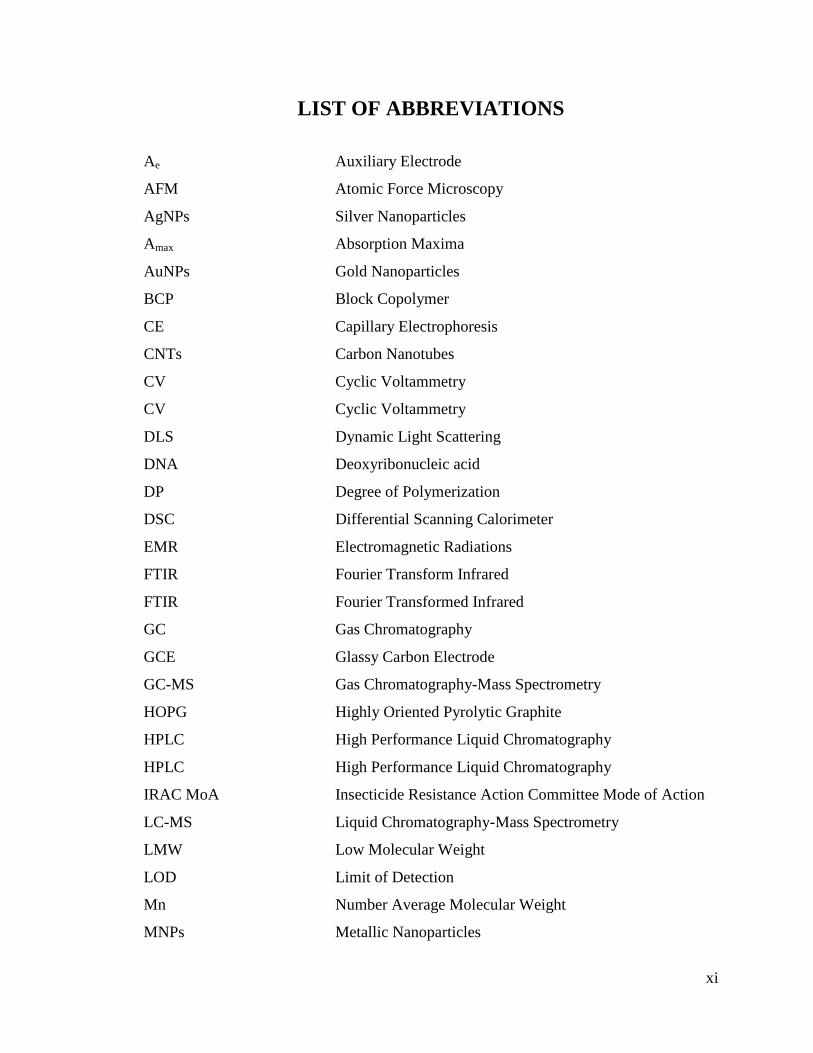
LIST OF ABBREVIATIONS
Ae Auxiliary Electrode
AFM Atomic Force Microscopy
AgNPs Silver Nanoparticles
Amax Absorption Maxima
AuNPs Gold Nanoparticles
BCP Block Copolymer
CE Capillary Electrophoresis
CNTs Carbon Nanotubes
CV Cyclic Voltammetry
CV Cyclic Voltammetry
DLS Dynamic Light Scattering
DNA Deoxyribonucleic acid
DP Degree of Polymerization
DSC Differential Scanning Calorimeter
EMR Electromagnetic Radiations
FTIR Fourier Transform Infrared
FTIR Fourier Transformed Infrared
GC Gas Chromatography
GCE Glassy Carbon Electrode
GC-MS Gas Chromatography-Mass Spectrometry
HOPG Highly Oriented Pyrolytic Graphite
HPLC High Performance Liquid Chromatography
HPLC High Performance Liquid Chromatography
IRAC MoA Insecticide Resistance Action Committee Mode of Action
LC-MS Liquid Chromatography-Mass Spectrometry
LMW Low Molecular Weight
LOD Limit of Detection
Mn Number Average Molecular Weight
MNPs Metallic Nanoparticles
xii
Mp Molecular Weight at Peak Height
MRI Magnetic Resonance Imaging
Mw Molecular Weight
MWNT Multi-Walled Nanotube
NPs Nanoparticles
P2VP Poly(2-vinylpyridine)
P2VP-b-PMMA Poly(2-vinylpyridine)-block-poly(methylmethacrylate)
PDI Polydispersity Index
PMMA Poly (methyl methacrylate)
PRB Plasmon Resonance Band
PS Polystyrene
PS-b-P2VP Polystyrene-block-poly(2-vinylpyridine)
Re Reference Electrode
Rg Radius of gyration
RMS Root Mean Square
rpm Revolutions Per Minute
SE Supporting Electrolytes
SEM Scanning Electron Microscopy
Si Silicon
SLS Static Light Scattering
SPB Surface Plasmon Band
SPM Scanning Probe Microscopy
SPR Surface Plasmon Resonance
SWNT Single-Walled Nanotube
TEM Transmission Electron Microscopy
Tg Glass Transition Temperature
UV-vis Ultraviolet visible
We Working Electrode
Wep Working Electrode Potential
Zp Zeta potential
xiii
TABLE OF CONTENTS
CERTIFICATE ................................................................................................................... II
DEDICATION .................................................................................................................... III
ABSTRACT ......................................................................................................................... IV
KHULASA ........................................................................................................................... VI
ACKNOWLEDGEMENTS ........................................................................................... VIII
CURRICULUM VITAE .................................................................................................... IX
LIST OF ABBREVIATIONS ........................................................................................... XI
TABLE OF CONTENTS ................................................................................................ XIII
LIST OF FIGURES ...................................................................................................... XVIII
LIST OF TABLES ........................................................................................................ XXIII
LIST OF SCHEMES .................................................................................................... XXIV
CHAPTER 1 .......................................................................................................................... 1
GENERAL INTRODUCTION & LITERATURE REVIEW ........................................ 1
1. POLYMER .................................................................................................................... 2
1.1 PROPERTIES OF POLYMERS ..................................................................................2
1.1.1 Monomers and Repeating Units .....................................................................3
1.1.1.1 Block Copolymer ....................................................................................4
1.1.1.2 Amphiphilic Block Copolymer ...............................................................5
1.1.2 Microstructure ................................................................................................6
1.1.2.1 Polymer architecture ...............................................................................6
1.1.2.2 Chain length ............................................................................................6
1.1.3 Polymer Morphology ......................................................................................7
1.1.3.1 Crystallinity .............................................................................................7
1.1.3.2 Radius of gyration ...................................................................................7
1.1.4 Phase Behavior ...............................................................................................8
xiv
1.1.4.1 Melting point ...........................................................................................8
1.1.4.2 Glass transition temperature ....................................................................8
1.1.4.3 Mixing behavior ......................................................................................8
1.1.5 Chemical Properties ........................................................................................8
1.2 POLY(2-VINYL PYRIDINE) ....................................................................................9
1.3 POLYMER-METAL NANOMATERIALS .................................................................10
1.4 NANOPARTICLES ...............................................................................................12
1.4.1 Characteristics and Applications of Nanoparticles .......................................12
1.4.2 Quantum Confinement Effects .....................................................................13
1.4.3 Surface Plasmon Resonance (SPR) ..............................................................14
1.5 CLASSIFICATION OF NANOPARTICLES ...............................................................15
1.5.1 Zero dimensional nanoparticles ....................................................................15
1.5.2 One dimension nanoparticles ........................................................................16
1.5.3 Two dimension nanoparticles .......................................................................16
1.5.4 Three dimension nanoparticles .....................................................................16
1.6 METALLIC NANOPARTICLES ..............................................................................16
1.6.1 Gold Nanoparticles (AuNPs) ........................................................................18
1.6.2 Silver Nanoparticles (AgNPs) ......................................................................19
1.6.3 Other Nanoparticles ......................................................................................19
1.7 APPLICATIONS OF METALLIC NANOPARTICLES IN VARIOUS FIELDS .................19
1.7.1 Biomedicines ................................................................................................20
1.7.1.1 Drug delivery.........................................................................................20
1.7.2 Energy ...........................................................................................................20
1.7.3 Environment .................................................................................................20
1.7.3.1 Catalysis ................................................................................................20
1.7.3.2 Chemosensing .......................................................................................20
1.8 SYNTHETIC APPROACHES OF NANOPARTICLES..................................................21
1.8.1 Top-down approach ......................................................................................22
1.8.2 Bottom-up approach .....................................................................................22
1.9 LIMITATIONS IN NANOSCALE APPROACHES ......................................................23
1.10 CHARACTERIZATION OF NANOPARTICLES .........................................................23
xv
1.10.1 Particle Size and surface morphology ..........................................................24
1.10.1.1 Light scattering methods .......................................................................24
1.10.1.1.1 Dynamic Light Scattering (DLS)………………………………….25
1.10.1.1.2 Static Light Scattering (SLS)……………………………………...25
1.10.1.2 Scanning Electron Microscopy (SEM) .................................................25
1.10.1.3 Transmission Electron Microscopy (TEM) ..........................................26
1.10.1.4 Atomic Force Microscopy (AFM) ........................................................26
1.10.1.4.1 Contact Mode……………………………………………………..28
1.10.1.4.2 Tapping Mode…………………………………………………….28
1.10.1.4.3 Non-contact Mode………………………………………………...29
1.10.2 Surface Charge .............................................................................................30
1.10.3 Drug Loading/Releasing ...............................................................................30
1.10.3.1 High-Performance Liquid Chromatography (HPLC) ...........................30
1.10.3.2 UV-Visible Spectroscopy ......................................................................31
1.10.3.3 Fluorescence spectroscopy ....................................................................32
1.10.3.4 Fourier Transforms Infrared Spectroscopy (FTIR) ...............................34
1.10.3.5 Voltammetry..........................................................................................35
CHAPTER 2 ........................................................................................................................ 36
EVALUATION OF MORPHOLOGY, AGGREGATION PATTERN AND SIZE
DEPENDENT DRUG LOADING EFFICIENCY OF GOLD NANOPARTICLES
STABILIZED WITH POLY (2-VINYL PYRIDINE) ................................................... 36
ABSTRACT ......................................................................................................................... 37
2 INTRODUCTION ...................................................................................................... 37
2.1 EXPERIMENTAL .................................................................................................. 40
2.1.1 Materials and Instrumentation ....................................................................... 40
2.1.2 Preparation of P2VP Coated Gold Nanoparticles.......................................... 41
2.2 RESULTS AND DISCUSSION ................................................................................. 42
2.3 CONCLUSION ...................................................................................................... 55
CHAPTER 3 ........................................................................................................................ 56
xvi
POLYSTYRENE-BLOCK-POLY(2-VINYLPYRIDINE)-CONJUGATED SILVER
NANOPARTICLES AS COLORIMETRIC SENSOR FOR QUANTITATIVE
DETERMINATION OF CARTAP IN AQUEOUS MEDIA AND BLOOD PLASMA56
ABSTRACT ......................................................................................................................... 57
3 INTRODUCTION ...................................................................................................... 57
3.1 EXPERIMENTAL .................................................................................................. 60
3.1.1 Materials and Instrumentation ....................................................................... 60
3.1.2 Preparation of P2VP Coated Gold Nanoparticles.......................................... 61
3.1.3 Spiking in Tap Water and Surface Runoff Water .......................................... 61
3.1.4 Spiking in Human Blood Plasma................................................................... 61
3.2 RESULTS AND DISCUSSION ................................................................................. 62
3.2.1 Synthesis and characterization of P(S-VP)-AgNPs ....................................... 62
3.2.2 P(S-VP)-AgNPs and cartap response ............................................................ 65
3.2.3 Spectroscopic recognition of cartap .............................................................. 70
3.3 CONCLUSION ...................................................................................................... 79
CHAPTER 4 ........................................................................................................................ 80
ENHANCEMENT IN THE ELECTROCHEMICAL RESPONSE OF GLASSY
CARBON ELECTRODE MODIFIED BY POLY(2-VINLYPYRIDINE)-B-
POLY(METHYL METHACRYLATE) CONJUGATED GOLD NANOPARTICLES
FOR NICOTINE................................................................................................................. 80
ABSTRACT ......................................................................................................................... 81
4 INTRODUCTION ...................................................................................................... 81
4.1 EXPERIMENTAL SECTION ................................................................................... 84
4.1.1 Materials ........................................................................................................ 84
4.1.2 Instrumentation .............................................................................................. 84
4.1.3 Methods ......................................................................................................... 86
4.1.3.1 Preparation of P(2VP-MMA)-AuNPs .................................................... 86
4.1.3.2 Electrochemical studies .......................................................................... 87
4.2 RESULTS AND DISCUSSION ................................................................................. 87
xvii
4.2.1 Characterization of P(2VP-MMA)-AuNPs ................................................... 87
4.2.2 Cyclic Voltammetric detection of nicotine using P(2VP3-MMA97)-AuNPs-
GCE as a Sensor ....................................................................................................... 96
4.3 CONCLUSION .................................................................................................... 104
CHAPTER 5 ...................................................................................................................... 105
SELECTIVITY OF THIN FILMS OF POLY(2-VINYLPYRIDINE-BLOCK-
METHYL METHACRYLATE) COPOLYMERS: AN AFM STUDY .................... 105
ABSTRACT ....................................................................................................................... 106
5 INTRODUCTION .................................................................................................... 106
5.1 EXPERIMENTAL ................................................................................................ 108
5.1.1 Materials and Instrumentation ..................................................................... 108
5.1.2 Atomic Force Microscopy ........................................................................... 109
5.1.3 Sample Preparation ...................................................................................... 109
5.2 RESULTS AND DISCUSSION ............................................................................... 110
5.2.1 Characterization of Surface Morphology .................................................... 112
5.2.2 Effect of Casting Solvent ............................................................................. 117
5.2.3 Effect of Substrate ....................................................................................... 119
5.2.4 Thermal Annealing and Surface Morphology ............................................. 121
5.3 CONCLUSION .................................................................................................... 123
CHAPTER 6 ...................................................................................................................... 124
CONCLUSION ................................................................................................................. 124
REFERENCES ................................................................................................................. 128
LIST OF PUBLICATIONS ............................................................................................. 155
xviii
LIST OF FIGURES
Figure 1-1. Various kind of copolymers ..............................................................................3
Figure 1-2. Block copolymers having di-, tri- and multi-blocks .........................................4
Figure 1-3. Various schematic representations of shapes of block copolymers ..................5
Figure 1-4: Various shapes of different nanoparticles .......................................................12
Figure 1-5: Various kind of nanoparticles .........................................................................16
Figure 1-6: Synthetic approaches of nanoparticles ............................................................22
Figure 1-7: Process of light scattering in solution .............................................................24
Figure 1-8: Schematic representation of basic principle of AFM ......................................27
Figure 1-9: Contact mode of AFM ....................................................................................28
Figure 1-10: Tapping mode of AFM .................................................................................29
Figure 1-11: Non-contact mode of AFM ...........................................................................29
Figure 1-12: Schematic representation of basic instrumentation of UV-visible
spectrophotometer ..............................................................................................................31
Figure 1-13. Schematic representation of basic principle of fluorescence spectroscopy .34
Figure 2-1: Effect of molar mass of P2VP on size and stability of P2VP-stabilized
AuNPs; A) Colour of solution and size; B) UV-vis spectra ..............................................43
Figure 2-2: FTIR spectra of unstabilized AuNPs (> 10,000 nm), P2VP (5000 g/mol) and
P2VP-stabilized AuNPs .....................................................................................................44
Figure 2-3: AFM images of P2VP-stabilized AuNPs, showing the average particle sizes;
A) AuNPs/P2VP1K; 125 nm, B) AuNPs/P2VP2K; 96 nm, C) AuNPs/P2VP5K; 43 nm, D)
AuNPs/P2VP10K; 32 nm, E) AuNPs/P2VP20K; 28 nm. The scale bar represents 0.25 µm
on all images ......................................................................................................................45
Figure 2-4: Physical characterization of P2VP stabilized AuNPs by DLS. (A) Dynamic
light scattering results of P2VP2K illustrating the experimental conditions i.e., the mean
autocorrelation function, monodispersity and radius plot (I to III), respectively. (B)
xix
Comparative corresponding radius distribution of P2VP-stabilized AuNPs, effect of
molar mass on the size distribution. All experiments were performed with an auto–piloted
run of 50 measurements (20 s for single measurement) with a wait time of 1 s at 25 °C. 46
Figure 2-5: Stability of the P2VP-stabilized AuNPs as a function of residence time as
indicated by UV-vis spectroscopy .....................................................................................47
Figure 2-6: Effect of the concentration of P2VP5K on the stability, size and distribution of
AuNPs; A) Visual difference in colour, B) UV-Vis spectroscopy, C) Dynamic light
scattering ............................................................................................................................49
Figure 2-7: The effect of temperature on the stability of P2VP2K-stabilized AuNPs as
shown by UV-vis spectroscopy .........................................................................................50
Figure 2-8: Effect of pH on P2VP stabilized gold nanoparticles as shown by UV-vis
spectroscopy .......................................................................................................................51
Figure 2-9: Effect of various salt concentrations on P2VP coated gold nanoparticles as
shown by UV-vis spectroscopy, A) P2VP10K-Au NPs; B) P2VP2K-Au NPs .....................53
Figure 2-10: A) Calibration curves for quantification of Naringin in concentration range
of 0.00391-0.0625 mg/mL; B) % drug-loading efficiency of P2VP-stabilized AuNPs ....55
Figure 3-1. UV-visible spectrum of P(S-VP)-conjugated AgNPs .....................................63
Figure 3-2. UV-visible spectrum of P(S-VP)-conjugated AgNPs after incubation of P(S-
VP)-conjugated AgNPs at 64 °C for 10 minutes (B.P. of methanol) ................................64
Figure 3-3. Electrolyte effect on P(S-VP)-conjugated AgNPs with various salt
concentration (0.01mM-5M)..............................................................................................65
Figure 3-4. Schematic representation of cartap recognition of P(S-VP)-AgNPs through
electrostatic interactions.....................................................................................................66
Figure 3-5. The size distribution by intensity A) of P(S-VP)-AgNPs avg size: 104.2±0.68
nm, PDI: 0.22; B) P(S-VP)-AgNPs/ cartap. avg. size: 89.68±0.57 nm, PDI: 0.08 ..........66
Figure 3-6. Atomic force micrographs (AFMs) A) P(S-VP)-AgNPs (80-120 nm); B) P(S-
VP)-AgNPs/cartap (60-90 nm) ..........................................................................................67
xx
Figure 3-7. Zeta potential distribution A) P(S-VP)-AgNPs; B) P(S-VP)-AgNPs/Cartap .68
Figure 3-8. FTIR spectra of P(S-VP), Cartap, P(S-VP)-AgNPs, and cartap treated P(S-
VP)-AgNPs ........................................................................................................................69
Figure 3-9. UV-visible spectra of P(S-VP)-AgNPs complexed with various pesticides ...72
Figure 3-10: Effect of pH on accumulation of P(S-VP)-conjugated AgNPs with Cartap .73
Figure 3-11. A) UV-visible spactra by using various concentrations of cartap with P(S-
VP)-AgNPs; B) Calibration curve for amount of cartap at 410 nm ..................................74
Figure 3-12: Job‘s plot for binding ratio. ..........................................................................75
Figure 3-13. Effect of interfering pesticides on cartap detection by P(S-VP)-AgNPs, 1:
deltamethrin, 2: Alpha-cypermethrin, 3: carbofuran, 4: chlorfenapyr, 5: Lambda-
cyhlalothrin, 6: diuron, 7: imidacloprid, 8: lufenron, 9: clodinafop propa .......................76
Figure 3-14. Effect of cartap on absorbance intensity of P(S-VP)-AgNPs A) tap water; B)
surface runoff water; C) human blood plasma ...................................................................79
Figure 4-1. Schematic illustration of the reduction process of Au (III) particles in the
presence of a stabilizing block copolymer P(2VP-MMA) using NaBH4 as reducing agent. .. 86
Figure 4-2: UV-visible spectra of P(2VP-MMA)-AuNPs stabilized by different block
copolymers varying in total molar mass and chemical composition .................................88
Figure 4-3: Comparative FTIR spectra of P(2VP-MMA)-AuNPs, P(2VP-MMA) and
AuNPs ................................................................................................................................89
Figure 4-4: AFM images of P(2VP-MMA)-AuNPs ..........................................................90
Figure 4-5: Size distribution by intensity of P(2VP3-MMA97)-AuNPs, P(2VP15-MMA85)-
AuNPs, and P(2VP10-MMA90)-AuNPs. .............................................................................91
Figure 4-6: Zeta potential distribution P(2VP3-MMA97)-AuNPs, P(2VP15-MMA85)-
AuNPs, and P(2VP10-MMA90)-AuNPs ..............................................................................92
Figure 4-7: Time stability of P(2VP3-MMA97)-AuNPs (A) UV visible spectroscopy (B)
AFM. All the images are of 2x2µm ...................................................................................93
Figure 4-8: Temperature effect on P(2VP3-MMA97)-AuNPs ............................................94
xxi
Figure 4-9: Electrolyte effect on the stability of P(2VP3-MMA97)-AuNPs .......................95
Figure 4-10: pH effect on P(2VP3-MMA97)-AuNPs .........................................................96
Figure 4-11: Voltammetric response of nicotine on (a) bare GCE; (b) P(2VP3-MMA97)-
AuNPs, (c) P(2VP15-MMA85)-AuNPs, and (d P(2VP10-MMA90)-AuNPs. fabricated GCE.97
Figure 4-12: Cyclic voltammograms in the absence of nicotine on bare GCE while using
(a) acetonitrile (b) water as a solvent. ................................................................................98
Figure 4-13: A comparative view of cyclic voltammograms (a) absence (0 mM) and (b)
presence (0.05 mM) of nicotine on P(2VP3-MMA97)-AuNPs-GCE in acetonitrile. .........98
Figure 4-14: An overlay of (a) absence, (b) and (c) presence of nicotine on P(2VP3-
MMA97)-GCE in acetonitrile at scan rate of 0.1V.s-1
. .......................................................99
Figure 4-15: Cyclic voltammograms of nicotine with various concentrations ranging from
0.05 mM to 0.4 mM on bare GCE in (A) acetonitrile; (B) distilled deionized water. .....101
Figure 4-16. Effect of various concentrations (from 0.05 mM – 0.4 mM) of nicotine on
P(2VP3-MMA97)-AuNPs-GCE in acetonitrile. ................................................................101
Figure 4-17: Comparison of cyclic voltammograms of 0.4 mM nicotine on (a) bare GCE
and (b) P(2VP3-MMA97)-AuNPs-GCE and (c) P(2VP3-MMA97)-GCE-sensor in
acetonitrile........................................................................................................................102
Figure 4-18: Comparison of cyclic voltammograms of 0.1 mM nicotine on (a) bare GCE
and (b) P(2VP3-MMA97)-AuNPs-GCE in acetonitrile. ...................................................103
Figure 4-19: Plot of oxidative peak current as a function of concentration of nicotine (0.1
mM - 0.5 mM)..................................................................................................................103
Figure 5-1: Structure of poly(2-vinylpyridine-b-methylmethacrylate) ............................110
Figure 5-2: Schematic representation of micellization and self-organization of AuNPs in
P2VP domain ...................................................................................................................111
Figure 5-3: AFM topographical images of P(2VP-MMA) with schematic overview of the
fabrication of nanoporous layers by P(2VP-MMA) (A) P(2VP-MMA) copolymers with
different compositions (sample area, 10x10 µm) (B) P(2VP-MMA) copolymers with
xxii
different molecular weights (sample area, 10x10 µm). The scale bar on each image show
2.5 µm. .............................................................................................................................113
Figure 5-4: Morphology of P(2VP-MMA)-AuNPs .........................................................114
Figure 5-5: Amplitude roughness profile of (A) P(2VP-MMA), and (B) P(2VP-MMA)-
AuNPs at horizontal scale of 10x10 µm. .........................................................................115
Figure 5-6: AFM 3D phase images of P(2VP-MMA) and P(2VP-MMA)-AuNPs
showing the thickness of the film on the Si wafer. From top to the bottom: P(VP3-
MMA97), P(VP15-MMA85), P(VP10-MMA90) (left); P(VP3-MMA97)/AuNPs, P(VP15-
MMA85)/AuNPs and P(VP10-MMA90)/AuNPs, (right) ...................................................116
Figure 5-7: Comparison of P(2VP-MMA) and P(2VP-MMA)-AuNPs RMS values
obtained through AFM studies.........................................................................................117
Figure 5-8: Solvent effect on the surface morphology of P(2VP15-MMA85) on Si wafer119
Figure 5-9: AFM 3D phase images of P(2VP15-MMA85) block copolymers showing the
polymer-surface and polymer-air interaction of the film cast from chloroform on the
various substartes. ............................................................................................................120
Figure 5-10: Height profile of P(VP15-MMA85) on various substrates (A) HOPG (B) Si
wafer (C) Mica .................................................................................................................121
Figure 5-11: Effect of thermal annealing on the morphology of P(2VP15-MMA85)
copolymer film on Si wafer for 30 min. Scale bar on each image is 1µm ......................122
Figure 5-12: Thermal annealed films of P(2VP-MMA)-AuNPs on Si wafer for 30 min 123
xxiii
LIST OF TABLES
Table 1.1: Different characteristics and applications of nanoparticles ……………….…13
Table 1.2: Different characterization techniques for various parameters related to
nanoparticles……………………………………………………………………………..23
Table 2 1: Molecular weight and polydispersity index of P2VP homopolymers, as
provided by manufacturer …….………………………………………………….……...41
Table 3.1: Comparison of reported cartap detection methods with current study ……. 77
Table 4.1. Molecular weight and polydispersity index of P(2VP-MMA), as provided by
manufacturer………………………………………………………………………. 85
Table 5.1: Molecular weight and polydispersity index of P2VP-b-PMMA as provided by
manufacturer.…………………..……………………………….………………………109

xxiv
LIST OF SCHEMES
Scheme 3 1: Resonating structure of Cartap …………………………………………… 70
Scheme 3 2: Structure of cartap and other interfering pesticides ……………………… 71
1
Chapter 1
General Introduction & Literature Review
2
1. Polymer
Polymers are one of the essential parts of modern life. The list of the products and
accessories made of polymers for daily life includes clothes, dishes, bottles, cars,
computers, pens, lights etc. The applications of polymers are endless to the high
technology such as spaceships rockets, drugs and medicine etc. Polymers can be natural
or synthetic depending upon their source. The database of life called DNA is a protein
that regulates metabolism in a living body, is a natural polymer. Other kind of natural
polymers includes, wood, silk, cellulose, cotton, fur, etc. Ever since man has exposed the
fascinating properties and applications of polymers by changing their architecture,
functionality, size and tacticity. Moreover, the properties of natural polymers are
improved by modifications. Further developments resulted in synthesis of polymers other
than available naturally. In 1910, Bakelite was the first commercialized synthetic
polymer. About ten years later Staudinger postulated that polymers either natural or
synthetic are large molecules consisting of small units, covalently bonded to each other in
order to build the polymers with advance properties that greatly differ from their starting
material and primarily depends upon their size. Polymer is a Greek word meaning many
parts; ‗poly‘ for ‗many‘ and ‗mer‘ for ‗parts‘. Nowadays, polymer technology emerges on
a high flight, and synthetic polymer chemistry developed as an economical cheap
alternate for natural fibers having outstanding properties compared to conventional
materials like ceramics, wood and metals. Furthermore, synthetic polymers can be
tailored as per requirements of the final applications.
1.1 Properties of Polymers
Properties of polymers are classified on the basis of the scale on which the characteristic
is defined. It is mainly influenced by type of monomers and their arrangement within a
single chain of polymer such as random, statistical, block, etc. Basically, these structure
based properties of polymer define their overall physical characteristics. Furthermore,
chemical properties of the polymers also transform by the chains interaction due to
different physical forces.
3
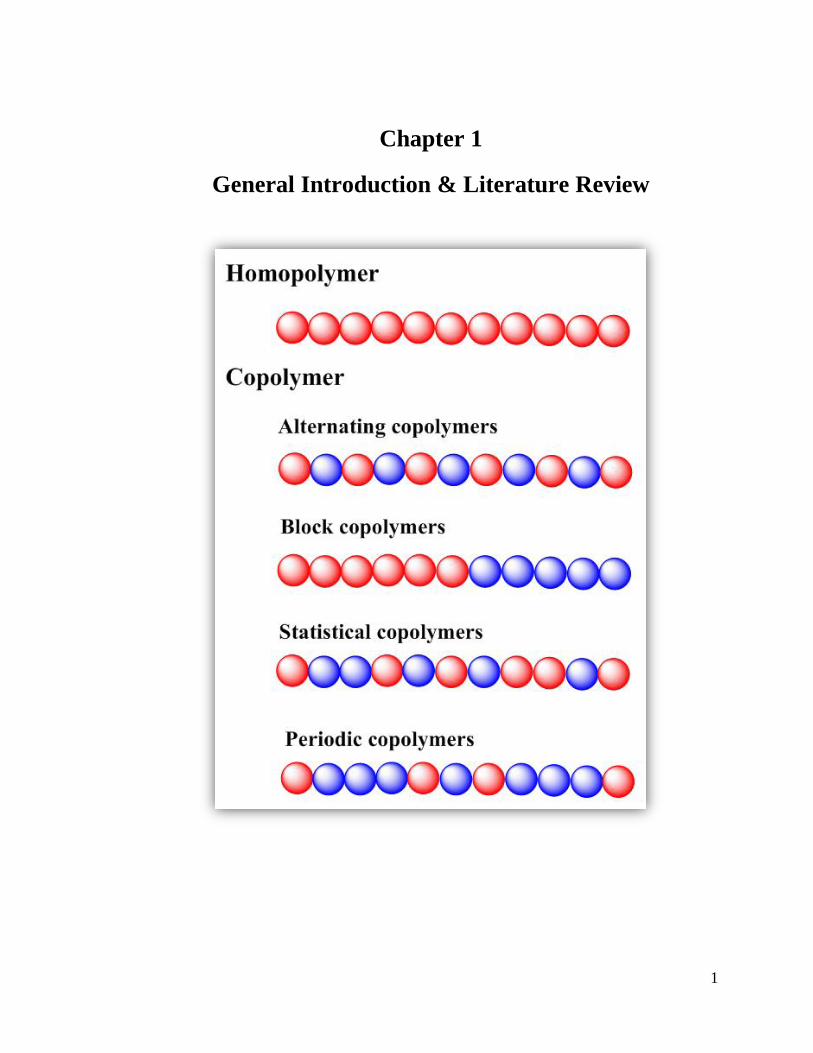
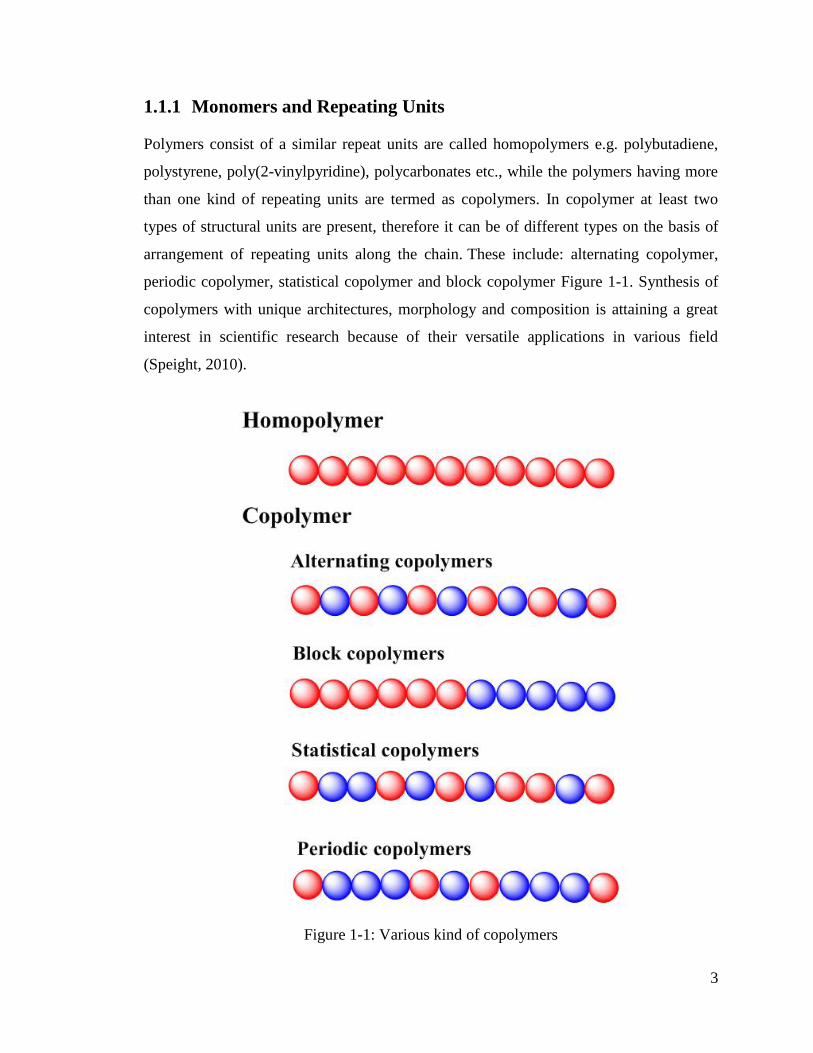
1.1.1 Monomers and Repeating Units
Polymers consist of a similar repeat units are called homopolymers e.g. polybutadiene,
polystyrene, poly(2-vinylpyridine), polycarbonates etc., while the polymers having more
than one kind of repeating units are termed as copolymers. In copolymer at least two
types of structural units are present, therefore it can be of different types on the basis of
arrangement of repeating units along the chain. These include: alternating copolymer,
periodic copolymer, statistical copolymer and block copolymer Figure 1-1. Synthesis of
copolymers with unique architectures, morphology and composition is attaining a great
interest in scientific research because of their versatile applications in various field
(Speight, 2010).
Figure 1-1: Various kind of copolymers
4
The properties of polymers depend upon the number of repeating units in the polymer
chain denoted by a symbol ―n‖ and called as the degree of polymerization (DP) (Pasch,
2013).
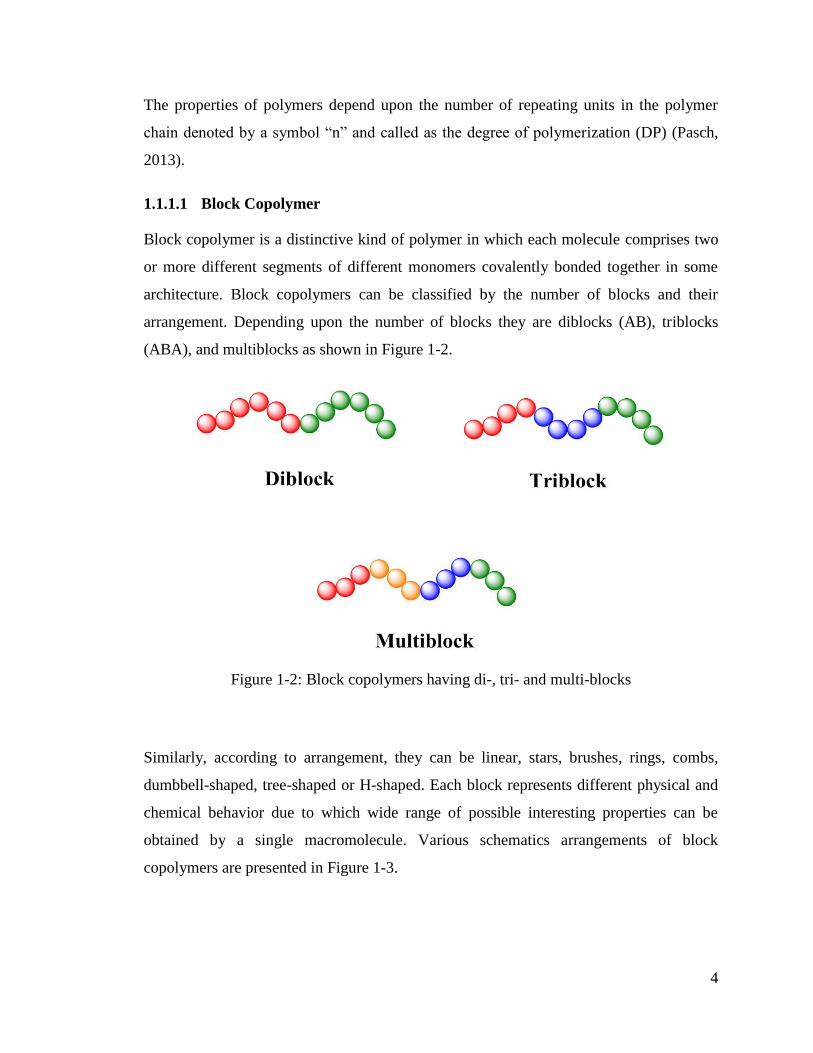
1.1.1.1 Block Copolymer
Block copolymer is a distinctive kind of polymer in which each molecule comprises two
or more different segments of different monomers covalently bonded together in some
architecture. Block copolymers can be classified by the number of blocks and their
arrangement. Depending upon the number of blocks they are diblocks (AB), triblocks
(ABA), and multiblocks as shown in Figure 1-2.
Figure 1-2: Block copolymers having di-, tri- and multi-blocks
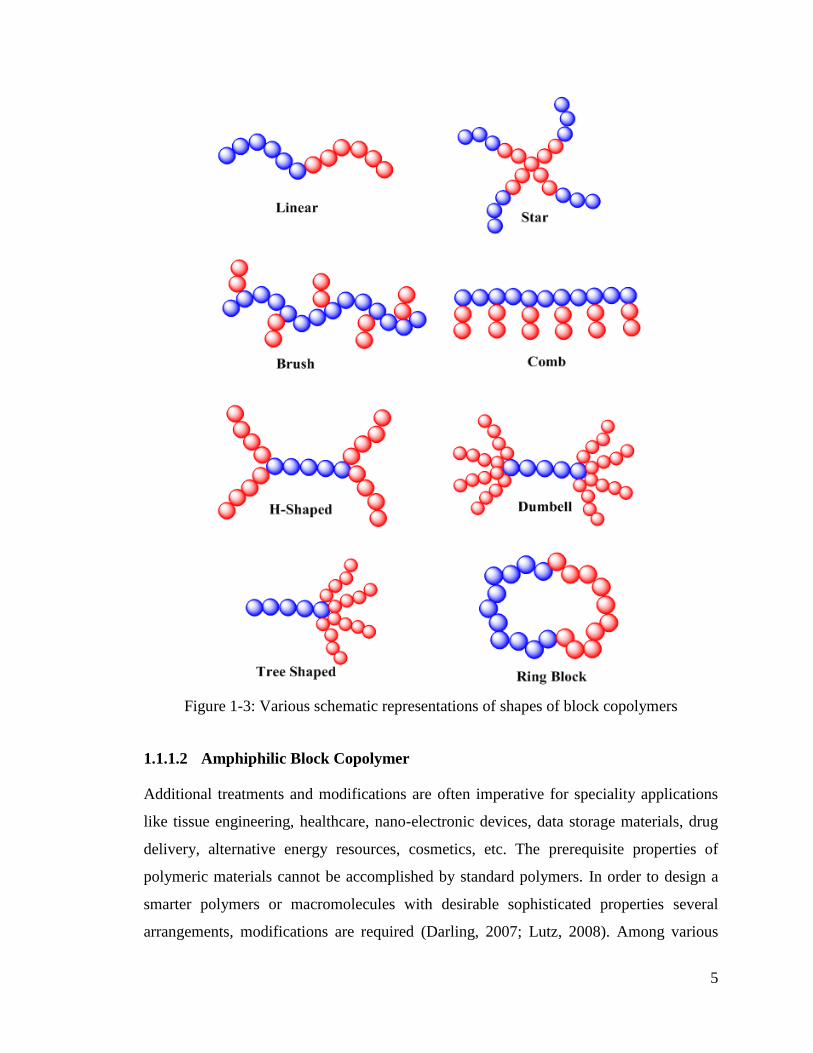
Similarly, according to arrangement, they can be linear, stars, brushes, rings, combs,
dumbbell-shaped, tree-shaped or H-shaped. Each block represents different physical and
chemical behavior due to which wide range of possible interesting properties can be
obtained by a single macromolecule. Various schematics arrangements of block
copolymers are presented in Figure 1-3.
5
Figure 1-3: Various schematic representations of shapes of block copolymers
1.1.1.2 Amphiphilic Block Copolymer
Additional treatments and modifications are often imperative for speciality applications
like tissue engineering, healthcare, nano-electronic devices, data storage materials, drug
delivery, alternative energy resources, cosmetics, etc. The prerequisite properties of
polymeric materials cannot be accomplished by standard polymers. In order to design a
smarter polymers or macromolecules with desirable sophisticated properties several
arrangements, modifications are required (Darling, 2007; Lutz, 2008). Among various
6
architectures of reported materials, amphiphilic block copolymers emerge as a new class
of polymers, exhibit multiple functionalities in a single polymer chain. The potential
applications of these amphiphilic assemblies are found in phase transfer catalysis, nano-
reservoirs, targeted drug delivery, gene therapy, metal nanoparticles, stabilization of non-
aqueous emulsion, etc. (Alexandridis, 1996; Kong, Li, Jin, Ding, & Shi, 2010; Riess,
2003; Riess & Labbe, 2004; Thurmond, Kowalewski, & Wooley, 1997; Wang, Winnik,
& Manners, 2007). It has a tendency to fabricate high-density arrays with desired
functionality in a predictable and controllable way to prepare materials with new and/or
improved physical properties for use in electronic storage devices, separation at
molecular level, screening of DNA and in combinatorial chemistry (B. J. Kim et al.,
2007; B. J. Kim, Bang, Hawker, & Kramer, 2006).
1.1.2 Microstructure
The microstructure or configuration of a polymer relates to the arrangement of monomers
within a polymer chain. The arrangement of monomers have a huge impact on the
polymer properties e.g., two different variety of natural rubbers having same monomers
may exhibit different durability because of the arrangement of these monomers.
1.1.2.1 Polymer architecture
Polymer properties are greatly influenced by their shape and architecture, e.g. branched
polymers have very different properties from their linear counterparts. Branched
polymers consist of side chains or branches on a backbone. Branched polymers can be
further classified as brush polymers, star polymers, dendronized polymers, comb
polymers, dendrimers, and ladder polymers etc.
1.1.2.2 Chain length
Properties of a polymer such as solubility, melting and boiling temperatures, and
viscosity are strongly reliant on polymer chain length. Furthermore, increasing chain
length leads to decreased mobility of a chain, high glass transition temperature (Tg), and
increase in the strength and toughness. This change in physical behavior is due to
increase in chain entanglements which internally enhance secondary interactions such as
7
Van der Waals interaction. These weak attractions bound the chains in a fix position and
minimize deformations, both at elevated temperatures and stresses.
1.1.3 Polymer Morphology
Polymer morphology explains three dimensional organization and ordering of polymer
chains at a micro level in space.
1.1.3.1 Crystallinity
Two different regions are found in synthetic polymers i.e. amorphous and crystalline
regions. Synthetic polymers are said to be crystalline when the polymer has region of
three-dimensional ordering at atomic scales. The degree of crystallinity is a volume
fraction or weight fraction of crystalline form. Degree of crystallinity is taken as zero for
non-crystalline polymers while one for completely crystalline polymers.
The appearance of polymers changes with the degree of crystallinity. Polymer will tend
to be transparent if degree of crystallinity approaches 0 to 1, while polymers will be
opaque with the value in between 0-1, because of light scattering by crystalline or glassy
regions.
1.1.3.2 Radius of gyration
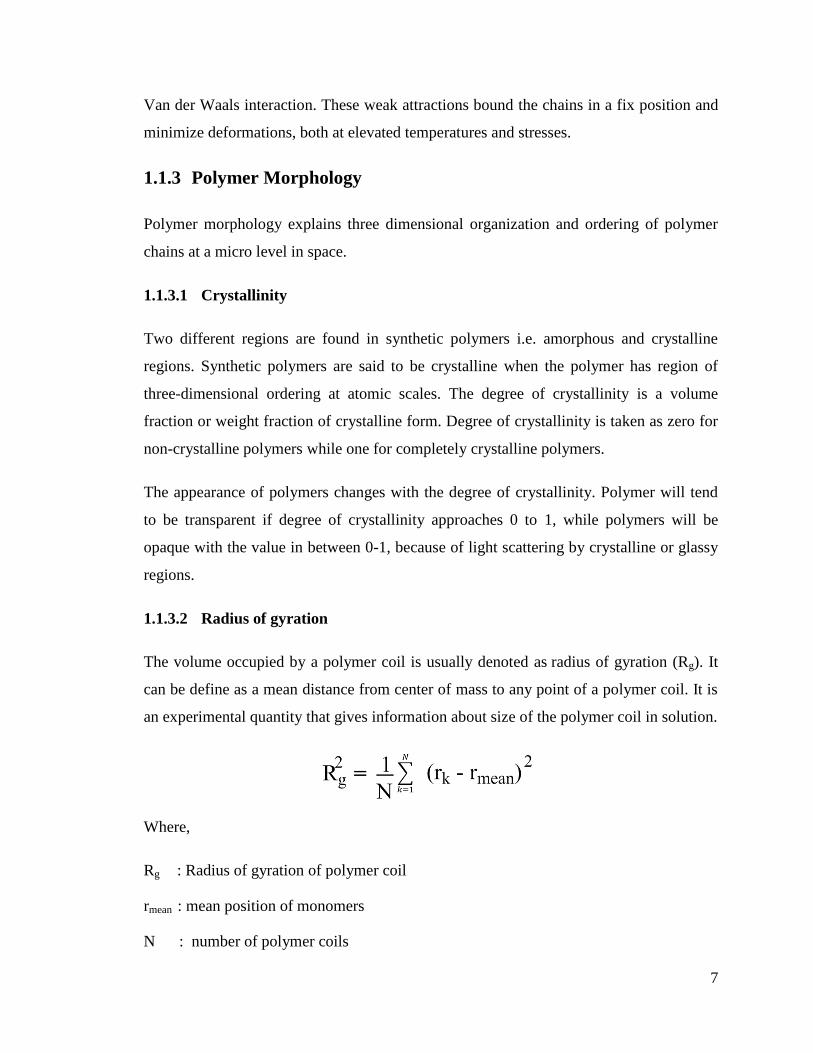
The volume occupied by a polymer coil is usually denoted as radius of gyration (Rg). It
can be define as a mean distance from center of mass to any point of a polymer coil. It is
an experimental quantity that gives information about size of the polymer coil in solution.
Where,
Rg : Radius of gyration of polymer coil
rmean : mean position of monomers
N : number of polymer coils
8
1.1.4 Phase Behavior
1.1.4.1 Melting point
In polymer chemistry, melting point describes a temperature that causes change from a
crystalline to solid amorphous form. Melting temperature is related to thermoplastic polymers
only because thermosetting polymer crosslink irreversibly at elevated temperatures.
1.1.4.2 Glass transition temperature
It is the most important parameter in preparation of synthetic polymers. Tg is the
temperature at which amorphous region of the polymer converts from a viscous rubbery
form to a glassy brittle solid on cooling.
1.1.4.3 Mixing behavior
Generally, polymers are not miscible because the entropy of the polymer chains are far
less than small molecules. On the other hand, the energy of mixing depends on per
volume basis for small molecule and polymer. As the polymer chain increases, free
energy of mixing for polymer also increases that makes the solvation process less
favorable. Therefore, it is difficult to make a concentrated solution of polymers.
1.1.5 Chemical Properties
Chemical properties of the polymers are greatly affected by attractive forces between
polymer chains. The long chains of polymers amplify the interchain forces. Polymers
offer various physical interactions with their neighboring chains in a solution depending
upon different functionalities. These interactions include hydrogen bonding, ionic
bonding, dipole-dipole interactions etc. For instance, polymers consisting carbonyl or
amide groups form hydrogen bonds with other chains. Similarly, dipole-dipole
interactions exists amongst the carbonyl C=O oxygen and the H-C hydrogen in
polyesters. Polyethylene chains have weak vander waal forces.
9
1.2 Poly(2-vinyl pyridine)
Polymers containing pyridine moiety have widely been used as a capping agent or ligand
to stabilize the nanoparticles (Carotenuto, Pepe, & Nicolais, 2000; Lekesiz, Kayran, &
Hacaloglu, 2015; Shan & Tenhu, 2007; Walker, St. John, & Wisian-Neilson, 2001).
Among them poly(2-vinylpyridine) (P2VP) is the best candidate for chelation of metal
nanoparticles. The presence of nitrogen atoms in the pyridine moiety have a strong ability
to coordinate with metal ions or metallic nanoparticles through steric stabilization that
restrains the aggregation of the metal nanoparticles (Jang, Khan, Hawker, & Kramer,
2012; Lekesiz et al., 2015; Mössmer et al., 2000; Voulgaris, Tsitsilianis, Grayer,
Esselink, & Hadziioannou, 1999; Youk et al., 2002). Kunz et al. (Kunz, Shull, & Kellock,
1993) showed that the contact angle of P2VP is very low with Au (9°). PS-P2VP block
copolymer have been used to demonstrate precise control of the particles location within
the P2VP domain (Chiu, Kim, Kramer, & Pine, 2005). Gittins et al. (David I Gittins &
Frank Caruso, 2001) and Gandribert et al. (Gandubert & Lennox, 2005a) showed a
favorable interaction between pyridine and AuNPs surface using 4-(dimethylamino)
pyridine for the stabilization of AuNPs. P2VP forms random coil conformation in
solution which associates with the metal atoms and increases the probability of nucleus
formation (Carotenuto et al., 2000; Gandubert & Lennox, 2005c; Youk et al., 2002).
Several studies have been conducetd with P2VP based nanoparticles. P2VP based
amphiphilic block copolymers have received extensive attention in a field of
nanotechnology because they have the ability to self-assemble in particular solvent. They
form stable micelles at a nanoscale (i.e. 10 to100 nm) that provides an effective way for
controlling diverse range of 1D, 2D, 3D metallic nanoparticles patterns within a specific
location in polymer domain (Ikkala & ten Brinke, 2004; Quake & Scherer, 2000; Schmitt
et al., 1997; Xia et al., 1996). Preparation of metallic NPs in the block copolymer
template through micellization is a popular method. This method increases the stability of
nanoparticles that can be achieved easily and economically in terms of effectiveness and
efficiency (Shan & Tenhu, 2007; Torrisi, Ruffino, Licciardello, Grimaldi, & Marletta,
2011). An important role of copolymer systems interacting with colloidal metal
nanoparticles is to allow the initial small size to be maintained by preventing coagulation
10
and accurately control the placement of NPs within the block copolymer template.
Therefore, a profound understanding is required with regard to the interaction between
the particle surface, capping agent, and the polymeric matrix for controlling the 3D
structure of nanomaterials (B. J. Kim et al., 2006). Furthermore, the functional groups
and mechanism concerned in colloid stabilization differ through pendant groups attached
to the polymer backbone (e.g., pyrrolidone (Carotenuto, 2001), thiol (Shimmin, Schoch,
& Braun, 2004), or pyridine groups (Jang et al., 2012) etc.), which offers varying particle
size and stability (Badawy et al., 2010b; Ju-Nam & Lead, 2008; Walker et al., 2001).
1.3 Polymer-Metal Nanomaterials
Fabrication of polymer-metal nanomaterials is a potential route for synthesis of advanced
novel functional materials such as highly effective catalysts, band gap devices, chemical
and biochemical sensors, and secondary storage devices. For certain applications such as;
catalysis, optics and electronics, it is suitable to prepare stable, small but not fully
cavitated, therefore, active sites of particles are accessible, otherwise the efficiency of
nanoparticles (NPs) reduces. Two challenges that are imperative in this respects are; (1)
prevention of NPs from aggregation without jamming active surfaces on the nanoparticle
and (2) control over the size, shape, and size distribution of NPs. Various natural
macromolecules like proteins, flavonoids, liposomes and polysaccharides as well as
synthetic macromolecules such as polymers have been employed for construction of
nanosensors (Fang et al., 2011; Gandubert & Lennox, 2005a).
Polymers are especially suitable as template for the encapsulation of NPs because of their
fairly uniform composition and structure that help in the fabrication of well-defined NPs
and prevent agglomeration or segregation of nanoparticles (Aurélien et al., 2014;
Mössmer et al., 2000; Shan & Tenhu, 2007; Tyagi, Kushwaha, Kumar, & Aslam, 2011a;
Walker et al., 2001; Youk et al., 2002; Yu, Chien, & Chen, 2008). Encapsulated NPs are
stabilized by steric effects, thus a considerable fraction of NPs is unprotected and more
active surfaces of NPs are available for further use. The functional groups in the polymer
also control solubility of NPs and used as handles to link two surfaces and other polymers
(Crooks, Zhao, Sun, Chechik, & Yeung, 2001). Various research groups reported the
11
polymeric templates as a well beyond that of a simple casting mold (Abraham, Kim, &
Batt, 2007; Balazs, Emrick, & Russell, 2006; Bockstaller, Mickiewicz, & Thomas, 2005).
A variety of metallic nanoparticles including Cu, Ag, Au, Pt, Pd, Cr and Rh etc have been
synthesized with P2VP to control geometry, size and properties of these nanomaterials
(Aurélien et al., 2014; Jang et al., 2012; Sana Rahim, 2017; Yu et al., 2008). The template
is removed chemically or thermally if naked nanomaterial is required. The technique
provides monodisperse particles with a diversity of sizes, shapes, and chemical
compositions can be fabricated (Kang & Taton, 2005; B. J. Kim et al., 2006).
As a significance of their multiple functionalities and 3D structure, polymers are also able
to stabilize a number of ions and molecules. Stabilization mainly depends on the nature
of the particles, chemical composition and the cavity size of the polymers. Metal interacts
with polymers by the driving forces such as, covalent bond formation, secondary
interactions play a vital role such as complexation reactions, electrostatic interactions,
and various types of weaker forces (Vander Waals, hydrogen bonding, etc.), steric
confinement, and combinations thereof (Boal, Ilhan, DeRouchey, & Thurn-Albrecht,
2000; Caruso, Caruso, & Möhwald, 1998; J. Jin et al., 2001; J. Liu et al., 1999; Naka,
Itoh, & Chujo, 2003; Patil, Mayya, Pradhan, & Sastry, 1997).
Public and private sectors funded to the advancement of research in the field of
nanotechnology and its applications in other fields like molecular biology, surface
science, semiconductor physics, and organic chemistry. The nanotechnology based
research and their uses are diverse starting form preparation of commonly used physical
devices to innovative advances to established advanced materials with nano-dimensions.
Advancements in the fields such as biomaterials, medicine and electronics etc are very
much related to the progress in the field of nanotechnology. Additionally,
nanotechnology nurtures about toxicity and environmental impact of nano-materials on
the world economy (Bockstaller et al., 2005; Jiang, Oberdörster, & Biswas, 2009b; H.-C.
Kim, Park, & Hinsberg, 2009; Toshima & Yonezawa, 1998).
12
1.4 Nanoparticles
Nanoparticles (NPs) are achieving excessive interest since it establishes a connection
between atomic structures and its bulk material. The material properties are influenced by
the size of material approaches the nano-level and as the surface area per volume of a
material is enhanced. The exciting and unpredicted properties of NPs are realized due to
increased surface area of the material. For specific applications, properties of
nanoparticles such as size, shape, size distribution and surface characteristics are tuned
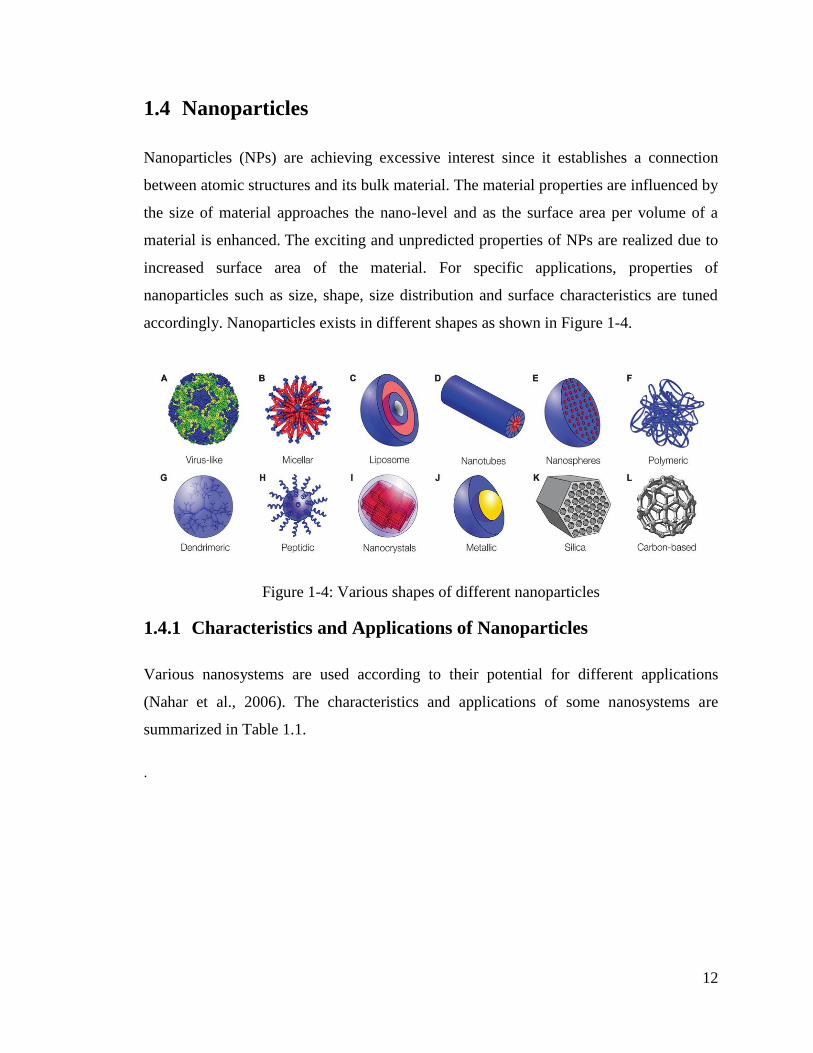
accordingly. Nanoparticles exists in different shapes as shown in Figure 1-4.
Figure 1-4: Various shapes of different nanoparticles
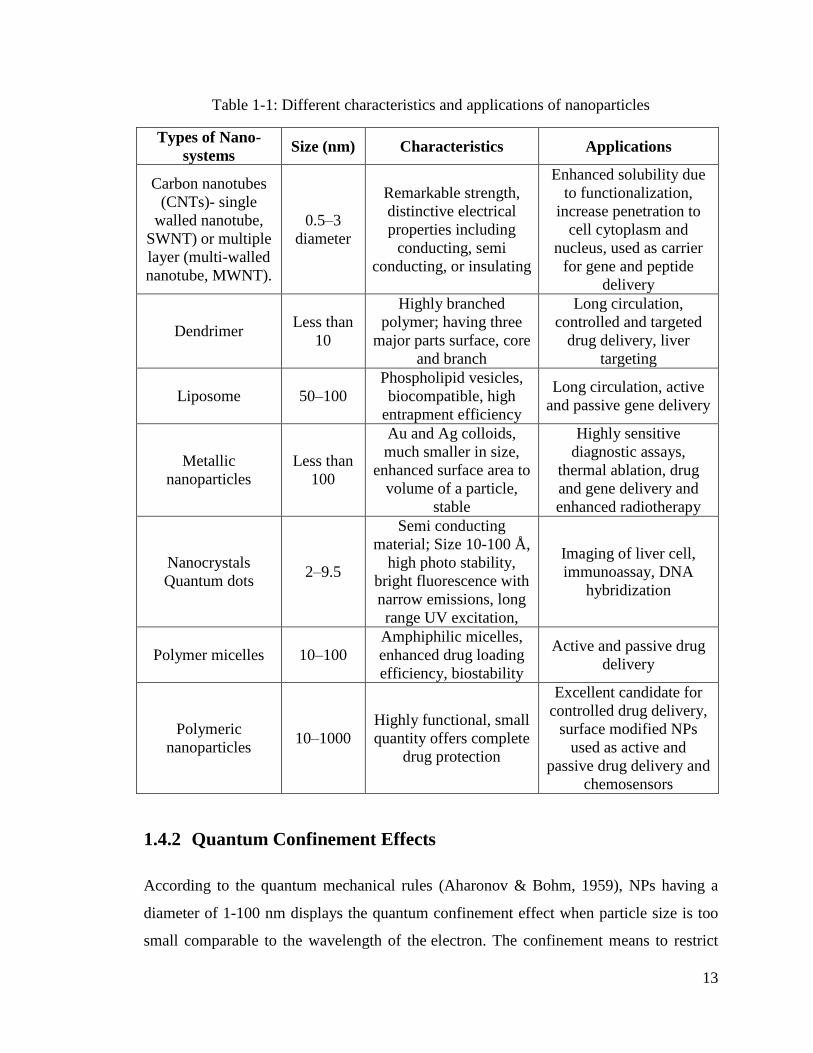
1.4.1 Characteristics and Applications of Nanoparticles
Various nanosystems are used according to their potential for different applications
(Nahar et al., 2006). The characteristics and applications of some nanosystems are
summarized in Table 1.1.
.
13
Table 1-1: Different characteristics and applications of nanoparticles
Types of Nano-
systems Size (nm) Characteristics Applications
Carbon nanotubes
(CNTs)- single
walled nanotube,
SWNT) or multiple
layer (multi-walled
nanotube, MWNT).
0.5–3
diameter
Remarkable strength,
distinctive electrical
properties including
conducting, semi
conducting, or insulating
Enhanced solubility due
to functionalization,
increase penetration to
cell cytoplasm and
nucleus, used as carrier
for gene and peptide
delivery
Dendrimer Less than
10
Highly branched
polymer; having three
major parts surface, core
and branch
Long circulation,
controlled and targeted
drug delivery, liver
targeting
Liposome 50–100
Phospholipid vesicles,
biocompatible, high
entrapment efficiency
Long circulation, active
and passive gene delivery
Metallic
nanoparticles
Less than
100
Au and Ag colloids,
much smaller in size,
enhanced surface area to
volume of a particle,
stable
Highly sensitive
diagnostic assays,
thermal ablation, drug
and gene delivery and
enhanced radiotherapy
Nanocrystals
Quantum dots 2–9.5
Semi conducting
material; Size 10-100 Å,
high photo stability,
bright fluorescence with
narrow emissions, long
range UV excitation,
Imaging of liver cell,
immunoassay, DNA
hybridization
Polymer micelles 10–100
Amphiphilic micelles,
enhanced drug loading
efficiency, biostability
Active and passive drug
delivery
Polymeric
nanoparticles 10–1000
Highly functional, small
quantity offers complete
drug protection
Excellent candidate for
controlled drug delivery,
surface modified NPs
used as active and
passive drug delivery and
chemosensors
1.4.2 Quantum Confinement Effects
According to the quantum mechanical rules (Aharonov & Bohm, 1959), NPs having a
diameter of 1-100 nm displays the quantum confinement effect when particle size is too
small comparable to the wavelength of the electron. The confinement means to restrict
14
the random motion of electrons in a confined space having a specific energy, causes a
transition from continuous to discrete energy levels and the word quantum defines the
atomic realm of particles. Therefore, as particle size decreases up to a nano level, the
difference between the two energy level of confining dimension becomes discrete and
ultimately the band gap and energy of the band gap increases.
Physical properties of the NPs be strongly subjected to particle size, shape, interparticle
distance and nature of the protecting agent. The electrons on the surface of particle show
tunneling effect when combined with their neighboring particles. The tunneling process is
an effect that differentiate intra and intermolecular processes that can be detected by
impedance measurements (Lambe & Jaklevic, 1968). The quantum size effect is
pronounced if the particle size is in the range of de Broglie wavelength of valence
electrons. Quantum-mechanical rule explained that freely moveable electrons in 0D
quantum dots display particular cumulative oscillation frequency of plasma resonance
that leads to characteristic plasmon resonance band (PRB). For example, the
characteristics band of gold nanoparticles is observed around 500-600 nm (Daniel &
Astruc, 2004), while the silver nanoparticles show a characteristics band between 350-
450 nm (Mulfinger et al., 2007; Solomon et al., 2007). Unlike bulk materials, a gap
between the conduction and valence band is generated in NPs which cause size
dependent quantization. NPs diameter around 20 nm induces standing electronic waves
that create discrete energy levels and cause large number of differences in optical and
electrical properties of nanoparticles. This kind of flexibility is required for number of
potential applications such as electrometers, transistors, switches, oscillators, catalysis,
and biosensors (Boisselier & Astruc, 2009; Daniel & Astruc, 2004; Saha, Agasti, Kim,
Li, & Rotello, 2012).
1.4.3 Surface Plasmon Resonance (SPR)
SPR has gained considerable attention especially in the field of catalysis and
optoelectronics due to their optical properties as described by Mie theory. According to
the Mie theory (Fu & Sun, 2001) the overall sum of electromagnetic oscillations is
directly proportional to surface plasmon absorption and scattering by the particles. It
15
relates the surface plasmon band of spherical NPs with dipole oscillations of free
electrons in conduction band that occupies energy state above the Fermi energy.
The change in surface plasmon resonance band (SPR) is observed with decreasing the
core size and shape of the NPs. This decrease in size dominates the quantum size effect
that causes blue shift and spectral transitions. SPR bandwidth and absorption maximum
(Amax) are also affected by temperature, dielectric constant of the medium and refractive
index of solvent. The presence of a ligand or capping agent changes the refractive index
which causes either red or blue shift, a deviation from Mie theory. The Mie theory deals
with the bare nanoparticles, nonetheless, ligand conjugated NPs show deviation from
Mie theory (Ateeq et al., 2015; Daniel & Astruc, 2004).
The shift in SPR band is significant when nitrogen and sulphur containing compounds are
used as ligands (Daniel & Astruc, 2004; Sana Rahim, 2017). These ligands strongly
interact with electronic cloud on the surface of the particles. Therefore, SPR does not
always follow the Mie theory. Non-spherical NPs show a red shift because spacing
between NPs reduces as the gap between conduction and valence band decreases. This
ability of NPs makes them alluring candidates in optical measurements, e.g. impurities
are also detectable as the refractive index of MNPs changes compared to that of their
oxides and chlorides. Temperature also affects the SPR band that can be explained by
electrons dephasing mechanisms. In this mechanism electron-electron interactions are
observed instead of electron photon coupling. Due to enhanced sensitivity of SPR
position, these NPs are applied for biosensor and chemosensors applications (Ateeq et al.,
2015; Chah, Hammond, & Zare, 2005; Daniel & Astruc, 2004; Sana Rahim, 2017).
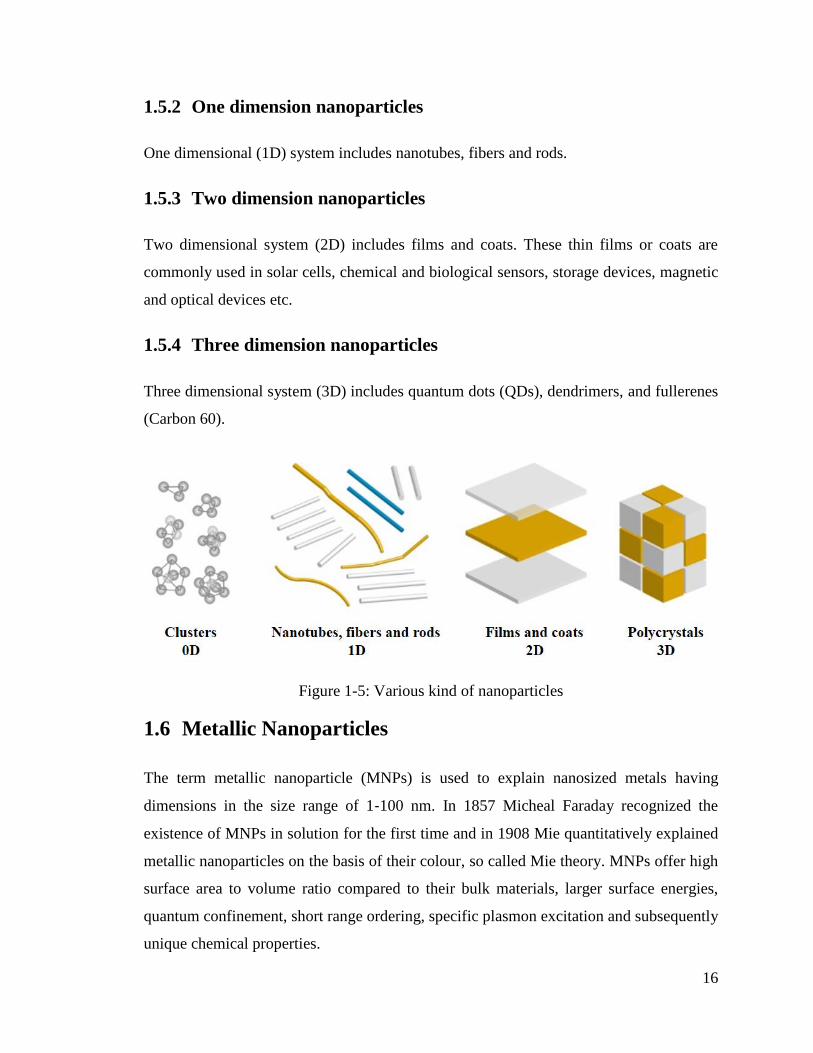
1.5 Classification of Nanoparticles
Nanoparticles can be classified into different classes such as 0-, 1-, 2- and 3-dimensional
structures, Figure 1-5.
1.5.1 Zero dimensional nanoparticles
Zero dimensional nanoparticles (0D) includes clusters.
16
1.5.2 One dimension nanoparticles
One dimensional (1D) system includes nanotubes, fibers and rods.
1.5.3 Two dimension nanoparticles
Two dimensional system (2D) includes films and coats. These thin films or coats are
commonly used in solar cells, chemical and biological sensors, storage devices, magnetic
and optical devices etc.
1.5.4 Three dimension nanoparticles
Three dimensional system (3D) includes quantum dots (QDs), dendrimers, and fullerenes
(Carbon 60).
Figure 1-5: Various kind of nanoparticles
1.6 Metallic Nanoparticles
The term metallic nanoparticle (MNPs) is used to explain nanosized metals having
dimensions in the size range of 1‐100 nm. In 1857 Micheal Faraday recognized the
existence of MNPs in solution for the first time and in 1908 Mie quantitatively explained
metallic nanoparticles on the basis of their colour, so called Mie theory. MNPs offer high
surface area to volume ratio compared to their bulk materials, larger surface energies,
quantum confinement, short range ordering, specific plasmon excitation and subsequently
unique chemical properties.
17
Metallic nanoparticles such as, noble metals e.g. Au (Boisselier & Astruc, 2009) , Ag
(Podsiadlo et al., 2005; Robinson et al., 2008), Pd (Ung et al., 2009), semiconductors e.g.
ZnS, CdS, CdSe (Bawendi, Sundar, & Mikulec, 2007; Boisselier & Astruc, 2009), TiO2
(Drbohlavova, Adam, Kizek, & Hubalek, 2009), InP and PbS (Rogach, Eychmüller,
Hickey, & Kershaw, 2007), Si (O‘Farrell, Houlton, & Horrocks, 2006) can be constituted
in various materials. The formation of MNPs is realized by reducing salts of the metals
with reducing agents (Sun & Zeng, 2002) in the presence of a stabilizer like polymers,
dendrimers, microgels, surfactants, and colloids (Abraham et al., 2007; Daniel & Astruc,
2004; Gandubert & Lennox, 2005c; Jaramillo, Baeck, Cuenya, & McFarland, 2003;
Perrault & Chan, 2009; Shan & Tenhu, 2007; Youk et al., 2002). Polymer provides
enhanced surface area/volume ratio of NPs that resulted in higher reactivity and offers
stability to NPs through steric or electrostatic repulsion (H.-C. Kim et al., 2009).
Currently, metal and metal oxide NPs are extensively studied because of their wide range
of applications in optics, catalysis, photophysics, and medicinal sciences e.g. imaging,
sensing, photodynamic therapy, hyperthermia, and drug delivery. In various circumstances,
chemically inert metal nanoparticles are required in order to reduce toxicity and other side
effects. Recently, it is observed that metallic nanoparticles increase the potency of some
drug-molecules e.g., Kotov‘s (Podsiadlo et al., 2008), studied that 6-mercaptopurine
stabilized gold nanoparticles kill leukemia cells more efficiently than 6-mercaptopurine. Jin
and He (T. Jin & He, 2011), reported that the antibacterial potential of nisin is enhanced
noticeably when nisin was used with magnesium oxide (MgO) against E.coli in the culture
of food. Recently, AuNPs and AgNPs, have been investigated extensively because of their
exceptional optical, catalytical and electrical properties (Abraham et al., 2007; Daniel &
Astruc, 2004; Gandubert & Lennox, 2005c; Perrault & Chan, 2009; Schaaff & Whetten,
2000; Shan & Tenhu, 2007; Toshima & Yonezawa, 1998; Youk et al., 2002). AuNPs are
commonly used in drug/gene delivery and photothermal therapy. Moreover, AgNPs are
used as antibacterial agents while Fe2O3-NPs are used in hyperthermia and magnetic
resonance imaging (MRI). Chemically reactive species of MNPs are rarely used.
18
1.6.1 Gold Nanoparticles (AuNPs)
Although gold is the subject of investigations in science since ancient times, its
revitalization now leads to exponential growth of publications in the emerging fields of
nanotechnology and nanoscience. Among all nanoparticles, AuNPs are the stable metal
nanoparticles and are used in various fields such as material sciences, biology and catalysis
because of their captivating features that include individual particles behavior, quantum
size effect such as size-dependent optoelectronic and magnetic properties etc. Gold is an
efficient electron conductor. Due to its potentials in these fields and in the bottom-up
approach of nanotechnology, it is considered to be a key material and building block in the
21st century (Daniel & Astruc, 2004; Pooja, Panyaram, Kulhari, Rachamalla, & Sistla,
2014; Shan & Tenhu, 2007).
AuNPs are synthesized by reduction of gold salts, Au (III) salts are mostly used. In 1951,
Turkevitch (Turkevich, Stevenson, & Hillier, 1951) reduced HAuCl4 salt of gold using
citrate in water. Controlled nucleation of gold particles to attain the monodispersity of
particle size in gold suspension was also performed (Frens, 1973). Brust-Schiffrin
introduced two phase synthesis using thiol ligand for the stabilization of gold particles in a
liquid-liquid system (Brust, Walker, Bethell, Schiffrin, & Whyman, 1994). Jadzinsky et al.
investigated the characteristics of AuNPs structure by using X-Rays diffraction (Ackerson,
Jadzinsky, & Kornberg, 2005; Jadzinsky, Calero, Ackerson, Bushnell, & Kornberg, 2007).
Haruta et al. (Haruta, 1997; Haruta & Daté, 2001; Haruta, Kobayashi, Sano, & Yamada,
1987; Haruta et al., 1993; Haruta, Yamada, Kobayashi, & Iijima, 1989) used AuNPs coated
Co3O4, TiO2, or Fe2O3 as a catalysts for CO2 hydrogenation, catalytic combustion of
methanol, H2 and CO oxidation, water gas shift reaction and NO reduction. Gold
nanoparticles were also used as rectifier for microchannels in chip-based capillary-
electrophoresis devices (Daniel & Astruc, 2004). Encapsulation of AuNPs prevailed over
photo oxidation in commercial devices (Xue et al., 2014). Gold nanoparticles are used to
study the structures, morphology, properties, and applications of biological, inorganic and
molecular nanomaterials (Bindhu & Umadevi; Jang et al., 2012; Kang & Taton, 2005; Saha
et al., 2012; Sohn & Seo, 2001; Spatz, Mößmer, & Möller, 1996).
19
1.6.2 Silver Nanoparticles (AgNPs)
Silver is another commonly used metal for fabrication of nanoparticles. Silver nanoparticles
(AgNPs) are synthesized by various physical and chemical protocols. The physical
procedures involves evaporation or condensation techniques and by using laser. While,
chemical methods include the reduction of silver ions into silver metal from silver salts (El-
Nour, Eftaiha, Al-Warthan, & Ammar, 2010).
Silver nanoparticles (AgNPs) have been used as an antibacterial agents for past decades.
Nowadays, AgNPs are used in textile industry and in commercial detergents to kill bacteria
and to prevent the spread of bacterial diseases. Conjugation of various biocides to AgNPs
enhances antibacterial activity. Capped nanoparticles has the ability to bind with two
different biocides, inorganic (silver nanoparticles) and organic (capping agents), which
offers different metabolic pathways to target the organism more effectively inside the body
(Chernousova & Epple, 2013; J. S. Kim et al., 2007; Rai, Yadav, & Gade, 2009).
1.6.3 Other Nanoparticles
Other metallic nanoparticles include zinc (Hattori, Mukasa, Toyota, Inoue, & Nomura,
2011), palladium (Corthey et al., 2012), Copper (Ruparelia, Chatterjee, Duttagupta, &
Mukherji, 2008) etc. Some metal oxide nanoparticles such as Fe (III) oxide (Rosen, Chan,
Shieh, & Gu, 2012), titanium oxide (Shiraishi, Ikeda, Tsukamoto, Tanaka, & Hirai, 2011),
zinc oxide (Meulenkamp, 1998) etc. are also used. Certain rare earth doped nanoparticles
have also been employed in the field of nanotechnology (Bouzigues, Gacoin, &
Alexandrou, 2011).
1.7 Applications of Metallic Nanoparticles in Various Fields
The quantum size effect and high absorption coefficient related to excitation of surface
plasmon of MNPs opens a door for a broad range of applications in many fields. The
probability to manipulate, amplify and concentrate light through surface plasmon at the
nanoscale offers to improve optical properties in a controlled way. Myriad of potential
applications of surface plasmon in various fields are reported in literature.
20
1.7.1 Biomedicines
NPs have very small size, comparable to biological objects such as viruses, DNA
molecules, bacteria and other cells. Therefore, it is possible to use NPs to treat these
microorganism by interacting individually and increase efficiency and specificity of
medical treatments. Moreover, gold and silver NPs are highly biocompatible and easily
functionalize with thiol, nitrogen and oxygen containing organic molecules. Therefore, in
vitro applications are well established.
1.7.1.1 Drug delivery
NPs are useful for the delivery of drugs that induce undesired effects on normal tissues.
Controlled drug delivery overcome these secondary effects. For the purpose, the surface of
the drug is covered with NPs that avoids interaction with non-targeted cells. As the drug
reaches the targeted cells, the coating is removed. It also helps to control the release rate
and improvement in the effectiveness of the drug.
1.7.2 Energy
The efficiency of photovoltaic cells can be increased by 10-15% by incorporating Ag and
Au NPs on the cell surface. The efficiency of electrical devices is highly dependent upon
size, shape and spatial distribution of the NPs because interacting effects of light scattering
and absorption processes are different with variations in above-mentioned parameters.
1.7.3 Environment
1.7.3.1 Catalysis
Metallic NPs also exhibit catalytic activity that can be improved upon light illumination to
excite SP. The excited electrons participate in the oxidation of the products that are adsorbed
on the catalytic surface. The catalytic surface efficiency will depend critically on the light
absorption process that in turn depends on the number of electrons or holes in the material.
1.7.3.2 Chemosensing
Chemosensor is defined as a molecule which generates a response in the presence of
21
chemical stimulus. Recently, extensive attention has been given to the molecular design of
fluorescent and/or colorimetric chemosensor. One or more macroscopic photophysical
properties (e.g. color and strength of fluorescence and UV–Vis absorption) alters with the
change in molecular design by addition of a target species (Z. Li & Zhang, 2006; Umali &
Anslyn, 2010). AgNPs are used to measure the modification in single nucleotide of DNA.
Dark DNA-Ag clusters were used for the detection of guanine rich sequence of DNA.
Silver nanoclusters are used for the specific detection of cysteine in presence of other
amino acids. Our group used T-lymphocytes with pyridinium thioacetate capped AgNPs
detection of copper in real samples (Anwar, Shah, Muhammad, Afridi, & Ali, 2016).
A major challenge affecting the development of chemosensing protocol is the fabrication of
sensing elements that specifically distinguish analyte molecule in a group of structurally
similar molecules. The popularity of a design system is determined by the comparative ease
by which it is improved to many applications.
Various techniques including UV-visible spectroscopy, fluorescence spectroscopy,
voltammetry and FTIR are used to determine the efficiency of NPs as a sensor.
1.8 Synthetic Approaches of Nanoparticles
Nanotechnology manipulates matter at atomic or molecular level in which at least one
dimension is above 1 nm and below 100 nm because quantum statistical and mechanical
effects of a system becomes more pronounced and significant at the size of 100 nm. All the
physical properties such as mechanical, electrical, and optical properties are different from
the macroscopic systems due to quantum size effect at nanoscale e.g., stable materials like
aluminum becomes combustible; insoluble gold becomes soluble; opaque copper converts
to transparent and inert gold becomes a robust catalyst. Nanoparticles can be synthesized
by the following approaches
Top down approach
Bottom up approach
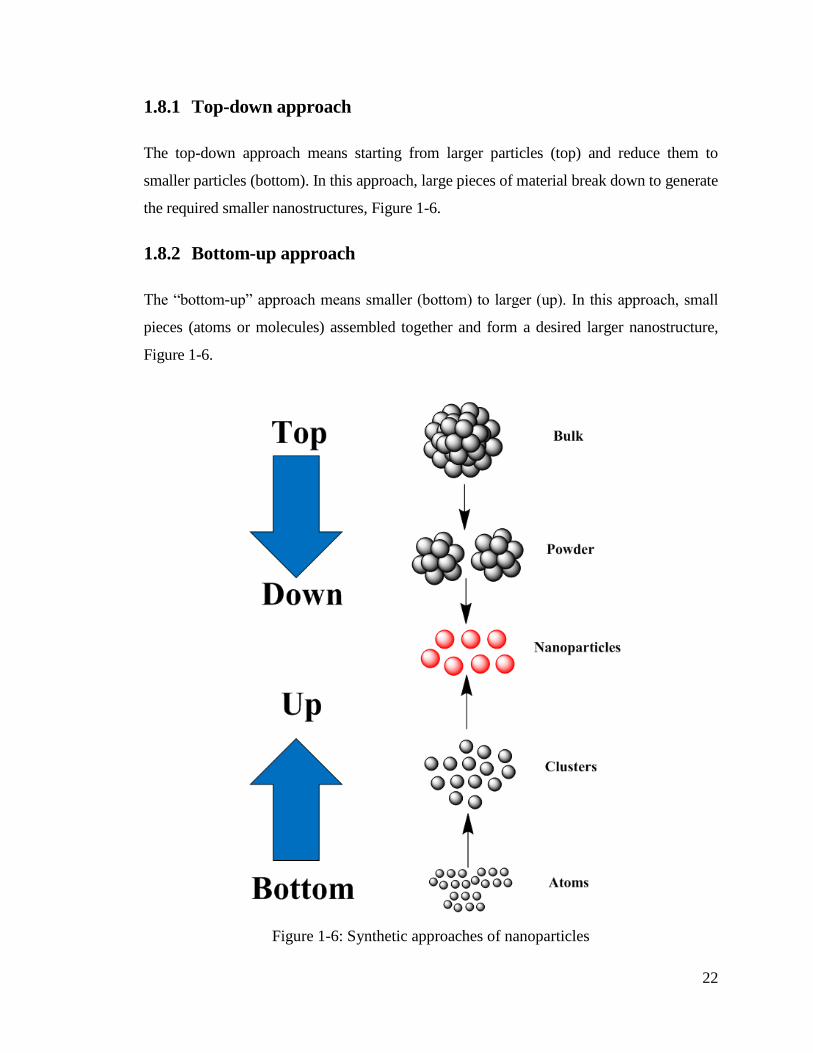
22
1.8.1 Top-down approach
The top-down approach means starting from larger particles (top) and reduce them to
smaller particles (bottom). In this approach, large pieces of material break down to generate
the required smaller nanostructures, Figure 1-6.
1.8.2 Bottom-up approach
The ―bottom-up‖ approach means smaller (bottom) to larger (up). In this approach, small
pieces (atoms or molecules) assembled together and form a desired larger nanostructure,
Figure 1-6.
Figure 1-6: Synthetic approaches of nanoparticles
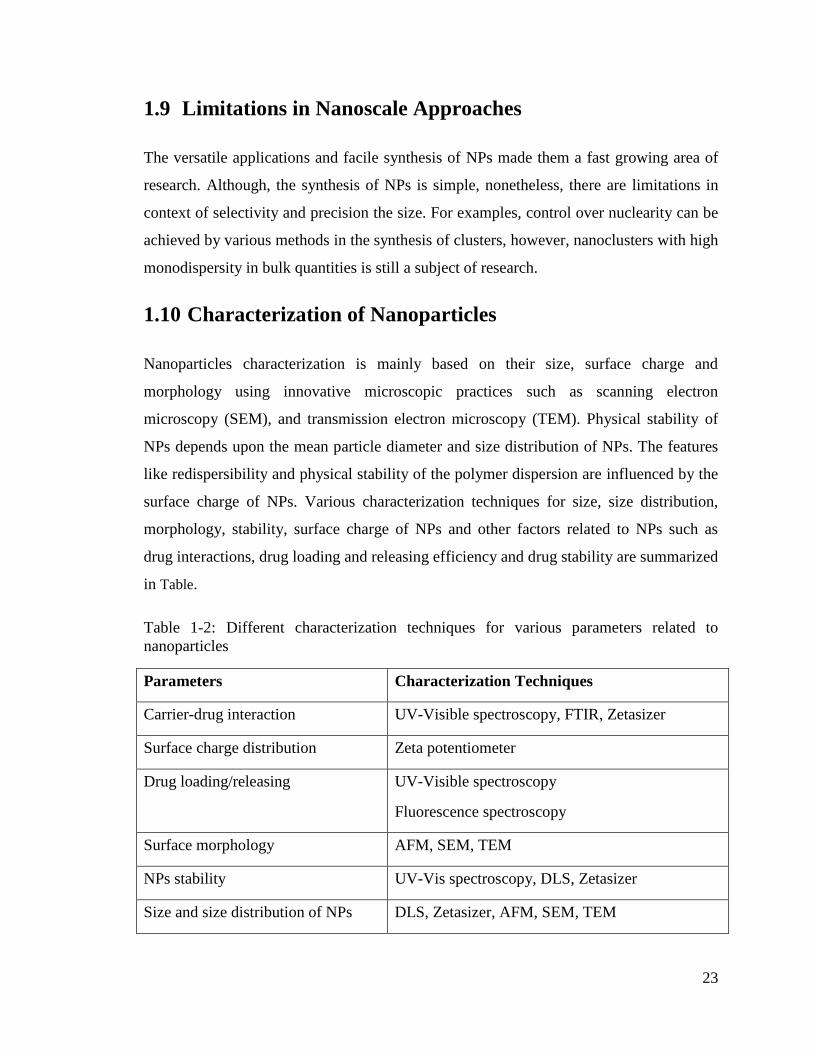
23
1.9 Limitations in Nanoscale Approaches
The versatile applications and facile synthesis of NPs made them a fast growing area of
research. Although, the synthesis of NPs is simple, nonetheless, there are limitations in
context of selectivity and precision the size. For examples, control over nuclearity can be
achieved by various methods in the synthesis of clusters, however, nanoclusters with high
monodispersity in bulk quantities is still a subject of research.
1.10 Characterization of Nanoparticles
Nanoparticles characterization is mainly based on their size, surface charge and
morphology using innovative microscopic practices such as scanning electron
microscopy (SEM), and transmission electron microscopy (TEM). Physical stability of
NPs depends upon the mean particle diameter and size distribution of NPs. The features
like redispersibility and physical stability of the polymer dispersion are influenced by the
surface charge of NPs. Various characterization techniques for size, size distribution,
morphology, stability, surface charge of NPs and other factors related to NPs such as
drug interactions, drug loading and releasing efficiency and drug stability are summarized
in Table.
Table 1-2: Different characterization techniques for various parameters related to
nanoparticles
Parameters Characterization Techniques
Carrier-drug interaction UV-Visible spectroscopy, FTIR, Zetasizer
Surface charge distribution Zeta potentiometer
Drug loading/releasing UV-Visible spectroscopy
Fluorescence spectroscopy
Surface morphology AFM, SEM, TEM
NPs stability UV-Vis spectroscopy, DLS, Zetasizer
Size and size distribution of NPs DLS, Zetasizer, AFM, SEM, TEM
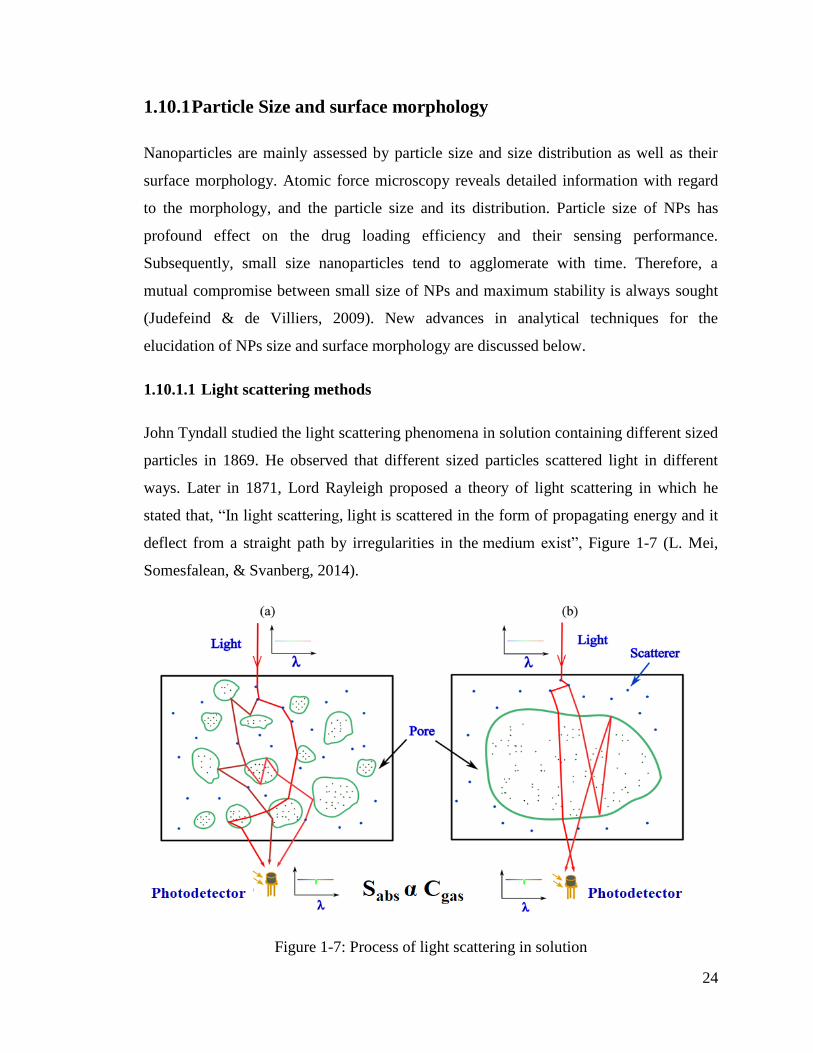
24
1.10.1 Particle Size and surface morphology
Nanoparticles are mainly assessed by particle size and size distribution as well as their
surface morphology. Atomic force microscopy reveals detailed information with regard
to the morphology, and the particle size and its distribution. Particle size of NPs has
profound effect on the drug loading efficiency and their sensing performance.
Subsequently, small size nanoparticles tend to agglomerate with time. Therefore, a
mutual compromise between small size of NPs and maximum stability is always sought
(Judefeind & de Villiers, 2009). New advances in analytical techniques for the
elucidation of NPs size and surface morphology are discussed below.
1.10.1.1 Light scattering methods
John Tyndall studied the light scattering phenomena in solution containing different sized
particles in 1869. He observed that different sized particles scattered light in different
ways. Later in 1871, Lord Rayleigh proposed a theory of light scattering in which he
stated that, ―In light scattering, light is scattered in the form of propagating energy and it
deflect from a straight path by irregularities in the medium exist‖, Figure 1-7 (L. Mei,
Somesfalean, & Svanberg, 2014).
Figure 1-7: Process of light scattering in solution
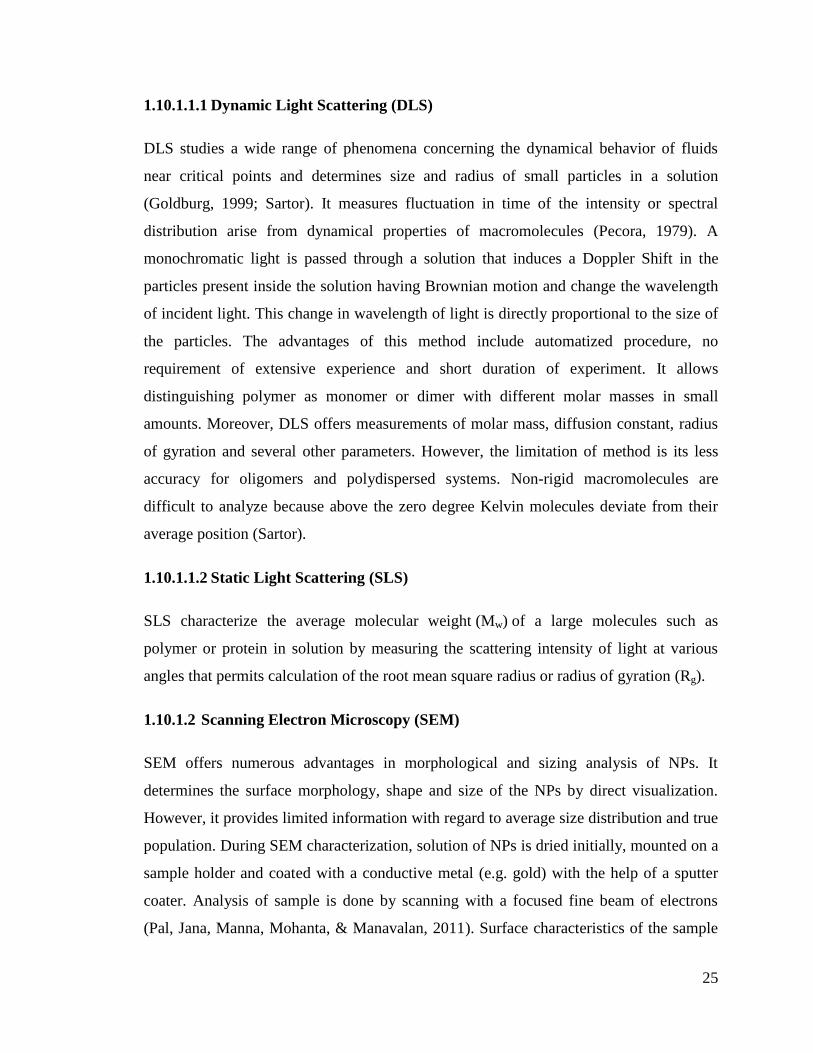
25
1.10.1.1.1 Dynamic Light Scattering (DLS)
DLS studies a wide range of phenomena concerning the dynamical behavior of fluids
near critical points and determines size and radius of small particles in a solution
(Goldburg, 1999; Sartor). It measures fluctuation in time of the intensity or spectral
distribution arise from dynamical properties of macromolecules (Pecora, 1979). A
monochromatic light is passed through a solution that induces a Doppler Shift in the
particles present inside the solution having Brownian motion and change the wavelength
of incident light. This change in wavelength of light is directly proportional to the size of
the particles. The advantages of this method include automatized procedure, no
requirement of extensive experience and short duration of experiment. It allows
distinguishing polymer as monomer or dimer with different molar masses in small
amounts. Moreover, DLS offers measurements of molar mass, diffusion constant, radius
of gyration and several other parameters. However, the limitation of method is its less
accuracy for oligomers and polydispersed systems. Non-rigid macromolecules are
difficult to analyze because above the zero degree Kelvin molecules deviate from their
average position (Sartor).
1.10.1.1.2 Static Light Scattering (SLS)
SLS characterize the average molecular weight (Mw) of a large molecules such as
polymer or protein in solution by measuring the scattering intensity of light at various
angles that permits calculation of the root mean square radius or radius of gyration (Rg).
1.10.1.2 Scanning Electron Microscopy (SEM)
SEM offers numerous advantages in morphological and sizing analysis of NPs. It
determines the surface morphology, shape and size of the NPs by direct visualization.
However, it provides limited information with regard to average size distribution and true
population. During SEM characterization, solution of NPs is dried initially, mounted on a
sample holder and coated with a conductive metal (e.g. gold) with the help of a sputter
coater. Analysis of sample is done by scanning with a focused fine beam of electrons
(Pal, Jana, Manna, Mohanta, & Manavalan, 2011). Surface characteristics of the sample
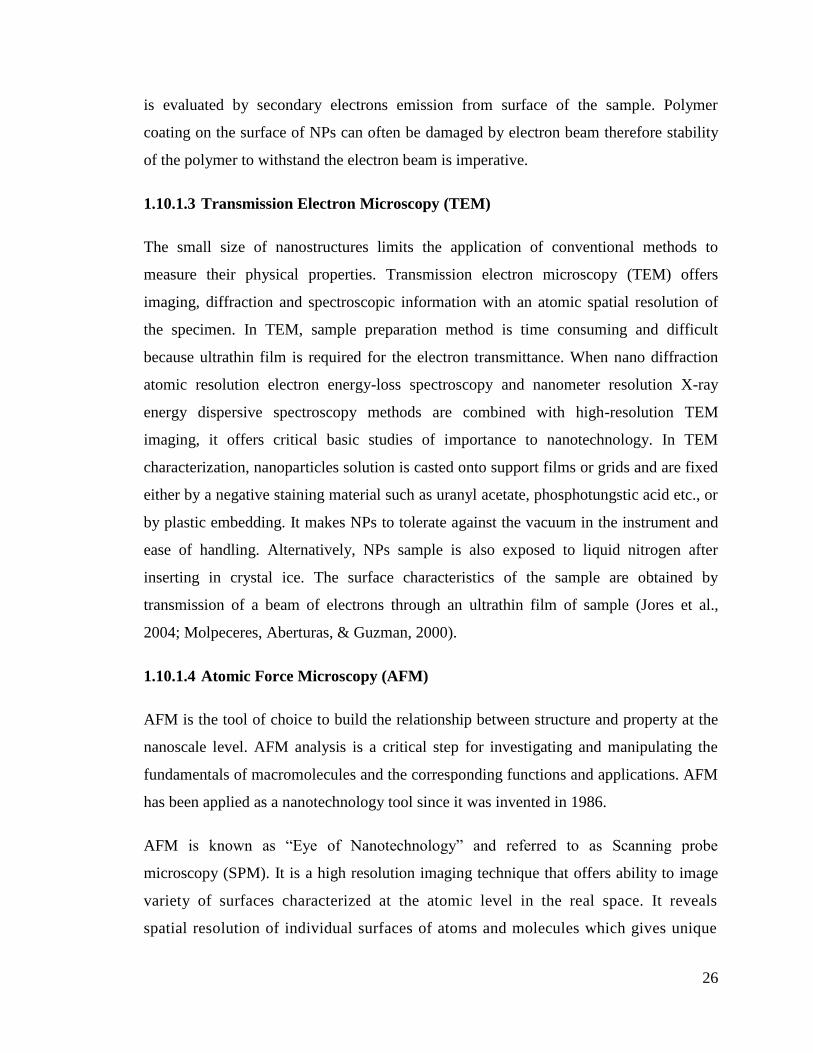
26
is evaluated by secondary electrons emission from surface of the sample. Polymer
coating on the surface of NPs can often be damaged by electron beam therefore stability
of the polymer to withstand the electron beam is imperative.
1.10.1.3 Transmission Electron Microscopy (TEM)
The small size of nanostructures limits the application of conventional methods to
measure their physical properties. Transmission electron microscopy (TEM) offers
imaging, diffraction and spectroscopic information with an atomic spatial resolution of
the specimen. In TEM, sample preparation method is time consuming and difficult
because ultrathin film is required for the electron transmittance. When nano diffraction
atomic resolution electron energy-loss spectroscopy and nanometer resolution X-ray
energy dispersive spectroscopy methods are combined with high-resolution TEM
imaging, it offers critical basic studies of importance to nanotechnology. In TEM
characterization, nanoparticles solution is casted onto support films or grids and are fixed
either by a negative staining material such as uranyl acetate, phosphotungstic acid etc., or
by plastic embedding. It makes NPs to tolerate against the vacuum in the instrument and
ease of handling. Alternatively, NPs sample is also exposed to liquid nitrogen after
inserting in crystal ice. The surface characteristics of the sample are obtained by
transmission of a beam of electrons through an ultrathin film of sample (Jores et al.,
2004; Molpeceres, Aberturas, & Guzman, 2000).
1.10.1.4 Atomic Force Microscopy (AFM)
AFM is the tool of choice to build the relationship between structure and property at the
nanoscale level. AFM analysis is a critical step for investigating and manipulating the
fundamentals of macromolecules and the corresponding functions and applications. AFM
has been applied as a nanotechnology tool since it was invented in 1986.
AFM is known as ―Eye of Nanotechnology‖ and referred to as Scanning probe
microscopy (SPM). It is a high resolution imaging technique that offers ability to image
variety of surfaces characterized at the atomic level in the real space. It reveals
spatial resolution of individual surfaces of atoms and molecules which gives unique
27
perspective for scientific technology. Ultimately it makes possible to conceptually
study single molecule chemistry (Atwood, 2009; Blanchard, 1996; Magonov et al., 1991).
It has much broader potential to image any conducting or non-conducting surface that
enhance their applications in the field of nanotechnology. AFM offers the ability to grasp
happening at atomic or molecular levels and lead to discoveries in other fields like life
science, polymer science, electrochemistry, nanotechnology, materials science,
biotechnology and biophysics.
AFM measures interactive forces as a function of distance between the sample and the
tip. This force and distance relationship is denoted by a force-distance curve. Usually, tip
is sharp and 3-6 um tall pyramid with end radius of 15-40 nm (Figure 1-8). AFM lateral
resolution is about ~30 nm and the vertical resolution is up to 0.1nm.
Figure 1-8: Schematic representation of basic principle of AFM
AFM can operate at ambient conditions and performed in three different modes, which
can be applied for achieving different purposes depending on the properties of sample
and final target.
28
1.10.1.4.1 Contact Mode
The tip drags on the surface of the sample and the curves on the surface are analyzed
either directly by deflection of the cantilever or the feedback signal that keep the
cantilever at a fix position because static signals are prone to drift and noise, Figure 1-9.
Cantilevers having a low spring constant, k are used to achieve enough deflection signals
while keeping the interaction force low. Near the sample surface attractive forces are
quite strong that cause the tip to snap-in to the surface. Consequently, this mode is used at
a depth where the overall force is repulsive.
Figure 1-9: Contact mode of AFM
1.10.1.4.2 Tapping Mode
Contact mode is not suitable for the liquid samples at ambient conditions because the tip
sticks to the surface. Tapping mode is developed in order to overcome this problem. In
this mode, the tip is close to the sample surface up to short-range forces to be detectable,
Figure 1-10. Nowadays, it is frequently used AFM mode for the liquid samples or the
samples need to be operate at ambient conditions. The phase images are recorded in
tapping mode that gives information about the morphology and size distribution of the
sample. Sample contains different adhesion regions of different properties and varying
stiffness generate a contrast that is not visible in the topographical images.
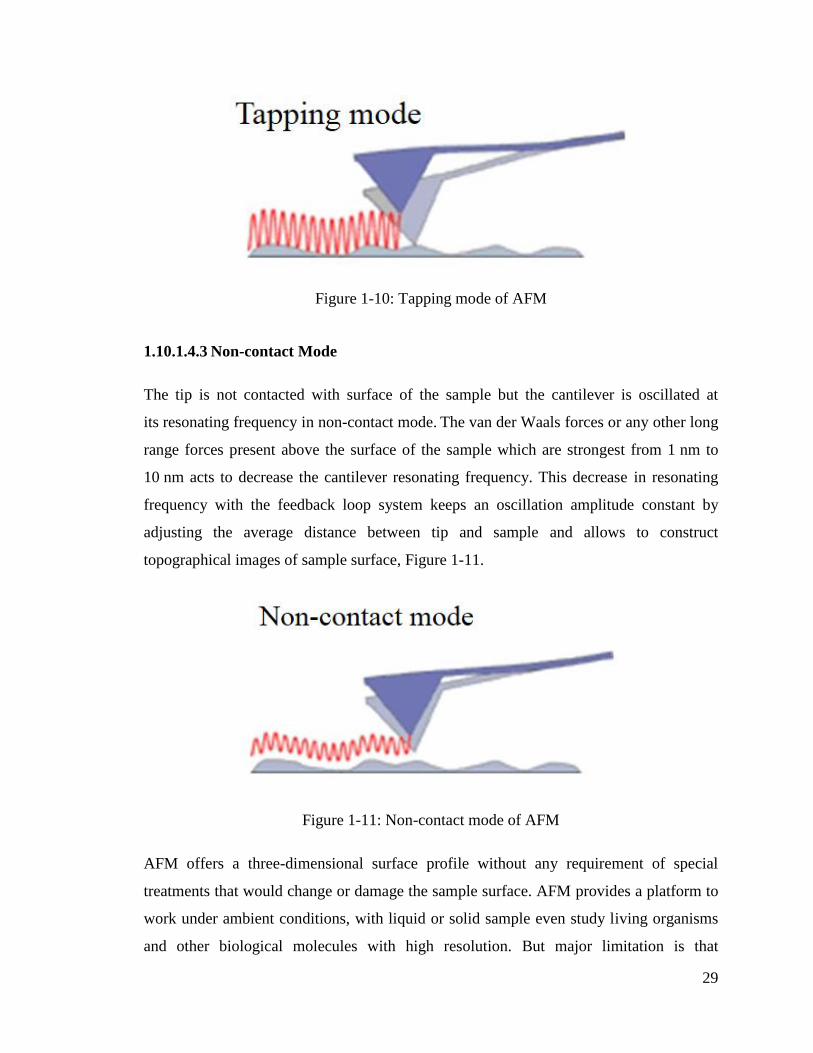
29
Figure 1-10: Tapping mode of AFM
1.10.1.4.3 Non-contact Mode
The tip is not contacted with surface of the sample but the cantilever is oscillated at
its resonating frequency in non-contact mode. The van der Waals forces or any other long
range forces present above the surface of the sample which are strongest from 1 nm to
10 nm acts to decrease the cantilever resonating frequency. This decrease in resonating
frequency with the feedback loop system keeps an oscillation amplitude constant by
adjusting the average distance between tip and sample and allows to construct
topographical images of sample surface, Figure 1-11.
Figure 1-11: Non-contact mode of AFM
AFM offers a three-dimensional surface profile without any requirement of special
treatments that would change or damage the sample surface. AFM provides a platform to
work under ambient conditions, with liquid or solid sample even study living organisms
and other biological molecules with high resolution. But major limitation is that
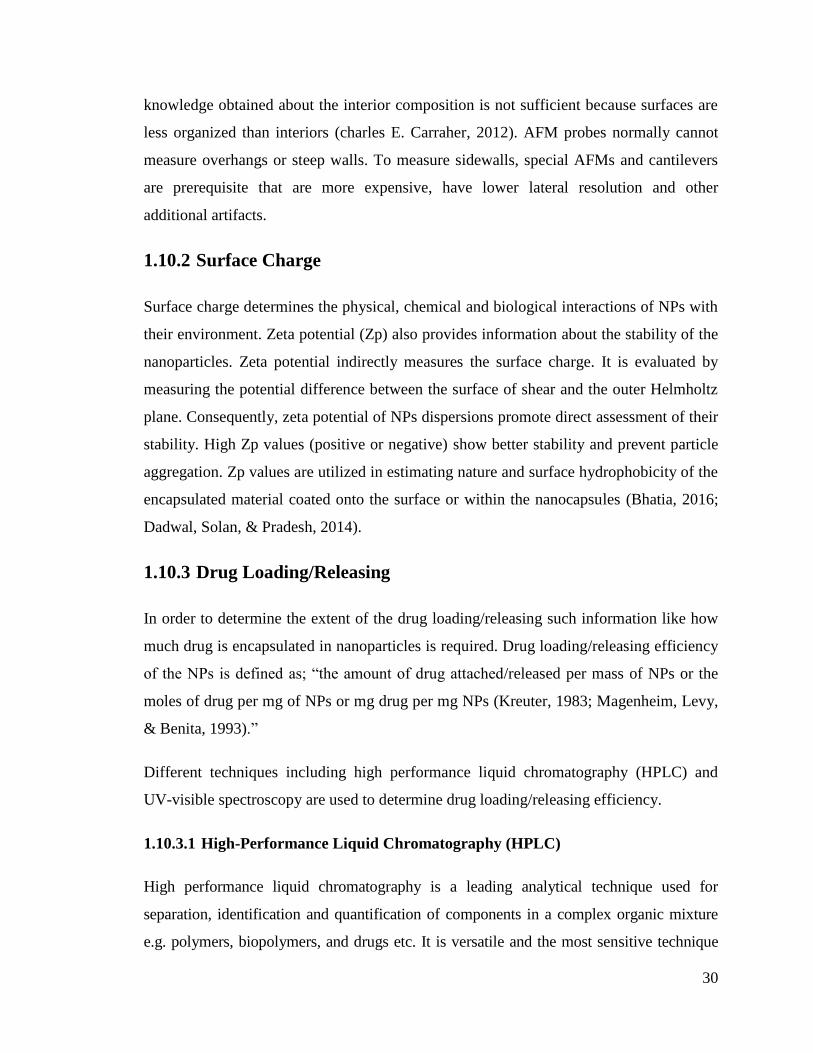
30
knowledge obtained about the interior composition is not sufficient because surfaces are
less organized than interiors (charles E. Carraher, 2012). AFM probes normally cannot
measure overhangs or steep walls. To measure sidewalls, special AFMs and cantilevers
are prerequisite that are more expensive, have lower lateral resolution and other
additional artifacts.
1.10.2 Surface Charge
Surface charge determines the physical, chemical and biological interactions of NPs with
their environment. Zeta potential (Zp) also provides information about the stability of the
nanoparticles. Zeta potential indirectly measures the surface charge. It is evaluated by
measuring the potential difference between the surface of shear and the outer Helmholtz
plane. Consequently, zeta potential of NPs dispersions promote direct assessment of their
stability. High Zp values (positive or negative) show better stability and prevent particle
aggregation. Zp values are utilized in estimating nature and surface hydrophobicity of the
encapsulated material coated onto the surface or within the nanocapsules (Bhatia, 2016;
Dadwal, Solan, & Pradesh, 2014).
1.10.3 Drug Loading/Releasing
In order to determine the extent of the drug loading/releasing such information like how
much drug is encapsulated in nanoparticles is required. Drug loading/releasing efficiency
of the NPs is defined as; ―the amount of drug attached/released per mass of NPs or the
moles of drug per mg of NPs or mg drug per mg NPs (Kreuter, 1983; Magenheim, Levy,
& Benita, 1993).‖
Different techniques including high performance liquid chromatography (HPLC) and
UV-visible spectroscopy are used to determine drug loading/releasing efficiency.
1.10.3.1 High-Performance Liquid Chromatography (HPLC)
High performance liquid chromatography is a leading analytical technique used for
separation, identification and quantification of components in a complex organic mixture
e.g. polymers, biopolymers, and drugs etc. It is versatile and the most sensitive technique
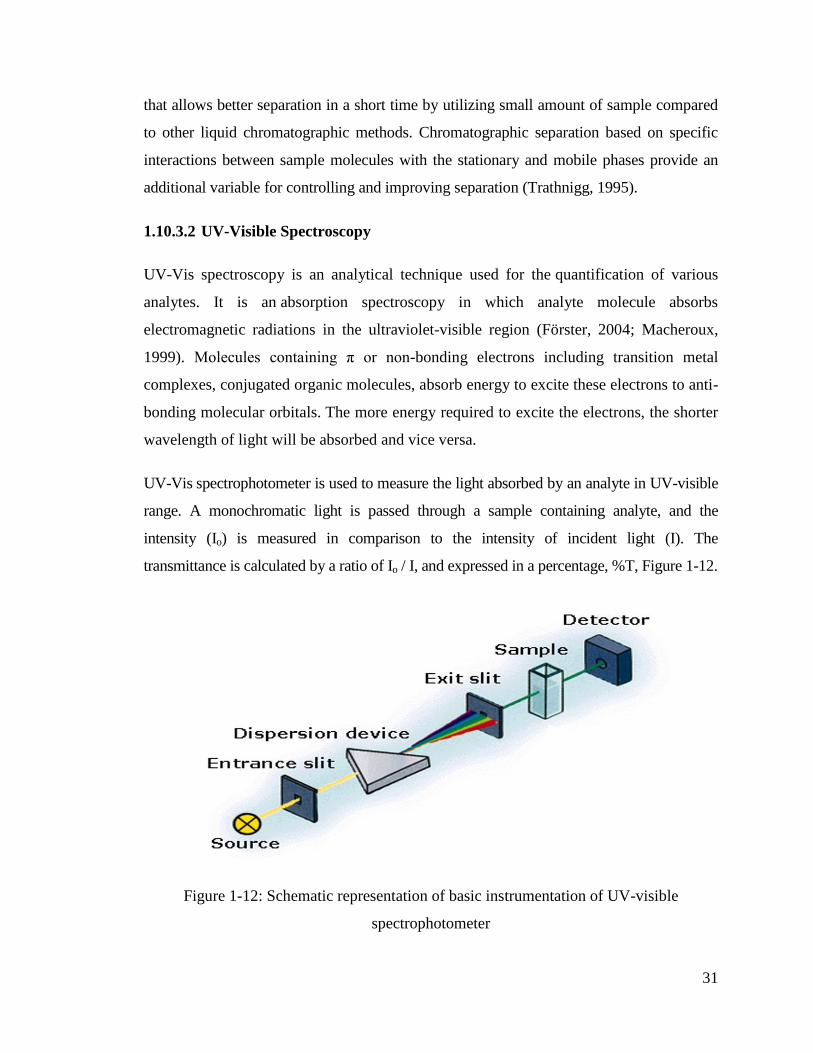
31
that allows better separation in a short time by utilizing small amount of sample compared
to other liquid chromatographic methods. Chromatographic separation based on specific
interactions between sample molecules with the stationary and mobile phases provide an
additional variable for controlling and improving separation (Trathnigg, 1995).
1.10.3.2 UV-Visible Spectroscopy
UV-Vis spectroscopy is an analytical technique used for the quantification of various
analytes. It is an absorption spectroscopy in which analyte molecule absorbs
electromagnetic radiations in the ultraviolet-visible region (Förster, 2004; Macheroux,
1999). Molecules containing π or non-bonding electrons including transition metal
complexes, conjugated organic molecules, absorb energy to excite these electrons to anti-
bonding molecular orbitals. The more energy required to excite the electrons, the shorter
wavelength of light will be absorbed and vice versa.
UV-Vis spectrophotometer is used to measure the light absorbed by an analyte in UV-visible
range. A monochromatic light is passed through a sample containing analyte, and the
intensity (Io) is measured in comparison to the intensity of incident light (I). The
transmittance is calculated by a ratio of Io / I, and expressed in a percentage, %T, Figure 1-12.
Figure 1-12: Schematic representation of basic instrumentation of UV-visible
spectrophotometer
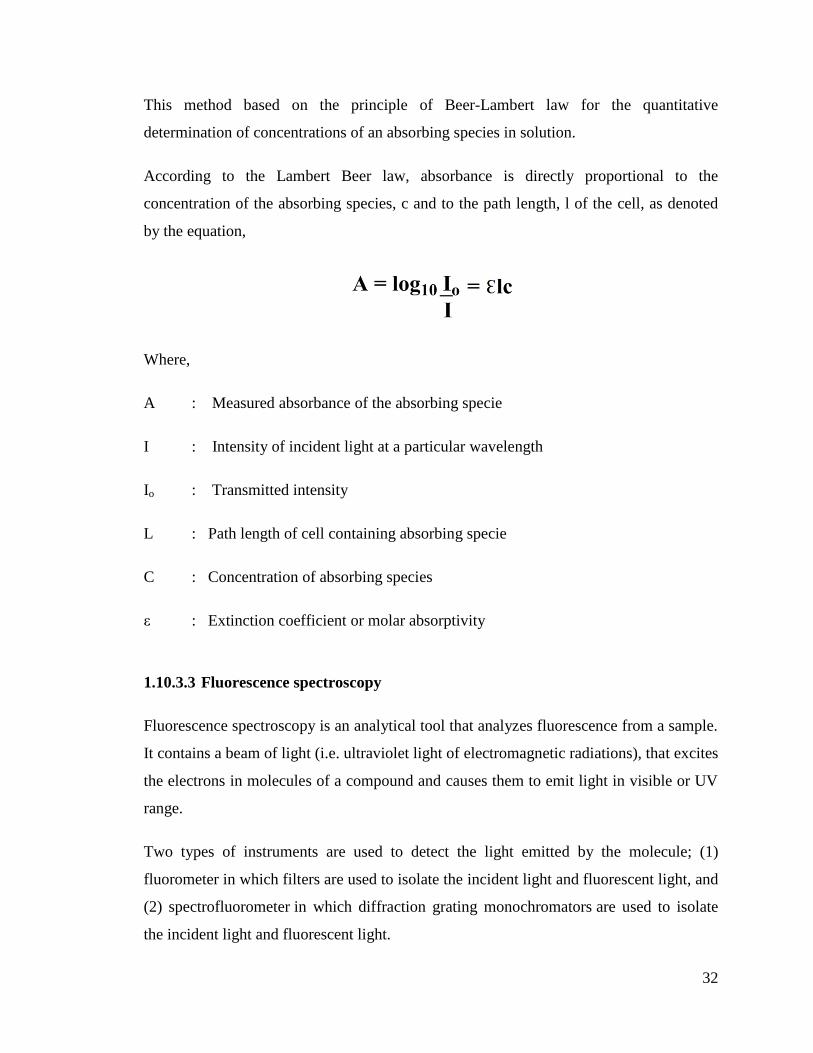
32
This method based on the principle of Beer-Lambert law for the quantitative
determination of concentrations of an absorbing species in solution.
According to the Lambert Beer law, absorbance is directly proportional to the
concentration of the absorbing species, c and to the path length, l of the cell, as denoted
by the equation,
Where,
A : Measured absorbance of the absorbing specie
I : Intensity of incident light at a particular wavelength
Io : Transmitted intensity
L : Path length of cell containing absorbing specie
C : Concentration of absorbing species
ε : Extinction coefficient or molar absorptivity
1.10.3.3 Fluorescence spectroscopy
Fluorescence spectroscopy is an analytical tool that analyzes fluorescence from a sample.
It contains a beam of light (i.e. ultraviolet light of electromagnetic radiations), that excites
the electrons in molecules of a compound and causes them to emit light in visible or UV
range.
Two types of instruments are used to detect the light emitted by the molecule; (1)
fluorometer in which filters are used to isolate the incident light and fluorescent light, and
(2) spectrofluorometer in which diffraction grating monochromators are used to isolate
the incident light and fluorescent light.
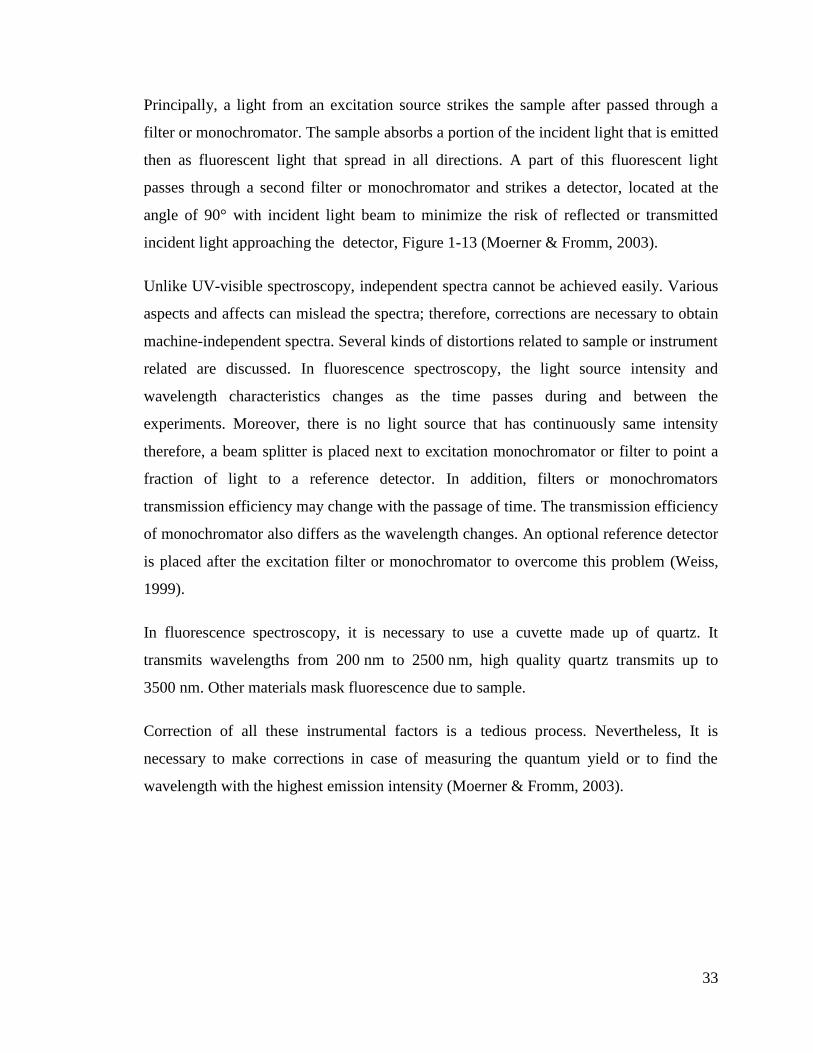
33
Principally, a light from an excitation source strikes the sample after passed through a
filter or monochromator. The sample absorbs a portion of the incident light that is emitted
then as fluorescent light that spread in all directions. A part of this fluorescent light
passes through a second filter or monochromator and strikes a detector, located at the
angle of 90° with incident light beam to minimize the risk of reflected or transmitted
incident light approaching the detector, Figure 1-13 (Moerner & Fromm, 2003).
Unlike UV-visible spectroscopy, independent spectra cannot be achieved easily. Various
aspects and affects can mislead the spectra; therefore, corrections are necessary to obtain
machine-independent spectra. Several kinds of distortions related to sample or instrument
related are discussed. In fluorescence spectroscopy, the light source intensity and
wavelength characteristics changes as the time passes during and between the
experiments. Moreover, there is no light source that has continuously same intensity
therefore, a beam splitter is placed next to excitation monochromator or filter to point a
fraction of light to a reference detector. In addition, filters or monochromators
transmission efficiency may change with the passage of time. The transmission efficiency
of monochromator also differs as the wavelength changes. An optional reference detector
is placed after the excitation filter or monochromator to overcome this problem (Weiss,
1999).
In fluorescence spectroscopy, it is necessary to use a cuvette made up of quartz. It
transmits wavelengths from 200 nm to 2500 nm, high quality quartz transmits up to
3500 nm. Other materials mask fluorescence due to sample.
Correction of all these instrumental factors is a tedious process. Nevertheless, It is
necessary to make corrections in case of measuring the quantum yield or to find the
wavelength with the highest emission intensity (Moerner & Fromm, 2003).
34
Figure 1-13: Schematic representation of basic principle of fluorescence spectroscopy
1.10.3.4 Fourier Transforms Infrared Spectroscopy (FTIR)
FTIR is an effective analytical tool for the determination of functional groups in a solid,
liquid or gaseous sample. It also gives information about structure, chemical composition,
bonding arrangement between constituents at the molecular scale (charles E. Carraher,
2012). FTIR spectrometer can operate in transmission or reflection modes. The
transmission mode is applicable for quantitative analysis and reflection mode is used for
the characterization of molecules that are not soluble at room temperature. FTIR
spectrometer instantaneously offers high-spectral-resolution data over a broad spectral
range. FTIR is used in all applications, their improved speed and sensitivity have
unfastened different areas of application. FTIR has applications in chemistry, geology
and biology and material science. Moreover, a variability of instrumental and sampling
configurations of IR spectroscopy makes it a multipurpose characterization method for
measurement of structure-property relationship of complicated systems under different
environmental conditions (Bhargava, Wang, & Koenig, 2003; charles E. Carraher, 2012).
35
1.10.3.5 Voltammetry
A set of electro-analytical techniques used in analytical chemistry for the detection of
analyte to be electroactive in nature. Voltammetry, gives information related
to analyte by measuring the current change with applied potential. It provides the
analytical data in the form of a voltammogram, which is obtained by plotting the current
produced by an analyte versus the potential of the working electrode (Compton & Banks,
2007).
Recently, modern three electrode system is employed that contains a reference electrode
(Re), an auxillary electrode (Ae) and a working electrode (We). Working electrode at a
desired controlled potential is in contact with analyte making easy charge transfer to and
from the analyte. While a Re has a known reduction potential. Ae is used as a helper with
We that passes all the current to balance the current on working electrode.
Various voltammetric techniques are used for the qualitative and quantitative detection of
analyte. Among them cyclic voltammetry (CV) is one of the potentio-dynamic
electrochemical technique to measure electrochemical properties of an electroactive
species in solution. In CV, the working electrode potential (Wep) is ramped linearly vs
time. After the set potential is reached, the Wep is ramped reversibly to attain the initial
potential. These potential ramp cycles may be repeated several times as needed. To
obtain a cyclic voltammogram, current applied at working electrode is plotted vs the
applied voltage. The effectiveness of CV is reliant on an analyte under study. The analyte
should be redox active within the applied potential window (Kissinger & Heineman,
1983; Laviron, 1974; Nicholson, 1965).
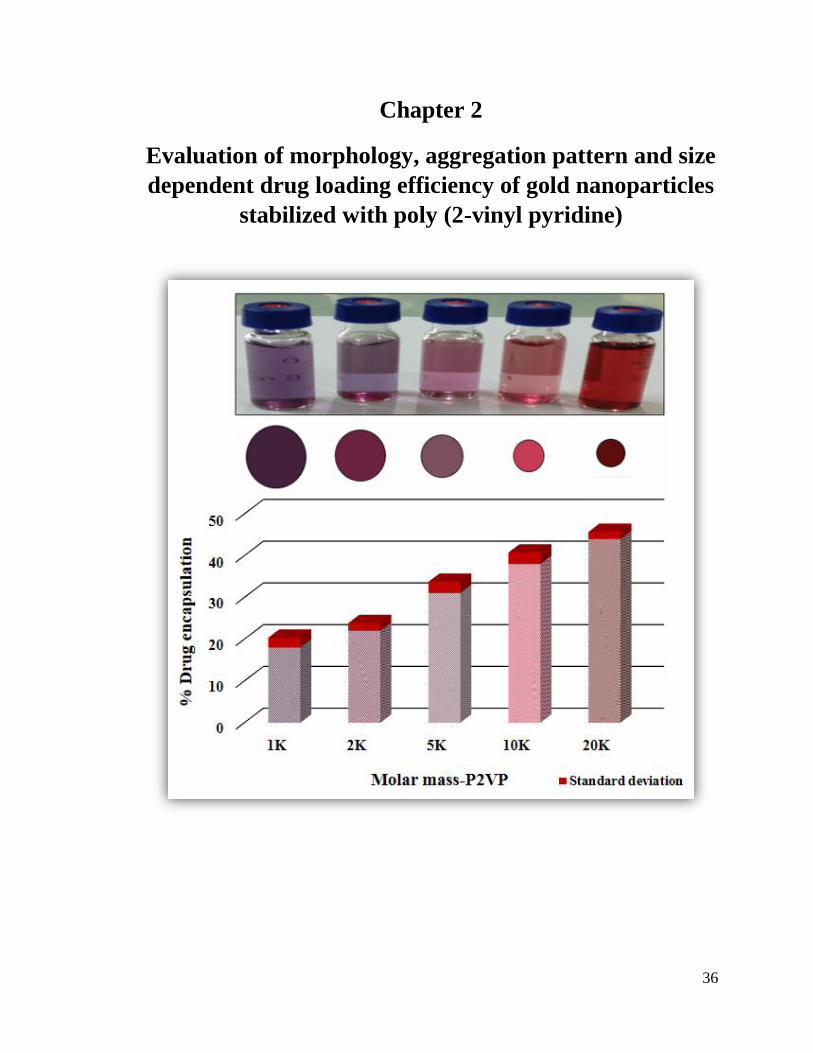
36
Chapter 2
Evaluation of morphology, aggregation pattern and size
dependent drug loading efficiency of gold nanoparticles
stabilized with poly (2-vinyl pyridine)
37
Abstract
Presence of basic nitrogen throughout the chain of poly(2-vinylpyridine) make them
alluring candidates for applications requiring chelation of heavy metals. In this study, we
report the use of poly (2-vinylpyridine) (P2VP) homopolymers of varying molar masses
for the stabilization of gold nanoparticles for the first time. A study based on AFM, DLS
and UV-visible spectroscopy was conducted to establish a correlation of the molar mass
of P2VP with the size and distribution of the gold nanoparticles. Systematic and gradual
change in the absorbance intensity and shift in SPR band of gold nanoparticles were also
observed upon variations in treatment temperature, concentration of polymer, residence
time, pH, and electrolyte concentration. The results obtained by UV-visible spectroscopy,
AFM and DLS are complementary. The size of the P2VP-stabilized AuNPs was found to
be in the range of 20-130 nms. At last, the effect of the size of P2VP-stabilized AuNPs
(directly related to the molar mass of P2VP) on the drug-loading efficiency is evaluated.
2 Introduction
Incorporating nanoparticles (NPs) into polymeric matrices is a practical pathway to
engineer advanced functional materials with improved optoelectronic and physico-
chemical properties. Polymer matrices control the spatial arrangement of entrapped
nanoparticles, consequently, well-defined and more stable structures at micro and
nanoscale are obtained (Balazs et al., 2006; Bockstaller et al., 2005; Fahmi, Pietsch,
Mendoza, & Cheval, 2009; Galatsis et al., 2010; Grzelczak, Vermant, Furst, & Liz-
Marzán, 2010; Haryono & Binder, 2006; Huh, Ginzburg, & Balazs, 2000; Kao,
Thorkelsson, Bai, Rancatore, & Xu, 2013; H.-C. Kim et al., 2009; Sarkar &
Alexandridis, 2015; Shenhar, Norsten, & Rotello, 2005; Vaia & Maguire, 2007; Zhang,
Liu, Yao, & Yang, 2012) Study of significantly different properties of nano-sized
particles compared to their bulk materials is a captivating topic of the scientific
research (Aurélien et al., 2014; Carotenuto et al., 2000; Y. Mei, Lu, Polzer, Ballauff, &
Drechsler, 2007; Weibel, Caseri, Suter, Kiess, & Wehrli, 1991). Physical properties and
applications of NPs strongly depend on the particle shape, size, inter-particle distance,
38
and nature of the protecting group. In addition, the exploitation of size-dependent
properties of NPs open new prospects towards the development of novel functional
materials, such as photonic devices (i.e. single-electron transistors, supercapacitors, and
data storage devices) (Bockstaller & Thomas, 2003; Cheng et al., 2001; H.-C. Kim et
al., 2009), high performance catalysis (Henry, 2000), and effective chemical or
biochemical sensors (Bruns & Tiller, 2005). These properties can be manipulated by
use of polymers and surfactants, through the immobilization and the assembly of the
nanoparticles in a suitable medium. Furthermore, nanoparticles of uniform size are
required for their better efficiency (Carotenuto, 2001; Carotenuto et al., 2000; Crooks et
al., 2001; B. J. Kim et al., 2006; B. J. Kim, Fredrickson, & Kramer, 2008; Lekesiz et
al., 2015; Luo, Zhang, Zeng, Zeng, & Wang, 2005; Y. Mei et al., 2007; Odegard,
Clancy, & Gates, 2005; Shan & Tenhu, 2007; Youk et al., 2002).
A number of organic materials such as low molecular weight (LMW) surfactants and
polymers have been used as protective agents for the preparation of AuNPs. Polymers
offer several advantages compared to LMW surfactants with respect to stability of the
self-organized structures, since the complexation of the polymer ligands with metal
particles is crucial before reduction and small amount of polymer reduces the particle size
dramatically (Abraham et al., 2007; Daniel & Astruc, 2004; Gandubert & Lennox, 2005b;
Perrault & Chan, 2009; Schaaff & Whetten, 2000; Shan & Tenhu, 2007; Toshima &
Yonezawa, 1998; Youk et al., 2002).
Polymer matrices offer control over particle size and also protect the surface of the
nanoparticles against aggregation. Controlled sizing and stability of polymer coated NPs
inspired several studies dedicated to novel synthetic routes for linking polymers to metal
nanoparticles, and the investigations of enhancement of properties and potential
applications of these hybrid materials (Bockstaller et al., 2005; Jiang et al., 2009b; H.-C.
Kim et al., 2009; Toshima & Yonezawa, 1998). Recently, metal nanoparticles, especially
gold nanoparticles (AuNPs), have been investigated extensively due to their unique
electronic, optical, catalytic properties and as well as new delivery vehicles for
biomedical applications. AuNPs have been used extensively for drug delivery, bio
imaging, diagnostic and other therapeutic applications because of their easy synthesis,
39
higher biocompatibility, lower toxicity and opportunity for surface modification (Gindy,
Panagiotopoulos, & Prud'homme, 2008; Pooja et al., 2015; Shukla et al., 2005).
Nanoparticles stabilized with polymer are particularly important for drug delivery owing
to their increased drug loading efficiency, biological stability, and extended in vivo
circulation (Kwon & Kataoka, 2012). Polyaspartic acid has been used as a reducing and
functionalizing agent for the synthesis of doxorubicin loaded gold nanoparticles
(Khandekar, Kulkarni, & Devarajan, 2014). Another research group used chitosan as
reducing/ stabilizing agent for stabilization of gold nanoparticles for insulin loading and
delivery (Bhumkar, Joshi, Sastry, & Pokharkar, 2007).
Polymers containing pyridine moiety have been used as a protective agent in the form of
ligands (Carotenuto et al., 2000; Lekesiz et al., 2015; Shan & Tenhu, 2007; Walker et al.,
2001). Poly(2-vinylpyridine) (P2VP) is an excellent candidate for coordination
chemistry. Nitrogen atoms of the pyridine moiety have strong affinity for the metal ions
and metallic nanoparticles, thus, restrains the aggregation of the metal nanoparticles
through steric stabilization (Jang et al., 2012; Lekesiz et al., 2015; Mössmer et al., 2000;
Voulgaris et al., 1999; Youk et al., 2002). Protective agent such as P2VP envelopes the
nanoparticles and any direct connection of metal particles to each other is impeded. In
conjunction with steric stabilization, P2VP prompts the reaction at ambient temperature
that results in reduction of particle size. A random coil conformation of P2VP in solution
may take part in some type of association with the metal atoms, therefore increasing the
probability of nucleus formation. Moreover, in the presence of P2VP average particles
size decreases along with the rate of spontaneous nucleation that results in higher number
of nuclei during the nucleation burst, consequently, total number of nanoparticles
increase (Carotenuto et al., 2000; Gandubert & Lennox, 2005b; Youk et al., 2002). There
are several studies of stabilization of NPs with block copolymer containing P2VP
(Bronstein et al., 1999; Gandubert & Lennox, 2005b; Jang et al., 2012; Ribbe, Okumura,
Matsushige, & Hashimoto, 2001; Yu et al., 2008). Up to best of our knowledge, P2VP
homopolymers have never been employed for stabilization of NPs.
In this study, we report on stabilization of gold nanoparticles by P2VP homopolymers of
varying molar masses. The effect of molar mass on the size and distribution of gold
40
nanoparticles is investigated systematically. Gold nanoparticles are prepared by reduction
of tetrachloroauric acid trihydrate (HAuCl4.3H2O) with sodium borohydride at ambient
temperature in the presence of P2VP. Analyses of the prepared P2VP-stabilized AuNPs
were conducted by UV-Visible spectroscopy, AFM and DLS. Effect of different external
parameters such as residence time, concentration of polymers, temperature, pH and
concentration of salt on the size and stabilization of P2VP-stabilized AuNPs is evaluated.
At last, the effect of size of the AuNPs (directly related to molar mass of P2VP) on the
drug-loading efficiency is appraised.
2.1 Experimental
2.1.1 Materials and Instrumentation
Poly(2-vinylpyridine) (P2VP) of various molar masses were purchased from polymer
standards services (Mainz, Germany) (Table 2.1). Tetrachloroauric (III) acid trihydrate
(HAuCl4.3H2O) > 99.9 % (Sigma Aldrich, USA) was the starting material for the
synthesis of gold nanoparticles. NaBH4 >95.0 % (TCI, Tokyo, Japan) was used as
reducing agent for HAuCl4.3H2O and HPLC grade methanol >99.9 % (RCI Labscan
Limited, Thailand) was used as solvent. All the reagents were used without further
purification.
A digital pH meter model 510 (Oakton, Eutech, USA) equipped with a reference
Ag/AgCl electrode and a glass working electrode was used.
UV–visible spectra were recorded with a Shimadzu UV-1800 series spectrophotometer
(Kyoto, Japan) equipped with a double beam compartment operated at 1 cm path length
quartz cuvette. The wavelength range was from 190 nm to 800 nm.
FTIR spectra were recorded on a FTIR Bruker Vector 22 spectrometer (Germany) using
KBr pellet method. All the analyses were performed in the mid IR range (400-4000 cm-1
).
Ten scans were used to obtain the spectral resolution of 0.1 cm–1
.
Comparative corresponding radius distribution of P2VP-stabilized AuNPs were studied
by a dynamic light scattering (DLS) Laser Spectroscatter-201 system (RiNA GmbH
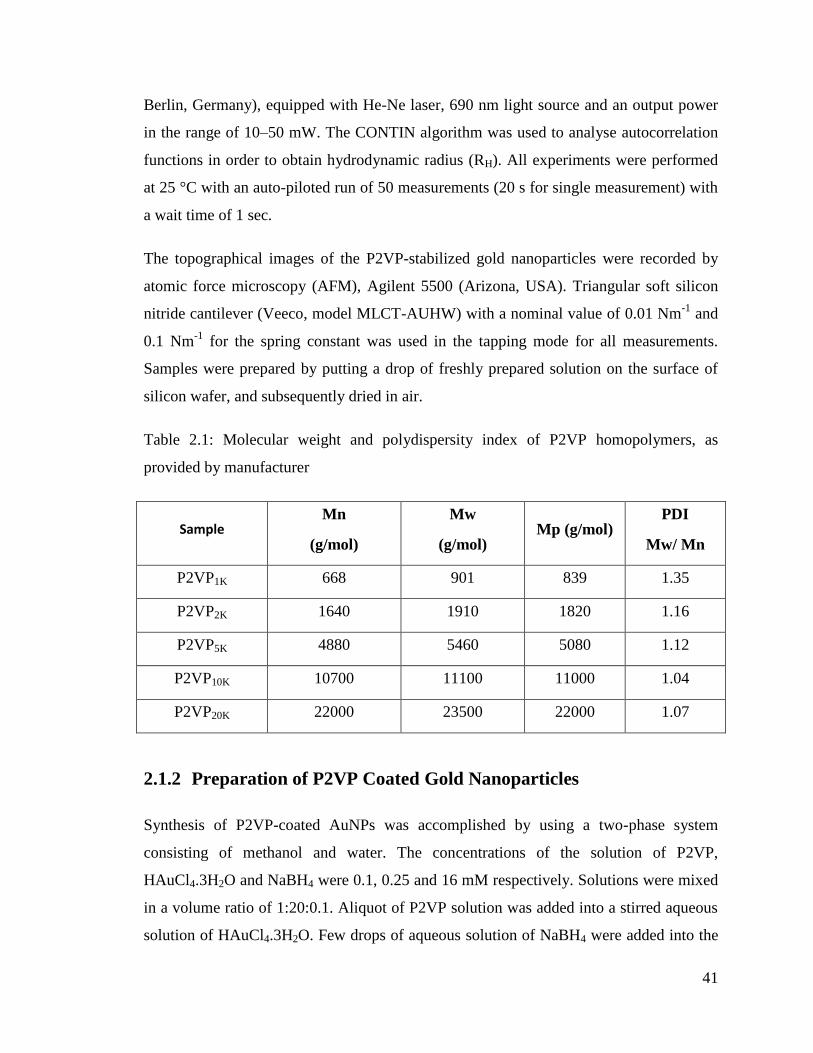
41
Berlin, Germany), equipped with He-Ne laser, 690 nm light source and an output power
in the range of 10–50 mW. The CONTIN algorithm was used to analyse autocorrelation
functions in order to obtain hydrodynamic radius (RH). All experiments were performed
at 25 °C with an auto-piloted run of 50 measurements (20 s for single measurement) with
a wait time of 1 sec.
The topographical images of the P2VP-stabilized gold nanoparticles were recorded by
atomic force microscopy (AFM), Agilent 5500 (Arizona, USA). Triangular soft silicon
nitride cantilever (Veeco, model MLCT-AUHW) with a nominal value of 0.01 Nm-1
and
0.1 Nm-1
for the spring constant was used in the tapping mode for all measurements.
Samples were prepared by putting a drop of freshly prepared solution on the surface of
silicon wafer, and subsequently dried in air.
Table 2.1: Molecular weight and polydispersity index of P2VP homopolymers, as
provided by manufacturer
Sample Mn
(g/mol)
Mw
(g/mol) Mp (g/mol)
PDI
Mw/ Mn
P2VP1K 668 901 839 1.35
P2VP2K 1640 1910 1820 1.16
P2VP5K 4880 5460 5080 1.12
P2VP10K 10700 11100 11000 1.04
P2VP20K 22000 23500 22000 1.07
2.1.2 Preparation of P2VP Coated Gold Nanoparticles
Synthesis of P2VP-coated AuNPs was accomplished by using a two-phase system
consisting of methanol and water. The concentrations of the solution of P2VP,
HAuCl4.3H2O and NaBH4 were 0.1, 0.25 and 16 mM respectively. Solutions were mixed
in a volume ratio of 1:20:0.1. Aliquot of P2VP solution was added into a stirred aqueous
solution of HAuCl4.3H2O. Few drops of aqueous solution of NaBH4 were added into the
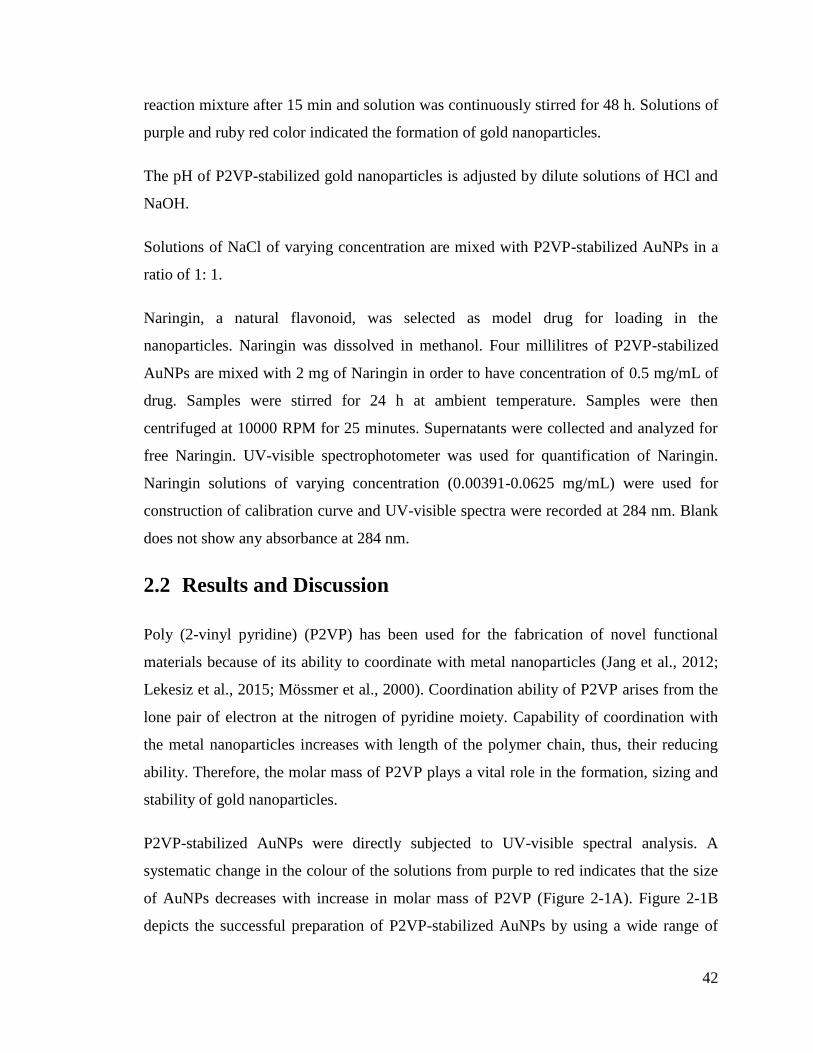
42
reaction mixture after 15 min and solution was continuously stirred for 48 h. Solutions of
purple and ruby red color indicated the formation of gold nanoparticles.
The pH of P2VP-stabilized gold nanoparticles is adjusted by dilute solutions of HCl and
NaOH.
Solutions of NaCl of varying concentration are mixed with P2VP-stabilized AuNPs in a
ratio of 1: 1.
Naringin, a natural flavonoid, was selected as model drug for loading in the
nanoparticles. Naringin was dissolved in methanol. Four millilitres of P2VP-stabilized
AuNPs are mixed with 2 mg of Naringin in order to have concentration of 0.5 mg/mL of
drug. Samples were stirred for 24 h at ambient temperature. Samples were then
centrifuged at 10000 RPM for 25 minutes. Supernatants were collected and analyzed for
free Naringin. UV-visible spectrophotometer was used for quantification of Naringin.
Naringin solutions of varying concentration (0.00391-0.0625 mg/mL) were used for
construction of calibration curve and UV-visible spectra were recorded at 284 nm. Blank
does not show any absorbance at 284 nm.
2.2 Results and Discussion
Poly (2-vinyl pyridine) (P2VP) has been used for the fabrication of novel functional
materials because of its ability to coordinate with metal nanoparticles (Jang et al., 2012;
Lekesiz et al., 2015; Mössmer et al., 2000). Coordination ability of P2VP arises from the
lone pair of electron at the nitrogen of pyridine moiety. Capability of coordination with
the metal nanoparticles increases with length of the polymer chain, thus, their reducing
ability. Therefore, the molar mass of P2VP plays a vital role in the formation, sizing and
stability of gold nanoparticles.
P2VP-stabilized AuNPs were directly subjected to UV-visible spectral analysis. A
systematic change in the colour of the solutions from purple to red indicates that the size
of AuNPs decreases with increase in molar mass of P2VP (Figure 2-1A). Figure 2-1B
depicts the successful preparation of P2VP-stabilized AuNPs by using a wide range of
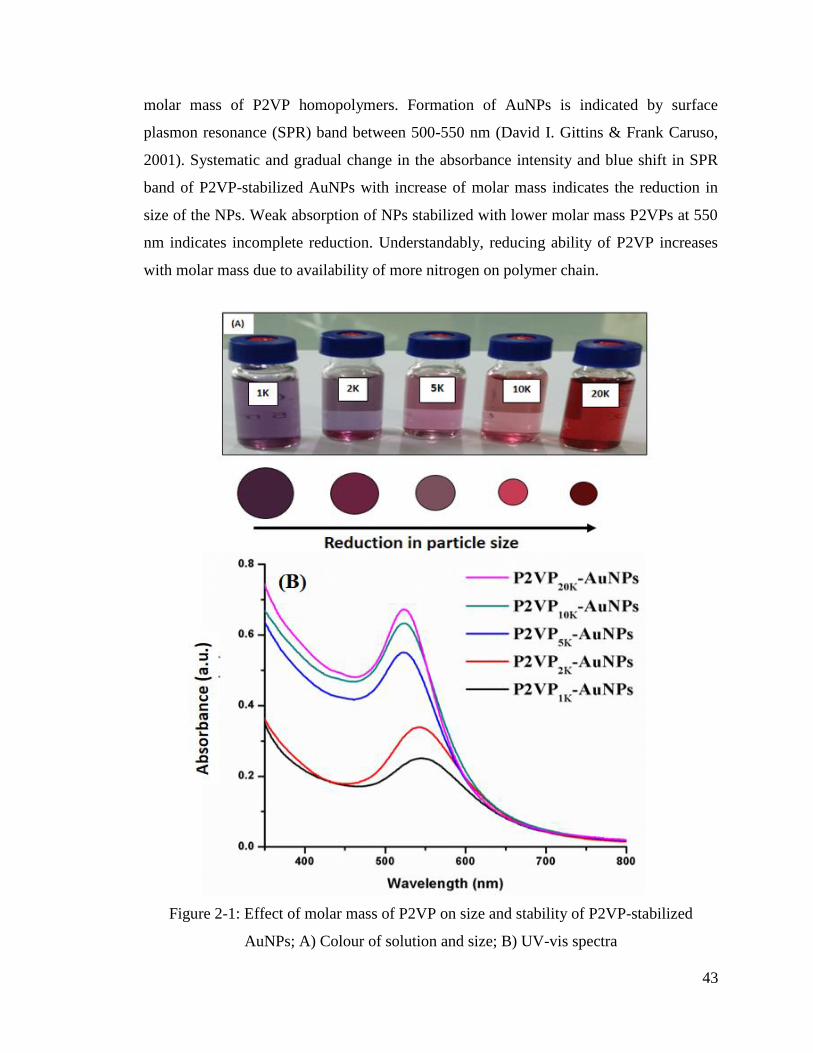
43
molar mass of P2VP homopolymers. Formation of AuNPs is indicated by surface
plasmon resonance (SPR) band between 500-550 nm (David I. Gittins & Frank Caruso,
2001). Systematic and gradual change in the absorbance intensity and blue shift in SPR
band of P2VP-stabilized AuNPs with increase of molar mass indicates the reduction in
size of the NPs. Weak absorption of NPs stabilized with lower molar mass P2VPs at 550
nm indicates incomplete reduction. Understandably, reducing ability of P2VP increases
with molar mass due to availability of more nitrogen on polymer chain.
Figure 2-1: Effect of molar mass of P2VP on size and stability of P2VP-stabilized
AuNPs; A) Colour of solution and size; B) UV-vis spectra
44
To confirm the formation of P2VP-stablized AuNPs, FTIR spectroscopy is employed.
Figure 2-2 illustrates a comparison of the FTIR spectra collected for AuNPs stabilized by
P2VP of varying molar masses. The stretching absorption band at 1589 cm-1
corresponds
to C-N bond of pyridine ring. Stabilization of AuNPs by P2VP is confirmed by
disappearance of peak at 1589 cm-1
. Shifting of peak to 1650 cm-1
might be the result of
interaction of gold with the basic nitrogen centers in the polymer backbone.
Figure 2-2: FTIR spectra of unstabilized AuNPs (> 10,000 nm), P2VP (5000 g/mol) and
P2VP-stabilized AuNPs
Furthermore, the size and morphology of P2VP-stabilized AuNPs is determined by
atomic force microscopy (AFM) and dynamic light scattering (DLS). Spherical shaped
P2VP-stabilized nanoparticles are widely separated for all the samples, Figure 2-3 A-E.
As can be noticed, size and polydispersity of P2VP-stabilized AuNPs decreased with
increase of the molar mass of P2VP. Dependence of the size of P2VP-stabilized AuNPs
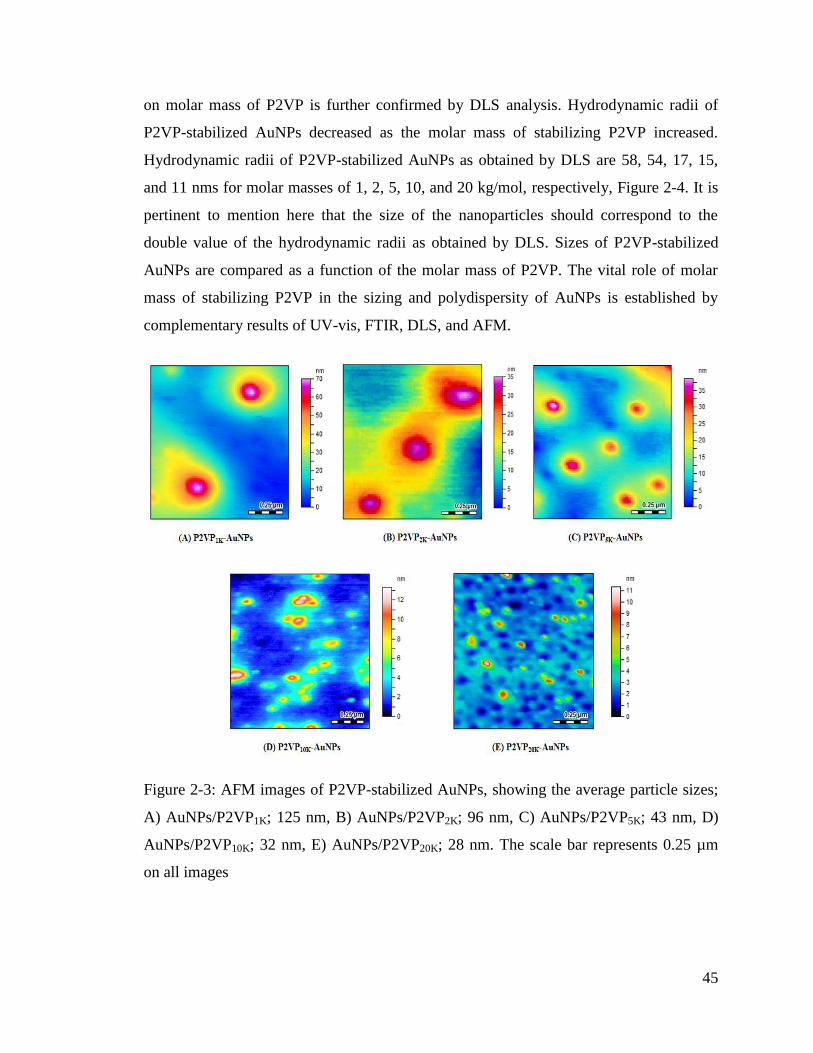
45
on molar mass of P2VP is further confirmed by DLS analysis. Hydrodynamic radii of
P2VP-stabilized AuNPs decreased as the molar mass of stabilizing P2VP increased.
Hydrodynamic radii of P2VP-stabilized AuNPs as obtained by DLS are 58, 54, 17, 15,
and 11 nms for molar masses of 1, 2, 5, 10, and 20 kg/mol, respectively, Figure 2-4. It is
pertinent to mention here that the size of the nanoparticles should correspond to the
double value of the hydrodynamic radii as obtained by DLS. Sizes of P2VP-stabilized
AuNPs are compared as a function of the molar mass of P2VP. The vital role of molar
mass of stabilizing P2VP in the sizing and polydispersity of AuNPs is established by
complementary results of UV-vis, FTIR, DLS, and AFM.
Figure 2-3: AFM images of P2VP-stabilized AuNPs, showing the average particle sizes;
A) AuNPs/P2VP1K; 125 nm, B) AuNPs/P2VP2K; 96 nm, C) AuNPs/P2VP5K; 43 nm, D)
AuNPs/P2VP10K; 32 nm, E) AuNPs/P2VP20K; 28 nm. The scale bar represents 0.25 µm
on all images
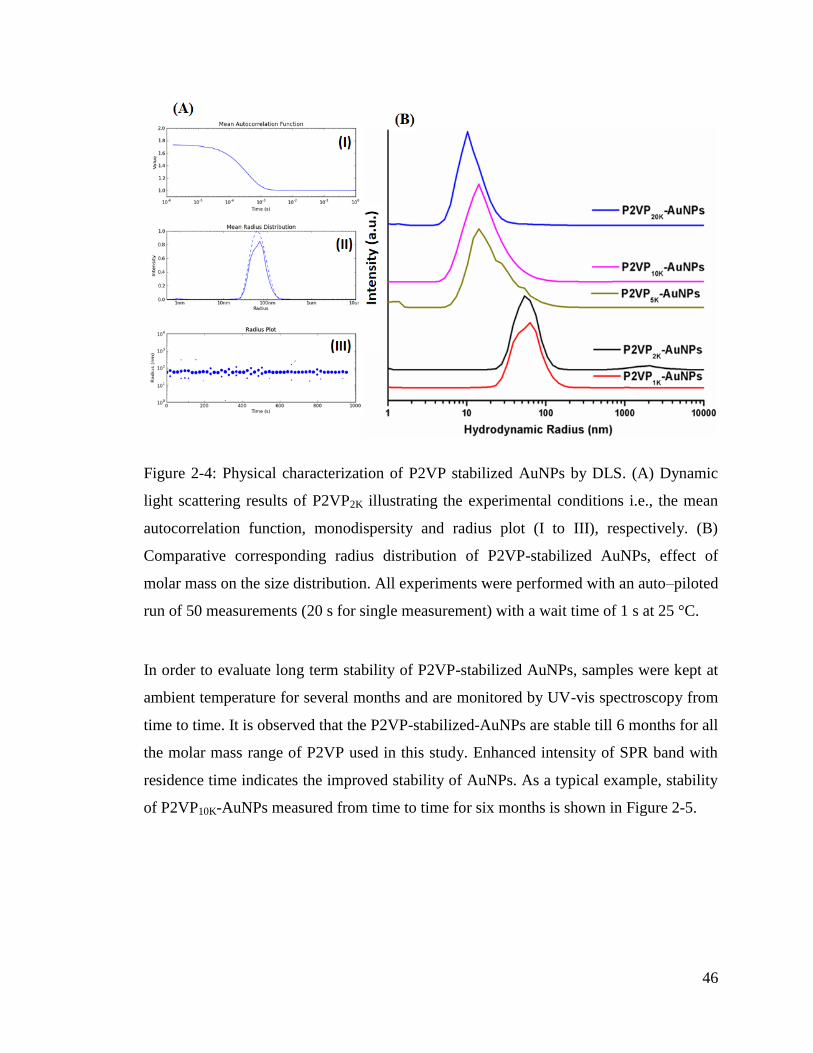
46
Figure 2-4: Physical characterization of P2VP stabilized AuNPs by DLS. (A) Dynamic
light scattering results of P2VP2K illustrating the experimental conditions i.e., the mean
autocorrelation function, monodispersity and radius plot (I to III), respectively. (B)
Comparative corresponding radius distribution of P2VP-stabilized AuNPs, effect of
molar mass on the size distribution. All experiments were performed with an auto–piloted
run of 50 measurements (20 s for single measurement) with a wait time of 1 s at 25 °C.
In order to evaluate long term stability of P2VP-stabilized AuNPs, samples were kept at
ambient temperature for several months and are monitored by UV-vis spectroscopy from
time to time. It is observed that the P2VP-stabilized-AuNPs are stable till 6 months for all
the molar mass range of P2VP used in this study. Enhanced intensity of SPR band with
residence time indicates the improved stability of AuNPs. As a typical example, stability
of P2VP10K-AuNPs measured from time to time for six months is shown in Figure 2-5.
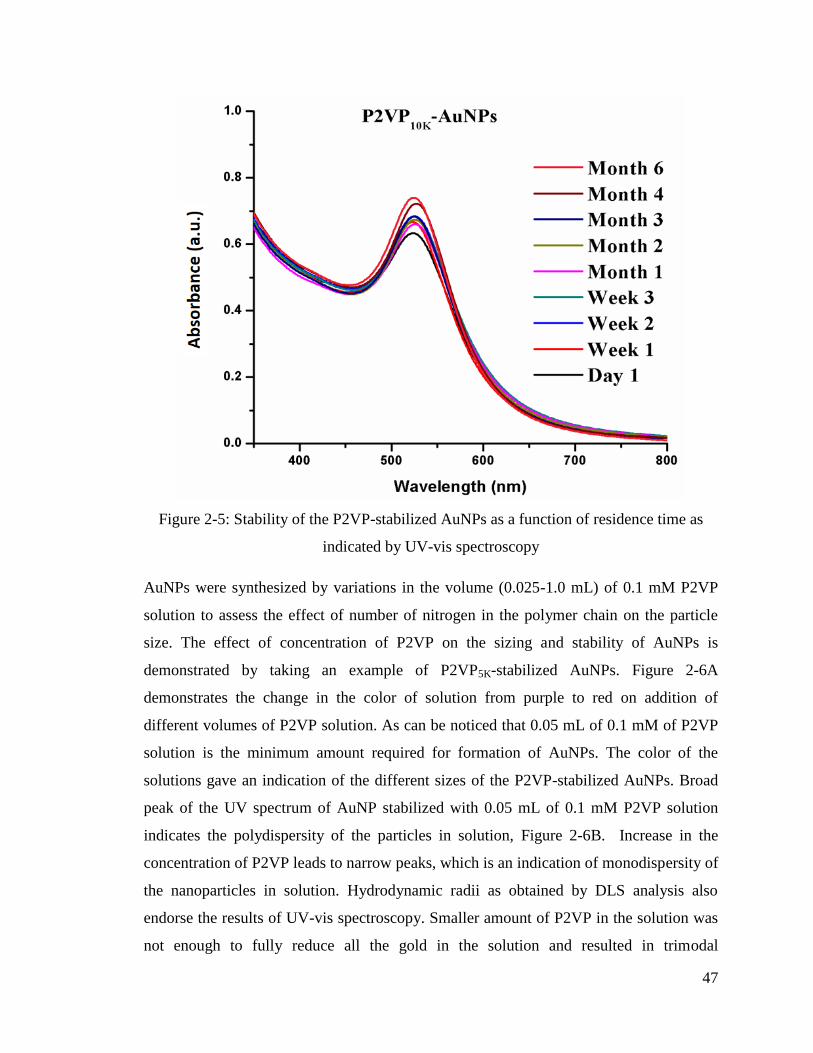
47
Figure 2-5: Stability of the P2VP-stabilized AuNPs as a function of residence time as
indicated by UV-vis spectroscopy
AuNPs were synthesized by variations in the volume (0.025-1.0 mL) of 0.1 mM P2VP
solution to assess the effect of number of nitrogen in the polymer chain on the particle
size. The effect of concentration of P2VP on the sizing and stability of AuNPs is
demonstrated by taking an example of P2VP5K-stabilized AuNPs. Figure 2-6A
demonstrates the change in the color of solution from purple to red on addition of
different volumes of P2VP solution. As can be noticed that 0.05 mL of 0.1 mM of P2VP
solution is the minimum amount required for formation of AuNPs. The color of the
solutions gave an indication of the different sizes of the P2VP-stabilized AuNPs. Broad
peak of the UV spectrum of AuNP stabilized with 0.05 mL of 0.1 mM P2VP solution
indicates the polydispersity of the particles in solution, Figure 2-6B. Increase in the
concentration of P2VP leads to narrow peaks, which is an indication of monodispersity of
the nanoparticles in solution. Hydrodynamic radii as obtained by DLS analysis also
endorse the results of UV-vis spectroscopy. Smaller amount of P2VP in the solution was
not enough to fully reduce all the gold in the solution and resulted in trimodal
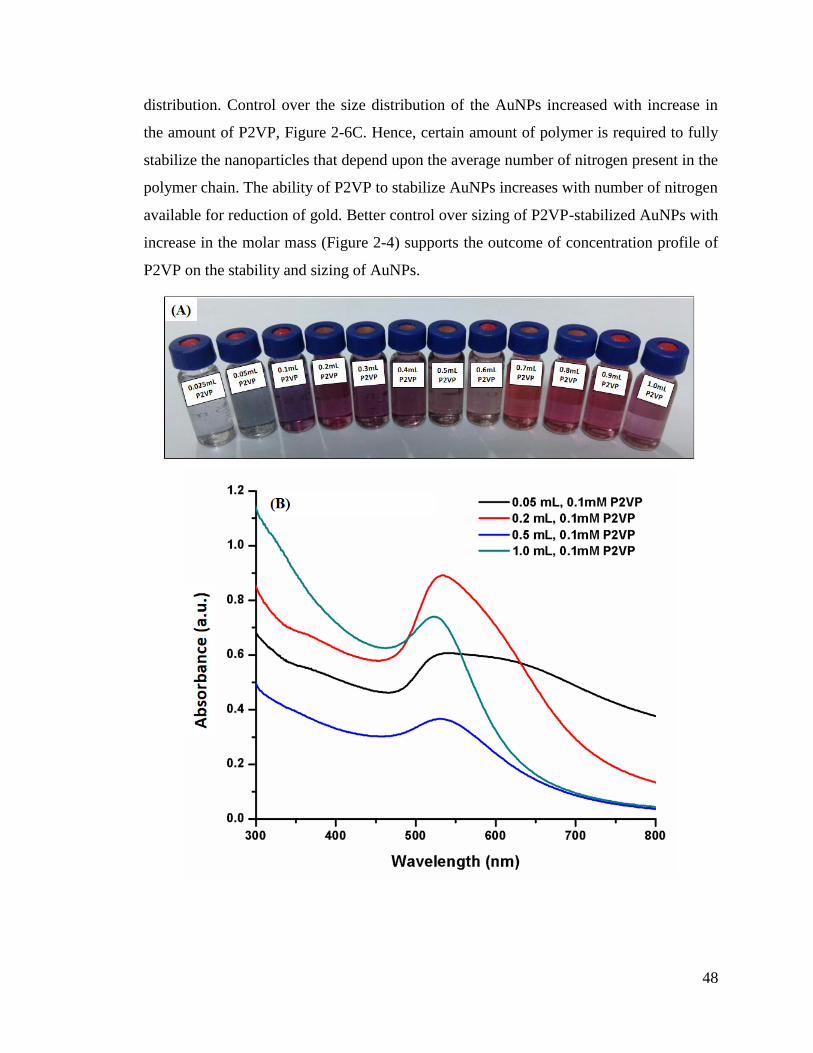
48
distribution. Control over the size distribution of the AuNPs increased with increase in
the amount of P2VP, Figure 2-6C. Hence, certain amount of polymer is required to fully
stabilize the nanoparticles that depend upon the average number of nitrogen present in the
polymer chain. The ability of P2VP to stabilize AuNPs increases with number of nitrogen
available for reduction of gold. Better control over sizing of P2VP-stabilized AuNPs with
increase in the molar mass (Figure 2-4) supports the outcome of concentration profile of
P2VP on the stability and sizing of AuNPs.
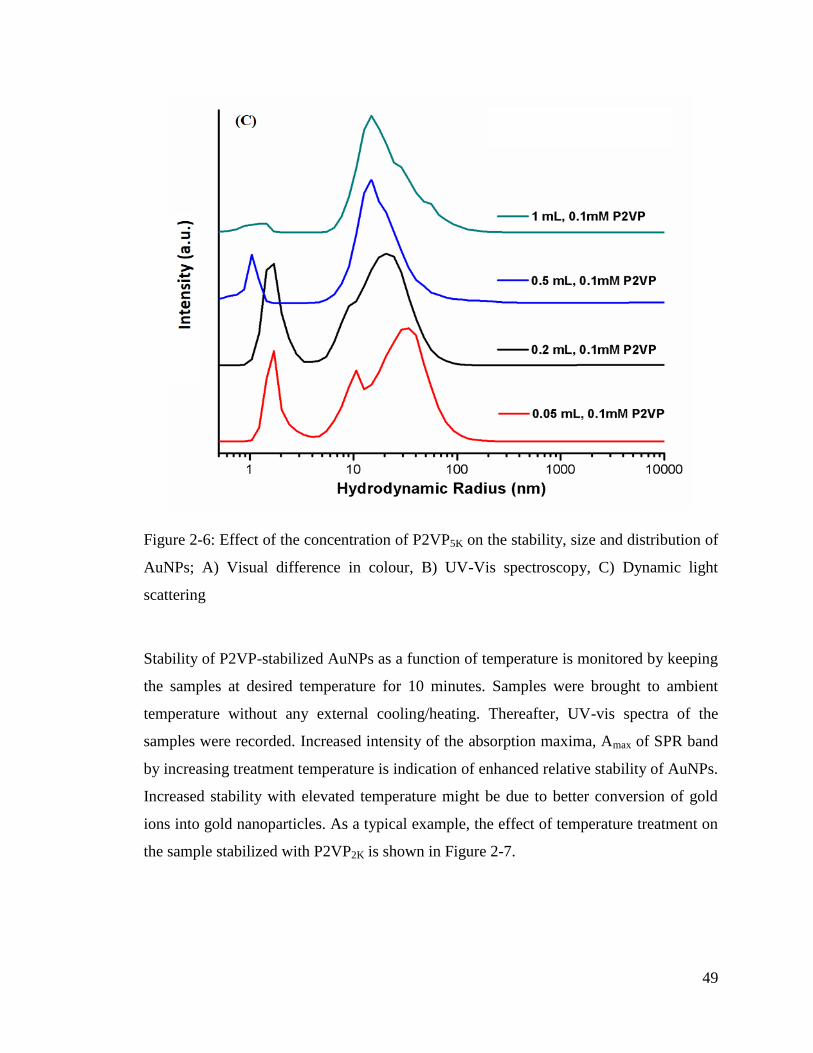
49
Figure 2-6: Effect of the concentration of P2VP5K on the stability, size and distribution of
AuNPs; A) Visual difference in colour, B) UV-Vis spectroscopy, C) Dynamic light
scattering
Stability of P2VP-stabilized AuNPs as a function of temperature is monitored by keeping
the samples at desired temperature for 10 minutes. Samples were brought to ambient
temperature without any external cooling/heating. Thereafter, UV-vis spectra of the
samples were recorded. Increased intensity of the absorption maxima, Amax of SPR band
by increasing treatment temperature is indication of enhanced relative stability of AuNPs.
Increased stability with elevated temperature might be due to better conversion of gold
ions into gold nanoparticles. As a typical example, the effect of temperature treatment on
the sample stabilized with P2VP2K is shown in Figure 2-7.
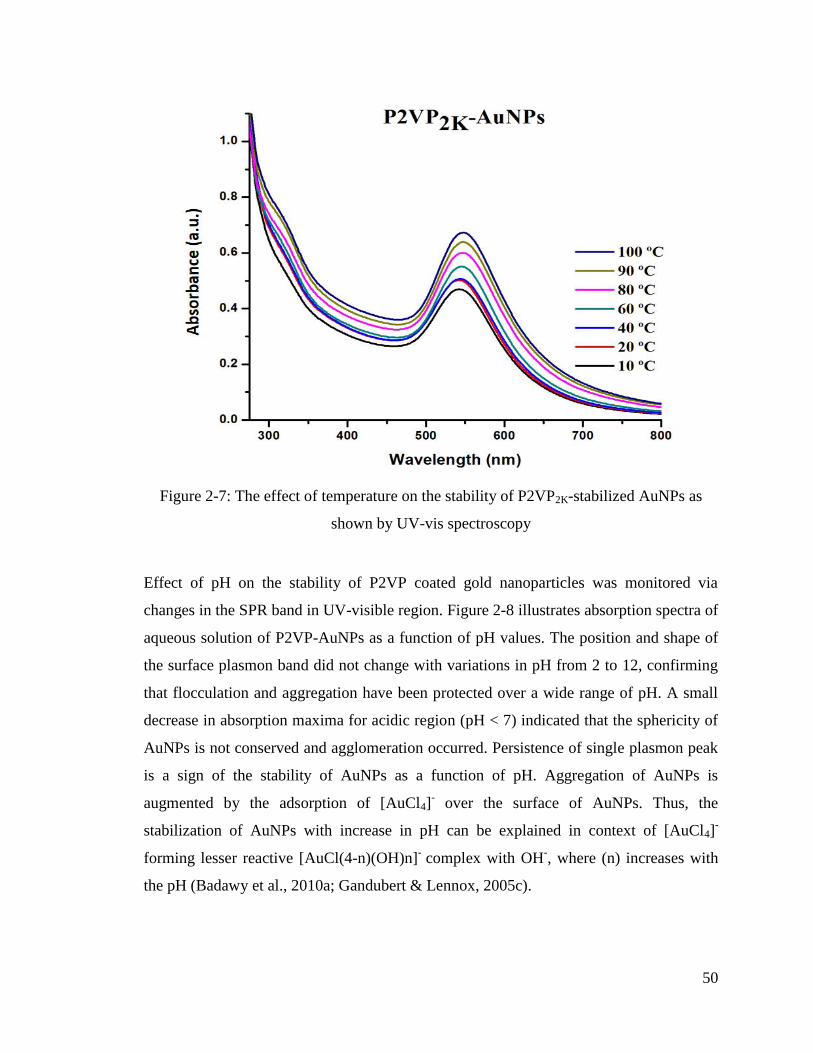
50
Figure 2-7: The effect of temperature on the stability of P2VP2K-stabilized AuNPs as
shown by UV-vis spectroscopy
Effect of pH on the stability of P2VP coated gold nanoparticles was monitored via
changes in the SPR band in UV-visible region. Figure 2-8 illustrates absorption spectra of
aqueous solution of P2VP-AuNPs as a function of pH values. The position and shape of
the surface plasmon band did not change with variations in pH from 2 to 12, confirming
that flocculation and aggregation have been protected over a wide range of pH. A small
decrease in absorption maxima for acidic region (pH < 7) indicated that the sphericity of
AuNPs is not conserved and agglomeration occurred. Persistence of single plasmon peak
is a sign of the stability of AuNPs as a function of pH. Aggregation of AuNPs is
augmented by the adsorption of [AuCl4]- over the surface of AuNPs. Thus, the
stabilization of AuNPs with increase in pH can be explained in context of [AuCl4]-
forming lesser reactive [AuCl(4-n)(OH)n]- complex with OH
-, where (n) increases with
the pH (Badawy et al., 2010a; Gandubert & Lennox, 2005c).
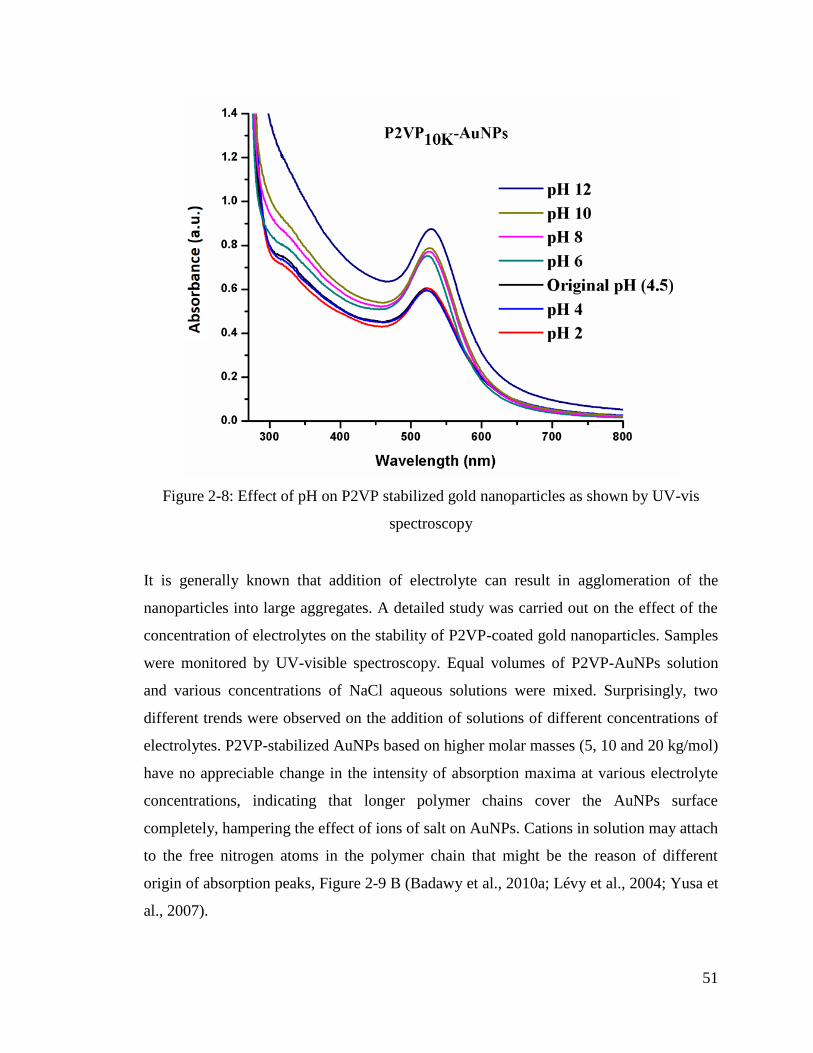
51
Figure 2-8: Effect of pH on P2VP stabilized gold nanoparticles as shown by UV-vis
spectroscopy
It is generally known that addition of electrolyte can result in agglomeration of the
nanoparticles into large aggregates. A detailed study was carried out on the effect of the
concentration of electrolytes on the stability of P2VP-coated gold nanoparticles. Samples
were monitored by UV-visible spectroscopy. Equal volumes of P2VP-AuNPs solution
and various concentrations of NaCl aqueous solutions were mixed. Surprisingly, two
different trends were observed on the addition of solutions of different concentrations of
electrolytes. P2VP-stabilized AuNPs based on higher molar masses (5, 10 and 20 kg/mol)
have no appreciable change in the intensity of absorption maxima at various electrolyte
concentrations, indicating that longer polymer chains cover the AuNPs surface
completely, hampering the effect of ions of salt on AuNPs. Cations in solution may attach
to the free nitrogen atoms in the polymer chain that might be the reason of different
origin of absorption peaks, Figure 2-9 B (Badawy et al., 2010a; Lévy et al., 2004; Yusa et
al., 2007).
52
AuNPs stabilized with P2VP of lower molar mass (1 and 2 kg/mol) behave differently by
addition of NaCl solutions of different concentrations, Figure 2-9 A. Enhanced stability
of P2VP-stabilized AuNPs by addition of dilute solutions is indicated by increase in the
absorption maximum. This may be due to high steric stabilization caused by smaller
chain lengths of P2VP. In polymer coated nanoparticles, steric repulsive forces and
electrostatic repulsive forces exist simultaneously. Combination of steric and electrostatic
forces allowed for the stabilization of nanoparticle dispersions over a wide size range, by
means of polymer coating containing one or more ionic charges. The electrostatic
repulsive forces are dominant over the attractive forces, and thus suppressing
agglomeration under such conditions leading to stable dispersions. However, for low
molar mass samples intensity of absorption maxima of P2VP-stabilized AuNPs decreased
as the concentration of electrolyte solution increased beyond 0.1 M. This means that the
energy barrier to prevent agglomeration decreased with increasing ionic strength of
solution (Gandubert & Lennox, 2005c; Jiang, Oberdörster, & Biswas, 2009a).
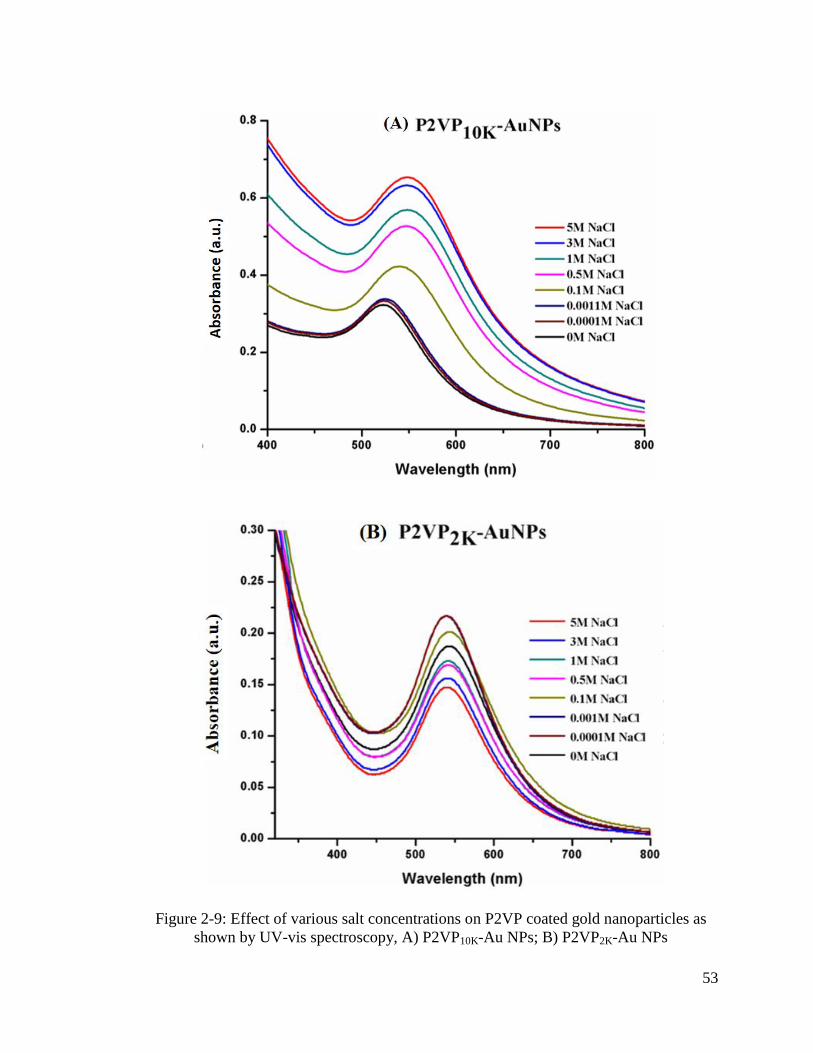
53
Figure 2-9: Effect of various salt concentrations on P2VP coated gold nanoparticles as
shown by UV-vis spectroscopy, A) P2VP10K-Au NPs; B) P2VP2K-Au NPs
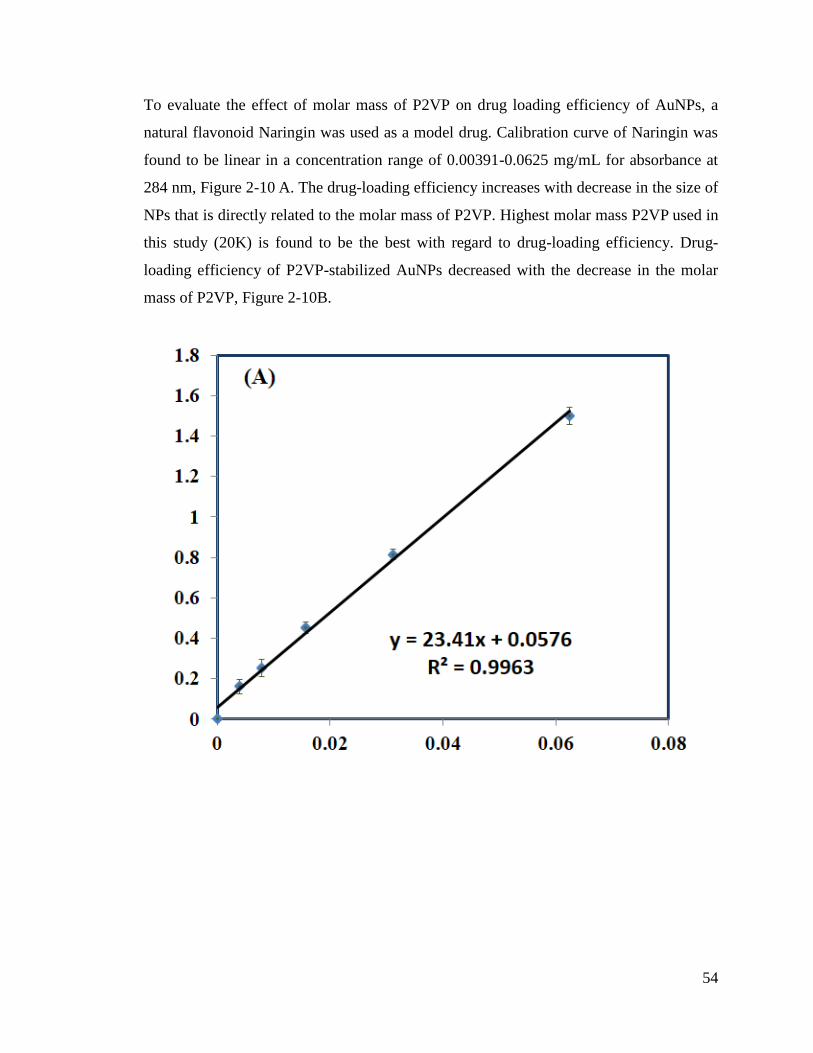
54
To evaluate the effect of molar mass of P2VP on drug loading efficiency of AuNPs, a
natural flavonoid Naringin was used as a model drug. Calibration curve of Naringin was
found to be linear in a concentration range of 0.00391-0.0625 mg/mL for absorbance at
284 nm, Figure 2-10 A. The drug-loading efficiency increases with decrease in the size of
NPs that is directly related to the molar mass of P2VP. Highest molar mass P2VP used in
this study (20K) is found to be the best with regard to drug-loading efficiency. Drug-
loading efficiency of P2VP-stabilized AuNPs decreased with the decrease in the molar
mass of P2VP, Figure 2-10B.
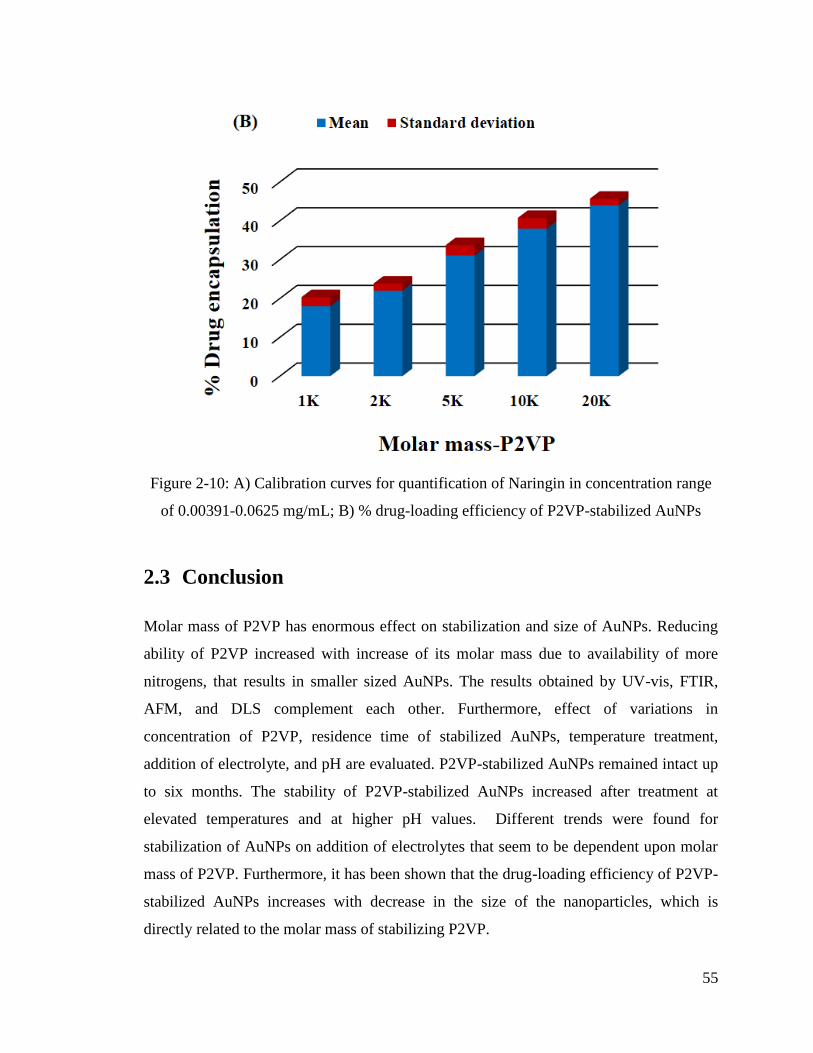
55
Figure 2-10: A) Calibration curves for quantification of Naringin in concentration range
of 0.00391-0.0625 mg/mL; B) % drug-loading efficiency of P2VP-stabilized AuNPs
2.3 Conclusion
Molar mass of P2VP has enormous effect on stabilization and size of AuNPs. Reducing
ability of P2VP increased with increase of its molar mass due to availability of more
nitrogens, that results in smaller sized AuNPs. The results obtained by UV-vis, FTIR,
AFM, and DLS complement each other. Furthermore, effect of variations in
concentration of P2VP, residence time of stabilized AuNPs, temperature treatment,
addition of electrolyte, and pH are evaluated. P2VP-stabilized AuNPs remained intact up
to six months. The stability of P2VP-stabilized AuNPs increased after treatment at
elevated temperatures and at higher pH values. Different trends were found for
stabilization of AuNPs on addition of electrolytes that seem to be dependent upon molar
mass of P2VP. Furthermore, it has been shown that the drug-loading efficiency of P2VP-
stabilized AuNPs increases with decrease in the size of the nanoparticles, which is
directly related to the molar mass of stabilizing P2VP.
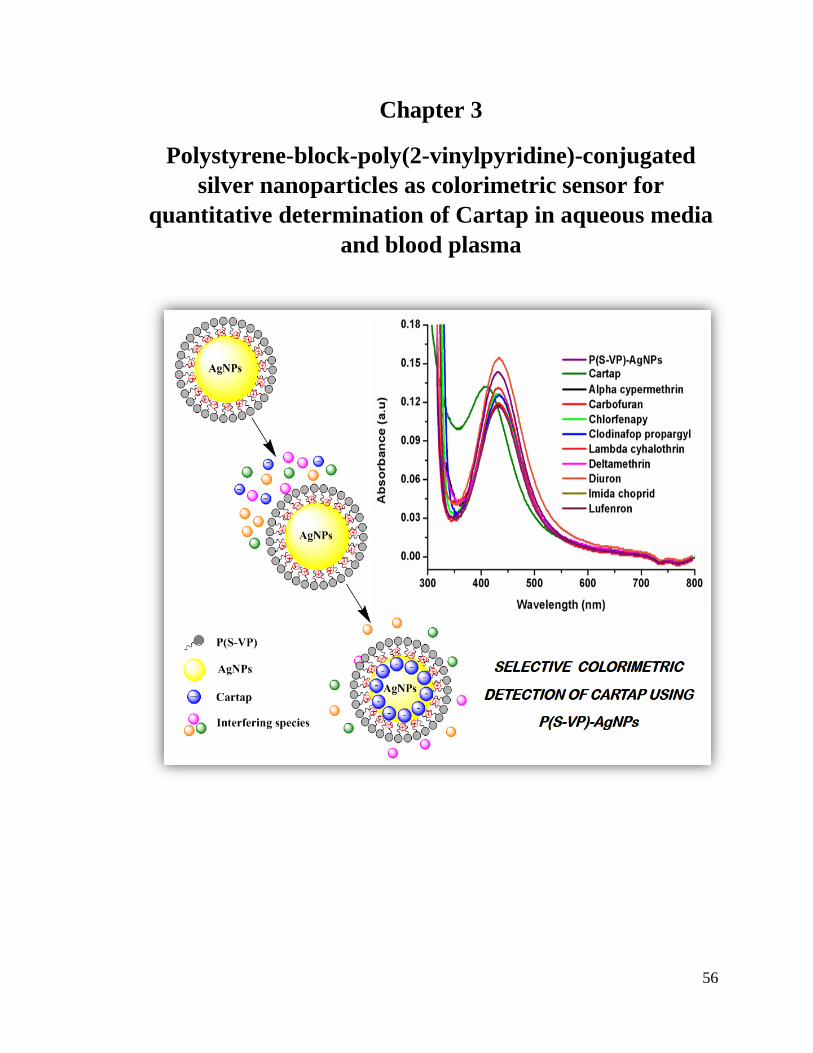
56
Chapter 3
Polystyrene-block-poly(2-vinylpyridine)-conjugated
silver nanoparticles as colorimetric sensor for
quantitative determination of Cartap in aqueous media
and blood plasma
57
Abstract
Development of novel materials for different analytical applications such as optical
sensors is one of the major topics of modern scientific research. In this study, a
nanosensor based on highly stable silver nanoparticles (AgNPs) conjugated with
polystyrene-block-poly(2-vinyl pyridine) [PS-b-P2VP or P(S-VP)] copolymer was
synthesized using two-phase one pot protocol. The nanosensor was characterized by UV-
visible spectroscopy, zetasizer, FTIR and AFM. Polystyrene-block-poly(2-vinylpyridine)-
conjugated silver nanoparticles [P(S-VP)-AgNPs] were further utilized as colorimetric
sensor for thiocarbamate pesticide, cartap. P(S-VP)-AgNPs nanosensor allowed for rapid
and quantitative detection of cartap in concentration range of 0.036-0.36 μgL−1
with
detection limit as low as 0.06 μgL−1
. The prepared sensor efficiently detected cartap in
presence of other interfering pesticides. P(S-VP)-AgNPs demonstrated great potential for
in situ detection of cartap in water and blood plasma.
3 Introduction
Use of pesticides in agriculture and other related fields is increasing significantly.
However, besides their beneficial effects for rapid and safe growth of crops, they can
persist in the environment to cause pollution. Presence of pesticides beyond their
acceptable limits in surface water is noticed in different cities of the world. Agricultural
run-off and vector control sprays are the major sources of unacceptable concentration of
pesticides in fresh water. These pesticides not only influence the aquatic life but also
have adverse effects to human beings. After intended application, many recalcitrant and
non-biodegradable pesticides survive in the environment for prolonged period of time
(Casida & Quistad, 1998; Y. Kim, Jung, Oh, & Choi, 2008). Water soluble pesticides
such as carbamates and thiocarbamtes are extensively used for safer and rapid growth of
agricultural and ornamental plants. Hence, development of simple, effective and
inexpensive analysis procedure is imperative for specific and quantitative detection of
pesticides in water. A number of techniques such as chromatography (Park et al., 2015),
electroanalysis (Everett & Rechnitz, 1998), photoluminescence (Yuan, Ma, & Xu, 2016)
58
and fluorescence (Ahmed, Khalid, Shah, & Shah, 2016; Cao, Zhang, Ma, Liu, & Yang,
2013; Guo et al., 2014) have been employed for this purpose till date; however, these
techniques require expensive instrumentation, long analysis time, complicated procedures
and trained technicians. Above-mentioned factors are highly unwanted for rapid and
routine screening procedures.
Remarkable optical properties of metallic NPs due to collective oscillation of surface
electrons in a conduction band after interaction with electromagnetic radiation (EMR)
make them tremendous candidate for their application as nanosensors (Aragay, Pino, &
Merkoçi, 2012; Ateeq et al., 2015). The optical response of NPs depends upon size,
shape and interparticle distances. Particularly, silver and gold have gained extensive
consideration in recent years. These NPs show surface plasmon resonance (SPR) band in
visible region (380–750 nm). During the recognition process, the surrounding
environment of NPs changes due to analyte interaction with different groups on the
surface of NPs that causes a shift in surface plasmon band.
Cartap, S,S-[2-(dimethylamino)-1,3-propanediyl] dicarbamothioate, a thiocarbamate, is a
precursor or analogue of natural insecticide nereistoxin that directly attacks nervous
system of insects, included in group 14 of IRAC MoA classification (Sparks & Nauen,
2015). Cartap was considered non-toxic earlier, however, recent cases of cartap poisoning
have prompted for development of specific method for its detection and quantification.
Effects of its access on humans include headache, palpitation, flushed face, irritation of
nose, throat, eyes and skin (Eldefrawi, Bakry, Eldefrawi, Tsai, & Albuquerque, 1980;
Kurisaki et al., 2010; Liao et al., 2003; Nagawa, Saji, Chiba, & Yui, 1971; Raymond-
Delpech, Matsuda, Sattelle, Rauh, & Sattelle, 2005; Vivek, Veeraiah, Padmavathi, Rao,
& Bramhachari, 2016). It has been shown that ocular exposure of cartap following
respiratory failure, mainly due to calcium-mediated diaphragmatic contracture rather than
neuromuscular blockage in rabbits (Kumar, Amalnath, & Dutta, 2011; Liao et al., 2006).
Basically, cartap induces generation of reactive oxygen species through a calcium
dependent mechanism that may be responsible for contracture and myofiber injury of
diaphragm, ultimately leading to respiratory failure and death (Harsha, Abhilash, &
Hansdak, 2013; Kurisaki et al., 2010).
59
In chemosensing, secondary interactions play a vital role such as hydrogen bonding (Boal
et al., 2000), van der waals forces (Patil et al., 1997), π-π stacking (J. Jin et al., 2001),
host-guest mechanism (J. Liu et al., 1999), charge transfer (Naka et al., 2003),
electrostatic attraction (Caruso et al., 1998) and antigen-antibody interactions (Shenton,
Davis, & Mann, 1999) etc. Silver nanoparticles stabilized through nitrogen containing
compounds have been used for the detection of anions. Positive charges are created on
the surface of the compound due to donation of electron pairs by nitrogen. Various
natural macromolecules like proteins, flavonoids, liposomes and polysaccharides as well
as synthetic macromolecules such as polymers have been employed for construction of
nanosensors (Fang et al., 2011; Gandubert & Lennox, 2005a). In this study, polystyrene-
block-poly(2-vinylpyridine), P(S-VP), copolymer has been used for stabilization of silver
nanoparticles (AgNPs). Pyridine moieties of P2VP block of copolymer have basic
nitrogens that have tendency to chelate metal nanoparticles, hence, prevent aggregation
and promote stabilization. P2VP has a very low contact angle with Au (9°), and 20 nm
AuNPs stabilized at a PS-P2VP interface tend to diffuse into P2VP (Kunz et al., 1993).
Successful utilization of P2VP homopolymers for stabilization of AuNPs is shown in our
recent publication (Rahim et al., 2017). Precise control of the particle location within
P2VP domain of P(S-VP) block copolymer stabilized AuNPs has been demonstrated
(Chiu et al., 2005). The stabilization of AuNPs by 4-(dimethylamino)pyridine is also
reported (Gandubert & Lennox, 2005a).
Herein, we report a new and facile one-pot robust approach for synthesis of thermally
stable P(S-VP)-conjugated silver nanoparticles (AgNPs). P(S-VP)-AgNPs are
synthesized by reduction of silver nitrate in presence of sodium borohydride with P(S-
VP). Specifically, we demonstrate the utilization of chelating ability of pyridine moiety
of polymer for stabilization of AgNPs. The synthesized AgNPs were characterized by
UV-visible spectroscopy, zetasizer, FTIR and AFM. Further, the P(S-VP)-AgNPs were
utilized for specific monitoring and quantification of cartap in presence of other
interfering species and in real samples such as ground water and blood plasma. The
proposed procedure offers fast, economical and sensitive method for detection of cartap
in water and physiological fluids for routine analysis.
60
3.1 Experimental
3.1.1 Materials and Instrumentation
Polystyrene-block-poly(2-vinyl pyridine) PS26K-b-P2VP4.8K (PDI = 1.15) was purchased
from polymer source inc (Quebec, Canada). Silver nitrate (AgNO3) (Sigma Aldrich,
USA) was the starting material for the synthesis of silver nanoparticles. NaBH4 (TCI,
Tokyo, Japan) was used as reducing agent for AgNO3. HPLC grade methanol (MeOH)
and toluene (RCI Labscan limited, Thailand) were used as solvents. All the reagents were
used as received. Pesticides samples were collected from Industrial Analytical Centre
(IAC), International Centre for Chemical and Biological Sciences (ICCBS), University of
Karachi, Pakistan.
Glassware were washed with aqua regia, oven-dried and rinsed with deionized water and
methanol prior to use.
A digital pH meter (Oakton, Eutech) model 510, with a Ag/AgCl reference electrode and
a glass working electrode was used to adjust pH of P(S-VP)-AgNPs solutions.
UV–visible spectra were recorded with a double beam Shimadzu UV-1800 series
spectrophotometer operated at a wavelength range of 190-800 nm using quartz cuvette of
one centimeter path length.
Particle size distribution and zeta potential of P(S-VP)-AgNPs before and after treatment
with cartap were determined by zetasizer, Nano-ZSP (Malvern Instruments). The analysis
was performed at a scattering angle of 90° at a temperature of 25 °C using disposable
cuvette for zetasizer and dip cell cuvette for zeta potential studies.
FTIR spectra were recorded on a Bruker Vector 22 spectrometer in the mid IR range
(400-4000 cm-1
) using KBr pellet. Ten scans were used to attain the spectral resolution of
0.1 cm–1
.
P(S-VP)-AgNPs topographical images were recorded by Agilent 5500 atomic force
microscope (AFM), (Arizona, USA). Triangular soft silicon nitride cantilever (Veeco,
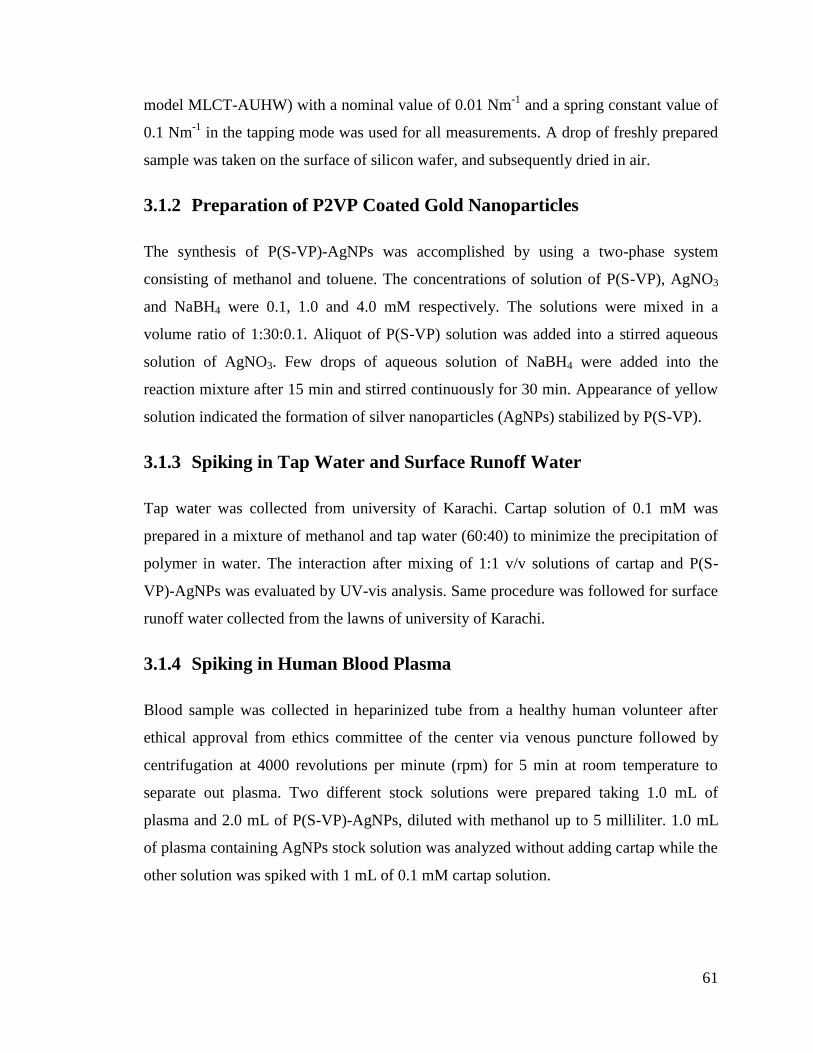
61
model MLCT-AUHW) with a nominal value of 0.01 Nm-1
and a spring constant value of
0.1 Nm-1
in the tapping mode was used for all measurements. A drop of freshly prepared
sample was taken on the surface of silicon wafer, and subsequently dried in air.
3.1.2 Preparation of P2VP Coated Gold Nanoparticles
The synthesis of P(S-VP)-AgNPs was accomplished by using a two-phase system
consisting of methanol and toluene. The concentrations of solution of P(S-VP), AgNO3
and NaBH4 were 0.1, 1.0 and 4.0 mM respectively. The solutions were mixed in a
volume ratio of 1:30:0.1. Aliquot of P(S-VP) solution was added into a stirred aqueous
solution of AgNO3. Few drops of aqueous solution of NaBH4 were added into the
reaction mixture after 15 min and stirred continuously for 30 min. Appearance of yellow
solution indicated the formation of silver nanoparticles (AgNPs) stabilized by P(S-VP).
3.1.3 Spiking in Tap Water and Surface Runoff Water
Tap water was collected from university of Karachi. Cartap solution of 0.1 mM was
prepared in a mixture of methanol and tap water (60:40) to minimize the precipitation of
polymer in water. The interaction after mixing of 1:1 v/v solutions of cartap and P(S-
VP)-AgNPs was evaluated by UV-vis analysis. Same procedure was followed for surface
runoff water collected from the lawns of university of Karachi.
3.1.4 Spiking in Human Blood Plasma
Blood sample was collected in heparinized tube from a healthy human volunteer after
ethical approval from ethics committee of the center via venous puncture followed by
centrifugation at 4000 revolutions per minute (rpm) for 5 min at room temperature to
separate out plasma. Two different stock solutions were prepared taking 1.0 mL of
plasma and 2.0 mL of P(S-VP)-AgNPs, diluted with methanol up to 5 milliliter. 1.0 mL
of plasma containing AgNPs stock solution was analyzed without adding cartap while the
other solution was spiked with 1 mL of 0.1 mM cartap solution.
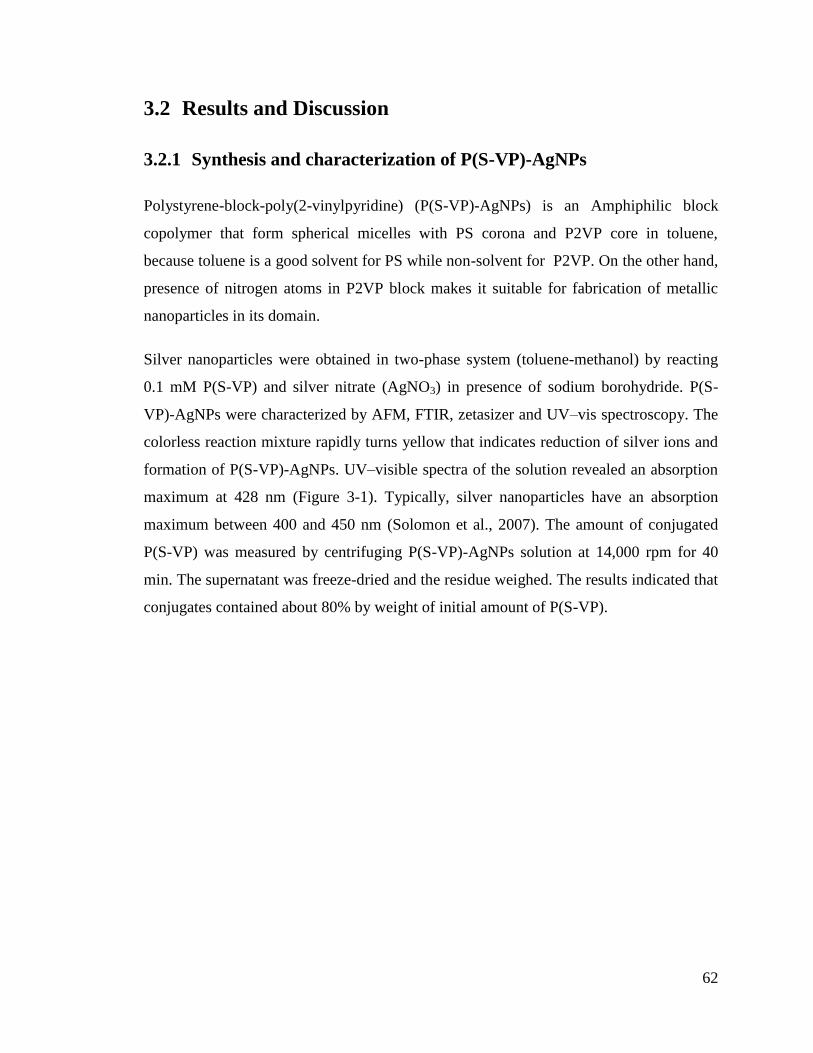
62
3.2 Results and Discussion
3.2.1 Synthesis and characterization of P(S-VP)-AgNPs
Polystyrene-block-poly(2-vinylpyridine) (P(S-VP)-AgNPs) is an Amphiphilic block
copolymer that form spherical micelles with PS corona and P2VP core in toluene,
because toluene is a good solvent for PS while non-solvent for P2VP. On the other hand,
presence of nitrogen atoms in P2VP block makes it suitable for fabrication of metallic
nanoparticles in its domain.
Silver nanoparticles were obtained in two-phase system (toluene-methanol) by reacting
0.1 mM P(S-VP) and silver nitrate (AgNO3) in presence of sodium borohydride. P(S-
VP)-AgNPs were characterized by AFM, FTIR, zetasizer and UV–vis spectroscopy. The
colorless reaction mixture rapidly turns yellow that indicates reduction of silver ions and
formation of P(S-VP)-AgNPs. UV–visible spectra of the solution revealed an absorption
maximum at 428 nm (Figure 3-1). Typically, silver nanoparticles have an absorption
maximum between 400 and 450 nm (Solomon et al., 2007). The amount of conjugated
P(S-VP) was measured by centrifuging P(S-VP)-AgNPs solution at 14,000 rpm for 40
min. The supernatant was freeze-dried and the residue weighed. The results indicated that
conjugates contained about 80% by weight of initial amount of P(S-VP).
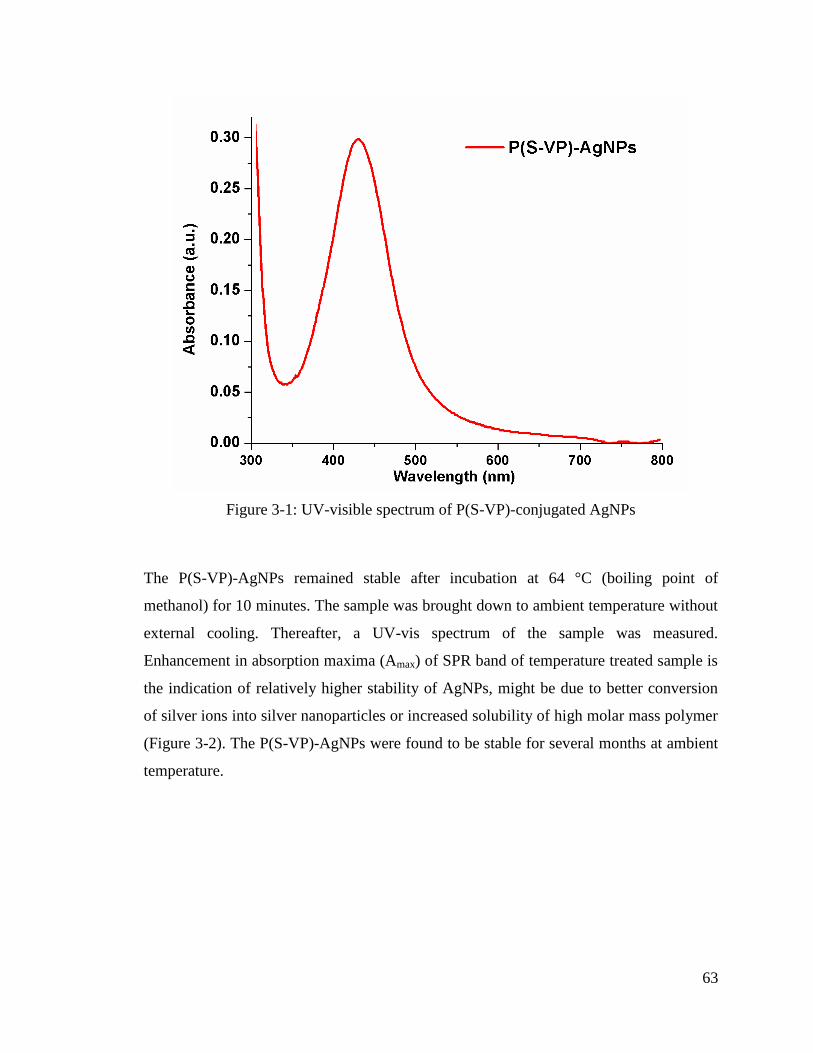
63
Figure 3-1: UV-visible spectrum of P(S-VP)-conjugated AgNPs
The P(S-VP)-AgNPs remained stable after incubation at 64 °C (boiling point of
methanol) for 10 minutes. The sample was brought down to ambient temperature without
external cooling. Thereafter, a UV-vis spectrum of the sample was measured.
Enhancement in absorption maxima (Amax) of SPR band of temperature treated sample is
the indication of relatively higher stability of AgNPs, might be due to better conversion
of silver ions into silver nanoparticles or increased solubility of high molar mass polymer
(Figure 3-2). The P(S-VP)-AgNPs were found to be stable for several months at ambient
temperature.
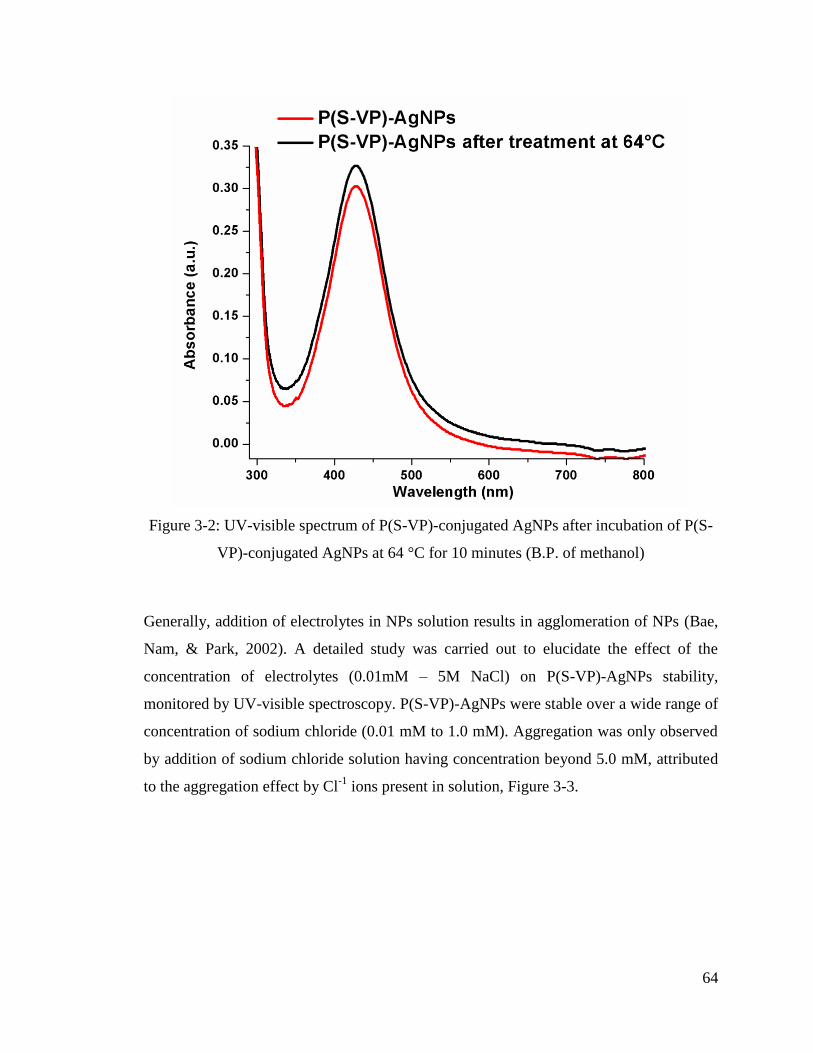
64
Figure 3-2: UV-visible spectrum of P(S-VP)-conjugated AgNPs after incubation of P(S-
VP)-conjugated AgNPs at 64 °C for 10 minutes (B.P. of methanol)
Generally, addition of electrolytes in NPs solution results in agglomeration of NPs (Bae,
Nam, & Park, 2002). A detailed study was carried out to elucidate the effect of the
concentration of electrolytes (0.01mM – 5M NaCl) on P(S-VP)-AgNPs stability,
monitored by UV-visible spectroscopy. P(S-VP)-AgNPs were stable over a wide range of
concentration of sodium chloride (0.01 mM to 1.0 mM). Aggregation was only observed
by addition of sodium chloride solution having concentration beyond 5.0 mM, attributed
to the aggregation effect by Cl-1
ions present in solution, Figure 3-3.
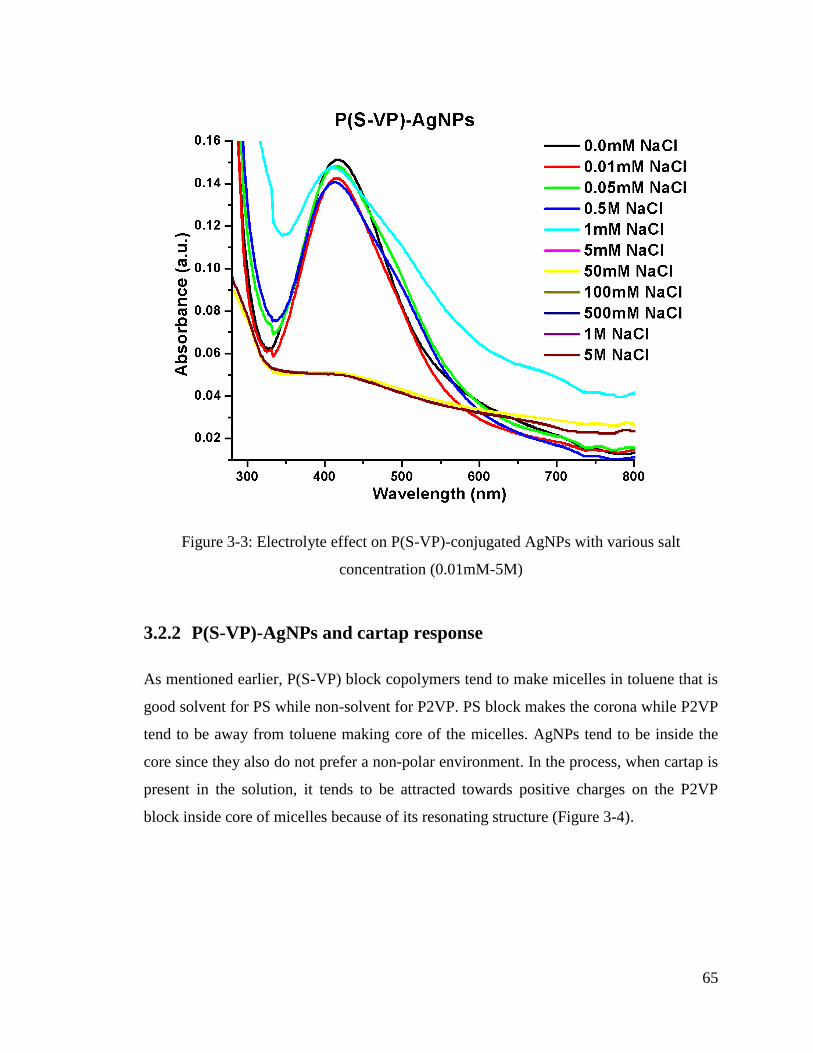
65
Figure 3-3: Electrolyte effect on P(S-VP)-conjugated AgNPs with various salt
concentration (0.01mM-5M)
3.2.2 P(S-VP)-AgNPs and cartap response
As mentioned earlier, P(S-VP) block copolymers tend to make micelles in toluene that is
good solvent for PS while non-solvent for P2VP. PS block makes the corona while P2VP
tend to be away from toluene making core of the micelles. AgNPs tend to be inside the
core since they also do not prefer a non-polar environment. In the process, when cartap is
present in the solution, it tends to be attracted towards positive charges on the P2VP
block inside core of micelles because of its resonating structure (Figure 3-4).
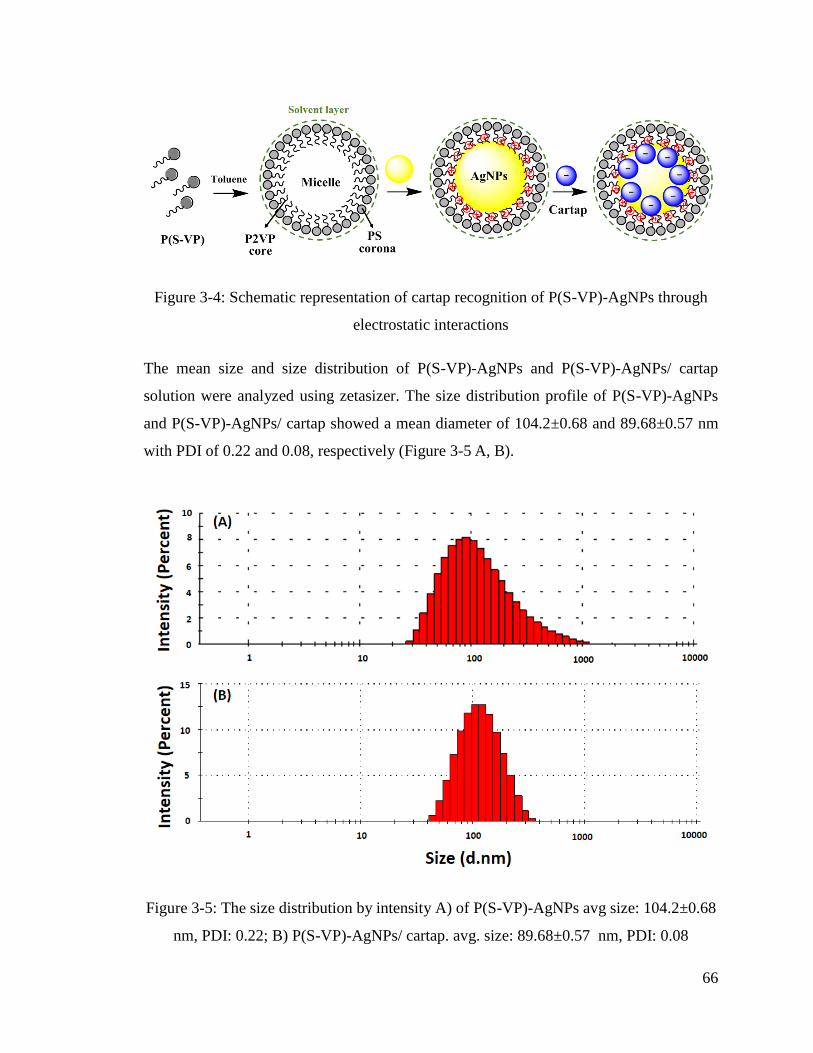
66
Figure 3-4: Schematic representation of cartap recognition of P(S-VP)-AgNPs through
electrostatic interactions
The mean size and size distribution of P(S-VP)-AgNPs and P(S-VP)-AgNPs/ cartap
solution were analyzed using zetasizer. The size distribution profile of P(S-VP)-AgNPs
and P(S-VP)-AgNPs/ cartap showed a mean diameter of 104.2±0.68 and 89.68±0.57 nm
with PDI of 0.22 and 0.08, respectively (Figure 3-5 A, B).
Figure 3-5: The size distribution by intensity A) of P(S-VP)-AgNPs avg size: 104.2±0.68
nm, PDI: 0.22; B) P(S-VP)-AgNPs/ cartap. avg. size: 89.68±0.57 nm, PDI: 0.08
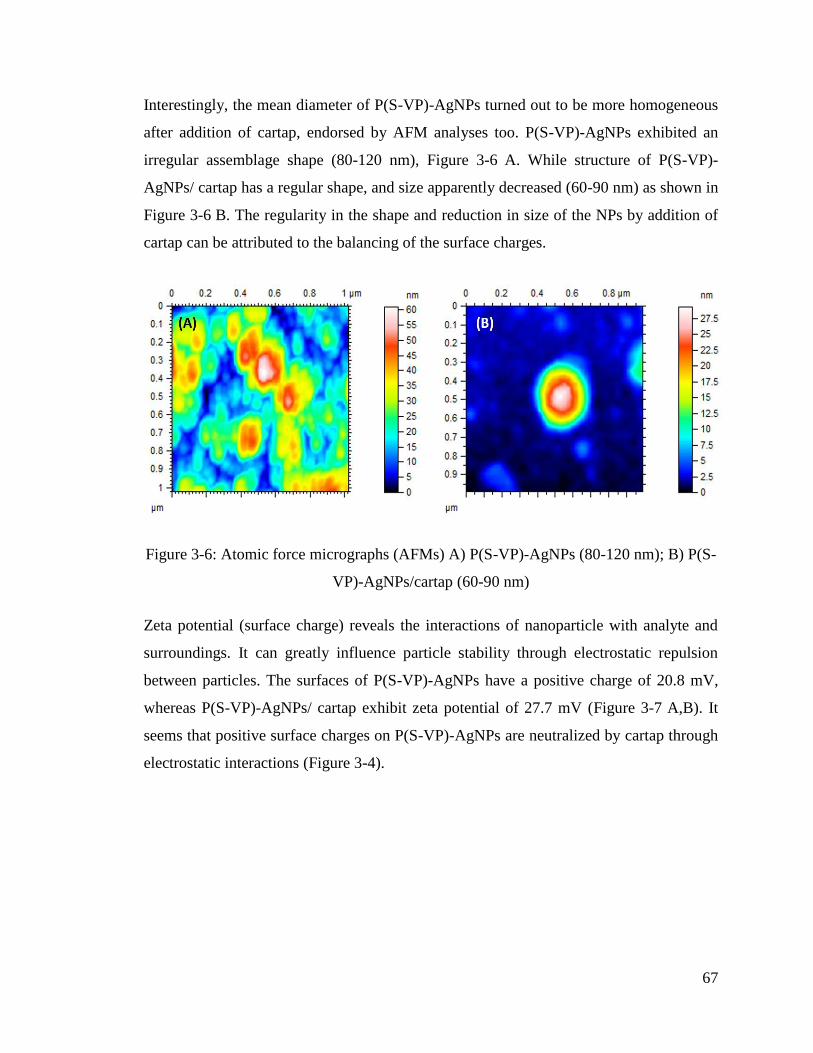
67
Interestingly, the mean diameter of P(S-VP)-AgNPs turned out to be more homogeneous
after addition of cartap, endorsed by AFM analyses too. P(S-VP)-AgNPs exhibited an
irregular assemblage shape (80-120 nm), Figure 3-6 A. While structure of P(S-VP)-
AgNPs/ cartap has a regular shape, and size apparently decreased (60-90 nm) as shown in
Figure 3-6 B. The regularity in the shape and reduction in size of the NPs by addition of
cartap can be attributed to the balancing of the surface charges.
Figure 3-6: Atomic force micrographs (AFMs) A) P(S-VP)-AgNPs (80-120 nm); B) P(S-
VP)-AgNPs/cartap (60-90 nm)
Zeta potential (surface charge) reveals the interactions of nanoparticle with analyte and
surroundings. It can greatly influence particle stability through electrostatic repulsion
between particles. The surfaces of P(S-VP)-AgNPs have a positive charge of 20.8 mV,
whereas P(S-VP)-AgNPs/ cartap exhibit zeta potential of 27.7 mV (Figure 3-7 A,B). It
seems that positive surface charges on P(S-VP)-AgNPs are neutralized by cartap through
electrostatic interactions (Figure 3-4).
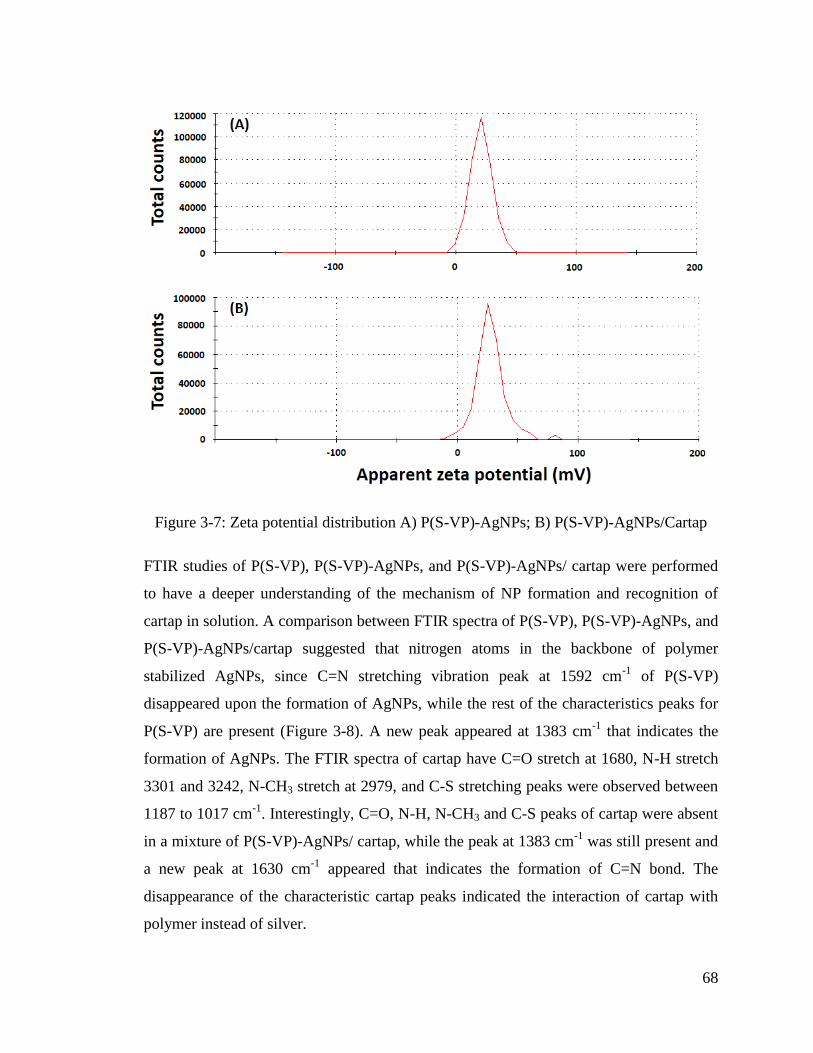
68
Figure 3-7: Zeta potential distribution A) P(S-VP)-AgNPs; B) P(S-VP)-AgNPs/Cartap
FTIR studies of P(S-VP), P(S-VP)-AgNPs, and P(S-VP)-AgNPs/ cartap were performed
to have a deeper understanding of the mechanism of NP formation and recognition of
cartap in solution. A comparison between FTIR spectra of P(S-VP), P(S-VP)-AgNPs, and
P(S-VP)-AgNPs/cartap suggested that nitrogen atoms in the backbone of polymer
stabilized AgNPs, since C=N stretching vibration peak at 1592 cm-1
of P(S-VP)
disappeared upon the formation of AgNPs, while the rest of the characteristics peaks for
P(S-VP) are present (Figure 3-8). A new peak appeared at 1383 cm-1
that indicates the
formation of AgNPs. The FTIR spectra of cartap have C=O stretch at 1680, N-H stretch
3301 and 3242, N-CH3 stretch at 2979, and C-S stretching peaks were observed between
1187 to 1017 cm-1
. Interestingly, C=O, N-H, N-CH3 and C-S peaks of cartap were absent
in a mixture of P(S-VP)-AgNPs/ cartap, while the peak at 1383 cm-1
was still present and
a new peak at 1630 cm-1
appeared that indicates the formation of C=N bond. The
disappearance of the characteristic cartap peaks indicated the interaction of cartap with
polymer instead of silver.
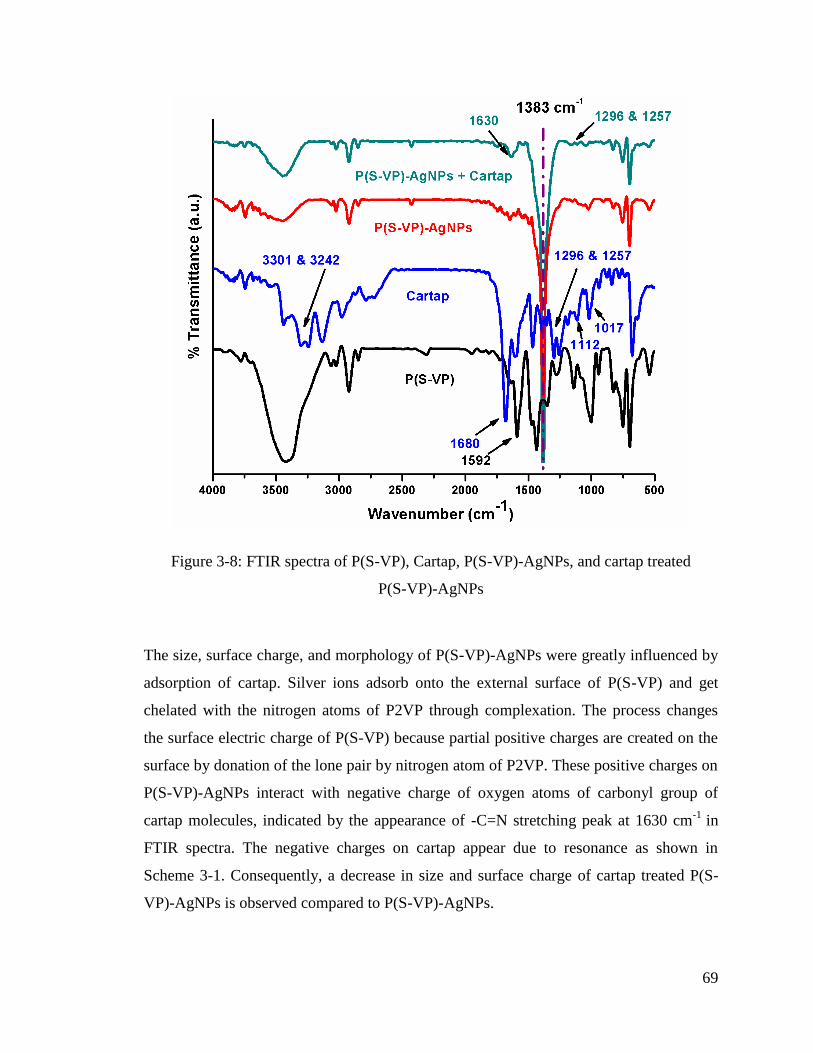
69
Figure 3-8: FTIR spectra of P(S-VP), Cartap, P(S-VP)-AgNPs, and cartap treated
P(S-VP)-AgNPs
The size, surface charge, and morphology of P(S-VP)-AgNPs were greatly influenced by
adsorption of cartap. Silver ions adsorb onto the external surface of P(S-VP) and get
chelated with the nitrogen atoms of P2VP through complexation. The process changes
the surface electric charge of P(S-VP) because partial positive charges are created on the
surface by donation of the lone pair by nitrogen atom of P2VP. These positive charges on
P(S-VP)-AgNPs interact with negative charge of oxygen atoms of carbonyl group of
cartap molecules, indicated by the appearance of -C=N stretching peak at 1630 cm-1
in
FTIR spectra. The negative charges on cartap appear due to resonance as shown in
Scheme 3-1. Consequently, a decrease in size and surface charge of cartap treated P(S-
VP)-AgNPs is observed compared to P(S-VP)-AgNPs.
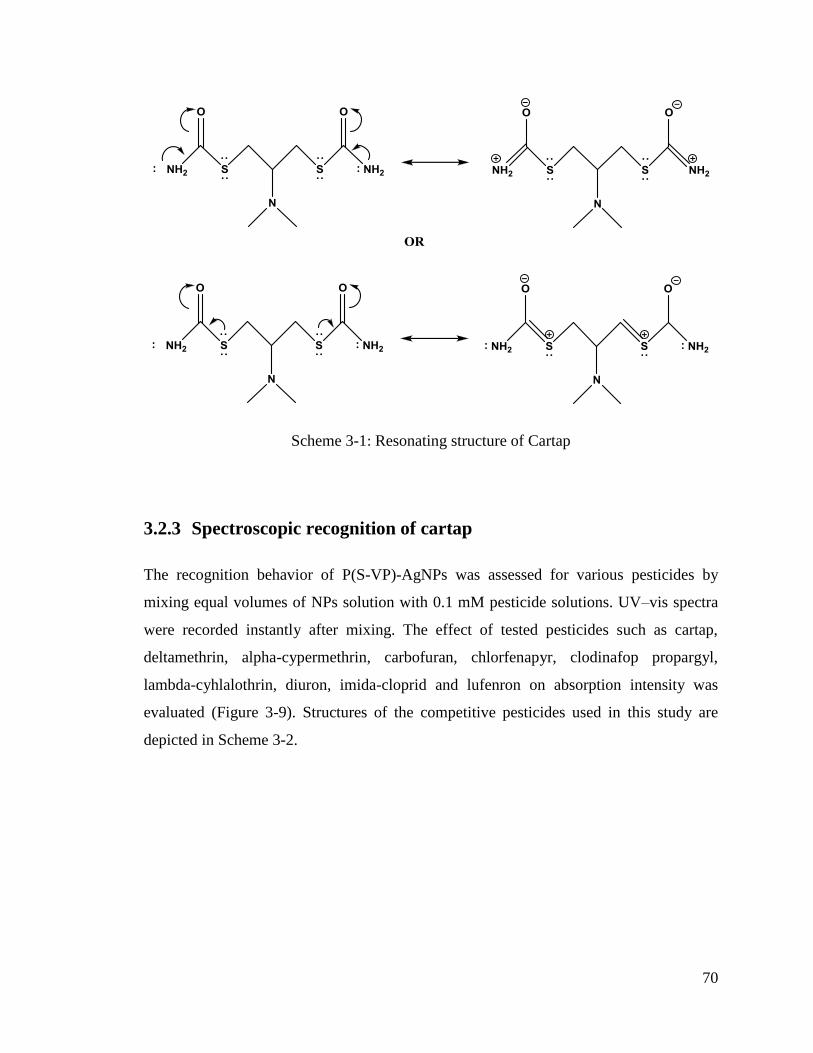
70
Scheme 3-1: Resonating structure of Cartap
3.2.3 Spectroscopic recognition of cartap
The recognition behavior of P(S-VP)-AgNPs was assessed for various pesticides by
mixing equal volumes of NPs solution with 0.1 mM pesticide solutions. UV–vis spectra
were recorded instantly after mixing. The effect of tested pesticides such as cartap,
deltamethrin, alpha-cypermethrin, carbofuran, chlorfenapyr, clodinafop propargyl,
lambda-cyhlalothrin, diuron, imida-cloprid and lufenron on absorption intensity was
evaluated (Figure 3-9). Structures of the competitive pesticides used in this study are
depicted in Scheme 3-2.
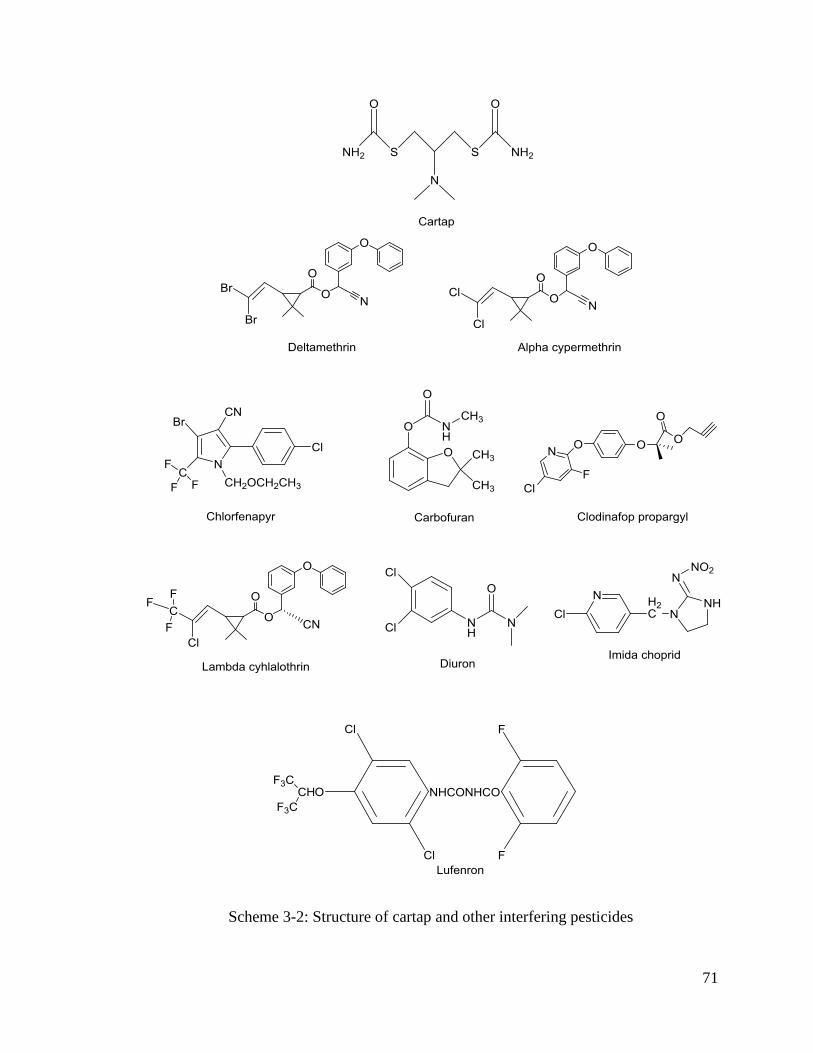
71
Scheme 3-2: Structure of cartap and other interfering pesticides
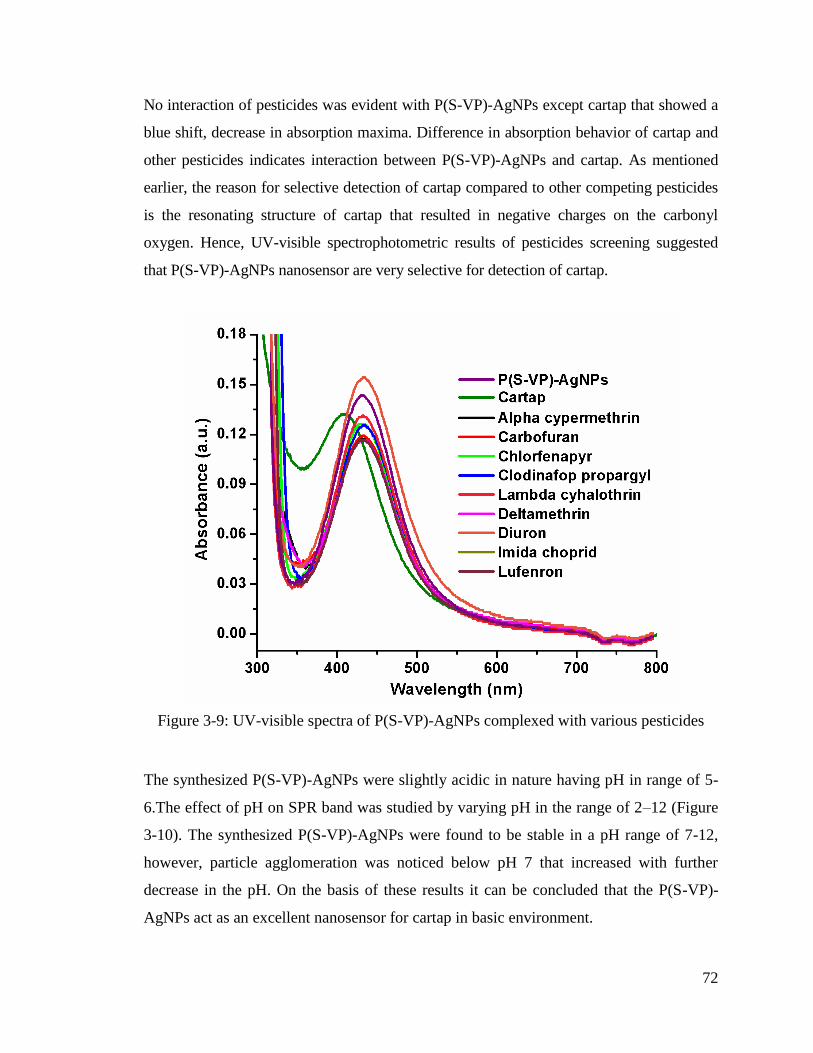
72
No interaction of pesticides was evident with P(S-VP)-AgNPs except cartap that showed a
blue shift, decrease in absorption maxima. Difference in absorption behavior of cartap and
other pesticides indicates interaction between P(S-VP)-AgNPs and cartap. As mentioned
earlier, the reason for selective detection of cartap compared to other competing pesticides
is the resonating structure of cartap that resulted in negative charges on the carbonyl
oxygen. Hence, UV-visible spectrophotometric results of pesticides screening suggested
that P(S-VP)-AgNPs nanosensor are very selective for detection of cartap.
Figure 3-9: UV-visible spectra of P(S-VP)-AgNPs complexed with various pesticides
The synthesized P(S-VP)-AgNPs were slightly acidic in nature having pH in range of 5-
6.The effect of pH on SPR band was studied by varying pH in the range of 2–12 (Figure
3-10). The synthesized P(S-VP)-AgNPs were found to be stable in a pH range of 7-12,
however, particle agglomeration was noticed below pH 7 that increased with further
decrease in the pH. On the basis of these results it can be concluded that the P(S-VP)-
AgNPs act as an excellent nanosensor for cartap in basic environment.
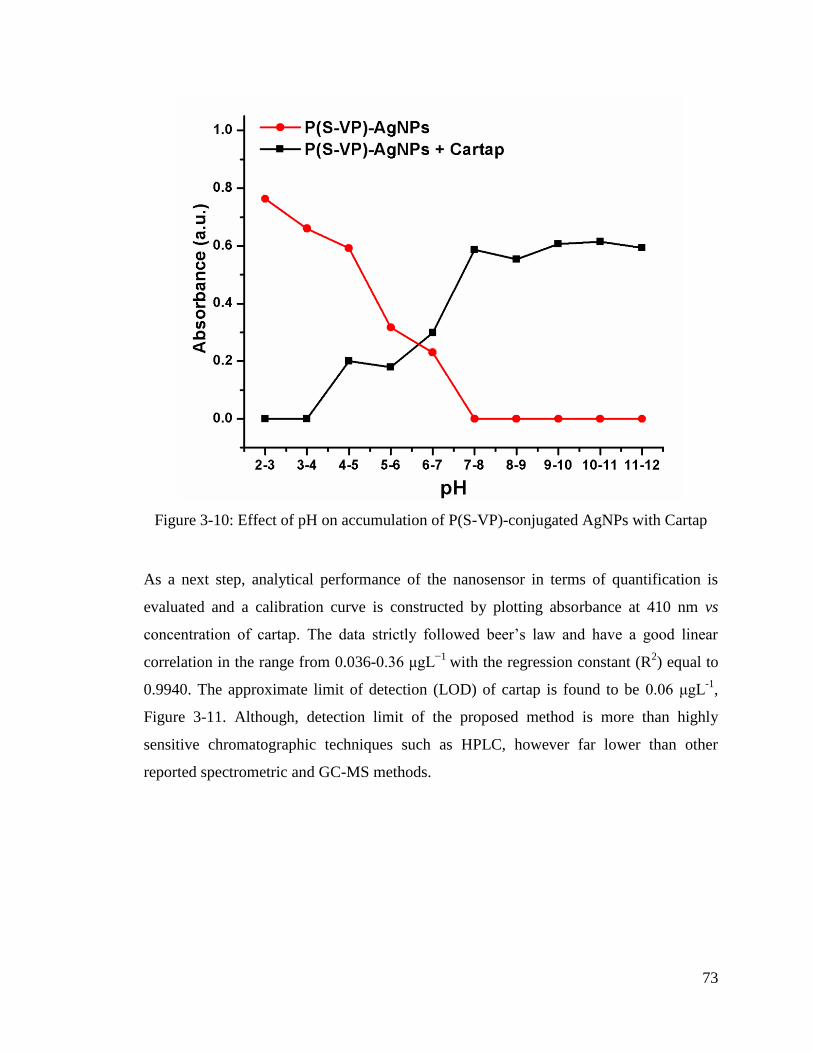
73
Figure 3-10: Effect of pH on accumulation of P(S-VP)-conjugated AgNPs with Cartap
As a next step, analytical performance of the nanosensor in terms of quantification is
evaluated and a calibration curve is constructed by plotting absorbance at 410 nm vs
concentration of cartap. The data strictly followed beer‘s law and have a good linear
correlation in the range from 0.036-0.36 μgL−1
with the regression constant (R2) equal to
0.9940. The approximate limit of detection (LOD) of cartap is found to be 0.06 μgL-1
,
Figure 3-11. Although, detection limit of the proposed method is more than highly
sensitive chromatographic techniques such as HPLC, however far lower than other
reported spectrometric and GC-MS methods.
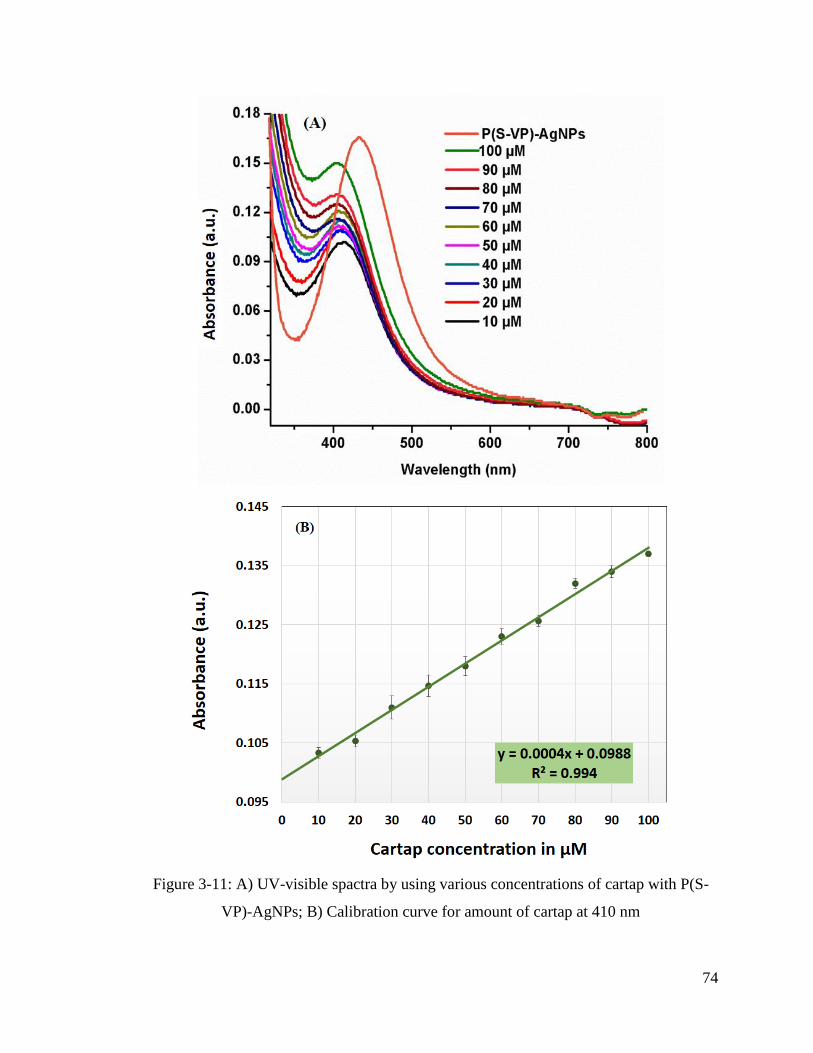
74
Figure 3-11: A) UV-visible spactra by using various concentrations of cartap with P(S-
VP)-AgNPs; B) Calibration curve for amount of cartap at 410 nm
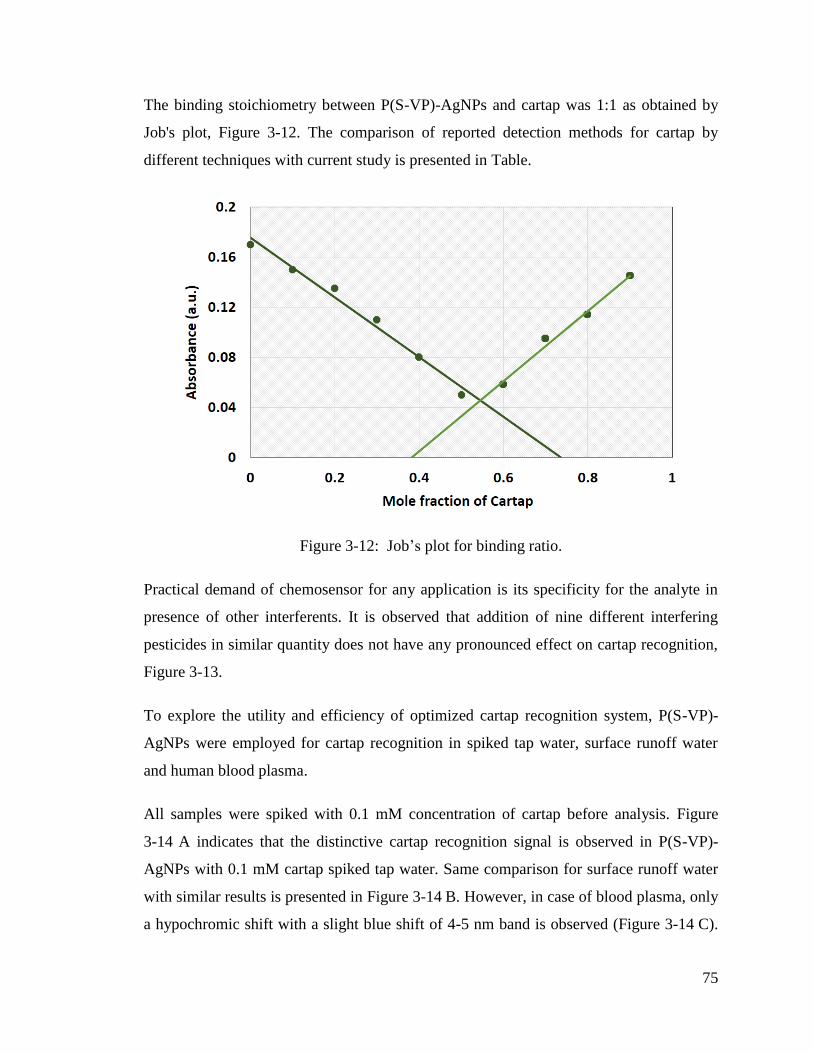
75
The binding stoichiometry between P(S-VP)-AgNPs and cartap was 1:1 as obtained by
Job's plot, Figure 3-12. The comparison of reported detection methods for cartap by
different techniques with current study is presented in Table.
Figure 3-12: Job‘s plot for binding ratio.
Practical demand of chemosensor for any application is its specificity for the analyte in
presence of other interferents. It is observed that addition of nine different interfering
pesticides in similar quantity does not have any pronounced effect on cartap recognition,
Figure 3-13.
To explore the utility and efficiency of optimized cartap recognition system, P(S-VP)-
AgNPs were employed for cartap recognition in spiked tap water, surface runoff water
and human blood plasma.
All samples were spiked with 0.1 mM concentration of cartap before analysis. Figure
3-14 A indicates that the distinctive cartap recognition signal is observed in P(S-VP)-
AgNPs with 0.1 mM cartap spiked tap water. Same comparison for surface runoff water
with similar results is presented in Figure 3-14 B. However, in case of blood plasma, only
a hypochromic shift with a slight blue shift of 4-5 nm band is observed (Figure 3-14 C).
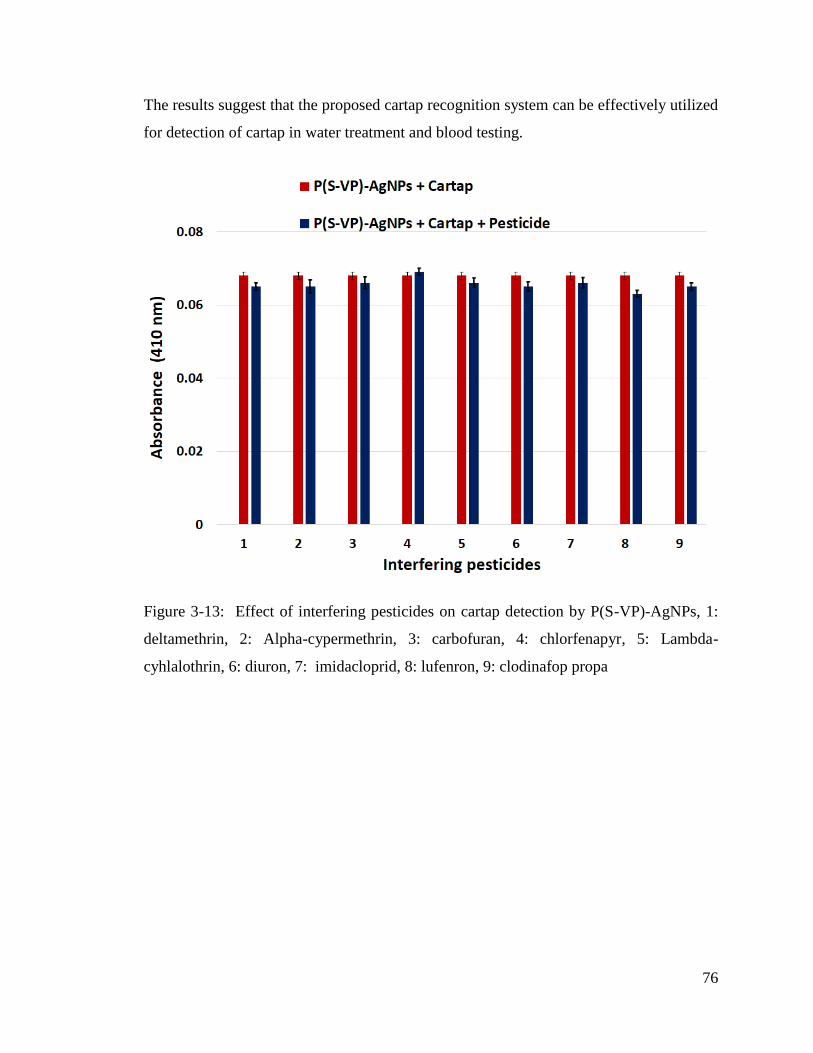
76
The results suggest that the proposed cartap recognition system can be effectively utilized
for detection of cartap in water treatment and blood testing.
Figure 3-13: Effect of interfering pesticides on cartap detection by P(S-VP)-AgNPs, 1:
deltamethrin, 2: Alpha-cypermethrin, 3: carbofuran, 4: chlorfenapyr, 5: Lambda-
cyhlalothrin, 6: diuron, 7: imidacloprid, 8: lufenron, 9: clodinafop propa
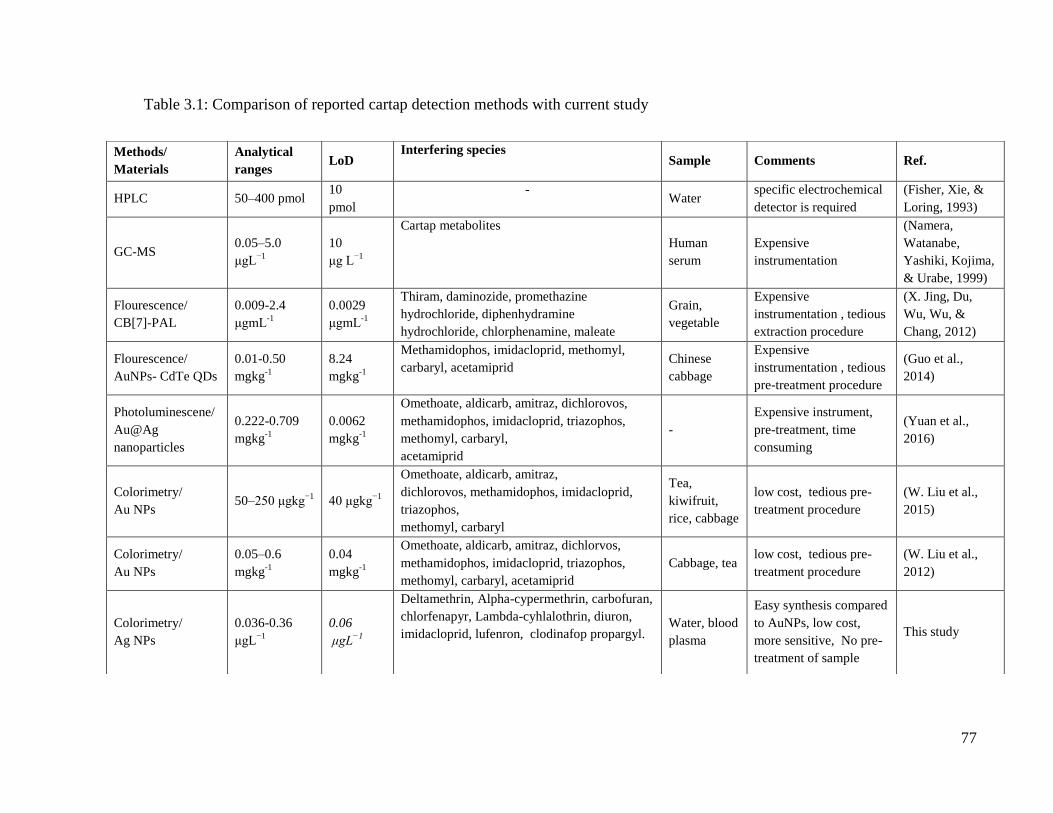
77
Table 3.1: Comparison of reported cartap detection methods with current study
Methods/
Materials
Analytical
ranges LoD
Interfering species Sample Comments Ref.
HPLC 50–400 pmol 10
pmol
- Water
specific electrochemical
detector is required
(Fisher, Xie, &
Loring, 1993)
GC-MS 0.05–5.0
μgL−1
10
μg L−1
Cartap metabolites
Human
serum
Expensive
instrumentation
(Namera,
Watanabe,
Yashiki, Kojima,
& Urabe, 1999)
Flourescence/
CB[7]-PAL
0.009-2.4
μgmL-1
0.0029
μgmL-1
Thiram, daminozide, promethazine
hydrochloride, diphenhydramine
hydrochloride, chlorphenamine, maleate
Grain,
vegetable
Expensive
instrumentation , tedious
extraction procedure
(X. Jing, Du,
Wu, Wu, &
Chang, 2012)
Flourescence/
AuNPs- CdTe QDs
0.01-0.50
mgkg-1
8.24
mgkg-1
Methamidophos, imidacloprid, methomyl,
carbaryl, acetamiprid Chinese
cabbage
Expensive
instrumentation , tedious
pre-treatment procedure
(Guo et al.,
2014)
Photoluminescene/
Au@Ag
nanoparticles
0.222-0.709
mgkg-1
0.0062
mgkg-1
Omethoate, aldicarb, amitraz, dichlorovos,
methamidophos, imidacloprid, triazophos,
methomyl, carbaryl,
acetamiprid
-
Expensive instrument,
pre-treatment, time
consuming
(Yuan et al.,
2016)
Colorimetry/
Au NPs 50–250 μgkg
−1 40 μgkg
−1
Omethoate, aldicarb, amitraz,
dichlorovos, methamidophos, imidacloprid,
triazophos,
methomyl, carbaryl
Tea,
kiwifruit,
rice, cabbage
low cost, tedious pre-
treatment procedure
(W. Liu et al.,
2015)
Colorimetry/
Au NPs
0.05–0.6
mgkg-1
0.04
mgkg-1
Omethoate, aldicarb, amitraz, dichlorvos,
methamidophos, imidacloprid, triazophos,
methomyl, carbaryl, acetamiprid
Cabbage, tea low cost, tedious pre-
treatment procedure
(W. Liu et al.,
2012)
Colorimetry/
Ag NPs
0.036-0.36
μgL−1
0.06
μgL−1
Deltamethrin, Alpha-cypermethrin, carbofuran,
chlorfenapyr, Lambda-cyhlalothrin, diuron,
imidacloprid, lufenron, clodinafop propargyl. Water, blood
plasma
Easy synthesis compared
to AuNPs, low cost,
more sensitive, No pre-
treatment of sample
This study
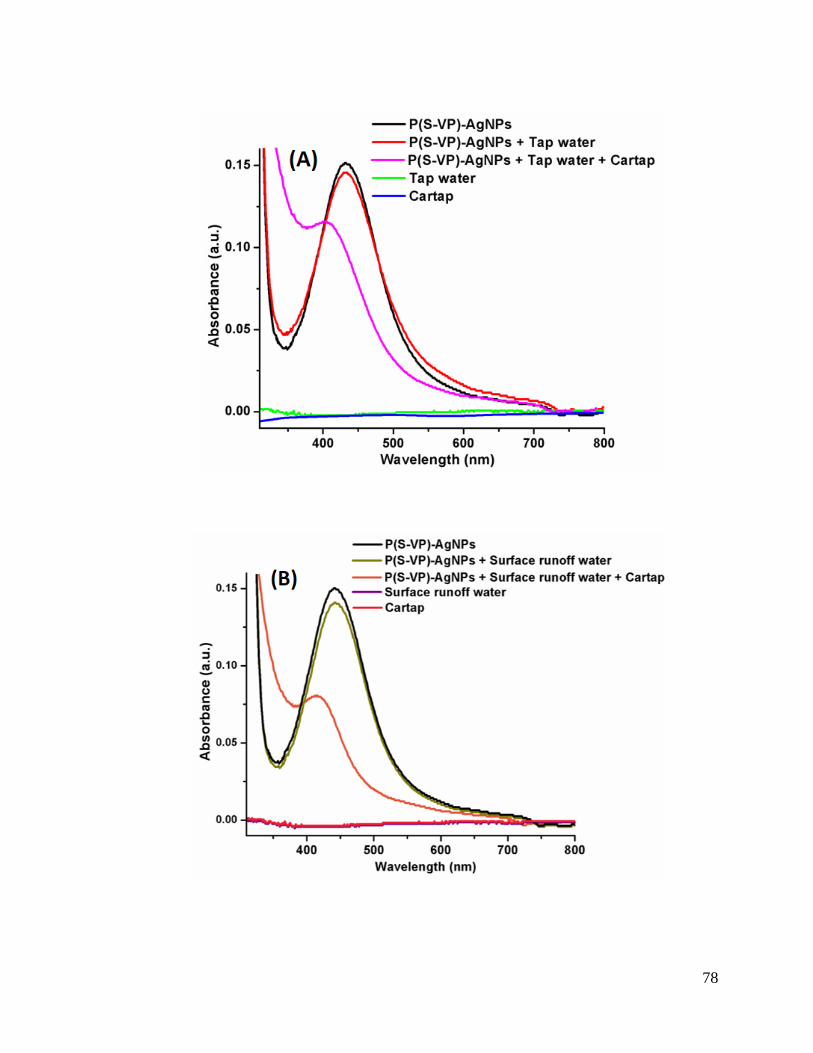
78
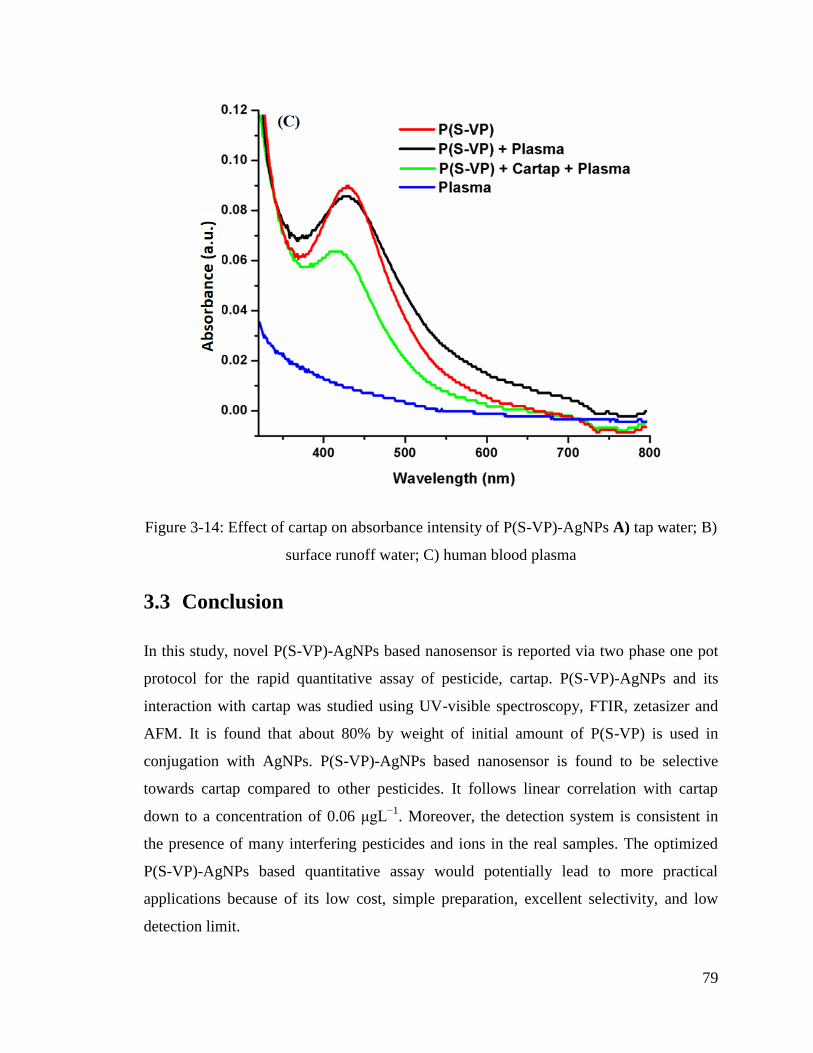
79
Figure 3-14: Effect of cartap on absorbance intensity of P(S-VP)-AgNPs A) tap water; B)
surface runoff water; C) human blood plasma
3.3 Conclusion
In this study, novel P(S-VP)-AgNPs based nanosensor is reported via two phase one pot
protocol for the rapid quantitative assay of pesticide, cartap. P(S-VP)-AgNPs and its
interaction with cartap was studied using UV-visible spectroscopy, FTIR, zetasizer and
AFM. It is found that about 80% by weight of initial amount of P(S-VP) is used in
conjugation with AgNPs. P(S-VP)-AgNPs based nanosensor is found to be selective
towards cartap compared to other pesticides. It follows linear correlation with cartap
down to a concentration of 0.06 μgL−1
. Moreover, the detection system is consistent in
the presence of many interfering pesticides and ions in the real samples. The optimized
P(S-VP)-AgNPs based quantitative assay would potentially lead to more practical
applications because of its low cost, simple preparation, excellent selectivity, and low
detection limit.
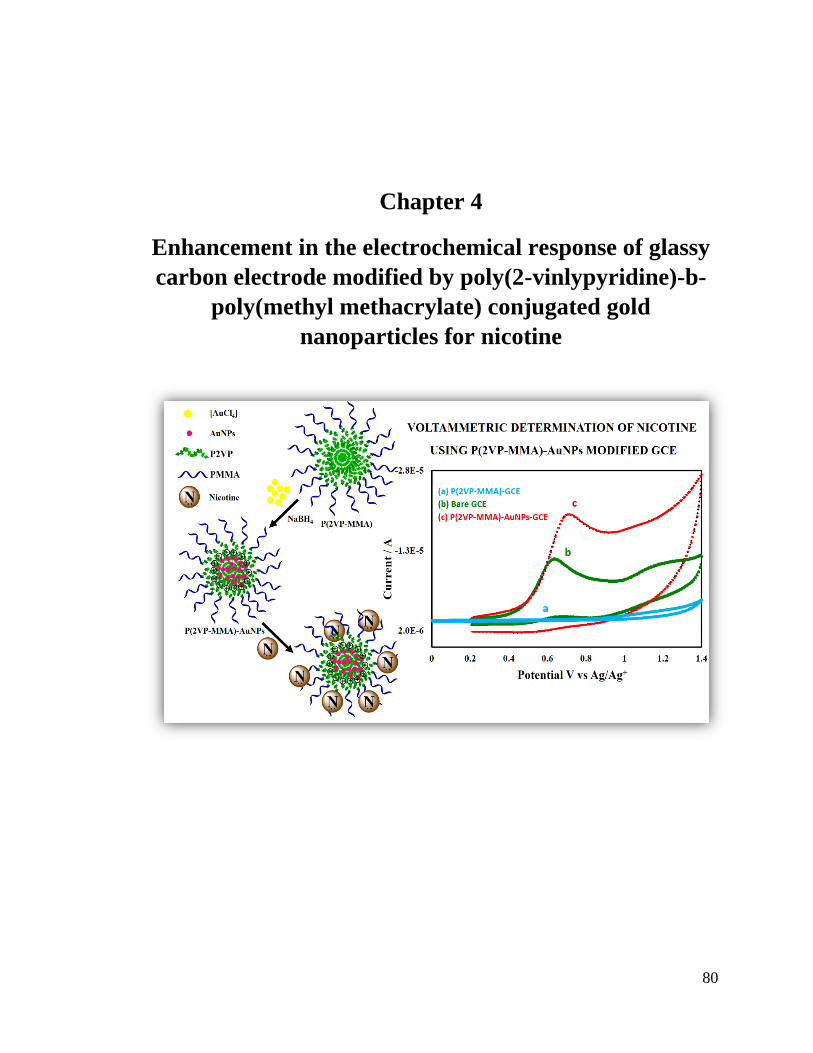
80
Chapter 4
Enhancement in the electrochemical response of glassy
carbon electrode modified by poly(2-vinlypyridine)-b-
poly(methyl methacrylate) conjugated gold
nanoparticles for nicotine
81
Abstract
Investigation of the potential of poly(2-vinylpyridine-b-methylmethacrylate) coated gold
nanoparticles [P(2VP-MMA)-AuNPs] as an electrochemical sensor for nicotine is the
main focus of current study. P(2VP-MMA)-AuNPs were prepared and characterized by
UV-Vis, FTIR, AFM, and zetasizer. Further, P(2VP-MMA)-AuNPs were coated on a
glassy carbon electrode (GCE) for electrochemical detection of nicotine by cyclic
voltammetry. The effect of molar mass of individual P2VP block and total molar mass of
the block copolymer is evaluated in context of sensing ability of nicotine in both aqueous
and organic media. The electrochemical sensing of nicotine is significantly enhanced by
modification of GCE with P(2VP-MMA)-AuNPs.
4 Introduction
Nicotine, 3-(1-methyl-2-pyrrolidinyl) pyridine, is an alkaloid abundantly found in
nightshade family of plants. It is the major ingredient of tobacco and cigarettes. The
concentration of nicotine in tobacco is about 2 -8% (Selmar, Radwan, & Nowak, 2015).
Nicotine directly attacks the nervous system and hence is included in IRAC MoA group
4B (Sparks & Nauen, 2015). It is a potent para-sympathomimetic stimulant that acts as an
agonist at nicotinic acetylcholine receptors (nAChRs). The adverse effects of nicotine on
human health includes vasoconstriction, increased heart rate, high blood pressure, and
increased blood sugar level (Armitage & Hall, 1967; Hill, 1909; Thesleff, 1955). Regular
intake of nicotine may cause a broad spectrum of cancer diseases that affects several
body organs. Frequent detrimental health effects combined with the considerable
pervasiveness of cigarette smoke makes it a major cause of death worldwide (Alberg,
2008; Yildiz, 2004). Concentration as low as 30-60 mg for adults and 10 mg for children
are considered to be lethal (Cameron et al., 2014). Therefore, determination and
quantification of nicotine is an important analysis parameter that makes the basis of the
quality of the product in medicine and tobacco industry (Davis, 1986; Goniewicz, Kuma,
Gawron, Knysak, & Kosmider, 2013).
82
Several methodologies as well as analytical techniques such as high performance liquid
chromatography (HPLC) (Mahoney & Al-Delaimy, 2001; C. Wu, Siems, Hill, & Hannan,
1998), gas chromatography (GC) (Davis, 1986; Patrianakos & Hoffmann, 1979), liquid
chromatography-mass spectrometry (LC-MS) (McManus, deBethizy, Garteiz,
Kyerematen, & Vesell, 1990), immunochromatography (Gonzalez, Foley, Bieber,
Bourdelle, & Niedbala, 2011), spectrophotometry (Puhakainen, Barlow, & Salonen,
1987), capillary electrophoresis (CE) (Matysik, 1999), spectrofluorimetry, raman
spectroscopy (Mamián-López & Poppi, 2013), radioimmunoassay, electroanalytical assay
with different electrode systems have been reported for determination of nicotine
(Matysik, 1999; Suffredini et al., 2005; Švorc, Stanković, & Kalcher, 2014). Above-
mentioned analytical methods possess several advantages; nonetheless, the applicability
of these methods for routine analysis is impeded by tedious sample preparation
procedures for preliminary extraction and purification of nicotine that often leads to
sizeable loss of analyte and prolonged analysis time. Furthermore, hi-tech and expensive
instrumentation is required.
Linear-scan cyclic voltammetry are efficient techniques which were employed since
decades for generating mono / diradical(s) (i.e., anion or cations) and to study their
subsequent reactions. Cyclic voltammetry (CV) is perhaps one of the most practiced
electroanalytical technique owing to its simplicity of operation and versatility of
applications in diverse disciplines such as inorganic, organic and biochemistry
(Electroanalytical Methods - Guide to Experiments and Applications, 2010; Heinze,
1984; Kissinger & Heineman, 1983). Cyclic voltammetry allows for detailed study of rate
kinetics as well as thermodynamics of radical formation and their reaction. Beside these
obvious advantages, one of the foremost obstacle in investigating complex molecules and
or (bio) mixtures via cyclic voltammetry is limited sensitivity of conventional electrodes.
Moreover, the oxidation / reduction of nicotine and its metabolites requires extremely
large potential window which is generally out of the range of conventional electrodes
[22]. Therefore, modification of the electrode is often a prerequisite to enhance detecting
(sensing) efficiency of electrode.
83
Several reports on modification of glassy carbon electrode (GCE) for determination of
nicotine by cyclic voltammetry have been reported. A boron-doped diamond electrode to
improve the separation of nicotine peak in alkaline media using a potential window from
+0.6 to +1.8 V was reported by Suffredini et al (Suffredini et al., 2005). A screen printed
electrode modified by metallic free carbon nanotube cluster was employed for the
detection of nicotine in artificial saliva in a potential range of -0.4 to +1.2 V (Highton,
Kadara, Jenkinson, Logan Riehl, & Banks, 2009). The effects of thin-layer diffusion in
the electrochemical detection of nicotine on multi-walled carbon nanotubes modified
basal plane pyrolytic graphite (MWCNT-BPPG) electrode at a potential range of 0.0 to
+1.0 V was evaluated (Sims, Rees, Dickinson, & Compton, 2010). In another study,
nano-carbon was employed as an alternative to multi-walled carbon nanotubes in
modified electrodes using potential range of -1.5 to +1.5 V (Lo, Aldous, & Compton,
2012). Nicotine was determined in tobacco samples based on mussel-inspired reduced
graphene oxide-supported gold nanoparticles at a potential range of -0.2 to +0.6 V (Y.
Jing et al., 2016). In our recent publications, stabilization and applications of NPs by
homo and copolymers of P2VP has been demonstrated (Rahim et al., 2017; Rahim,
Khalid, Bhanger, Shah, & Malik, 2018).
In this study, poly(2-vinylpyridine-block-methyl methacrylate) [P2VP-b-PMMA or
P(2VP-MMA)] coated gold nanoparticles (AuNPs) modified glassy carbon electrode,
[P(2VP-MMA)-AuNPs]-GCE, is used as a valuable tool to study the electrochemical
behavior of nicotine in aqueous as well as in organic media. P(2VP-MMA)-AuNPs were
synthesized and characterized by UV-Vis, FTIR, AFM and zetasizer. Further, the
prepared P(2VP-MMA)-AuNPs are coated on GCE for preparation of [P(2VP-MMA)-
AuNPs]-GCE. Polymer based nanoparticles-modified electrode offers high effective
surface area, enhanced mass transfer and better control over local microenvironment. The
large effective surface area results in more active sites and higher signal to noise ratio.
Higher rate of mass transport to the electrode surface is expected due to smaller
dimensions of nanoparticles. Furthermore, potential window of the bare gold should be
reduced by coating of P(2VP-MMA)-AuNPs. To the best of our knowledge, current study
is perhaps the first report on the enhancement of electroanalytical response for nicotine
by employing [P(2VP-MMA)-AuNPs]-GCE.
84
4.1 Experimental Section
4.1.1 Materials
Poly(2-vinylpyridine-block-methyl methacrylate) [P2VP-b-PMMA or P(2VP-MMA)]
block copolymers of various molar masses were purchased from polymer standards
services (Mainz, Germany). The specifications of the products as provided by the
manufacturer are listed in Table 4.1.
TableTetrachloroauric (III) acid trihydrate>99.9 % (HAuCl4.3H2O) (Sigma Aldrand ich,
USA) was used for the synthesis of gold nanoparticles. NaBH4>95.0% (TCI, Tokyo,
Japan), and HPLC grade solvents such as methanol >99.9%, and toluene > 99.9% (RCI
Labscan Limited, Thailand) were used as received.
Deionized water (DIW) was taken from ICCBS distillation plant. Acetonitrile (ACN)
>99.99% (Fischer scientific, USA) was dried over 3 Å molecular sieves to remove the
traces of water prior to use. Standard nicotine ≥ 99.0 % was purchased from Fluka
Chemie Gmbh (Buchs, Switzerland). Two supporting electrolytes (SE), tetra-n-butyl
ammonium perchlorate (TBAP) >99.0% (TCI, Tokyo, Japan) and potassium chloride
(KCl) >99.0 % (Merck, Germany), were used for non-aqueous and aqueous medium,
respectively. Silver nitrate (AgNO3) > 99.99% (Scharlau, Europe) was used for the
preparation of Ag/Ag+ reference electrode. All electrochemical experiments were carried
out at ambient room temperature (i.e. 28±1℃)
4.1.2 Instrumentation
UV–visible spectra were recorded with a double beam Shimadzu UV-1800 series
spectrophotometer (Kyoto, Japan) operated at 1 cm path length quartz cuvette. The
wavelength range from 190 to 800 nm was used.
The FTIR spectra were recorded on a Bruker Vector 22 spectrometer (Germany) by KBr
pellet method. Analyses of all samples were performed in the range of 400-4000 cm-1
.
Ten scans were recorded in order to obtain the spectral resolution of 0.1 cm–1
.
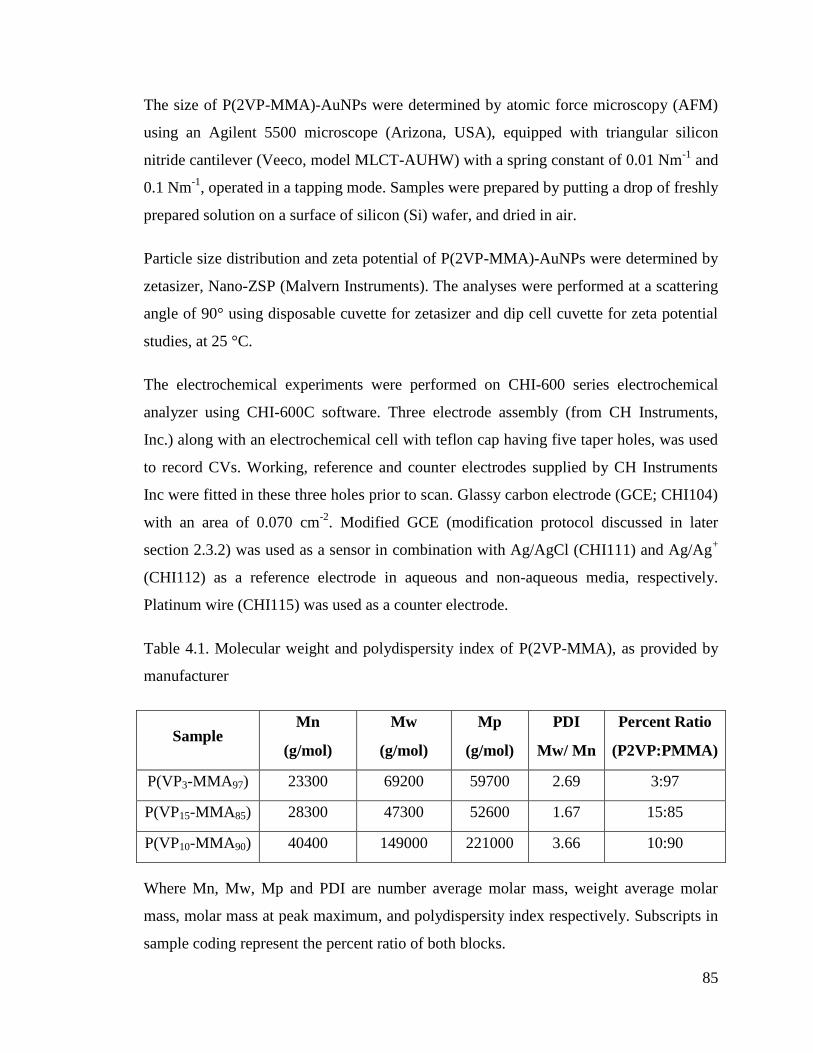
85
The size of P(2VP-MMA)-AuNPs were determined by atomic force microscopy (AFM)
using an Agilent 5500 microscope (Arizona, USA), equipped with triangular silicon
nitride cantilever (Veeco, model MLCT-AUHW) with a spring constant of 0.01 Nm-1
and
0.1 Nm-1
, operated in a tapping mode. Samples were prepared by putting a drop of freshly
prepared solution on a surface of silicon (Si) wafer, and dried in air.
Particle size distribution and zeta potential of P(2VP-MMA)-AuNPs were determined by
zetasizer, Nano-ZSP (Malvern Instruments). The analyses were performed at a scattering
angle of 90° using disposable cuvette for zetasizer and dip cell cuvette for zeta potential
studies, at 25 °C.
The electrochemical experiments were performed on CHI-600 series electrochemical
analyzer using CHI-600C software. Three electrode assembly (from CH Instruments,
Inc.) along with an electrochemical cell with teflon cap having five taper holes, was used
to record CVs. Working, reference and counter electrodes supplied by CH Instruments
Inc were fitted in these three holes prior to scan. Glassy carbon electrode (GCE; CHI104)
with an area of 0.070 cm-2
. Modified GCE (modification protocol discussed in later
section 2.3.2) was used as a sensor in combination with Ag/AgCl (CHI111) and Ag/Ag+
(CHI112) as a reference electrode in aqueous and non-aqueous media, respectively.
Platinum wire (CHI115) was used as a counter electrode.
Table 4.1. Molecular weight and polydispersity index of P(2VP-MMA), as provided by
manufacturer
Sample Mn
(g/mol)
Mw
(g/mol)
Mp
(g/mol)
PDI
Mw/ Mn
Percent Ratio
(P2VP:PMMA)
P(VP3-MMA97) 23300 69200 59700 2.69 3:97
P(VP15-MMA85) 28300 47300 52600 1.67 15:85
P(VP10-MMA90) 40400 149000 221000 3.66 10:90
Where Mn, Mw, Mp and PDI are number average molar mass, weight average molar
mass, molar mass at peak maximum, and polydispersity index respectively. Subscripts in
sample coding represent the percent ratio of both blocks.
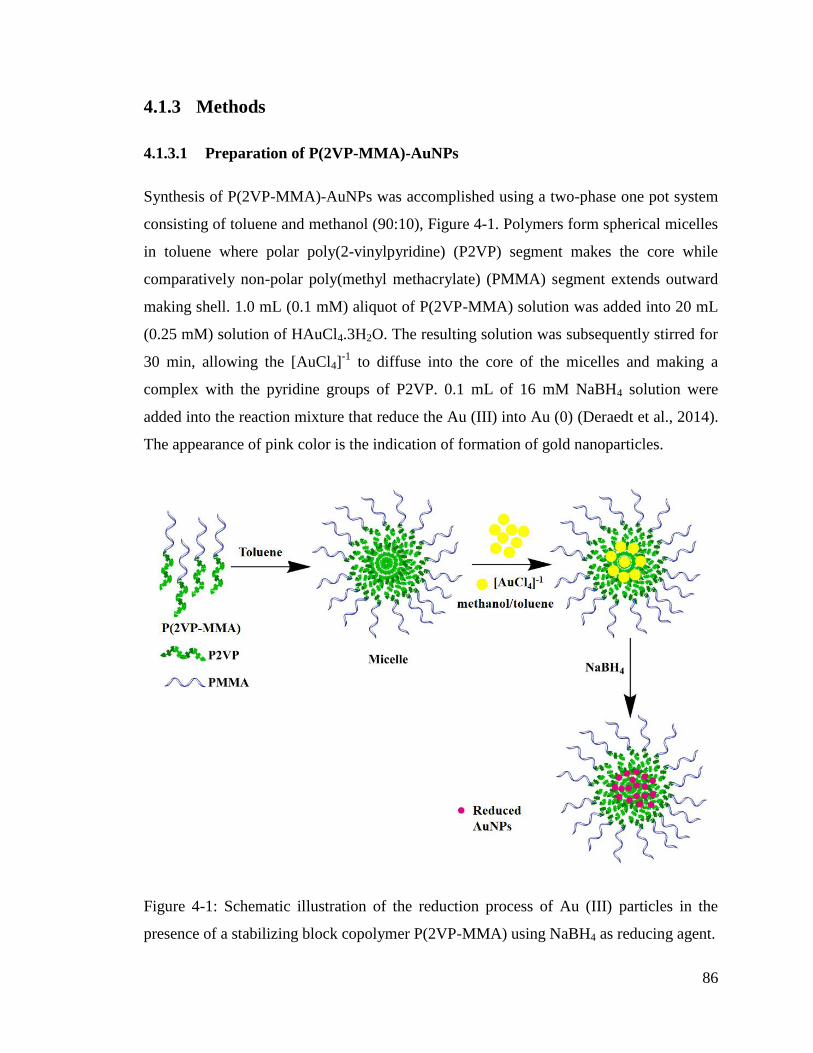
86
4.1.3 Methods
4.1.3.1 Preparation of P(2VP-MMA)-AuNPs
Synthesis of P(2VP-MMA)-AuNPs was accomplished using a two-phase one pot system
consisting of toluene and methanol (90:10), Figure 4-1. Polymers form spherical micelles
in toluene where polar poly(2-vinylpyridine) (P2VP) segment makes the core while
comparatively non-polar poly(methyl methacrylate) (PMMA) segment extends outward
making shell. 1.0 mL (0.1 mM) aliquot of P(2VP-MMA) solution was added into 20 mL
(0.25 mM) solution of HAuCl4.3H2O. The resulting solution was subsequently stirred for
30 min, allowing the [AuCl4]-1
to diffuse into the core of the micelles and making a
complex with the pyridine groups of P2VP. 0.1 mL of 16 mM NaBH4 solution were
added into the reaction mixture that reduce the Au (III) into Au (0) (Deraedt et al., 2014).
The appearance of pink color is the indication of formation of gold nanoparticles.
Figure 4-1: Schematic illustration of the reduction process of Au (III) particles in the
presence of a stabilizing block copolymer P(2VP-MMA) using NaBH4 as reducing agent.
87
4.1.3.2 Electrochemical studies
For electrochemical study of AuNP on nicotine determination GCE was modified with
selected AuNps. Modification of GCE was carried out by adopting a simple drop cast
procedure. This was done by adding 1-2 drops of P(2VP-MMA)-AuNPs on surface of
GCE and left it as an upward position to air dry for least 7-10 min. After complete
drying, modified GCE was used as a sensor in connected with reference and counter
electrode. As modification, renewing surface of GCE is also a staple part of this
electrochemical study presented here. Hence, after each scan the surface of working
electrode, P(2VP-MMA)-AuNPs-GCE, was renewed by polishing it with alumina (mesh
size 0.3 micron) and sonicated in acetone followed by distilled water for 5 min.
A blank test solution was prepared by taking 5.0 mL of 0.1M solution of SE (KCl or
TBAP) in electrochemical cell for voltammetric titration. This solution was then titrated
by stepwise addition of specific volume (μL) of freshly prepared 0.1-0.2 M nicotine to
maintain the minimum concentration and scan voltammogram. All voltammetric
measurements were referred to Ag/AgCl and / or Ag/Ag+ with the scan rate of 0.1 Vs
-1.
For non-aqueous system, silver-silver ion (Ag/Ag+) electrode was used with freshly
prepared 5.0 mM solution of AgNO3 and 0.1M tetra-n-butyl ammonium perchlorate in
acetonitrile.
Voltammetric (oxidative) wave of nicotine appears at positive potential, though an
attempt of degassing the test solution by bubbling high purity argon gas is to be an
optional. Thus, deoxygenate when scan towards negative potential direction only.
Scanning potential (positively) from 0 to +1.4V and subsequently reversing it back
remained as a usual practice throughout this study.
4.2 Results and Discussion
4.2.1 Characterization of P(2VP-MMA)-AuNPs
Reduction of gold ions into gold nanoparticles is indicated by conversion of yellow
reaction mixture to pink, also confirmed by measuring UV–vis spectra of the solution that
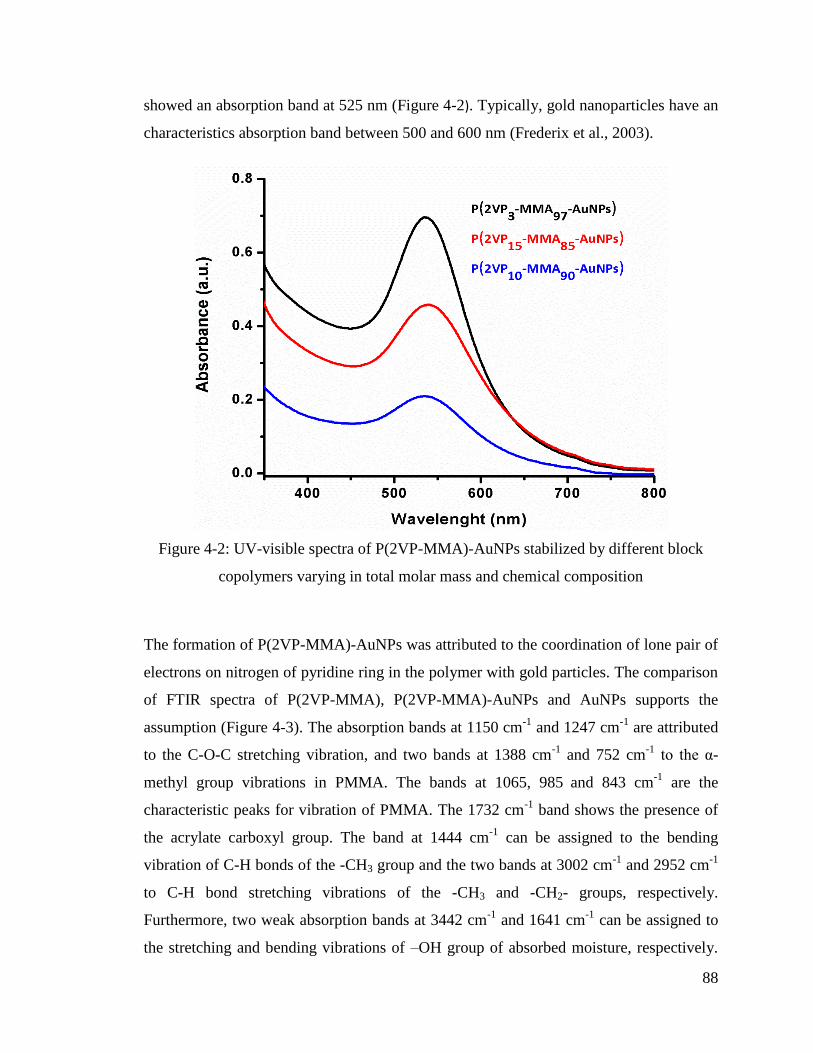
88
showed an absorption band at 525 nm (Figure 4-2). Typically, gold nanoparticles have an
characteristics absorption band between 500 and 600 nm (Frederix et al., 2003).
Figure 4-2: UV-visible spectra of P(2VP-MMA)-AuNPs stabilized by different block
copolymers varying in total molar mass and chemical composition
The formation of P(2VP-MMA)-AuNPs was attributed to the coordination of lone pair of
electrons on nitrogen of pyridine ring in the polymer with gold particles. The comparison
of FTIR spectra of P(2VP-MMA), P(2VP-MMA)-AuNPs and AuNPs supports the
assumption (Figure 4-3). The absorption bands at 1150 cm-1
and 1247 cm-1
are attributed
to the C-O-C stretching vibration, and two bands at 1388 cm-1
and 752 cm-1
to the α-
methyl group vibrations in PMMA. The bands at 1065, 985 and 843 cm
-1 are the
characteristic peaks for vibration of PMMA. The 1732 cm-1
band shows the presence of
the acrylate carboxyl group. The band at 1444 cm-1
can be assigned to the bending
vibration of C-H bonds of the -CH3 group and the two bands at 3002 cm-1
and 2952 cm-1
to C-H bond stretching vibrations of the -CH3 and -CH2- groups, respectively.
Furthermore, two weak absorption bands at 3442 cm-1
and 1641 cm-1
can be assigned to
the stretching and bending vibrations of –OH group of absorbed moisture, respectively.
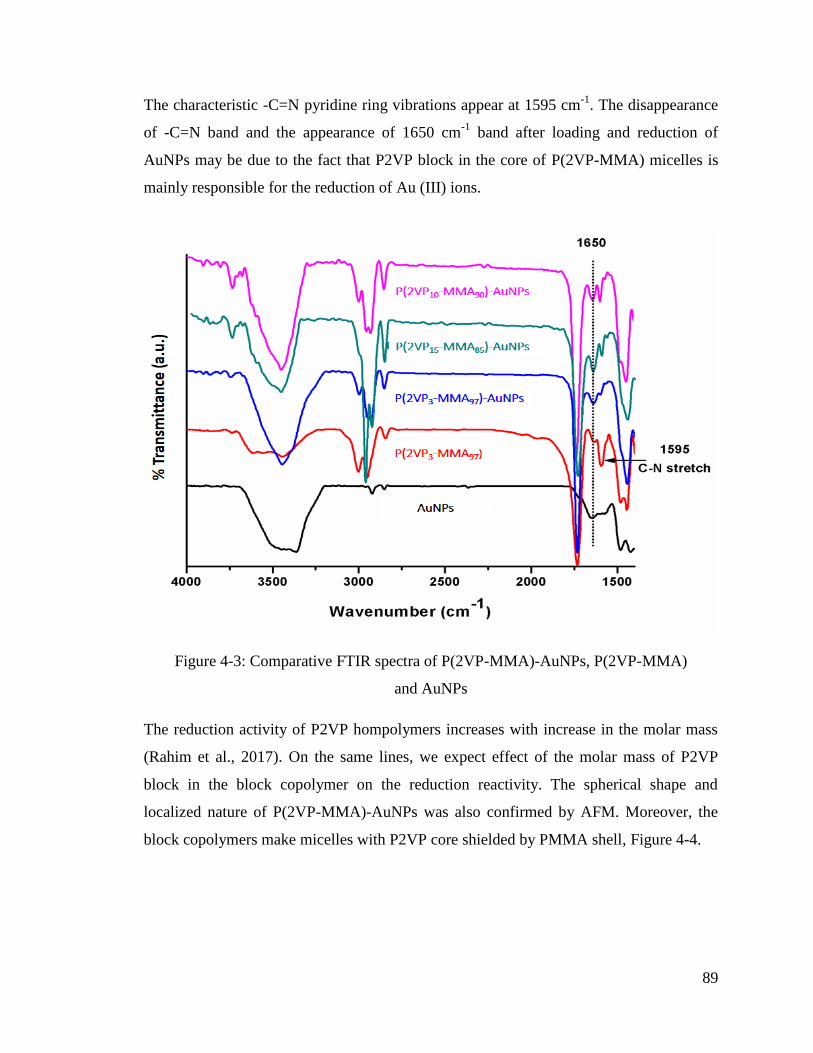
89
The characteristic -C=N pyridine ring vibrations appear at 1595 cm-1
. The disappearance
of -C=N band and the appearance of 1650 cm-1
band after loading and reduction of
AuNPs may be due to the fact that P2VP block in the core of P(2VP-MMA) micelles is
mainly responsible for the reduction of Au (III) ions.
Figure 4-3: Comparative FTIR spectra of P(2VP-MMA)-AuNPs, P(2VP-MMA)
and AuNPs
The reduction activity of P2VP hompolymers increases with increase in the molar mass
(Rahim et al., 2017). On the same lines, we expect effect of the molar mass of P2VP
block in the block copolymer on the reduction reactivity. The spherical shape and
localized nature of P(2VP-MMA)-AuNPs was also confirmed by AFM. Moreover, the
block copolymers make micelles with P2VP core shielded by PMMA shell, Figure 4-4.
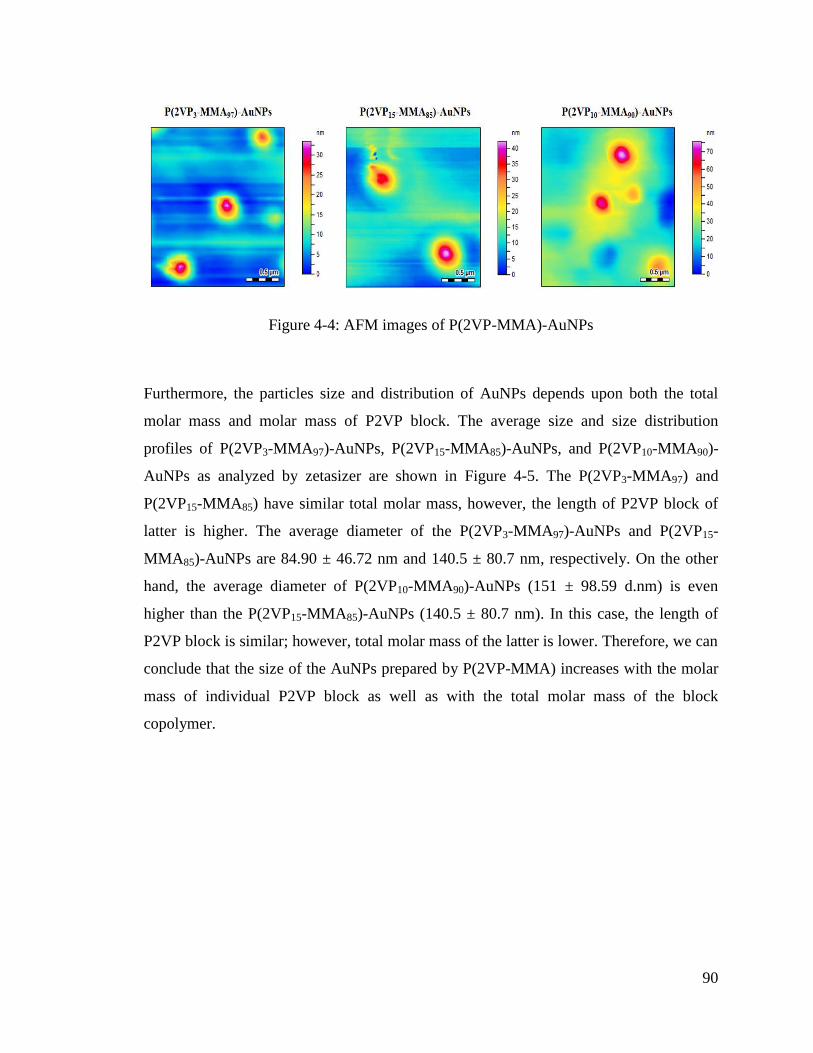
90
Figure 4-4: AFM images of P(2VP-MMA)-AuNPs
Furthermore, the particles size and distribution of AuNPs depends upon both the total
molar mass and molar mass of P2VP block. The average size and size distribution
profiles of P(2VP3-MMA97)-AuNPs, P(2VP15-MMA85)-AuNPs, and P(2VP10-MMA90)-
AuNPs as analyzed by zetasizer are shown in Figure 4-5. The P(2VP3-MMA97) and
P(2VP15-MMA85) have similar total molar mass, however, the length of P2VP block of
latter is higher. The average diameter of the P(2VP3-MMA97)-AuNPs and P(2VP15-
MMA85)-AuNPs are 84.90 ± 46.72 nm and 140.5 ± 80.7 nm, respectively. On the other
hand, the average diameter of P(2VP10-MMA90)-AuNPs (151 ± 98.59 d.nm) is even
higher than the P(2VP15-MMA85)-AuNPs (140.5 ± 80.7 nm). In this case, the length of
P2VP block is similar; however, total molar mass of the latter is lower. Therefore, we can
conclude that the size of the AuNPs prepared by P(2VP-MMA) increases with the molar
mass of individual P2VP block as well as with the total molar mass of the block
copolymer.
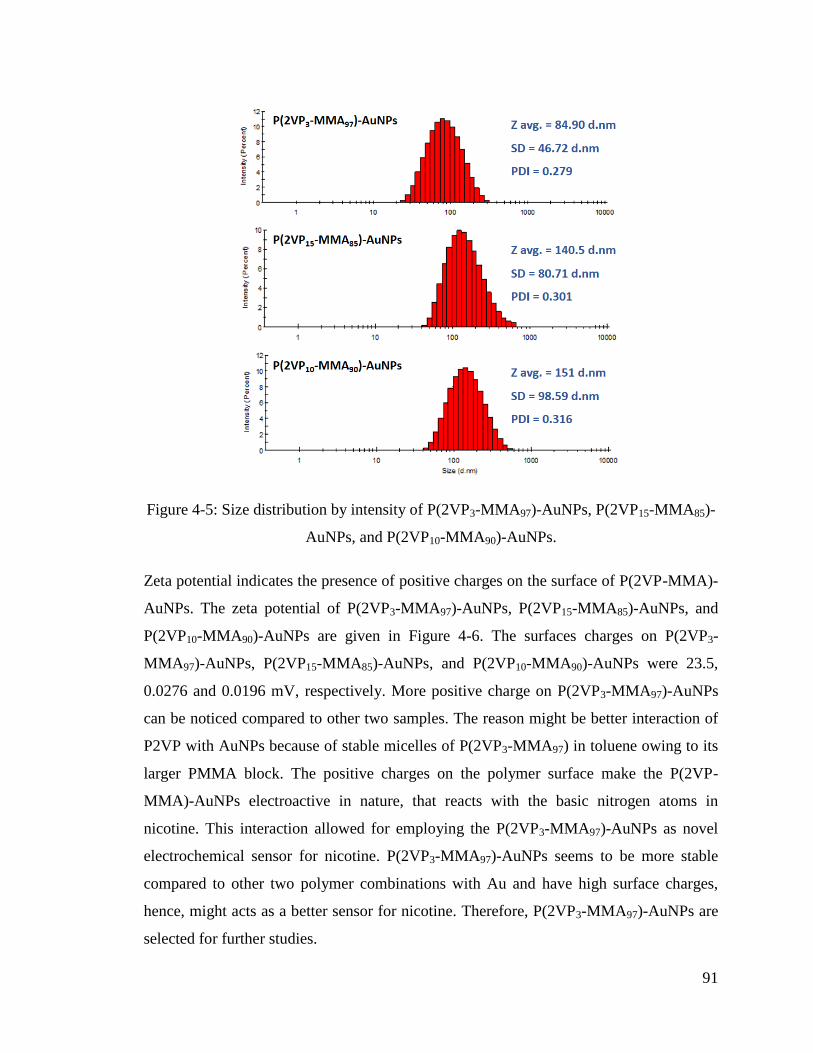
91
Figure 4-5: Size distribution by intensity of P(2VP3-MMA97)-AuNPs, P(2VP15-MMA85)-
AuNPs, and P(2VP10-MMA90)-AuNPs.
Zeta potential indicates the presence of positive charges on the surface of P(2VP-MMA)-
AuNPs. The zeta potential of P(2VP3-MMA97)-AuNPs, P(2VP15-MMA85)-AuNPs, and
P(2VP10-MMA90)-AuNPs are given in Figure 4-6. The surfaces charges on P(2VP3-
MMA97)-AuNPs, P(2VP15-MMA85)-AuNPs, and P(2VP10-MMA90)-AuNPs were 23.5,
0.0276 and 0.0196 mV, respectively. More positive charge on P(2VP3-MMA97)-AuNPs
can be noticed compared to other two samples. The reason might be better interaction of
P2VP with AuNPs because of stable micelles of P(2VP3-MMA97) in toluene owing to its
larger PMMA block. The positive charges on the polymer surface make the P(2VP-
MMA)-AuNPs electroactive in nature, that reacts with the basic nitrogen atoms in
nicotine. This interaction allowed for employing the P(2VP3-MMA97)-AuNPs as novel
electrochemical sensor for nicotine. P(2VP3-MMA97)-AuNPs seems to be more stable
compared to other two polymer combinations with Au and have high surface charges,
hence, might acts as a better sensor for nicotine. Therefore, P(2VP3-MMA97)-AuNPs are
selected for further studies.
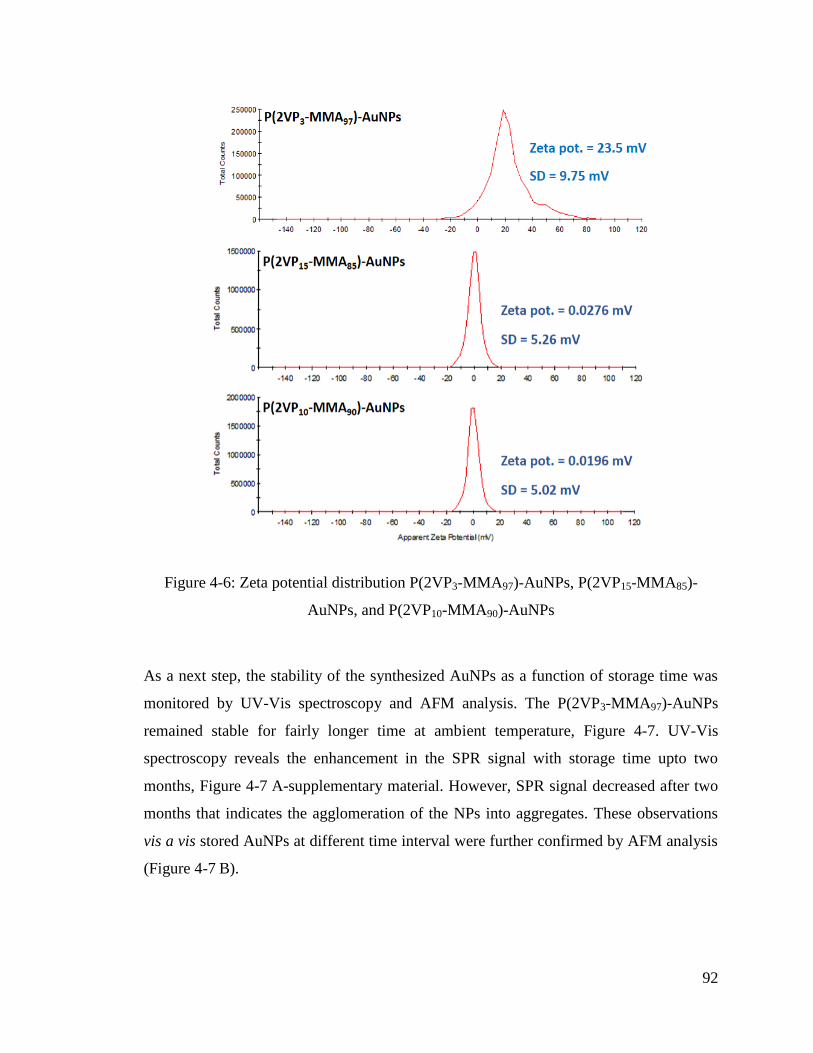
92
Figure 4-6: Zeta potential distribution P(2VP3-MMA97)-AuNPs, P(2VP15-MMA85)-
AuNPs, and P(2VP10-MMA90)-AuNPs
As a next step, the stability of the synthesized AuNPs as a function of storage time was
monitored by UV-Vis spectroscopy and AFM analysis. The P(2VP3-MMA97)-AuNPs
remained stable for fairly longer time at ambient temperature, Figure 4-7. UV-Vis
spectroscopy reveals the enhancement in the SPR signal with storage time upto two
months, Figure 4-7 A-supplementary material. However, SPR signal decreased after two
months that indicates the agglomeration of the NPs into aggregates. These observations
vis a vis stored AuNPs at different time interval were further confirmed by AFM analysis
(Figure 4-7 B).
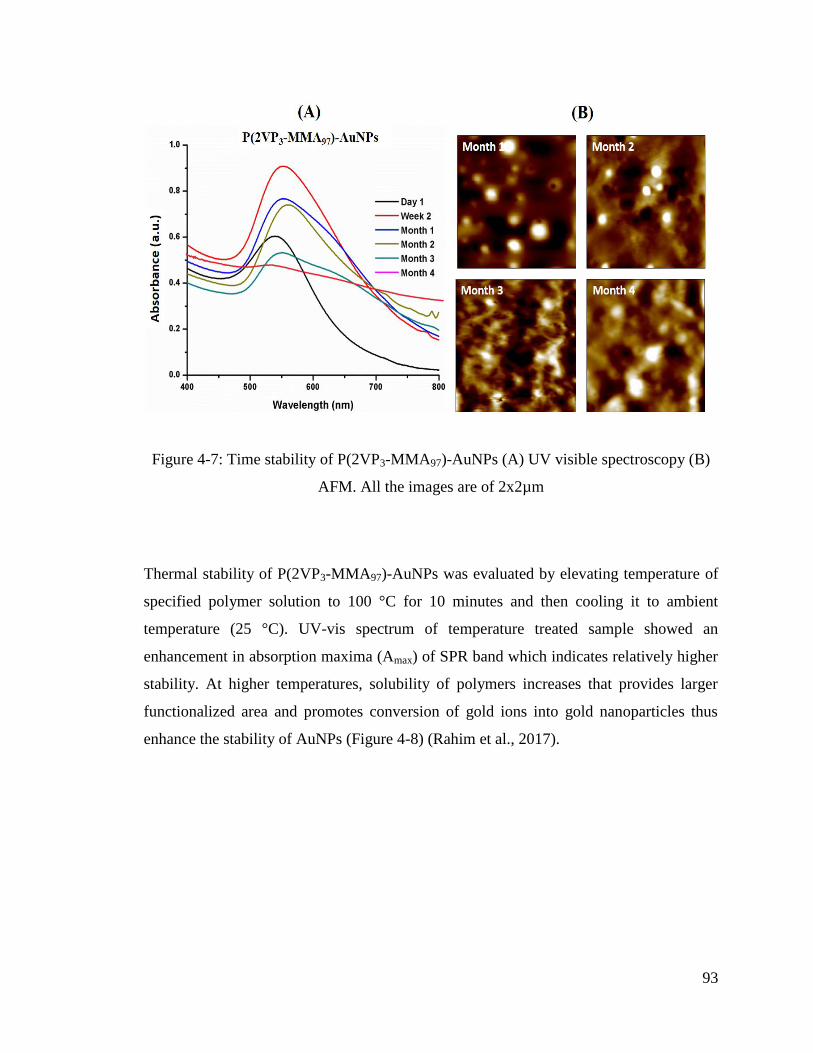
93
Figure 4-7: Time stability of P(2VP3-MMA97)-AuNPs (A) UV visible spectroscopy (B)
AFM. All the images are of 2x2µm
Thermal stability of P(2VP3-MMA97)-AuNPs was evaluated by elevating temperature of
specified polymer solution to 100 °C for 10 minutes and then cooling it to ambient
temperature (25 °C). UV-vis spectrum of temperature treated sample showed an
enhancement in absorption maxima (Amax) of SPR band which indicates relatively higher
stability. At higher temperatures, solubility of polymers increases that provides larger
functionalized area and promotes conversion of gold ions into gold nanoparticles thus
enhance the stability of AuNPs (Figure 4-8) (Rahim et al., 2017).
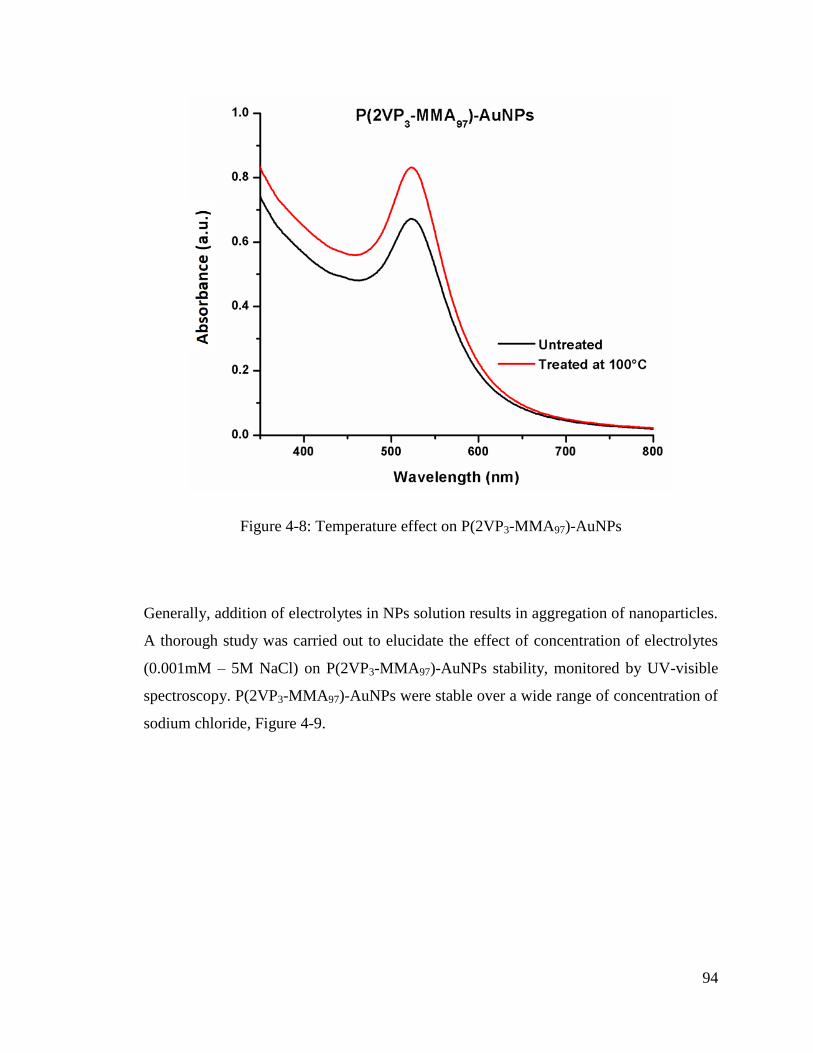
94
Figure 4-8: Temperature effect on P(2VP3-MMA97)-AuNPs
Generally, addition of electrolytes in NPs solution results in aggregation of nanoparticles.
A thorough study was carried out to elucidate the effect of concentration of electrolytes
(0.001mM – 5M NaCl) on P(2VP3-MMA97)-AuNPs stability, monitored by UV-visible
spectroscopy. P(2VP3-MMA97)-AuNPs were stable over a wide range of concentration of
sodium chloride, Figure 4-9.
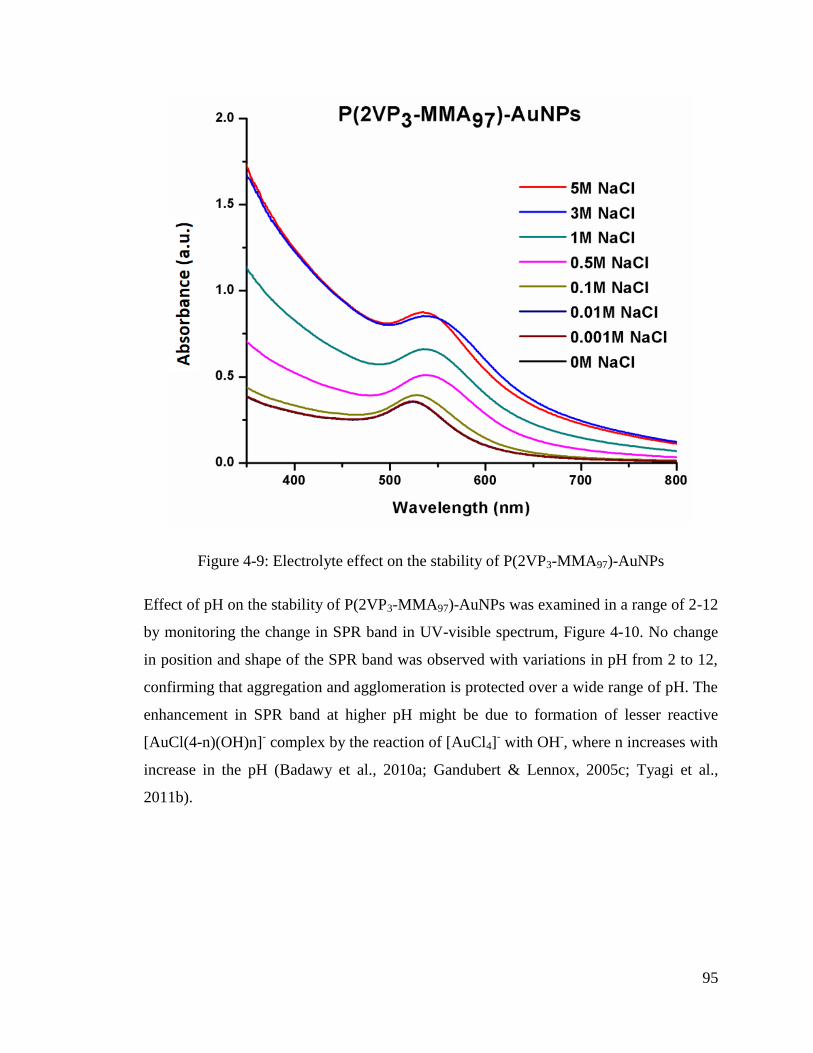
95
Figure 4-9: Electrolyte effect on the stability of P(2VP3-MMA97)-AuNPs
Effect of pH on the stability of P(2VP3-MMA97)-AuNPs was examined in a range of 2-12
by monitoring the change in SPR band in UV-visible spectrum, Figure 4-10. No change
in position and shape of the SPR band was observed with variations in pH from 2 to 12,
confirming that aggregation and agglomeration is protected over a wide range of pH. The
enhancement in SPR band at higher pH might be due to formation of lesser reactive
[AuCl(4-n)(OH)n]- complex by the reaction of [AuCl4]
- with OH
-, where n increases with
increase in the pH (Badawy et al., 2010a; Gandubert & Lennox, 2005c; Tyagi et al.,
2011b).
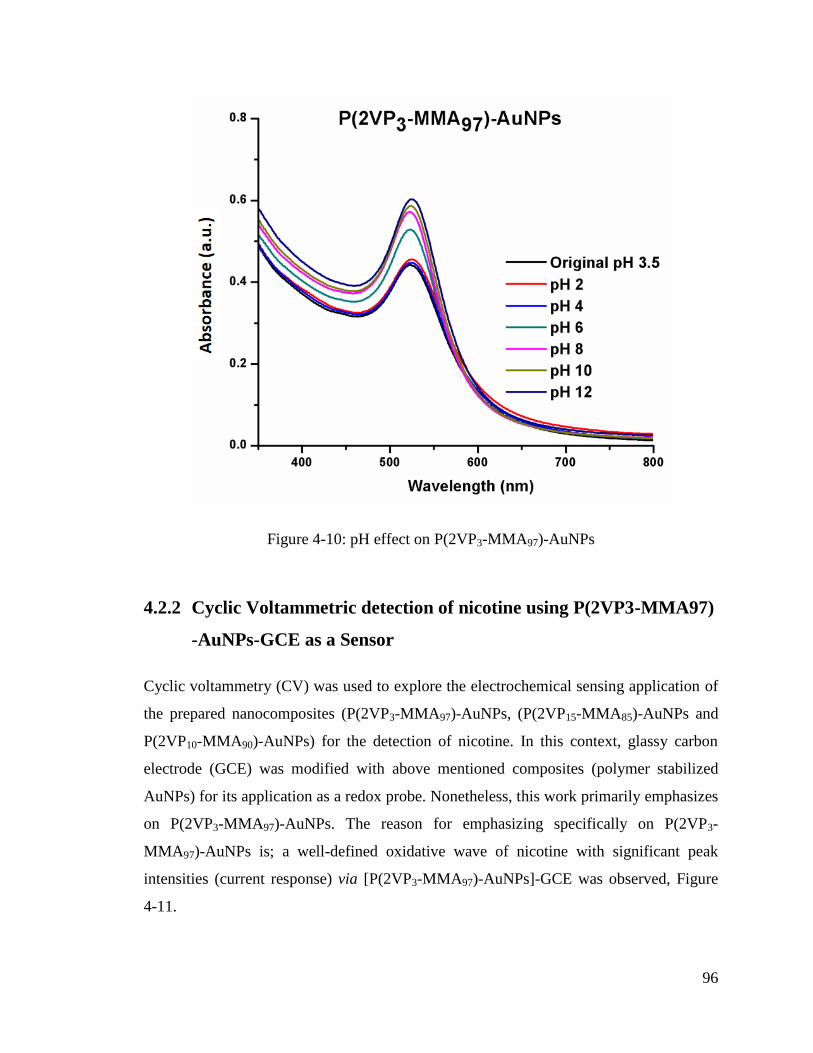
96
Figure 4-10: pH effect on P(2VP3-MMA97)-AuNPs
4.2.2 Cyclic Voltammetric detection of nicotine using P(2VP3-MMA97)
-AuNPs-GCE as a Sensor
Cyclic voltammetry (CV) was used to explore the electrochemical sensing application of
the prepared nanocomposites (P(2VP3-MMA97)-AuNPs, (P(2VP15-MMA85)-AuNPs and
P(2VP10-MMA90)-AuNPs) for the detection of nicotine. In this context, glassy carbon
electrode (GCE) was modified with above mentioned composites (polymer stabilized
AuNPs) for its application as a redox probe. Nonetheless, this work primarily emphasizes
on P(2VP3-MMA97)-AuNPs. The reason for emphasizing specifically on P(2VP3-
MMA97)-AuNPs is; a well-defined oxidative wave of nicotine with significant peak
intensities (current response) via [P(2VP3-MMA97)-AuNPs]-GCE was observed, Figure
4-11.
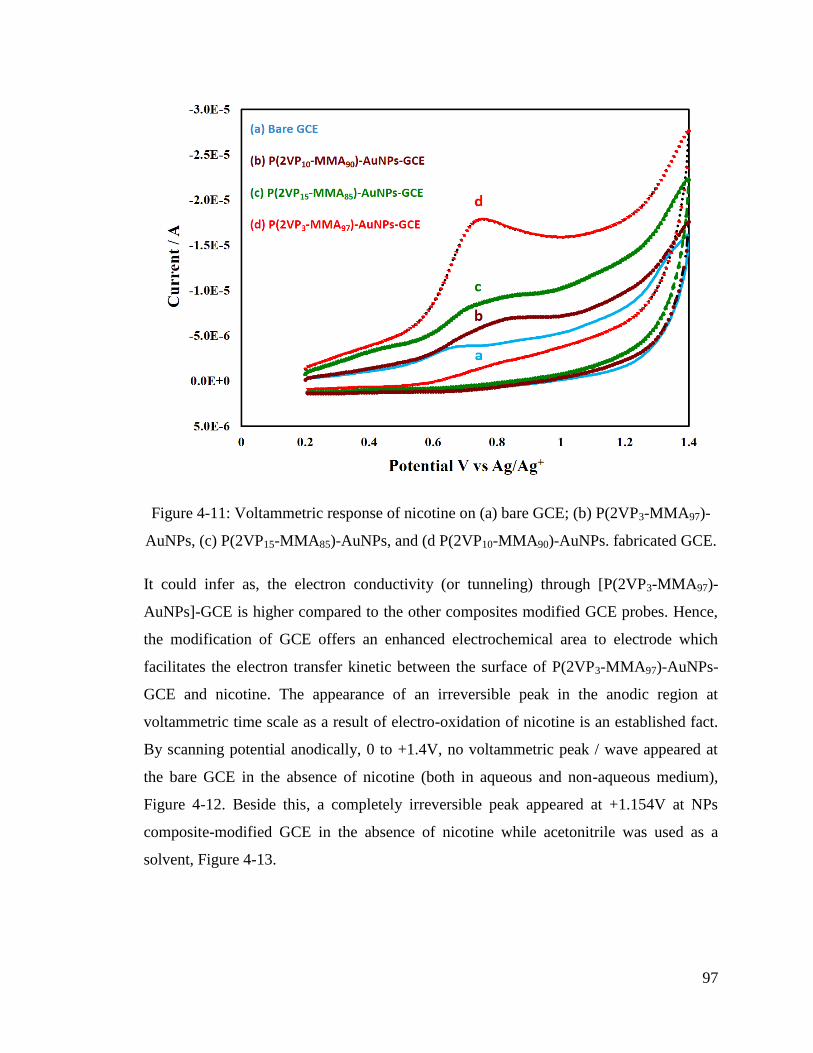
97
Figure 4-11: Voltammetric response of nicotine on (a) bare GCE; (b) P(2VP3-MMA97)-
AuNPs, (c) P(2VP15-MMA85)-AuNPs, and (d P(2VP10-MMA90)-AuNPs. fabricated GCE.
It could infer as, the electron conductivity (or tunneling) through [P(2VP3-MMA97)-
AuNPs]-GCE is higher compared to the other composites modified GCE probes. Hence,
the modification of GCE offers an enhanced electrochemical area to electrode which
facilitates the electron transfer kinetic between the surface of P(2VP3-MMA97)-AuNPs-
GCE and nicotine. The appearance of an irreversible peak in the anodic region at
voltammetric time scale as a result of electro-oxidation of nicotine is an established fact.
By scanning potential anodically, 0 to +1.4V, no voltammetric peak / wave appeared at
the bare GCE in the absence of nicotine (both in aqueous and non-aqueous medium),
Figure 4-12. Beside this, a completely irreversible peak appeared at +1.154V at NPs
composite-modified GCE in the absence of nicotine while acetonitrile was used as a
solvent, Figure 4-13.
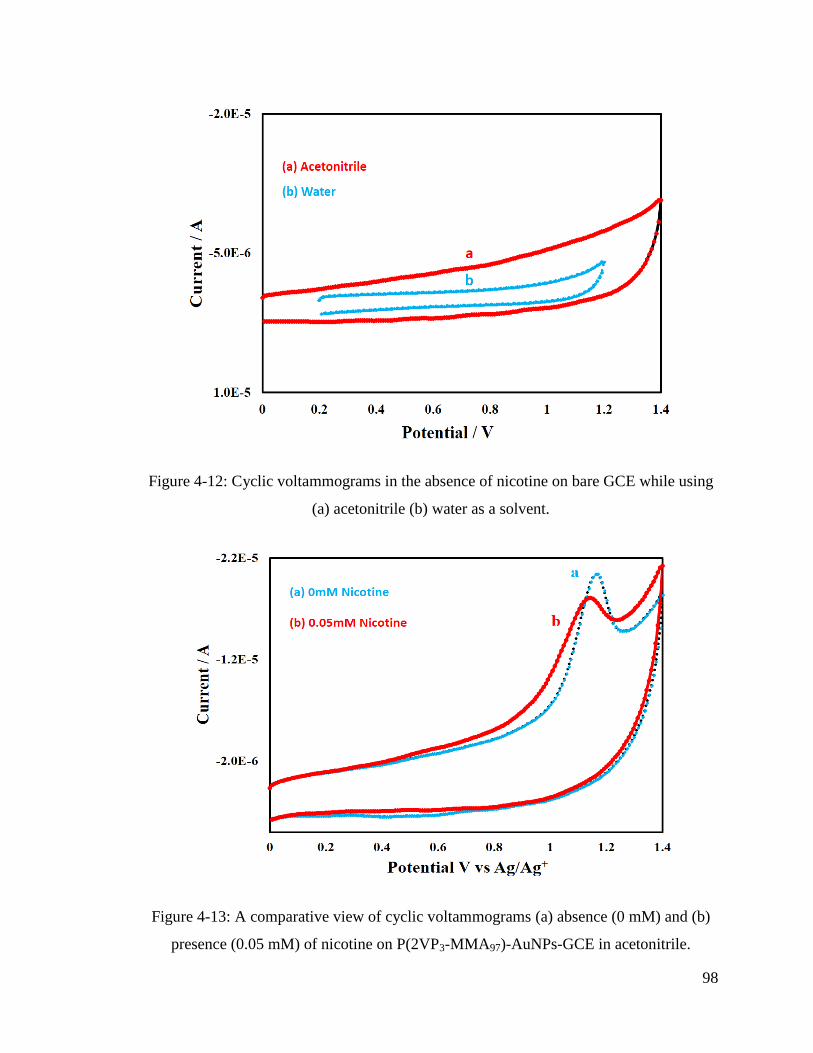
98
Figure 4-12: Cyclic voltammograms in the absence of nicotine on bare GCE while using
(a) acetonitrile (b) water as a solvent.
Figure 4-13: A comparative view of cyclic voltammograms (a) absence (0 mM) and (b)
presence (0.05 mM) of nicotine on P(2VP3-MMA97)-AuNPs-GCE in acetonitrile.
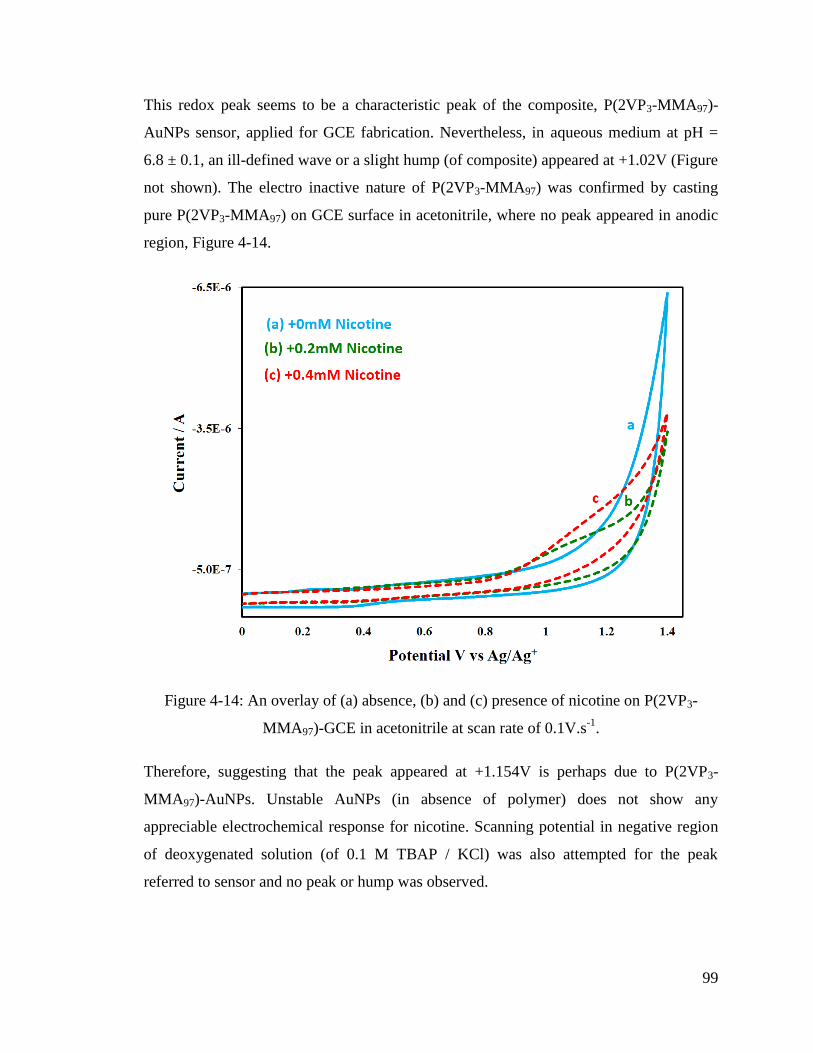
99
This redox peak seems to be a characteristic peak of the composite, P(2VP3-MMA97)-
AuNPs sensor, applied for GCE fabrication. Nevertheless, in aqueous medium at pH =
6.8 ± 0.1, an ill-defined wave or a slight hump (of composite) appeared at +1.02V (Figure
not shown). The electro inactive nature of P(2VP3-MMA97) was confirmed by casting
pure P(2VP3-MMA97) on GCE surface in acetonitrile, where no peak appeared in anodic
region, Figure 4-14.
Figure 4-14: An overlay of (a) absence, (b) and (c) presence of nicotine on P(2VP3-
MMA97)-GCE in acetonitrile at scan rate of 0.1V.s-1
.
Therefore, suggesting that the peak appeared at +1.154V is perhaps due to P(2VP3-
MMA97)-AuNPs. Unstable AuNPs (in absence of polymer) does not show any
appreciable electrochemical response for nicotine. Scanning potential in negative region
of deoxygenated solution (of 0.1 M TBAP / KCl) was also attempted for the peak
referred to sensor and no peak or hump was observed.
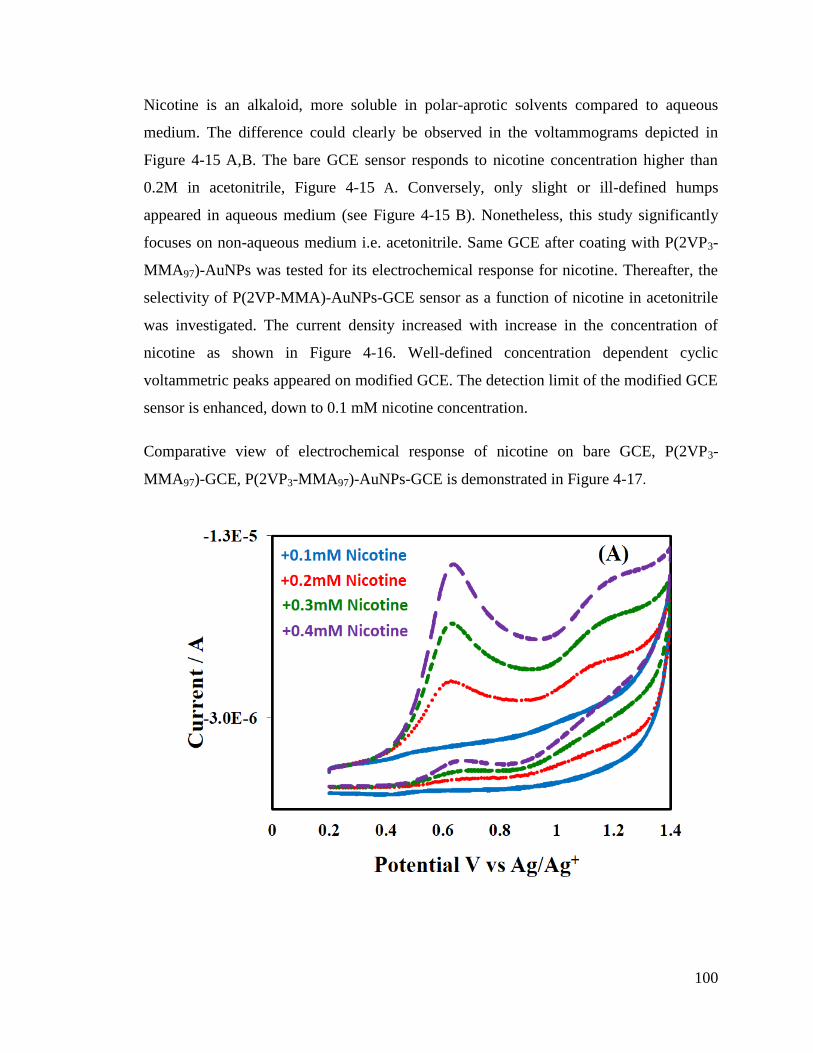
100
Nicotine is an alkaloid, more soluble in polar-aprotic solvents compared to aqueous
medium. The difference could clearly be observed in the voltammograms depicted in
Figure 4-15 A,B. The bare GCE sensor responds to nicotine concentration higher than
0.2M in acetonitrile, Figure 4-15 A. Conversely, only slight or ill-defined humps
appeared in aqueous medium (see Figure 4-15 B). Nonetheless, this study significantly
focuses on non-aqueous medium i.e. acetonitrile. Same GCE after coating with P(2VP3-
MMA97)-AuNPs was tested for its electrochemical response for nicotine. Thereafter, the
selectivity of P(2VP-MMA)-AuNPs-GCE sensor as a function of nicotine in acetonitrile
was investigated. The current density increased with increase in the concentration of
nicotine as shown in Figure 4-16. Well-defined concentration dependent cyclic
voltammetric peaks appeared on modified GCE. The detection limit of the modified GCE
sensor is enhanced, down to 0.1 mM nicotine concentration.
Comparative view of electrochemical response of nicotine on bare GCE, P(2VP3-
MMA97)-GCE, P(2VP3-MMA97)-AuNPs-GCE is demonstrated in Figure 4-17.
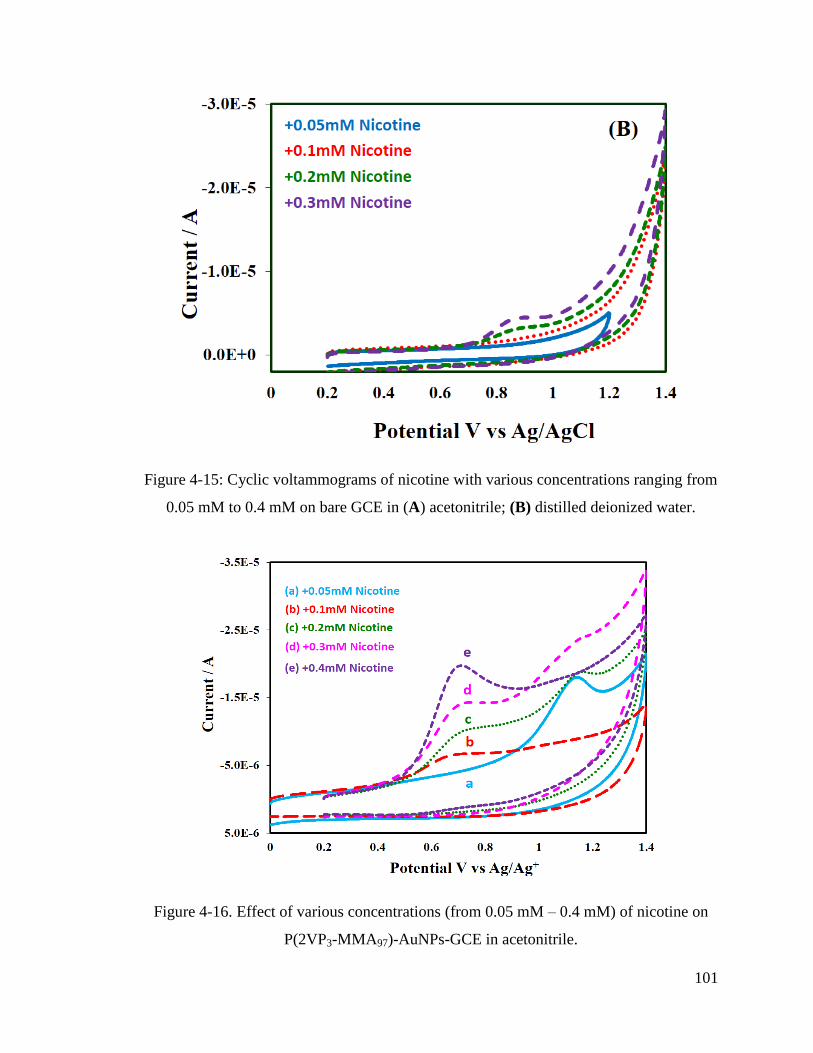
101
Figure 4-15: Cyclic voltammograms of nicotine with various concentrations ranging from
0.05 mM to 0.4 mM on bare GCE in (A) acetonitrile; (B) distilled deionized water.
Figure 4-16. Effect of various concentrations (from 0.05 mM – 0.4 mM) of nicotine on
P(2VP3-MMA97)-AuNPs-GCE in acetonitrile.
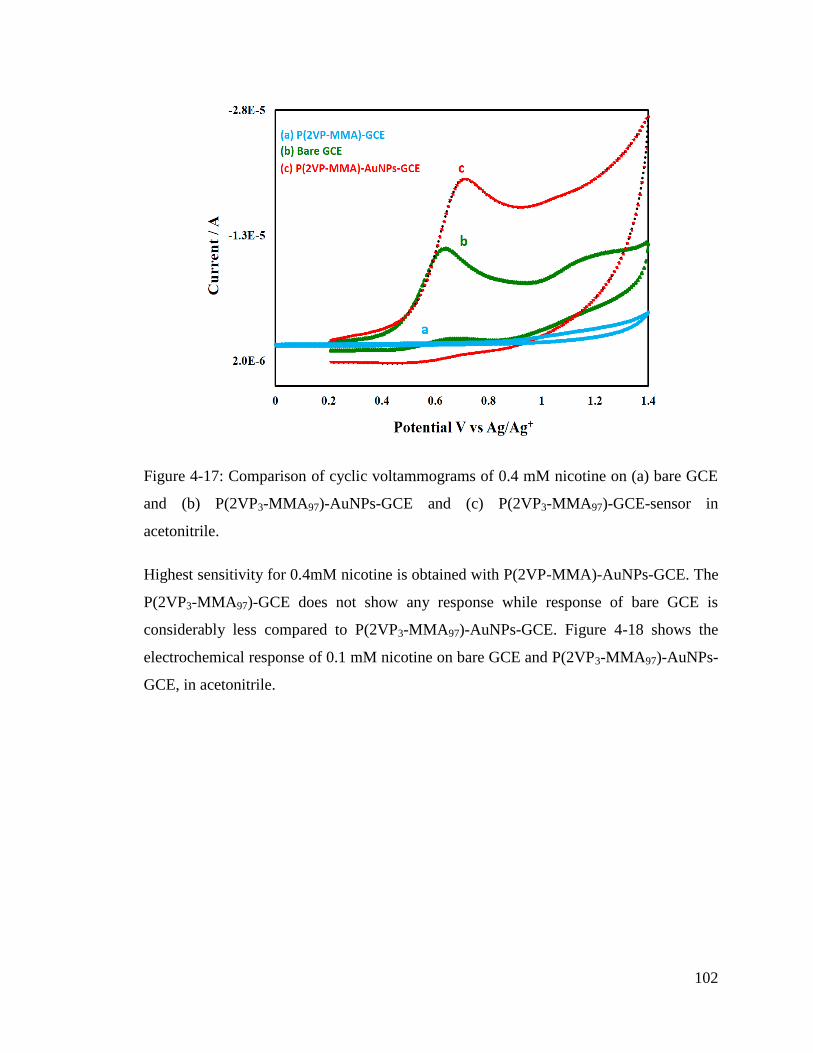
102
Figure 4-17: Comparison of cyclic voltammograms of 0.4 mM nicotine on (a) bare GCE
and (b) P(2VP3-MMA97)-AuNPs-GCE and (c) P(2VP3-MMA97)-GCE-sensor in
acetonitrile.
Highest sensitivity for 0.4mM nicotine is obtained with P(2VP-MMA)-AuNPs-GCE. The
P(2VP3-MMA97)-GCE does not show any response while response of bare GCE is
considerably less compared to P(2VP3-MMA97)-AuNPs-GCE. Figure 4-18 shows the
electrochemical response of 0.1 mM nicotine on bare GCE and P(2VP3-MMA97)-AuNPs-
GCE, in acetonitrile.
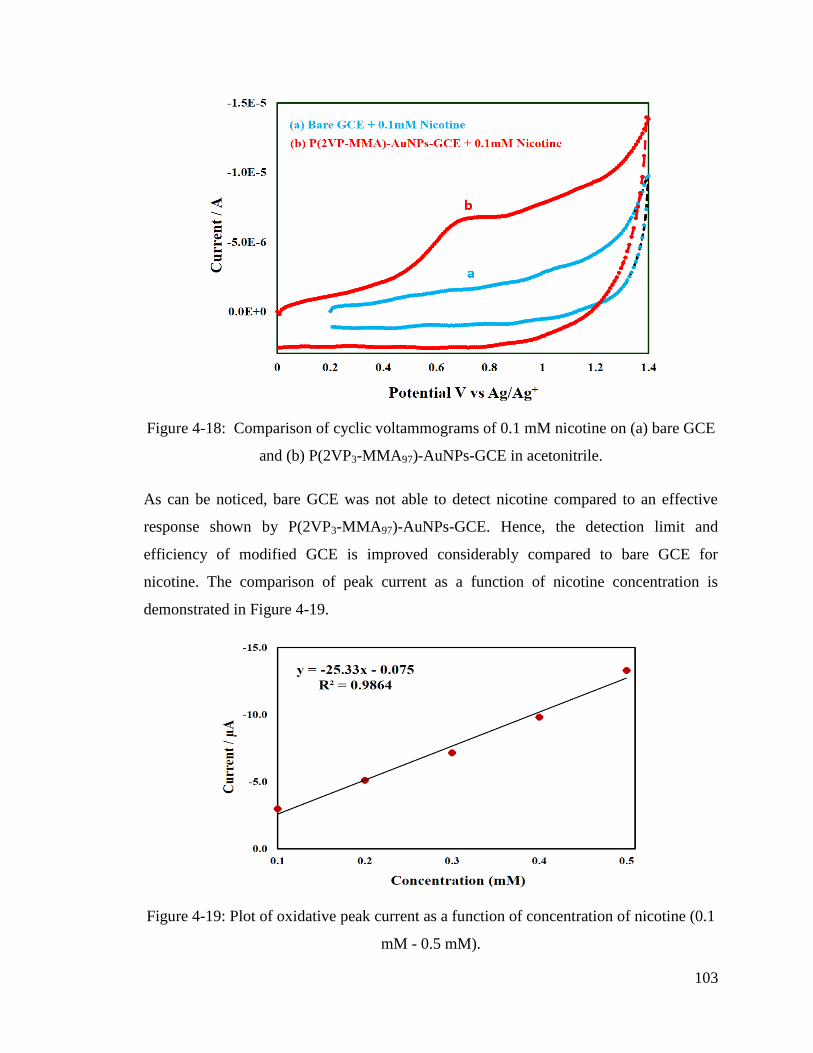
103
Figure 4-18: Comparison of cyclic voltammograms of 0.1 mM nicotine on (a) bare GCE
and (b) P(2VP3-MMA97)-AuNPs-GCE in acetonitrile.
As can be noticed, bare GCE was not able to detect nicotine compared to an effective
response shown by P(2VP3-MMA97)-AuNPs-GCE. Hence, the detection limit and
efficiency of modified GCE is improved considerably compared to bare GCE for
nicotine. The comparison of peak current as a function of nicotine concentration is
demonstrated in Figure 4-19.
Figure 4-19: Plot of oxidative peak current as a function of concentration of nicotine (0.1
mM - 0.5 mM).
104
The peak current increases with increasing concentration of nicotine linearly with a high
statistical correlation R2
value, 0.986. The stability and reproducibility of nicotine sensor
P(2VP3-MMA97)-AuNPs-GCE was also investigated at different time intervals. For this
particular study, the sensor was refrigerated (below 5°C) for more than 4 weeks and
evaluated for its performance.
4.3 Conclusion
In this study, a novel P(2VP3-MMA97)-AuNPs-GCE based electrochemical sensor is
reported for rapid quantitative assay of nicotine. Stability and homogeneous nature of
P(2VP3-MMA97)-AuNPs was confirmed by UV-Vis, FTIR, AFM, and zetasizer. The
sensitivity of bare GCE is significantly enhanced by coating with P(2VP3-MMA97)-
AuNPs. A well-developed voltammetric peak appeared at +0.66 V (versus Ag/Ag+), in
acetonitrile for determination of nicotine in the concentration range of 0.1 – 0.4 mM with
a detection limit of 0.16 mM. The P(2VP3-MMA97)-AuNPs-GCE is more sensitive
towards nicotine, the electrochemical response obtained by P(2VP3-MMA97)-AuNPs-
GCE is enhanced by an enhancement factor of ~2 compared to bare GCE. Simple, facile,
low cost synthesis and high stability of P(2VP3-MMA97)-AuNPs-GCE make it a valuable
choice for routine laboratory testing.
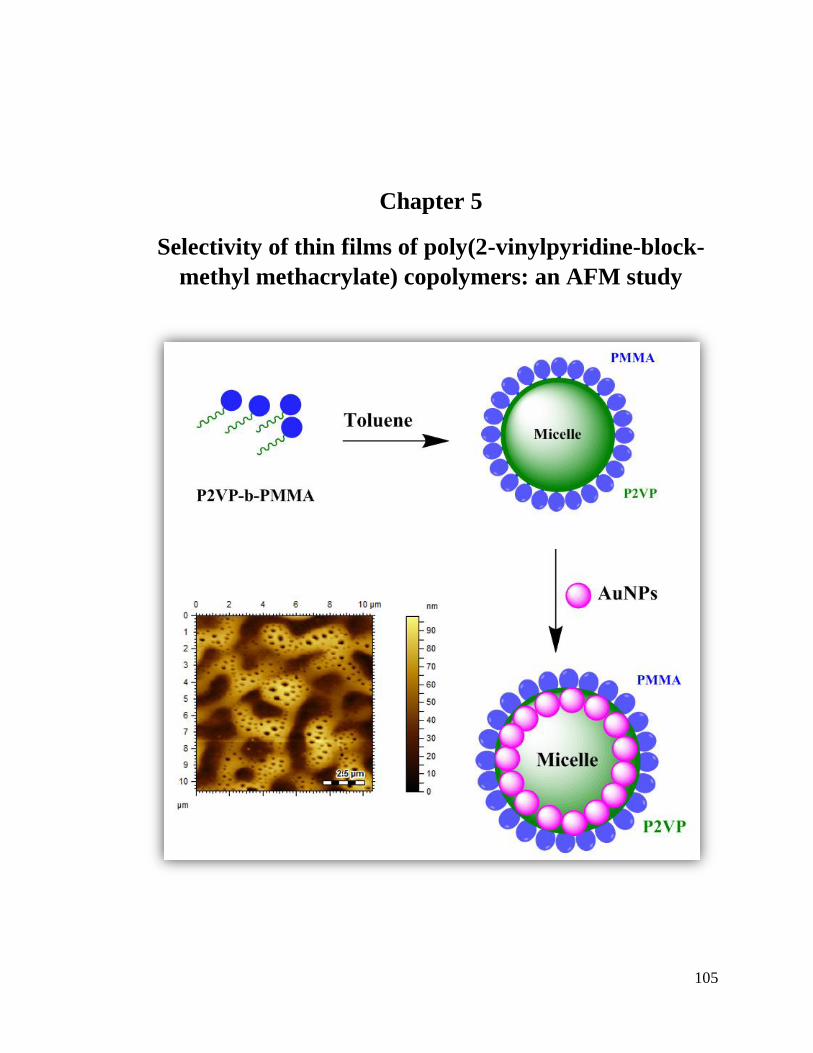
105
Chapter 5
Selectivity of thin films of poly(2-vinylpyridine-block-
methyl methacrylate) copolymers: an AFM study
106
Abstract
The surface morphologies of poly(2-vinyl pyridine-block-methyl methacrylate) (P2VP-b-
PMMA) (P(2VP-MMA)) copolymer thin films were analyzed via atomic force
microscopy. Different morphologies were observed with different molecular weights and
compositions of P(2VP-MMA). Moreover, the incorporation of gold nanoparticles
greatly influenced the surface morphology of P(2VP-MMA) and alter its surface
properties. The morphology of P(2VP-MMA) copolymer thin films were different from
solvent to solvent; for films cast from toluene, the poly(methyl methacrylate) (PMMA)
phase appeared as pits in the P2VP matrix, whereas the thin films cast from chloroform
solution exhibited a melted structure and small, separated PMMA phases as protrusions
over the P2VP was appeared in ethyl acetate. The annealing temperature affected the
surface morphology of P(2VP-MMA) copolymer thin films; the poly(2-vinyl pyridine)
(P2VP) phases at the surface were increased when the annealing temperature was higher
than the P2VP glass-transition temperature. The microphase structure of P(2VP-MMA)
copolymer thin films were also strongly influenced by different substrates.
5 Introduction
Block copolymer (BCP) films offers imaginable self-organized patterned morphologies
of molecular dimensions in a highly effective way due to difference between
compatibility and thermodynamic properties of different blocks. This high level of
control over nanostructure morphologies is required while working for miniaturization of
electronic and optical devices (Campoy-Quiles et al., 2008; G. Li, Shrotriya, Huang, et
al., 2005; Ma, Yang, Gong, Lee, & Heeger, 2005). Depending on the length,
connectivity, and mutual interactions of the different blocks, the microdomains can form
spherical, lamellar, cylindrical, gyroid, or more complex shapes that exhibit regular
periodic order with typical repeat distances in a range of 10-100 nm. Various factors that
affect the surface morphology of thin films of polymers include molecular weight and
composition of block copolymer, casting solvent, annealing temperature, film thickness,
107
interfacial interactions, solvent evaporation, substrate pattern, and electric fields (Cui,
Ding, Li, Wang, & Han, 2006; Paeng, Richert, & Ediger, 2012; Roy & Sharma, 2015).
The prepared films exhibit a laterally different but highly ordered distribution of different
polymeric components with microdomain sizes and characteristics distances at the
nanoscale. They have been used as self-organized templates for synthesis of various
inorganic materials such as nanoparticles, nano-clusters, nanotubes, nanowires etc. The
surface structure and morphology are important aspects of block copolymers, and they
are determined by a minimization of the surface and interfacial energy. On chemically
homogeneous surfaces, differences in the interfacial energy between the surface and the
blocks of the copolymer generally induce different surface morphologies of the film to
minimize the free energy. In the bulk, the mesoscale structure of BCPs is determined by
molecular parameters, such as chain length, volume fractions of the components, degree
of incompatibility, and temperature. However, some additional driving forces exist for
structure formation in thin films. Typically, polymeric components with the lowest
surface energy will preferentially accumulate at the surface and the component with
lowest interfacial energy will be attracted to the supporting substrate. Furthermore,
confinement of the material to a film thickness that is a non-integer multiple of the
―natural‖ bulk repetition length can cause the thin film structures to deviate from the
corresponding bulk material. As a result, the phase behavior in thin film of block
copolymers is more complex and exhibits a larger variety of structures compared to
found in the bulk. Many approaches are used to alter the self-organization of BCPs in
which thermal annealing is one of the most advanced approaches to modify the polymer
structure at nano-scale. Generally, post deposition of polymer onto the substrate lead
disordered structure. The polymers become mobile and structurally transform above the
glass transition temperature (Tg). Thermally induced molecular motion reorganizes
amorphous portion into more perfect crystalline form, while bulk melting, which destroys
existing crystalline regions. Therefore, maximum crystallinity can only be achieved
below Tm (Jo, Kim, Na, Yu, & Kim, 2009; G. Li, Shrotriya, Yao, & Yang, 2005;
Verploegen et al., 2010; N. Wu, Zheng, Huang, & Liu, 2007).
108
Block copolymers composed of poly(2-vinylpyridine) (P2VP) segment, contain pyridine
moieties as side chains, have been used for many industrial applications. A typical
example is utilization of P2VP block copolymers as templates for metal complexes to
prepare nanoparticles (NPs). The NPs-P2VP based nanocomposite assemblies improve
the functionality of electronic, photonic, and chemical devices due to the presence of
nitrogen atoms of the pyridine ring with an unshared electron pair that induces pH
sensitivity (N. Wu et al., 2007). In addition, magnetic, photonic, chemical, and electrical
properties of nanomaterials are very different from the bulk materials. Consequently,
there have been several studies focused on the incorporation of nanoparticles within the
block copolymer microdomains (Carotenuto et al., 2000; Lekesiz et al., 2015; Nasir,
Kausar, & Younus, 2015; Youk et al., 2002; Yu et al., 2008).
The shape and size of the patterns of thin films obtained by block copolymers are highly
dependent upon the total molar mass, molar mass of individual blocks and chemical
composition of parent materials. In this study, poly(2-vinylpyridine)-block-poly(methyl
methacrylate) [P2VP-b-PMMA, P(2VP-MMA)], an amphiphilic block polymer, is
utilized for preparation of micelles in suitable media. Atomic force microscopy (AFM)
being a non-destructive imaging technique is employed for structural and morphological
analysis of the thin films and gold nanoparticles incorporated into BCPs.
5.1 Experimental
5.1.1 Materials and Instrumentation
Poly(2-vinylpyridine-block-methylmethacrylate) [P(2VP-MMA)] block copolymers were
purchased from polymer standard services (Mianz, Germany). Tetrachloroauric acid
(HAuCl4) (Sigma Aldrich, USA) was the starting material for the synthesis of gold
nanoparticles. NaBH4 (TCI, Tokyo, Japan) was used as reducing agent for HAuCl4.
HPLC grade toluene, chloroform, and ethyl acetate (RCI Labscan limited, Thailand) were
used as solvents. All the reagents were used as received. The molecular weights and their
distributions (PDI) of the block copolymers are summarized in Table 5.1.
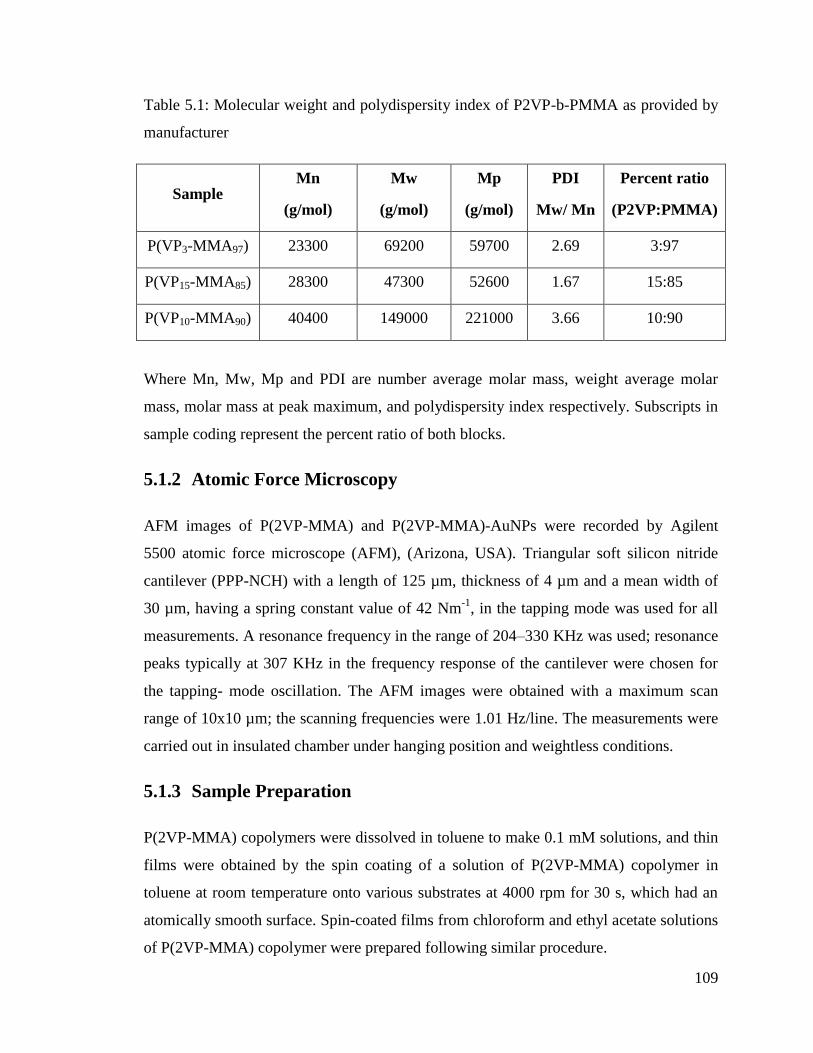
109
Table 5.1: Molecular weight and polydispersity index of P2VP-b-PMMA as provided by
manufacturer
Sample Mn
(g/mol)
Mw
(g/mol)
Mp
(g/mol)
PDI
Mw/ Mn
Percent ratio
(P2VP:PMMA)
P(VP3-MMA97) 23300 69200 59700 2.69 3:97
P(VP15-MMA85) 28300 47300 52600 1.67 15:85
P(VP10-MMA90) 40400 149000 221000 3.66 10:90
Where Mn, Mw, Mp and PDI are number average molar mass, weight average molar
mass, molar mass at peak maximum, and polydispersity index respectively. Subscripts in
sample coding represent the percent ratio of both blocks.
5.1.2 Atomic Force Microscopy
AFM images of P(2VP-MMA) and P(2VP-MMA)-AuNPs were recorded by Agilent
5500 atomic force microscope (AFM), (Arizona, USA). Triangular soft silicon nitride
cantilever (PPP-NCH) with a length of 125 µm, thickness of 4 µm and a mean width of
30 µm, having a spring constant value of 42 Nm-1
, in the tapping mode was used for all
measurements. A resonance frequency in the range of 204–330 KHz was used; resonance
peaks typically at 307 KHz in the frequency response of the cantilever were chosen for
the tapping- mode oscillation. The AFM images were obtained with a maximum scan
range of 10x10 µm; the scanning frequencies were 1.01 Hz/line. The measurements were
carried out in insulated chamber under hanging position and weightless conditions.
5.1.3 Sample Preparation
P(2VP-MMA) copolymers were dissolved in toluene to make 0.1 mM solutions, and thin
films were obtained by the spin coating of a solution of P(2VP-MMA) copolymer in
toluene at room temperature onto various substrates at 4000 rpm for 30 s, which had an
atomically smooth surface. Spin-coated films from chloroform and ethyl acetate solutions
of P(2VP-MMA) copolymer were prepared following similar procedure.
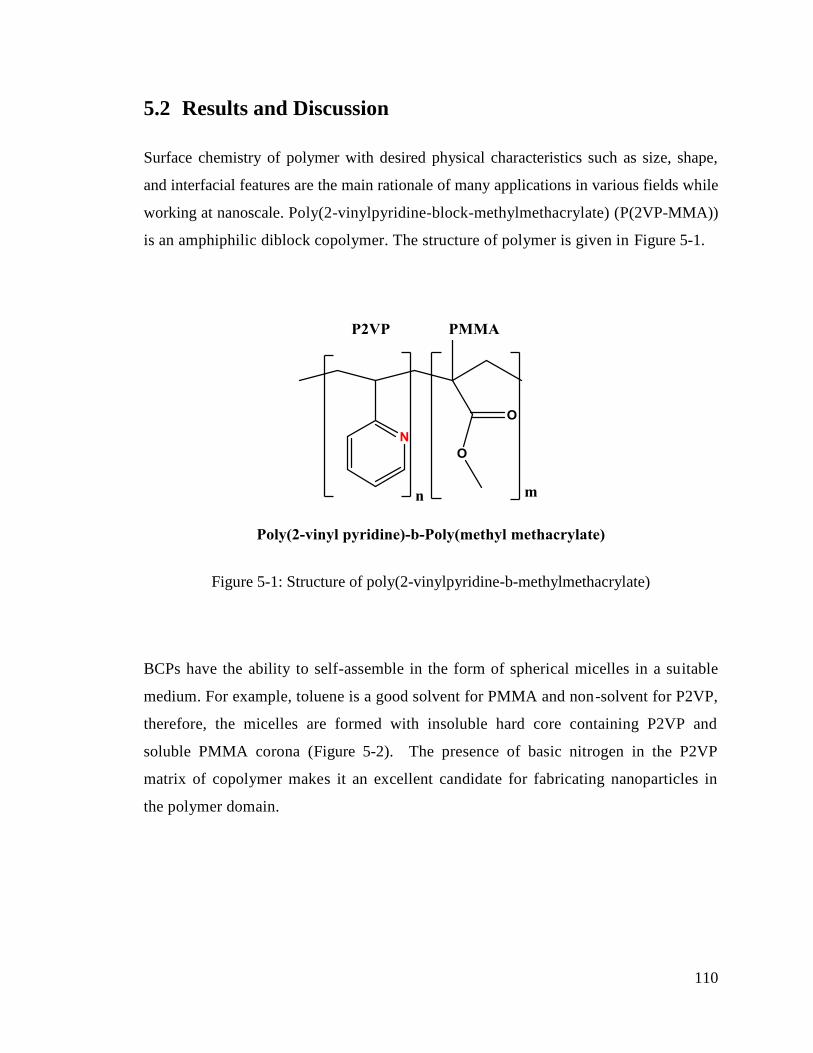
110
5.2 Results and Discussion
Surface chemistry of polymer with desired physical characteristics such as size, shape,
and interfacial features are the main rationale of many applications in various fields while
working at nanoscale. Poly(2-vinylpyridine-block-methylmethacrylate) (P(2VP-MMA))
is an amphiphilic diblock copolymer. The structure of polymer is given in Figure 5-1.
Figure 5-1: Structure of poly(2-vinylpyridine-b-methylmethacrylate)
BCPs have the ability to self-assemble in the form of spherical micelles in a suitable
medium. For example, toluene is a good solvent for PMMA and non-solvent for P2VP,
therefore, the micelles are formed with insoluble hard core containing P2VP and
soluble PMMA corona (Figure 5-2). The presence of basic nitrogen in the P2VP
matrix of copolymer makes it an excellent candidate for fabricating nanoparticles in
the polymer domain.
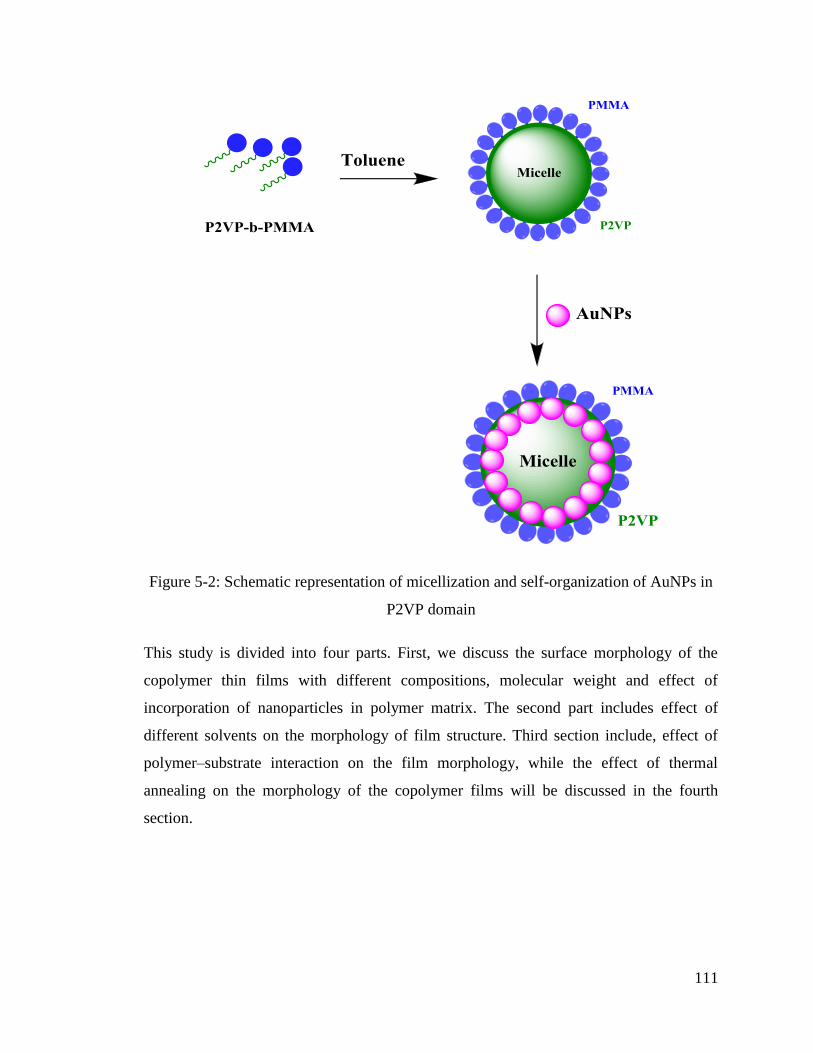
111
Figure 5-2: Schematic representation of micellization and self-organization of AuNPs in
P2VP domain
This study is divided into four parts. First, we discuss the surface morphology of the
copolymer thin films with different compositions, molecular weight and effect of
incorporation of nanoparticles in polymer matrix. The second part includes effect of
different solvents on the morphology of film structure. Third section include, effect of
polymer–substrate interaction on the film morphology, while the effect of thermal
annealing on the morphology of the copolymer films will be discussed in the fourth
section.
112
5.2.1 Characterization of Surface Morphology
Polymer and polymer coated AuNPs solutions of 0.1 mM in toluene were casted onto Si
wafer. Surfaces were placed for 48 hrs in order to evaporate the solvent. Figure 5-3A-B
illustrate, surface morphology of thin films obtained on Si wafer by casting P(2VP-
MMA) varying in molar mass and compositions of individual blocks. As can be noticed,
different surface topographies were obtained that require quantitative assessment for
development of any relation with the composition of polymers. Three factors are
involved in controlling the phase separation of copolymer in formation of thin films by
evaporation of the solution: (1) different surface free energies of polymer, (2) solubility
factor in common solvent and (3) polymer–air and polymer–substrate interactions. All
three factors collectively dictate the final morphology of copolymer films. Importantly,
incorporating gold nanoparticles affected the topography of the polymer by enlarging
phase domain, Figure 5-2.
BCPs can be compared by varying two parameters. Firstly, BCP having similar molar
mass but varying composition of both blocks is compared. In this context, P(VP3-
MMA97) and P(VP15-MMA85) have similar total molar mass, nonetheless, the mole
fraction of both blocks vary significantly. Flatter surfaces with lamellar structure having
undefined grooves between lamellea was obtained by P(VP3-MMA97) because the block
length of P2VP is smaller compared to PMMA, therefore, they arrange like threads
instead of spherical micelles. While, continuous hexagonal structures having a pore
size 28 nm were obtained with P(VP15-MMA85), Figure 5-3 A. Furthermore, P(VP15-
MMA85) has similar block length of P2VP compared to P(VP10-MMA90) while total
molar mass of later is higher. Thin film obtained by P(VP10-MMA90) is similar in basic
morphology with the P(VP15-MMA85), however, smaller cylindrical nanogrooves with
the average pore size of 10 nm are obtained, Figure 5-3 B.
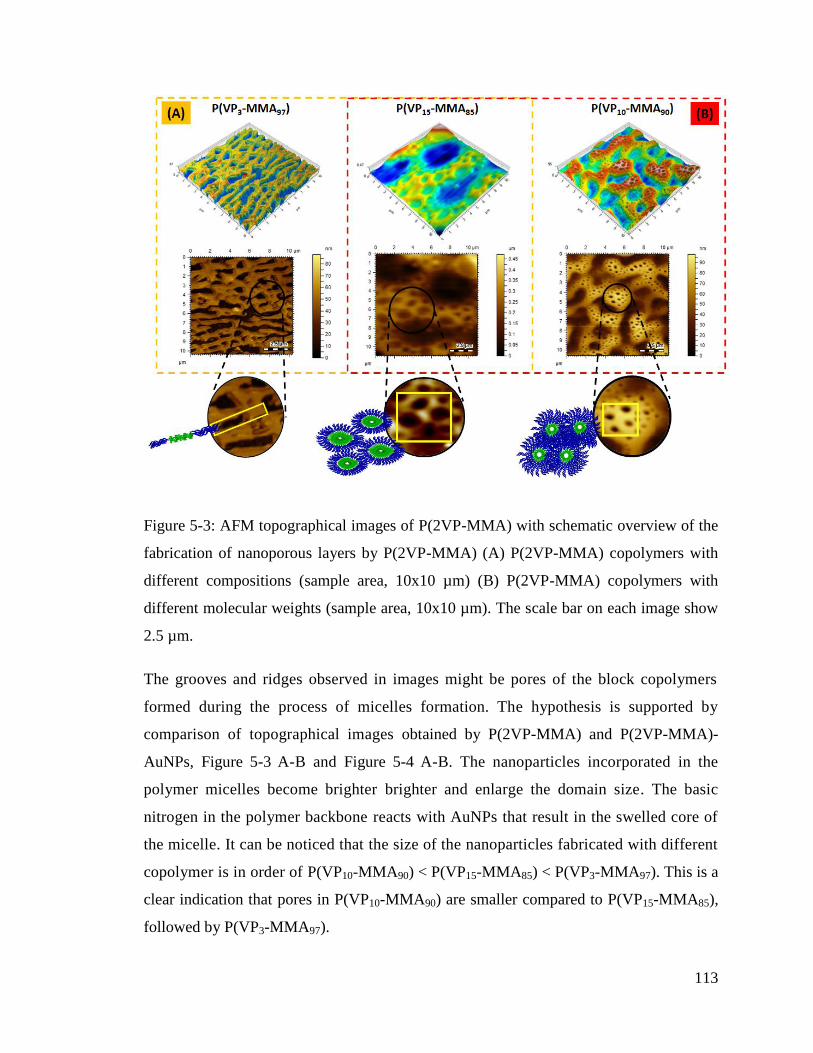
113
Figure 5-3: AFM topographical images of P(2VP-MMA) with schematic overview of the
fabrication of nanoporous layers by P(2VP-MMA) (A) P(2VP-MMA) copolymers with
different compositions (sample area, 10x10 µm) (B) P(2VP-MMA) copolymers with
different molecular weights (sample area, 10x10 µm). The scale bar on each image show
2.5 µm.
The grooves and ridges observed in images might be pores of the block copolymers
formed during the process of micelles formation. The hypothesis is supported by
comparison of topographical images obtained by P(2VP-MMA) and P(2VP-MMA)-
AuNPs, Figure 5-3 A-B and Figure 5-4 A-B. The nanoparticles incorporated in the
polymer micelles become brighter brighter and enlarge the domain size. The basic
nitrogen in the polymer backbone reacts with AuNPs that result in the swelled core of
the micelle. It can be noticed that the size of the nanoparticles fabricated with different
copolymer is in order of P(VP10-MMA90) < P(VP15-MMA85) < P(VP3-MMA97). This is a
clear indication that pores in P(VP10-MMA90) are smaller compared to P(VP15-MMA85),
followed by P(VP3-MMA97).
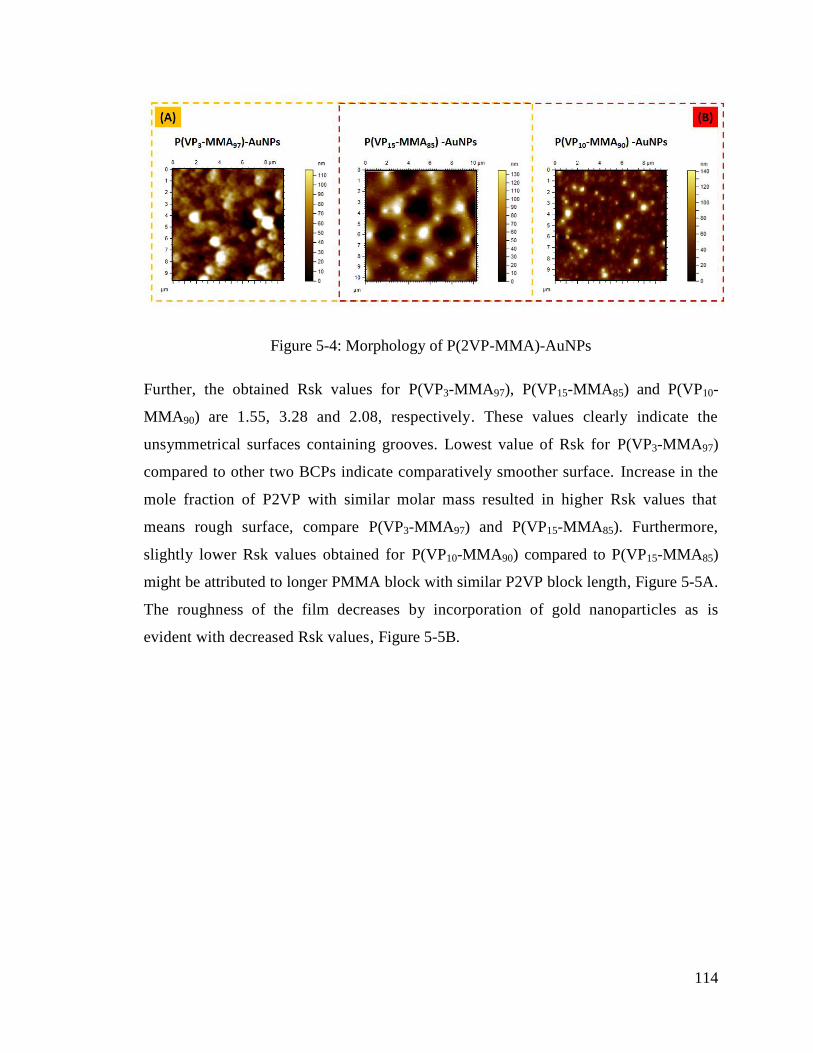
114
Figure 5-4: Morphology of P(2VP-MMA)-AuNPs
Further, the obtained Rsk values for P(VP3-MMA97), P(VP15-MMA85) and P(VP10-
MMA90) are 1.55, 3.28 and 2.08, respectively. These values clearly indicate the
unsymmetrical surfaces containing grooves. Lowest value of Rsk for P(VP3-MMA97)
compared to other two BCPs indicate comparatively smoother surface. Increase in the
mole fraction of P2VP with similar molar mass resulted in higher Rsk values that
means rough surface, compare P(VP3-MMA97) and P(VP15-MMA85). Furthermore,
slightly lower Rsk values obtained for P(VP10-MMA90) compared to P(VP15-MMA85)
might be attributed to longer PMMA block with similar P2VP block length, Figure 5-5A.
The roughness of the film decreases by incorporation of gold nanoparticles as is
evident with decreased Rsk values, Figure 5-5B.
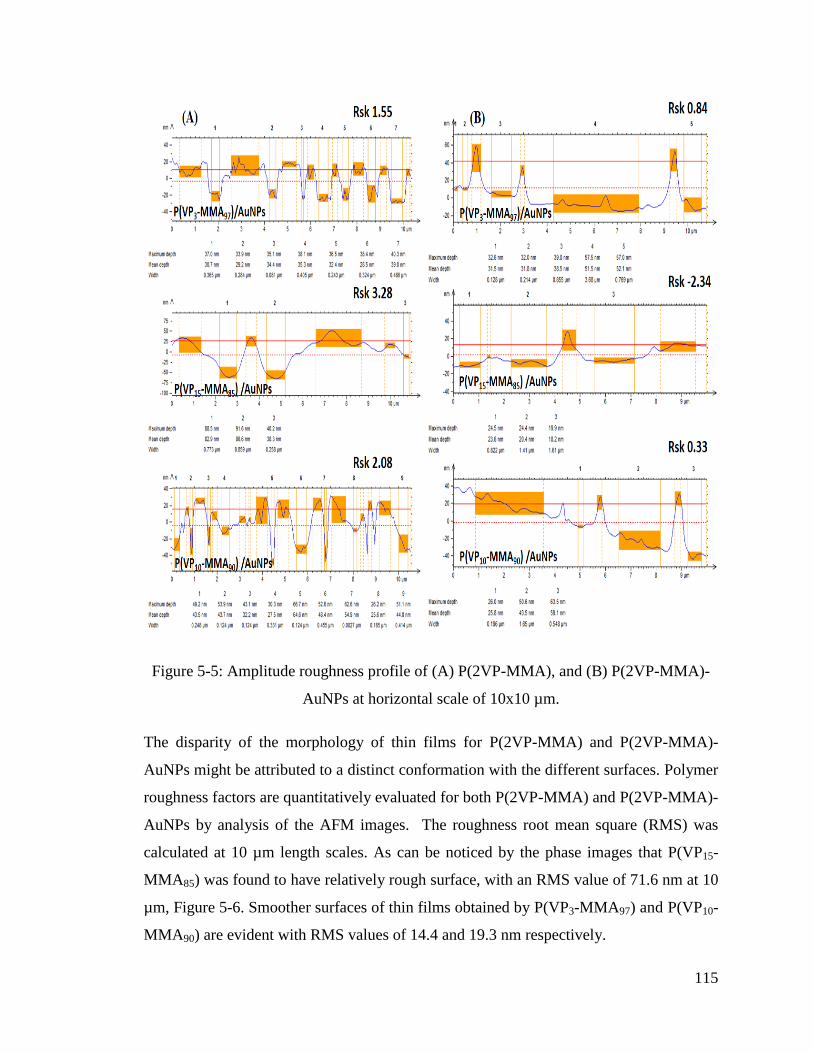
115
Figure 5-5: Amplitude roughness profile of (A) P(2VP-MMA), and (B) P(2VP-MMA)-
AuNPs at horizontal scale of 10x10 µm.
The disparity of the morphology of thin films for P(2VP-MMA) and P(2VP-MMA)-
AuNPs might be attributed to a distinct conformation with the different surfaces. Polymer
roughness factors are quantitatively evaluated for both P(2VP-MMA) and P(2VP-MMA)-
AuNPs by analysis of the AFM images. The roughness root mean square (RMS) was
calculated at 10 µm length scales. As can be noticed by the phase images that P(VP15-
MMA85) was found to have relatively rough surface, with an RMS value of 71.6 nm at 10
µm, Figure 5-6. Smoother surfaces of thin films obtained by P(VP3-MMA97) and P(VP10-
MMA90) are evident with RMS values of 14.4 and 19.3 nm respectively.
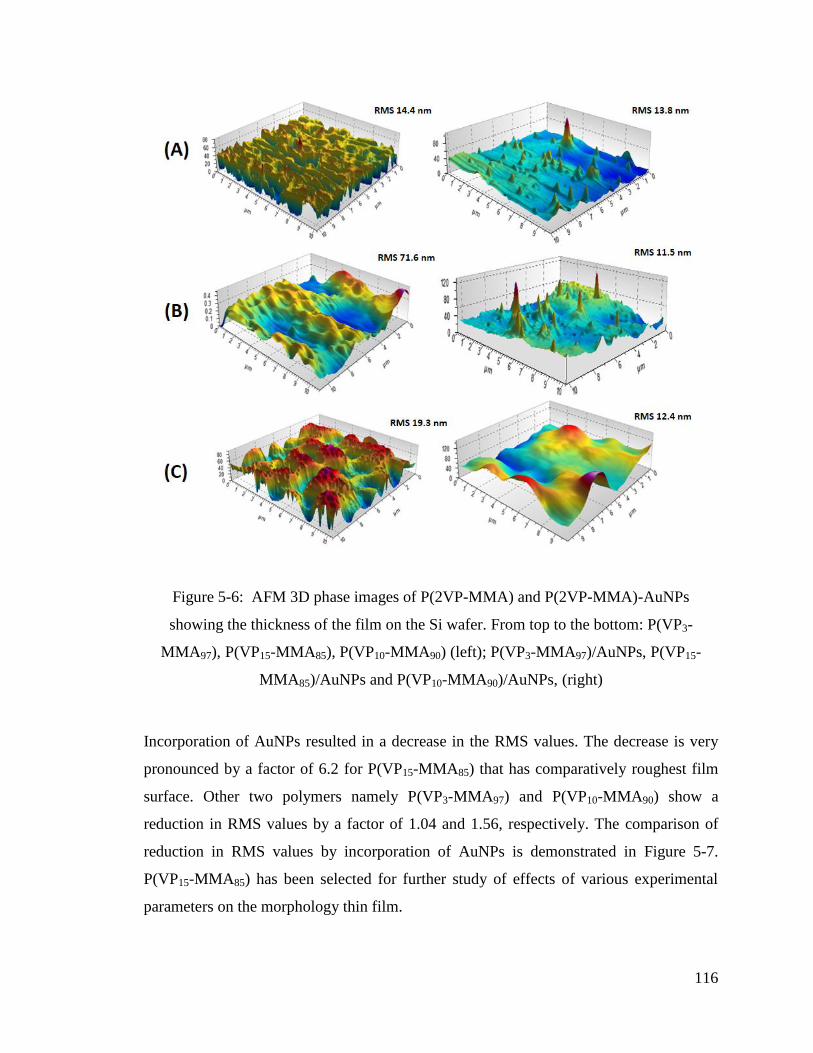
116
Figure 5-6: AFM 3D phase images of P(2VP-MMA) and P(2VP-MMA)-AuNPs
showing the thickness of the film on the Si wafer. From top to the bottom: P(VP3-
MMA97), P(VP15-MMA85), P(VP10-MMA90) (left); P(VP3-MMA97)/AuNPs, P(VP15-
MMA85)/AuNPs and P(VP10-MMA90)/AuNPs, (right)
Incorporation of AuNPs resulted in a decrease in the RMS values. The decrease is very
pronounced by a factor of 6.2 for P(VP15-MMA85) that has comparatively roughest film
surface. Other two polymers namely P(VP3-MMA97) and P(VP10-MMA90) show a
reduction in RMS values by a factor of 1.04 and 1.56, respectively. The comparison of
reduction in RMS values by incorporation of AuNPs is demonstrated in Figure 5-7.
P(VP15-MMA85) has been selected for further study of effects of various experimental
parameters on the morphology thin film.
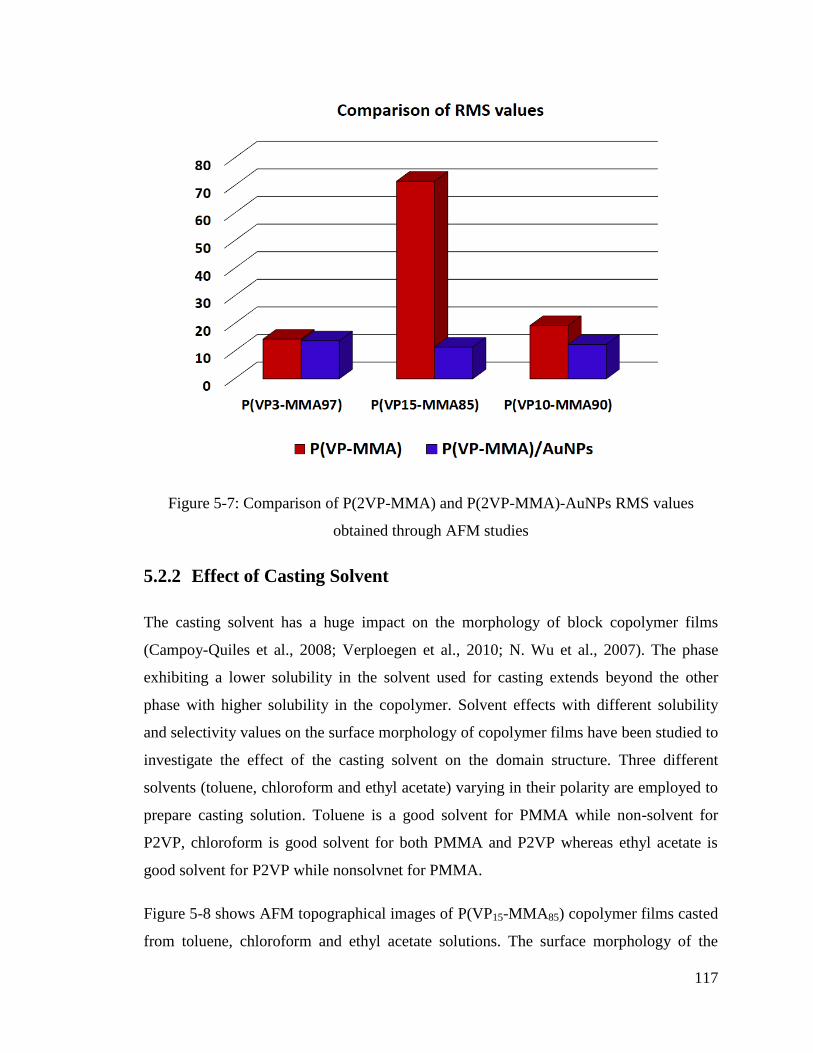
117
Figure 5-7: Comparison of P(2VP-MMA) and P(2VP-MMA)-AuNPs RMS values
obtained through AFM studies
5.2.2 Effect of Casting Solvent
The casting solvent has a huge impact on the morphology of block copolymer films
(Campoy-Quiles et al., 2008; Verploegen et al., 2010; N. Wu et al., 2007). The phase
exhibiting a lower solubility in the solvent used for casting extends beyond the other
phase with higher solubility in the copolymer. Solvent effects with different solubility
and selectivity values on the surface morphology of copolymer films have been studied to
investigate the effect of the casting solvent on the domain structure. Three different
solvents (toluene, chloroform and ethyl acetate) varying in their polarity are employed to
prepare casting solution. Toluene is a good solvent for PMMA while non-solvent for
P2VP, chloroform is good solvent for both PMMA and P2VP whereas ethyl acetate is
good solvent for P2VP while nonsolvnet for PMMA.
Figure 5-8 shows AFM topographical images of P(VP15-MMA85) copolymer films casted
from toluene, chloroform and ethyl acetate solutions. The surface morphology of the
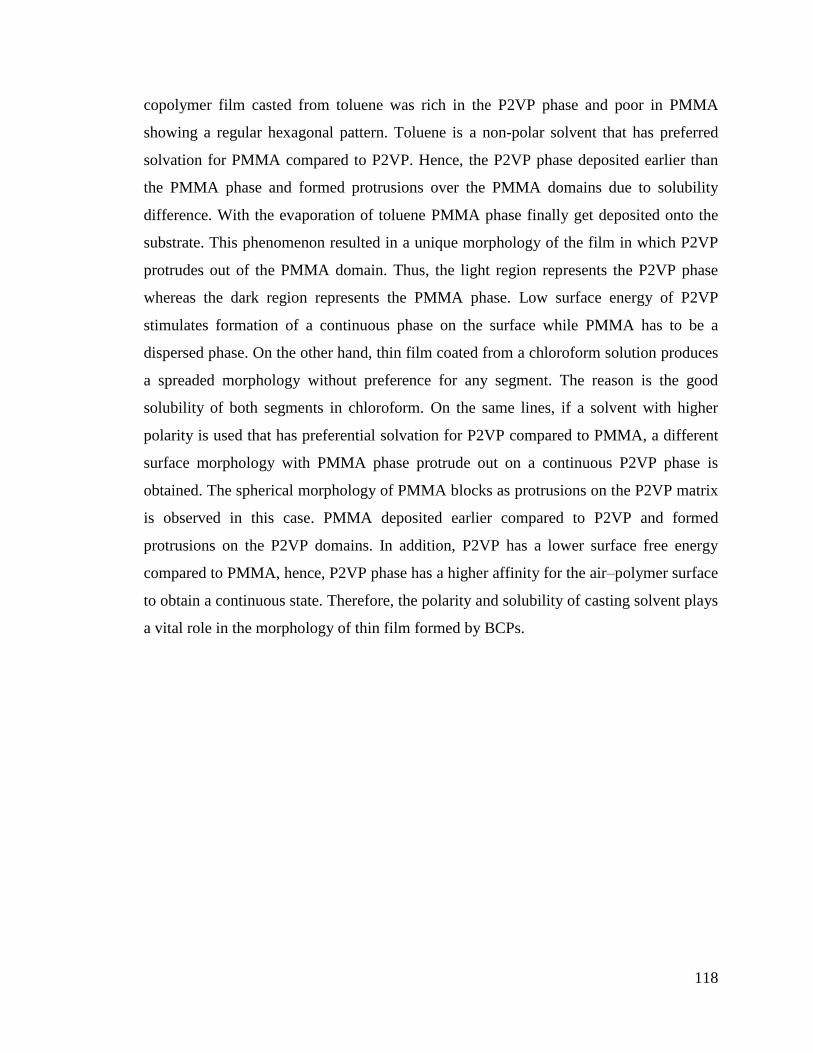
118
copolymer film casted from toluene was rich in the P2VP phase and poor in PMMA
showing a regular hexagonal pattern. Toluene is a non-polar solvent that has preferred
solvation for PMMA compared to P2VP. Hence, the P2VP phase deposited earlier than
the PMMA phase and formed protrusions over the PMMA domains due to solubility
difference. With the evaporation of toluene PMMA phase finally get deposited onto the
substrate. This phenomenon resulted in a unique morphology of the film in which P2VP
protrudes out of the PMMA domain. Thus, the light region represents the P2VP phase
whereas the dark region represents the PMMA phase. Low surface energy of P2VP
stimulates formation of a continuous phase on the surface while PMMA has to be a
dispersed phase. On the other hand, thin film coated from a chloroform solution produces
a spreaded morphology without preference for any segment. The reason is the good
solubility of both segments in chloroform. On the same lines, if a solvent with higher
polarity is used that has preferential solvation for P2VP compared to PMMA, a different
surface morphology with PMMA phase protrude out on a continuous P2VP phase is
obtained. The spherical morphology of PMMA blocks as protrusions on the P2VP matrix
is observed in this case. PMMA deposited earlier compared to P2VP and formed
protrusions on the P2VP domains. In addition, P2VP has a lower surface free energy
compared to PMMA, hence, P2VP phase has a higher affinity for the air–polymer surface
to obtain a continuous state. Therefore, the polarity and solubility of casting solvent plays
a vital role in the morphology of thin film formed by BCPs.
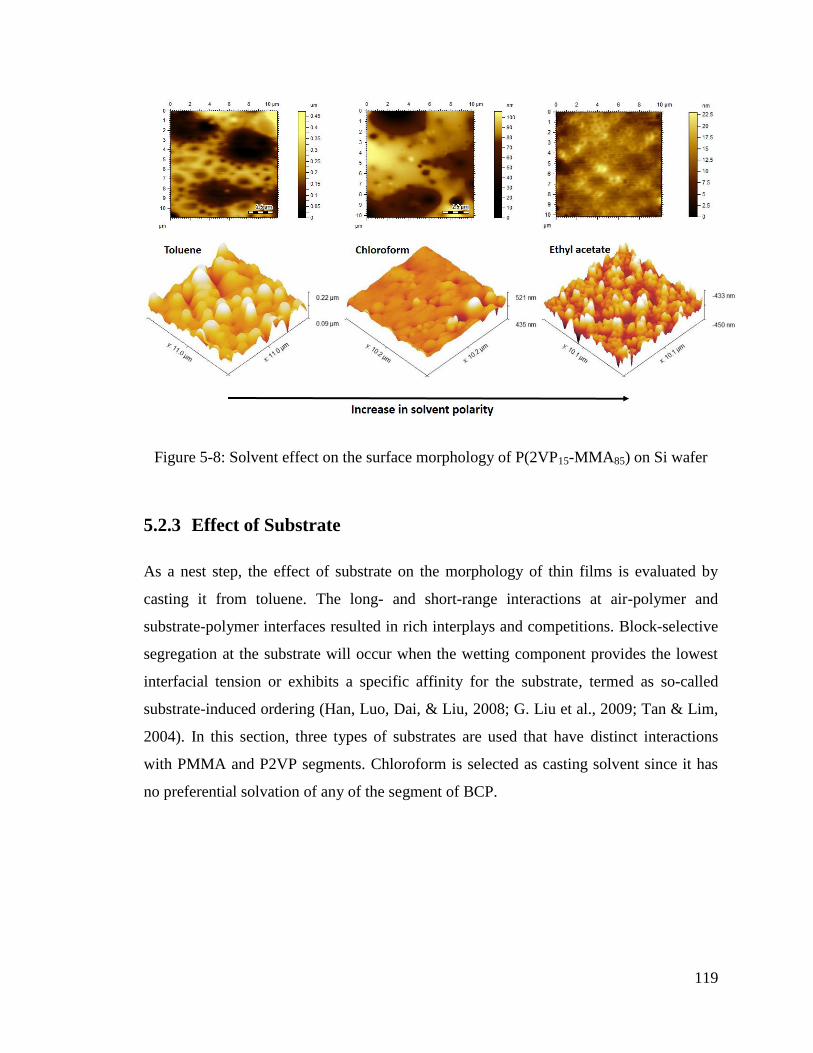
119
Figure 5-8: Solvent effect on the surface morphology of P(2VP15-MMA85) on Si wafer
5.2.3 Effect of Substrate
As a nest step, the effect of substrate on the morphology of thin films is evaluated by
casting it from toluene. The long- and short-range interactions at air-polymer and
substrate-polymer interfaces resulted in rich interplays and competitions. Block-selective
segregation at the substrate will occur when the wetting component provides the lowest
interfacial tension or exhibits a specific affinity for the substrate, termed as so-called
substrate-induced ordering (Han, Luo, Dai, & Liu, 2008; G. Liu et al., 2009; Tan & Lim,
2004). In this section, three types of substrates are used that have distinct interactions
with PMMA and P2VP segments. Chloroform is selected as casting solvent since it has
no preferential solvation of any of the segment of BCP.
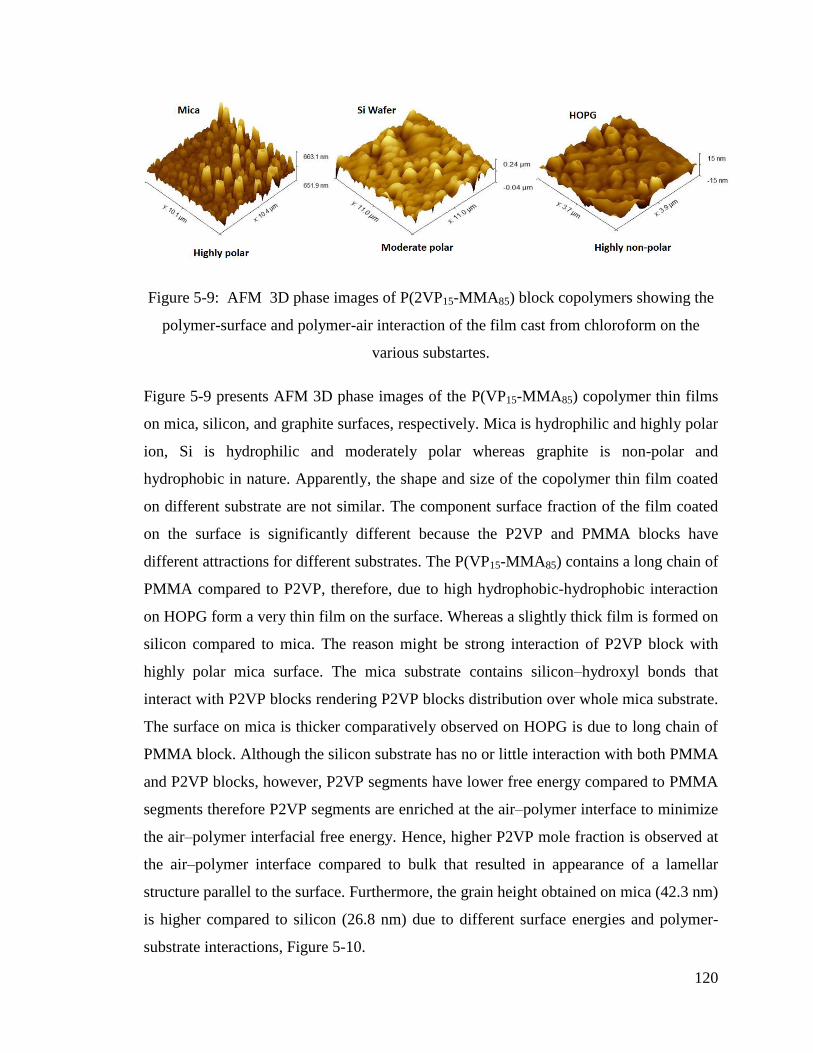
120
Figure 5-9: AFM 3D phase images of P(2VP15-MMA85) block copolymers showing the
polymer-surface and polymer-air interaction of the film cast from chloroform on the
various substartes.
Figure 5-9 presents AFM 3D phase images of the P(VP15-MMA85) copolymer thin films
on mica, silicon, and graphite surfaces, respectively. Mica is hydrophilic and highly polar
ion, Si is hydrophilic and moderately polar whereas graphite is non-polar and
hydrophobic in nature. Apparently, the shape and size of the copolymer thin film coated
on different substrate are not similar. The component surface fraction of the film coated
on the surface is significantly different because the P2VP and PMMA blocks have
different attractions for different substrates. The P(VP15-MMA85) contains a long chain of
PMMA compared to P2VP, therefore, due to high hydrophobic-hydrophobic interaction
on HOPG form a very thin film on the surface. Whereas a slightly thick film is formed on
silicon compared to mica. The reason might be strong interaction of P2VP block with
highly polar mica surface. The mica substrate contains silicon–hydroxyl bonds that
interact with P2VP blocks rendering P2VP blocks distribution over whole mica substrate.
The surface on mica is thicker comparatively observed on HOPG is due to long chain of
PMMA block. Although the silicon substrate has no or little interaction with both PMMA
and P2VP blocks, however, P2VP segments have lower free energy compared to PMMA
segments therefore P2VP segments are enriched at the air–polymer interface to minimize
the air–polymer interfacial free energy. Hence, higher P2VP mole fraction is observed at
the air–polymer interface compared to bulk that resulted in appearance of a lamellar
structure parallel to the surface. Furthermore, the grain height obtained on mica (42.3 nm)
is higher compared to silicon (26.8 nm) due to different surface energies and polymer-
substrate interactions, Figure 5-10.
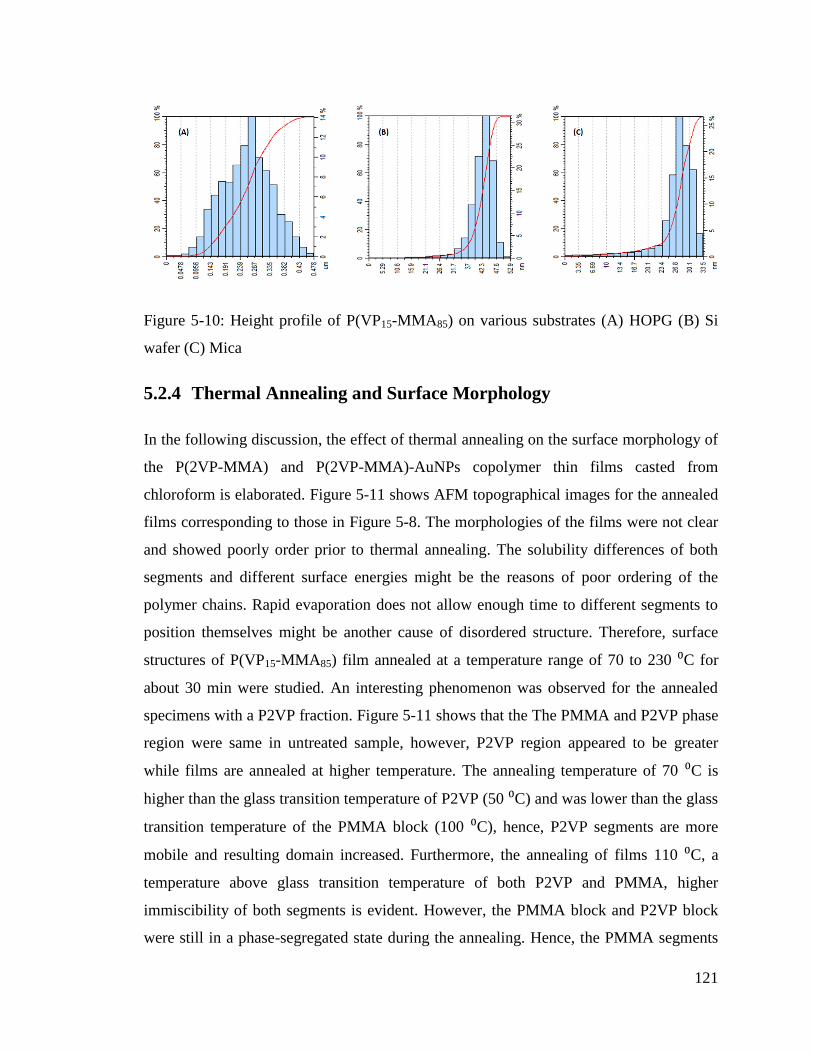
121
Figure 5-10: Height profile of P(VP15-MMA85) on various substrates (A) HOPG (B) Si
wafer (C) Mica
5.2.4 Thermal Annealing and Surface Morphology
In the following discussion, the effect of thermal annealing on the surface morphology of
the P(2VP-MMA) and P(2VP-MMA)-AuNPs copolymer thin films casted from
chloroform is elaborated. Figure 5-11 shows AFM topographical images for the annealed
films corresponding to those in Figure 5-8. The morphologies of the films were not clear
and showed poorly order prior to thermal annealing. The solubility differences of both
segments and different surface energies might be the reasons of poor ordering of the
polymer chains. Rapid evaporation does not allow enough time to different segments to
position themselves might be another cause of disordered structure. Therefore, surface
structures of P(VP15-MMA85) film annealed at a temperature range of 70 to 230 ⁰C for
about 30 min were studied. An interesting phenomenon was observed for the annealed
specimens with a P2VP fraction. Figure 5-11 shows that the The PMMA and P2VP phase
region were same in untreated sample, however, P2VP region appeared to be greater
while films are annealed at higher temperature. The annealing temperature of 70 ⁰C is
higher than the glass transition temperature of P2VP (50 ⁰C) and was lower than the glass
transition temperature of the PMMA block (100 ⁰C), hence, P2VP segments are more
mobile and resulting domain increased. Furthermore, the annealing of films 110 ⁰C, a
temperature above glass transition temperature of both P2VP and PMMA, higher
immiscibility of both segments is evident. However, the PMMA block and P2VP block
were still in a phase-segregated state during the annealing. Hence, the PMMA segments
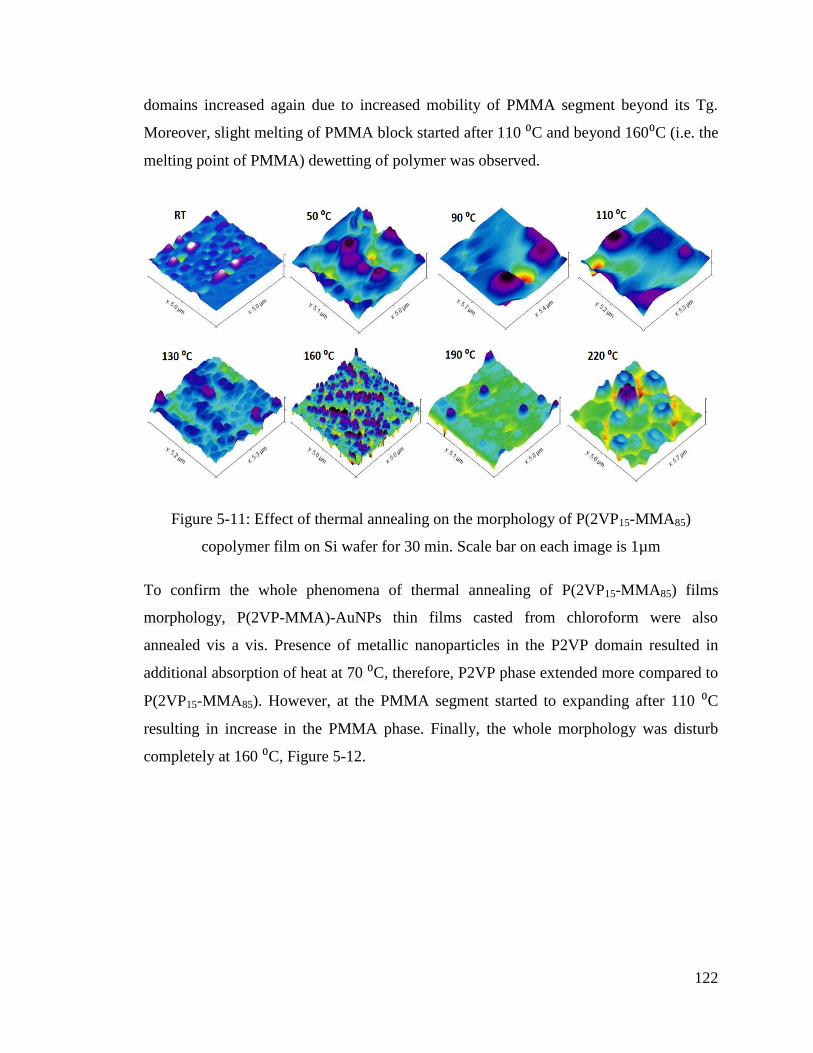
122
domains increased again due to increased mobility of PMMA segment beyond its Tg.
Moreover, slight melting of PMMA block started after 110 ⁰C and beyond 160⁰C (i.e. the
melting point of PMMA) dewetting of polymer was observed.
Figure 5-11: Effect of thermal annealing on the morphology of P(2VP15-MMA85)
copolymer film on Si wafer for 30 min. Scale bar on each image is 1µm
To confirm the whole phenomena of thermal annealing of P(2VP15-MMA85) films
morphology, P(2VP-MMA)-AuNPs thin films casted from chloroform were also
annealed vis a vis. Presence of metallic nanoparticles in the P2VP domain resulted in
additional absorption of heat at 70 ⁰C, therefore, P2VP phase extended more compared to
P(2VP15-MMA85). However, at the PMMA segment started to expanding after 110 ⁰C
resulting in increase in the PMMA phase. Finally, the whole morphology was disturb
completely at 160 ⁰C, Figure 5-12.
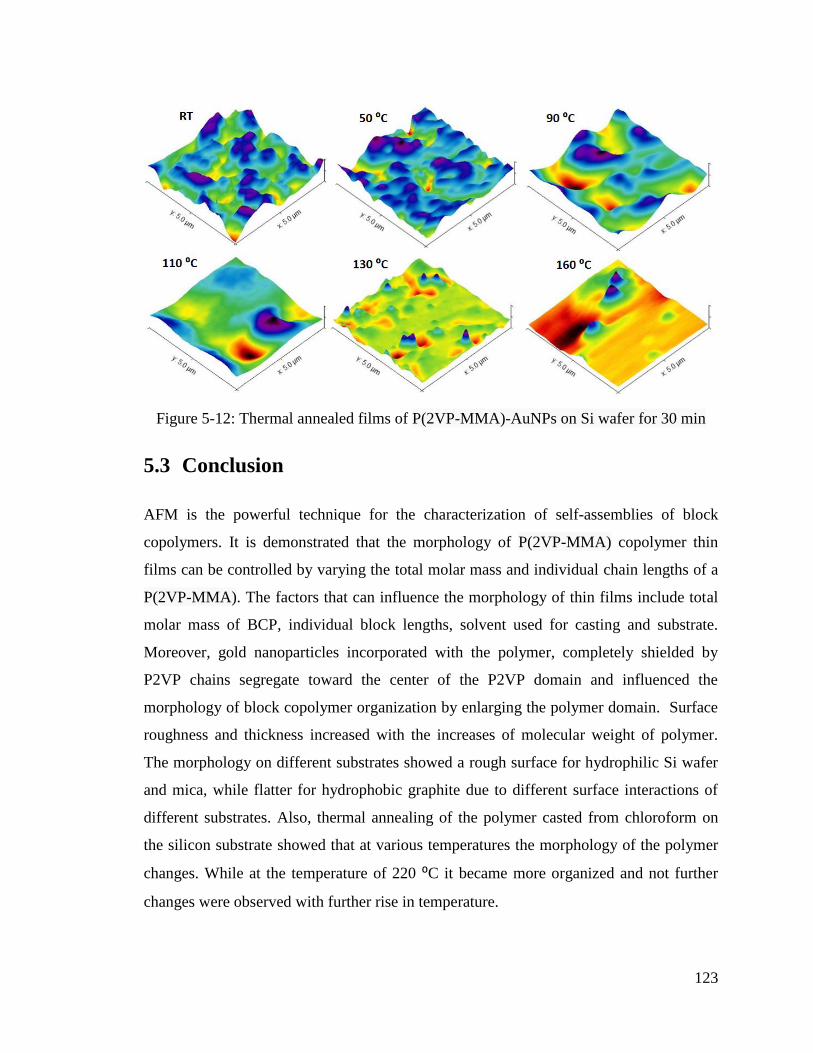
123
Figure 5-12: Thermal annealed films of P(2VP-MMA)-AuNPs on Si wafer for 30 min
5.3 Conclusion
AFM is the powerful technique for the characterization of self-assemblies of block
copolymers. It is demonstrated that the morphology of P(2VP-MMA) copolymer thin
films can be controlled by varying the total molar mass and individual chain lengths of a
P(2VP-MMA). The factors that can influence the morphology of thin films include total
molar mass of BCP, individual block lengths, solvent used for casting and substrate.
Moreover, gold nanoparticles incorporated with the polymer, completely shielded by
P2VP chains segregate toward the center of the P2VP domain and influenced the
morphology of block copolymer organization by enlarging the polymer domain. Surface
roughness and thickness increased with the increases of molecular weight of polymer.
The morphology on different substrates showed a rough surface for hydrophilic Si wafer
and mica, while flatter for hydrophobic graphite due to different surface interactions of
different substrates. Also, thermal annealing of the polymer casted from chloroform on
the silicon substrate showed that at various temperatures the morphology of the polymer
changes. While at the temperature of 220 ⁰C it became more organized and not further
changes were observed with further rise in temperature.
124
Chapter 6
CONCLUSION
Polymers are large molecules, termed as macromolecules, consisted of small repeated
subunits called monomers. Functionality of the monomer, their arrangement in the
polymer and degree of polymerization define the chemical and physical properties of
polymers as well as the broad range of applications of these polymers in various fields
such as electronics, catalysis, chemical and biochemical sensors, optical devices,
nanosciences and nanotechnology etc.
Nanotechnology deals the matter at the scale of 1-100 nm. At this scale the properties of
matter show different behavior than its bulk material. The optical response of NPs depends
upon size, shape and interparticle distances. For example, gold is an inert metal in normal
condition while at nanoscale it is highly reactive, having good optical response, conduct
electricity and provide a large surface to volume ratio. Among all these advantages the
drawback of these nanoparticles is its stability at ambient conditions, they aggregate and
agglomerate rapidly after formation. Therefore, various stabilizing agents such as various
natural macromolecules such as proteins, flavonoids, liposomes and polysaccharides as
well as synthetic macromolecules such as polymers have been employed for stabilization
of NPs. In this context, we are concerned about synthetic polymers. In literature many
research group used many polymers containing pyrrole, pyridine, thiol or oxygen moiety
are used to stabilize the metallic nanoparticles. Among these homopolymers and block
copolymers of poly(2-vinylpyridine) are widely used because the presence of nitrogen
atoms along with their lone pair of electrons make it suitable for chelating the metallic
nanoparticles and also prevent the nanoparticles from aggregation. Moreover, the
polymer sterically stabilized the nanoparticles so the maximum surface of nanoparticles
are available for further applications. It is seen that the molar mass of P2VP affect the
tendency of P2VP to protect the NPs from aggregation and flocculation. On the other
hand in block copolymers of P2VP, the other block enhanced the properties of P2VP in
reduction of the size of NPs and their protection against aggregation.
125
In this study, we synthesized the gold and silver nanoparticles using P2VP
homopolymers and block copolymers containing P2VP including polystyrene-block-
poly(2-vinylpyridine) and poly(2-vinylpyridine)-block-poly(methyl methacrylate).
Synthesized nanoparticles were characterized by UV-visible spectroscopy, FTIR,
zetasizer, DLS and AFM.
In our first study, we used different molar mass P2VP homopolymers ranging from 1000-
20,000 g/mol to stabilize the AuNPs in one-pot two phase system containing methanol
and water (10:90). It was observed that the small amount of P2VP stabilized the AuNPs
very efficiently as well as the size and stability of AuNPs were greatly controlled at
atomic level through control over the molar mass of P2VP. As the molar mass of P2VP
increases the reducing activity of P2VP increased due to availability of more nitrogen
atoms results in smaller sized AuNPs. It was also observed that P2VP stabilized AuNPs
were stable up to 6 months at ambient temperature and move towards higher stability as
the temperature rises. AuNPs are stable at higher pH values and low electrolyte
concentrations. Moreover, the amount of P2VP also effect on the size and stability of
AuNPs. Drug loading efficiency of these AuNPs stabilized by various molar masses of
P2VP were also established and it was seen that as the size of NPs decreases the drug
encapsulation efficiency of AuNPs increases or in other words, drug encapsulation
efficiency depend upon the molar mass of P2VP.
We were also synthesized the P(S-VP) stabilized AgNPs based nanosensor via two phase
one pot protocol and used these AgNPs for the rapid quantitative determination of one of
the thiocarbamate pesticides. Basically, the NPs have greatly respond towards their
surrounding environment. The presence of any specie that have any kind of secondary
interactions such as hydrogen bonding, van der waals forces, π-π stacking, host-guest
interaction, charge transfer, electrostatic attraction, and antigen-antibody interactions etc.
towards NPs play a vital role in chemosensing. Here, we were screened various kind of
pesticides belongs to different class of pesticides and observed that P(S-VP) stabilized
AgNPs very effectively recognize a thiocarbamate pesticide, named cartap, in real
samples such as tap water, surface runoff water and human blood plasma, also in the
presence of other interfering pesticides and ions at ambient conditions. We characterized
126
and studied the P(S-VP) stabilized AgNPs and its interaction with cartap using UV-
visible spectroscopy, FTIR, zetasizer and AFM. It follows linear correlation with cartap
down to a concentration of 0.06 μgL−1
. We supposed that the optimized P(S-VP)-AgNPs
based quantitative assay would potentially lead to more practical applications because of
its low cost, simple preparation, excellent selectivity, and low detection limit.
Furthermore, we developed a P(2VP3-MMA97)-AuNPs-GCE based electrochemical
sensor for rapid quantitative assay of nicotine. In starting we selected the three different
polymers having different individual blocks and molar masses such as P(2VP3-MMA97)
(23300 g/mol), P(2VP18-MMA85) (28300 g/mol) and P(2VP10-MMA90) (40400 g/mol)
and synthesized the AuNPs. But it was observed that AuNPs synthesized with P(2VP3-
MMA97) gives far better performance as electrochemical sensor for nicotine when coated
on GCE electrode than P(2VP18-MMA85) and P(2VP10-MMA90) in organic media.
Therefore, for further studies we used the P(2VP3-MMA97)-AuNPs for nicotine detection.
A well-developed voltammetric peak appeared at +0.66 V (versus Ag/Ag+), in
acetonitrile for determination of nicotine in the concentration range of 0.1 – 0.4 mM with
a detection limit of 0.16 mM. The P(2VP3-MMA97)-AuNPs-GCE is more sensitive
towards nicotine, the electrochemical response obtained by P(2VP3-MMA97)-AuNPs-
GCE is enhanced by an enhancement factor of ~2 compared to bare GCE. Moreover, the
P(2VP3-MMA97)-AuNPs were smaller in size and the stability of P(2VP3-MMA97)-
AuNPs against electrolyte, pH and temperature are higher than P(2VP18-MMA85) and
P(2VP10-MMA90). Stability and homogeneous nature of P(2VP3-MMA97)-AuNPs was
confirmed by UV-Vis, FTIR, AFM, and zetasizer.
We studied the morphology of P(2VP-MMA) using AFM which is the powerful
technique for the surface characterization of thin films of self-assembled block
copolymers. These block copolymer (BCP) films offer imaginable self-organized
patterned morphologies of molecular dimensions in a highly ordered way that is desirable
when working towards miniaturization of electronic and optical devices. Depending on
the length, connectivity, and mutual interactions of the different blocks, the
microdomains can form spherical, lamellar, cylindrical, gyroid, or more complex shapes,
which exhibit regular periodic order with typical repeat distances in the range between
127
10-100 nm. Various factors affecting the surface morphology of thin films of polymers,
such as the molecular weight and composition of block copolymer, casting solvent,
annealing temperature, film thickness, interfacial interactions, solvent evaporation,
substrate pattern, and electric fields. By various experimentations, we have demonstrated
that the morphology of P(2VP-MMA) copolymer thin films can be controlled simply by
varying the chain length of a P(2VP-MMA) chain. It was observed that both P2VP and
PMMA individual block, total molecular weight of block, solvent used for casting and
substrate play a vital role to decide the final morphology of block copolymer thin film.
Moreover, gold nanoparticles incorporated with the polymer, completely shielded by
P2VP chains segregate toward the center of the P2VP domain and influenced the
morphology of block copolymer organization by enlarging the polymer domain. Surface
roughness and thickness are increased with the increase of molecular weight of polymer.
The morphology on different substrates showed a rough surface for hydrophilic Si wafer
and mica, while flatter for hydrophobic graphite due to different surface interactions of
different substrates.
128
References
Abraham, S., Kim, I., & Batt, C. A. (2007). A Facile Preparative Method for
Aggregation-Free Gold Nanoparticles Using Poly(styrene-block-cysteine).
Angew. Chem. Int. Ed., 46(30), 5720-5723. doi: 10.1002/anie.200701060
Ackerson, C. J., Jadzinsky, P. D., & Kornberg, R. D. (2005). Thiolate ligands for
synthesis of water-soluble gold clusters. JACS, 127(18), 6550-6551.
Aharonov, Y., & Bohm, D. (1959). Significance of electromagnetic potentials in the
quantum theory. Phys. Rev., 115(3), 485.
Ahmed, F., Khalid, S., Shah, K., & Shah, M. R. (2016). A Highly Sensitive and Selective
Supramolecular Fluorescent Chemosensor for Dichromate Ion Detection and
Application to Real Samples. J. Chem. Soc. Pak., 38(1), 171-176.
Alberg, A. J. (2008). Cigarette smoking: health effects and control strategies. Drugs
today, 44(12), 895-904.
Alexandridis, P. (1996). Amphiphilic copolymers and their applications. Curr. Opin.
Colloid Interface Sci., 1(4), 490-501. doi: http://dx.doi.org/10.1016/S1359-0294
(96)80118-X
Anwar, A., Shah, M. R., Muhammad, S. P., Afridi, S., & Ali, K. (2016). Thio-pyridinium
capped silver nanoparticle based supramolecular recognition of Cu (I) in real
samples and T-lymphocytes. New J. Chem., 40(7), 6480-6486.
Aragay, G., Pino, F., & Merkoçi, A. (2012). Nanomaterials for sensing and destroying
pesticides. Chem. Rev., 112(10), 5317-5338.
Armitage, A., & Hall, G. (1967). Further evidence relating to the mode of action of
nicotine in the central nervous system. Nature, 214(5092), 977-979.
129
Ateeq, M., Shah, M. R., ul Ain, N., Bano, S., Anis, I., Faizi, S., Naz, S. S. (2015). Green
synthesis and molecular recognition ability of patuletin coated gold nanoparticles.
Biosens. Bioelectron., 63, 499-505.
Atwood, J. W. S. a. J. L. (2009). Supramolecular Chemistry (2nd ed.). United kingdom:
John Wiley & Sons, Ltd.
Aurélien, S., Arthur, G., Alexandre, P., Jérémie, B., Hélène, Y.-L., Jean-Louis, B., . . .
Thomas, M. (2014). Single step synthesis and organization of gold colloids
assisted by copolymer templates. Nanotechnol., 25(22), 225603.
Badawy, A. M. E., Luxton, T. P., Silva, R. G., Scheckel, K. G., Suidan, M. T., &
Tolaymat, T. M. (2010a). Impact of Environmental Conditions (pH, Ionic
Strength, and Electrolyte Type) on the Surface Charge and Aggregation of Silver
Nanoparticles Suspensions. Environ. Sci. Technol., 44(4), 1260-1266. doi: 10.102
1/es902240k
Badawy, A. M. E., Luxton, T. P., Silva, R. G., Scheckel, K. G., Suidan, M. T., &
Tolaymat, T. M. (2010b). Impact of Environmental Conditions (pH, Ionic
Strength, and Electrolyte Type) on the Surface Charge and Aggregation of Silver
Nanoparticles Suspensions. Environ. Sci. Technol., 44(4), 1260-1266. doi:
10.1021/es902240k
Bae, C. H., Nam, S. H., & Park, S. M. (2002). Formation of silver nanoparticles by laser
ablation of a silver target in NaCl solution. Appl. Surf. Sci. , 197, 628-634.
Balazs, A. C., Emrick, T., & Russell, T. P. (2006). Nanoparticle Polymer Composites:
Where Two Small Worlds Meet. Science, 314(5802), 1107-1110. doi: 10.1126/
science.1130557
Bawendi, M. G., Sundar, V. C., & Mikulec, F. V. (2007). Biological applications of quantum
dots: Google Patents.
130
Bhargava, R., Wang, S.-Q., & Koenig, J. L. (2003). FTIR Microspectroscopy of
Polymeric Systems Liquid Chromatography / FTIR Microspectroscopy /
Microwave Assisted Synthesis (Vol. 163, pp. 137-191): Springer Berlin
Heidelberg.
Bhatia, S. (2016). Nanoparticles Types, Classification, Characterization, Fabrication
Methods and Drug Delivery Applications Natural Polymer Drug Delivery
Systems (pp. 33-93): Springer.
Bhumkar, D. R., Joshi, H. M., Sastry, M., & Pokharkar, V. B. (2007). Chitosan reduced
gold nanoparticles as novel carriers for transmucosal delivery of insulin. Pharm.
Res., 24(8), 1415-1426.
Bindhu, M., & Umadevi, M. Green Synthesized Gold Nanoparticles as a Probe for the
Detection of Fe3+ Ions in Water. J. Cluster Sci., 1-10.
Blanchard, C. R. (1996). Atomic Force Microscopy. Chem. Educ., 1(5), 1-8. doi: 10.10
07/s00897960059a
Boal, A. K., Ilhan, F., DeRouchey, J. E., & Thurn-Albrecht, T. (2000). Self-assembly of
nanoparticles into structured spherical and network aggregates. Nature,
404(6779), 746.
Bockstaller, M. R., Mickiewicz, R. A., & Thomas, E. L. (2005). Block copolymer
nanocomposites: perspectives for tailored functional materials. Adv. Mater., 17
(11), 1331-1349.
Bockstaller, M. R., & Thomas, E. L. (2003). Optical properties of polymer-based
photonic nanocomposite materials. J. Phys. Chem. B, 107(37), 10017-10024.
Boisselier, E., & Astruc, D. (2009). Gold nanoparticles in nanomedicine: preparations,
imaging, diagnostics, therapies and toxicity. Chem. Soc. Rev., 38(6), 1759-1782.
Bouzigues, C., Gacoin, T., & Alexandrou, A. (2011). Biological applications of rare-earth
based nanoparticles. ACS Nano, 5(11), 8488-8505.
131
Bronstein, L. M., Sidorov, S. N., Valetsky, P. M., Hartmann, J., Cölfen, H., & Antonietti,
M. (1999). Induced Micellization by Interaction of Poly(2-vinylpyridine)-block-
poly(ethylene oxide) with Metal Compounds. Micelle Characteristics and Metal
Nanoparticle Formation. Langmuir, 15(19), 6256-6262. doi: 10.1021/la990146f
Bruns, N., & Tiller, J. C. (2005). Amphiphilic network as nanoreactor for enzymes in
organic solvents. Nano Lett., 5(1), 45-48.
Brust, M., Walker, M., Bethell, D., Schiffrin, D. J., & Whyman, R. (1994). Synthesis of
thiol-derivatised gold nanoparticles in a two-phase liquid–liquid system. J. Chem.
Soc., Chem. Commun. (7), 801-802.
Cameron, J. M., Howell, D. N., White, J. R., Andrenyak, D. M., Layton, M. E., & Roll, J.
M. (2014). Variable and potentially fatal amounts of nicotine in e-cigarette
nicotine solutions. Tob. control, 23(1), 77-78.
Campoy-Quiles, M., Ferenczi, T., Agostinelli, T., Etchegoin, P. G., Kim, Y.,
Anthopoulos, T. D., Nelson, J. (2008). Morphology evolution via self-
organization and lateral and vertical diffusion in polymer: fullerene solar cell
blends. Nat. Mater., 7(2), 158.
Cao, Y., Zhang, A., Ma, Q., Liu, N., & Yang, P. (2013). Application of hybrid SiO2‐
coated CdTe nanocrystals for sensitive sensing of Cu2+ and Ag+ ions. J. Lumin.,
28(3), 287-293.
Carotenuto, G. (2001). Synthesis and characterization of poly(N-vinylpyrrolidone) filled
by monodispersed silver clusters with controlled size. Appl. Organomet. Chem.,
15(5), 344-351. doi: 10.1002/aoc.165
Carotenuto, G., Pepe, G. P., & Nicolais, L. (2000). Preparation and characterization of
nano-sized Ag/PVP composites for optical applications. Eur. Phys. J. B, 16(1),
11-17. doi: 10.1007/s100510070243
132
Caruso, F., Caruso, R. A., & Möhwald, H. (1998). Nanoengineering of inorganic and
hybrid hollow spheres by colloidal templating. Science, 282(5391), 1111-1114.
Casida, J. E., & Quistad, G. B. (1998). Golden age of insecticide research: past, present,
or future? Ann. Rev. Entomol., 43(1), 1-16.
Chah, S., Hammond, M. R., & Zare, R. N. (2005). Gold Nanoparticles as a Colorimetric
Sensor for Protein Conformational Changes. Chem. Biol., 12(3), 323-328. doi:
http://dx.doi.org/10.1016/j.chembiol.2005.01.013
charles E. Carraher, J. (2012). Introduction to polymer chemistry (Third ed.). New York.
Cheng, J. Y., Ross, C. A., Chan, V. Z. H., Thomas, E. L., Lammertink, R. G. H., &
Vancso, G. J. (2001). Formation of a cobalt magnetic dot array via block
copolymer lithography. Adv. Mater., 13(15), 1174-1178.
Chernousova, S., & Epple, M. (2013). Silver as antibacterial agent: ion, nanoparticle, and
metal. Angew. Chem. Int. Ed., 52(6), 1636-1653.
Chiu, J. J., Kim, B. J., Kramer, E. J., & Pine, D. J. (2005). Control of Nanoparticle
Location in Block Copolymers. J. Am. Chem. Soc., 127(14), 5036-5037. doi:
10.1021/ja050376i
Compton, R. G., & Banks, C. E. (2007). Understanding voltammetry: World Scientific.
Corthey, G. n., Rubert, A. A., Picone, A. L., Casillas, G., Giovanetti, L. J -
-
thiolate-protected palladium nanoparticles. J. Phys. Chem. C, 116(17), 9830-
9837.
Crooks, R. M., Zhao, M., Sun, L., Chechik, V., & Yeung, L. K. (2001). Dendrimer-
Encapsulated Metal Nanoparticles: Synthesis, Characterization, and Applications
to Catalysis. Acc. Chem. Res., 34(3), 181-190. doi: 10.1021/ar00011 0a

133
Cui, L., Ding, Y., Li, X., Wang, Z., & Han, Y. (2006). Solvent and polymer concentration
effects on the surface morphology evolution of immiscible polystyrene/poly
(methyl methacrylate) blends. Thin Solid Films, 515(4), 2038-2048.
Dadwal, M., Solan, D., & Pradesh, H. (2014). Polymeric nanoparticles as promising
novel carriers for drug delivery: An overview. J. Adv. Pharm. Educ. Res., 4(1).
Daniel, M.-C., & Astruc, D. (2004). Gold nanoparticles: assembly, supramolecular
chemistry, quantum-size-related properties, and applications toward biology,
catalysis, and nanotechnology. Chem. Rev., 104(1), 293-346.
Darling, S. B. (2007). Directing the self-assembly of block copolymers. Progress in
Polymer Science, 32(10), 1152-1204. doi:http://dx.doi.org/10.1016/j.progpoly
msci. 2007. 05. 004
Davis, R. A. (1986). The Determination of Nicotine and Cotinine in Plasma. J.
Chromatogr. Sci., 24(4), 134-141. doi: 10.1093/chromsci/24.4.134
Deraedt, C., Salmon, L., Gatard, S., Ciganda, R., Hernandez, R., Ruiz, J., & Astruc, D.
(2014). Sodium borohydride stabilizes very active gold nanoparticle catalysts.
Chem. Commun., 50(91), 14194-14196.
Drbohlavova, J., Adam, V., Kizek, R., & Hubalek, J. (2009). Quantum dots—
characterization, preparation and usage in biological systems. Int. J. Mol. Sci.,
10(2), 656-673.
El-Nour, K. M. A., Eftaiha, A. a., Al-Warthan, A., & Ammar, R. A. (2010). Synthesis
and applications of silver nanoparticles. Arabian J. Chem., 3(3), 135-140.
Eldefrawi, A. T., Bakry, N. M., Eldefrawi, M. E., Tsai, M.-C., & Albuquerque, E. X.
(1980). Nereistoxin interaction with the acetylcholine receptor-ionic channel
complex. Mol. Pharmacol., 17(2), 172-179.
Electroanalytical Methods - Guide to Experiments and Applications. (2010). (F. E.
Scholz Ed. Vol. 1). Berlin Heidelberg: Springer.
134
Everett, W. R., & Rechnitz, G. A. (1998). Mediated bioelectrocatalytic determination of
organophosphorus pesticides with a tyrosinase-based oxygen biosensor. Anal.
Chem., 70(4), 807-810.
Fahmi, A., Pietsch, T., Mendoza, C., & Cheval, N. (2009). Functional hybrid materials.
Mater. Today, 12(5), 44-50. doi: http://dx.doi.org/10.1016/S1369-7021(09)70159-
2
Fang, R., Jing, H., Chai, Z., Zhao, G., Stoll, S., Ren, F., . . . Leng, X. (2011). Study of the
physicochemical properties of the BSA: Flavonoid nanoparticle. Eur. Food Res.
Technol., 233(2), 275-283. doi: 10.1007/s00217-011-1522-9
Fisher, D. H., Xie, Y., & Loring, R. (1993). Analysis of nereistoxin using HPLC and
electrochemical detection. Anal. Lett., 26(6), 1051-1063.
Förster, H. (2004). UV/VIS Spectroscopy. In H. G. Karge & J. Weitkamp (Eds.),
Characterization I: (pp. 337-426). Berlin, Heidelberg: Springer Berlin
Heidelberg.
Frederix, F., Friedt, J.-M., Choi, K.-H., Laureyn, W., Campitelli, A., Mondelaers, D., . . .
Borghs, G. (2003). Biosensing based on light absorption of nanoscaled gold and
silver particles. Anal. Chem., 75(24), 6894-6900.
Frens, G. (1973). Controlled nucleation for the regulation of the particle size in
monodisperse gold suspensions. Nature, 241(105), 20-22.
Fu, Q., & Sun, W. (2001). Mie theory for light scattering by a spherical particle in an
absorbing medium. Applied Optics, 40(9), 1354-1361.
Galatsis, K., Wang, K. L., Ozkan, M., Ozkan, C. S., Huang, Y., Chang, J. P., . . . Botros,
Y. (2010). Patterning and templating for nanoelectronics. Adv. Mater., 22(6), 769-
778.
Gandubert, V. J., & Lennox, R. B. (2005a). Assessment of 4-(dimethylamino) pyridine as
a capping agent for gold nanoparticles. Langmuir, 21(14), 6532-6539.
135
Gandubert, V. J., & Lennox, R. B. (2005b). Assessment of 4-(dimethylamino) pyridine as
a capping agent for gold nanoparticles. Langmuir, 21(14), 6532-6539.
Gandubert, V. J., & Lennox, R. B. (2005c). Assessment of 4-(Dimethylamino)pyridine as
a Capping Agent for Gold Nanoparticles. Langmuir, 21(14), 6532-6539. doi:
10.1021/la050195u
Gindy, M. E., Panagiotopoulos, A. Z., & Prud'homme, R. K. (2008). Composite block
copolymer stabilized nanoparticles: simultaneous encapsulation of organic actives
and inorganic nanostructures. Langmuir, 24(1), 83-90.
Gittins, D. I., & Caruso, F. (2001). Spontaneous phase transfer of nanoparticulate metals
from organic to aqueous media. Angew. Chem. Int. Ed., 40(16), 3001-3004.
Gittins, D. I., & Caruso, F. (2001). Spontaneous phase transfer of nanoparticulate metals
from organic to aqueous media. Angew. Chem. Int. Ed., 40(16), 3001-3004.
Goldburg, W. I. (1999). Dynamic light scattering. Am. J. Phys., 67(12), 1152-1160. doi:
doi:http://dx.doi.org/10.1119/1.19101
Goniewicz, M. L., Kuma, T., Gawron, M., Knysak, J., & Kosmider, L. (2013). Nicotine
Levels in Electronic Cigarettes. Nicotine Tob. Res., 15(1), 158-166. doi:
10.1093/ntr/nts103
Gonzalez, J. M., Foley, M. W., Bieber, N. M., Bourdelle, P. A., & Niedbala, R. S. (2011).
Development of an ultrasensitive immunochromatography test to detect nicotine
metabolites in oral fluids. Anal. Bioanal. Chem., 400(10), 3655-3664. doi:
10.1007/s00216-011-5051-y
Grzelczak, M., Vermant, J., Furst, E. M., & Liz-Marzán, L. M. (2010). Directed self-
assembly of nanoparticles. ACS nano, 4(7), 3591-3605.
Guo, J., Liu, X., Gao, H., Bie, J., Zhang, Y., Liu, B., & Sun, C. (2014). Highly sensitive
turn-on fluorescent detection of cartap via a nonconjugated gold nanoparticle–
quantum dot pair mediated by inner filter effect. RSC Adv., 4(52), 27228-27235.
136
Han, X., Luo, C., Dai, Y., & Liu, H. (2008). Effect of Polymer-Substrate Interactions on
the Surface Morphology of Polymer Blend Thin Films. J. Macromol. Sci. Part B
Phys., 47(6), 1050-1061. doi: 10.1080/00222340802266322
Harsha, T., Abhilash, K., & Hansdak, S. (2013). Cartap Hydrochloride Poisoning: A
Clinical Experience with N-Acetyl Cysteine Therapy. J. Med. Sci. Res., 4(1), 30.
Haruta, M. (1997). Size-and support-dependency in the catalysis of gold. Catal. Today,
36(1), 153-166.
Haruta, M., & Daté, M. (2001). Advances in the catalysis of Au nanoparticles. Appl.
Catal., A: General, 222(1-2), 427-437.
Haruta, M., Kobayashi, T., Sano, H., & Yamada, N. (1987). Novel gold catalysts for the
oxidation of carbon monoxide at a temperature far below 0 C. Chem. Lett., 16(2),
405-408.
Haruta, M., Tsubota, S., Kobayashi, T., Kageyama, H., Genet, M. J., & Delmon, B.
(1993). Low-temperature oxidation of CO over gold supported on TiO2, α-
Fe2O3, and Co3O4. J. Catal., 144(1), 175-192.
Haruta, M., Yamada, N., Kobayashi, T., & Iijima, S. (1989). Gold catalysts prepared by
coprecipitation for low-temperature oxidation of hydrogen and of carbon
monoxide. J. Catal., 115(2), 301-309.
Haryono, A., & Binder, W. H. (2006). Controlled Arrangement of Nanoparticle Arrays in
Block‐Copolymer Domains. Small, 2(5), 600-611.
Hattori, Y., Mukasa, S., Toyota, H., Inoue, T., & Nomura, S. (2011). Synthesis of zinc
and zinc oxide nanoparticles from zinc electrode using plasma in liquid. Mater.
Lett., 65(2), 188-190.
Heinze, J. (1984). Cyclic voltammetry—―electrochemical spectroscopy‖. New analytical
methods (25). Angew. Chem. Int. Ed., 23(11), 831-847.
137
Henry, C. R. (2000). Catalytic activity of supported nanometer-sized metal clusters. Appl.
Surf. Sci., 164(1), 252-259.
Highton, L., Kadara, R. O., Jenkinson, N., Logan Riehl, B., & Banks, C. E. (2009).
Metallic Free Carbon Nanotube Cluster Modified Screen Printed Electrodes for
the Sensing of Nicotine in Artificial Saliva. Electroanalysis, 21(21), 2387-2389.
doi: 10.1002/elan.200904683
Hill, A. V. (1909). The mode of action of nicotine and curari, determined by the form of
the contraction curve and the method of temperature coefficients. J. Physiol.,
39(5), 361-373.
Huh, J., Ginzburg, V. V., & Balazs, A. C. (2000). Thermodynamic Behavior of
Particle/Diblock Copolymer Mixtures: Simulation and Theory. Macromolecules,
33(21), 8085-8096. doi: 10.1021/ma000708y
Ikkala, O., & ten Brinke, G. (2004). Hierarchical self-assembly in polymeric complexes:
towards functional materials. Chem. Commun.(19), 2131-2137.
Jadzinsky, P. D., Calero, G., Ackerson, C. J., Bushnell, D. A., & Kornberg, R. D. (2007).
Structure of a thiol monolayer-protected gold nanoparticle at 1.1 Å resolution.
Science, 318(5849), 430-433.
Jang, S. G., Khan, A., Hawker, C. J., & Kramer, E. J. (2012). Morphology Evolution of
PS-b-P2VP Diblock Copolymers via Supramolecular Assembly of Hydroxylated
Gold Nanoparticles. Macromolecules, 45(3), 1553-1561. doi: 10.1021/ma20239
1k
Jaramillo, T. F., Baeck, S.-H., Cuenya, B. R., & McFarland, E. W. (2003). Catalytic
Activity of Supported Au Nanoparticles Deposited from Block Copolymer
Micelles. J. Am. Chem. Soc., 125(24), 7148-7149. doi: 10.1021/ja029800v
Jiang, J., Oberdörster, G., & Biswas, P. (2009a). Characterization of size, surface charge,
and agglomeration state of nanoparticle dispersions for toxicological studies. J.
Nanopart. Res., 11(1), 77-89.
138
Jiang, J., Oberdörster, G., & Biswas, P. (2009b). Characterization of size, surface charge,
and agglomeration state of nanoparticle dispersions for toxicological studies. J.
Nanopart. Res., 11(1), 77-89.
Jin, J., Iyoda, T., Cao, C., Song, Y., Jiang, L., Li, T. J., & Zhu, D. B. (2001). Self‐
Assembly of Uniform Spherical Aggregates of Magnetic Nanoparticles through
π–π Interactions. Angew. Chem. Int. Ed., 40(11), 2135-2138.
Jin, T., & He, Y. (2011). Antibacterial activities of magnesium oxide (MgO)
nanoparticles against foodborne pathogens. J. Nanopart. Res., 13(12), 6877-6885.
Jing, X., Du, L.-m., Wu, H., Wu, W.-y., & Chang, Y.-x. (2012). Determination of
Pesticide Residue Cartap Using a Sensitive Fluorescent Probe. Journal of
Integrative Agriculture, 11(11), 1861-1870. doi: https://doi.org/10.1016/S2095-
3119(12)60191-9
Jing, Y., Yuan, X., Yuan, Q., He, K., Liu, Y., Lu, P., Li, G. (2016). Determination of
nicotine in tobacco products based on mussel-inspired reduced graphene oxide-
supported gold nanoparticles. Sci. Rep., 6, 29230. doi: 10.1038/srep29230
Jo, J., Kim, S. S., Na, S. I., Yu, B. K., & Kim, D. Y. (2009). Time‐Dependent
Morphology Evolution by Annealing Processes on Polymer: Fullerene Blend
Solar Cells. Adv. Funct. Mater., 19(6), 866-874.
Jores, K., Mehnert, W., Drechsler, M., Bunjes, H., Johann, C., & Mäder, K. (2004).
Investigations on the structure of solid lipid nanoparticles (SLN) and oil-loaded
solid lipid nanoparticles by photon correlation spectroscopy, field-flow
fractionation and transmission electron microscopy. J. Controlled Release 95(2),
217-227.
Ju-Nam, Y., & Lead, J. R. (2008). Manufactured nanoparticles: an overview of their
chemistry, interactions and potential environmental implications. Sci. Total
Environ., 400(1), 396-414.
139
Judefeind, A., & de Villiers, M. M. (2009). Drug loading into and in vitro release from
nanosized drug delivery systems Nanotechnology in drug delivery (pp. 129-162):
Springer.
Kang, Y., & Taton, T. A. (2005). Controlling Shell Thickness in Core−Shell Gold
Nanoparticles via Surface-Templated Adsorption of Block Copolymer
Surfactants. Macromolecules, 38(14), 6115-6121. doi: 10.1021/ma050400c
Kao, J., Thorkelsson, K., Bai, P., Rancatore, B. J., & Xu, T. (2013). Toward functional
nanocomposites: taking the best of nanoparticles, polymers, and small molecules.
Chem. Soc. Rev., 42(7), 2654-2678.
Khandekar, S. V., Kulkarni, M., & Devarajan, P. V. (2014). Polyaspartic acid
functionalized gold nanoparticles for tumor targeted doxorubicin delivery. J.
Biomed. Nanotechnol., 10(1), 143-153.
Kim, B. J., Bang, J., Hawker, C. J., Chiu, J. J., Pine, D. J., Jang, S. G., Kramer, E. J.
(2007). Creating Surfactant Nanoparticles for Block Copolymer Composites
through Surface Chemistry. Langmuir, 23(25), 12693-12703. doi: 10.1021/la7019
06n
Kim, B. J., Bang, J., Hawker, C. J., & Kramer, E. J. (2006). Effect of Areal Chain
Density on the Location of Polymer-Modified Gold Nanoparticles in a Block
Copolymer Template. Macromolecules, 39(12), 4108-4114. doi: 10.1021/ma060
308w
Kim, B. J., Fredrickson, G. H., & Kramer, E. J. (2008). Effect of Polymer Ligand
Molecular Weight on Polymer-Coated Nanoparticle Location in Block
Copolymers. Macromolecules, 41(2), 436-447. doi: 10.1021/ma701931z
Kim, H.-C., Park, S.-M., & Hinsberg, W. D. (2009). Block copolymer based
nanostructures: materials, processes, and applications to electronics. Chem. Rev.,
110(1), 146-177.
140
Kim, J. S., Kuk, E., Yu, K. N., Kim, J.-H., Park, S. J., Lee, H. J., Hwang, C.-Y. (2007).
Antimicrobial effects of silver nanoparticles. Nanomed. Nanotechnol. Biol. Med.,
3(1), 95-101.
Kim, Y., Jung, J., Oh, S., & Choi, K. (2008). Aquatic toxicity of cartap and cypermethrin
to different life stages of Daphnia magna and Oryzias latipes. J. Environ. Sci.
Health., 43(1), 56-64.
Kissinger, P. T., & Heineman, W. R. (1983). Cyclic voltammetry. J. Chem. Educ, 60(9),
702.
Kong, W., Li, B., Jin, Q., Ding, D., & Shi, A.-C. (2010). Complex Micelles from Self-
Assembly of ABA Triblock Copolymers in B-Selective Solvents. Langmuir,
26(6), 4226-4232. doi: 10.1021/la903292f
Kreuter, J. (1983). Physicochemical characterization of polyacrylic nanoparticles. Int. J.
Pharm., 14(1), 43-58.
Kumar, A. P., Amalnath, D., & Dutta, T. (2011). Cartap poisoning: A rare case report.
Indian journal of critical care medicine: peer-reviewed, official publication of
Indian Society of Critical Care Medicine, 15(4), 233.
Kunz, M. S., Shull, K. R., & Kellock, A. J. (1993). Colloidal gold dispersions in
polymeric matrices. J. Colloid Interface Sci., 156(1), 240-249.
Kurisaki, E., Kato, N., Ishida, T., Matsumoto, A., Shinohara, K., & Hiraiwa, K. (2010).
Fatal human poisoning with PadanTM: a cartap-containing pesticide. J. Toxicol.,
48(2), 153-155.
Kwon, G. S., & Kataoka, K. (2012). Block copolymer micelles as long-circulating drug
vehicles. Adv. Drug Delivery Rev., 64, 237-245.
Lambe, J., & Jaklevic, R. (1968). Molecular vibration spectra by inelastic electron
tunneling. Phys. Rev., 165(3), 821.
141
Laviron, E. (1974). Adsorption, autoinhibition and autocatalysis in polarography and in
linear potential sweep voltammetry. J. Electroanal. Chem. Interfacial
Electrochem., 52(3), 355-393.
Lekesiz, T. O., Kayran, C., & Hacaloglu, J. (2015). Preparation and thermal
characterization of poly(2-vinylpyridine) copolymers coordinated to Cr
nanoparticles. Polym. Adv. Technol., 26(6), 555-560. doi: 10.1002/pat.3484
Lévy, R., Thanh, N. T. K., Doty, R. C., Hussain, I., Nichols, R. J., Schiffrin, D. J., Fernig,
D. G. (2004). Rational and Combinatorial Design of Peptide Capping Ligands for
Gold Nanoparticles. JACS, 126(32), 10076-10084. doi: 10.1021/ja0487269
Li, G., Shrotriya, V., Huang, J., Yao, Y., Moriarty, T., Emery, K., & Yang, Y. (2005).
High-efficiency solution processable polymer photovoltaic cells by self-
organization of polymer blends. Nat. Mater., 4(11), 864.
Li, G., Shrotriya, V., Yao, Y., & Yang, Y. (2005). Investigation of annealing effects and
film thickness dependence of polymer solar cells based on poly (3-hexylthiophene).
J. Appl. Phys., 98(4), 043704.
Li, Z., & Zhang, J. (2006). An efficient theoretical study on host–guest interactions of a
fluoride chemosensor with F−, Cl− and Br−. Chem. Phys., 331(1), 159-163.
Liao, J.-W., Kang, J.-J., Jeng, C.-R., Chang, S.-K., Kuo, M.-J., Wang, S.-C., . . . Pang, V.
F. (2006). Cartap-induced cytotoxicity in mouse C 2 C 12 myoblast cell line and
the roles of calcium ion and oxidative stress on the toxic effects. Toxicology,
219(1), 73-84.
Liao, J.-W., Pang, V. F., Jeng, C.-R., Chang, S.-K., Hwang, J.-S., & Wang, S.-C. (2003).
Susceptibility to cartap-induced lethal effect and diaphragmatic injury via ocular
exposure in rabbits. Toxicology, 192(2), 139-148.
Liu, G., Ji, S., Stuen, K. O., Craig, G. S. W., Nealey, P. F., & Himpsel, F. J. (2009).
Modification of a polystyrene brush layer by insertion of poly (methyl
methacrylate) molecules. J. Vac. Sci. Technol., B, 27(6), 3038-3042.
142
Liu, J., Mendoza, S., Román, E., Lynn, M. J., Xu, R., & Kaifer, A. E. (1999).
Cyclodextrin-Modified Gold Nanospheres. Host− Guest Interactions at Work to
Control Colloidal Properties. J. Am. Chem. Soc., 121(17), 4304-4305.
Liu, W., Zhang, D., Tang, Y., Wang, Y., Yan, F., Li, Z., Zhou, H. S. (2012). Highly
sensitive and selective colorimetric detection of cartap residue in agricultural
products. Talanta, 101, 382-387.
Liu, W., Zhang, D., Zhu, W., Zhang, S., Wang, Y., Yu, S., Wang, J. (2015). Colorimetric
and visual determination of total nereistoxin-related insecticides by exploiting a
nereistoxin-driven aggregation of gold nanoparticles. Microchim. Acta, 182(1),
401-408. doi: 10.1007/s00604-014-1347-x
Lo, T. W. B., Aldous, L., & Compton, R. G. (2012). The use of nano-carbon as an
alternative to multi-walled carbon nanotubes in modified electrodes for adsorptive
stripping voltammetry. Sens. Actuators, B, 162(1), 361-368. doi: https://doi.org/1
0.1016/j.snb.2011.12.104
Luo, C., Zhang, Y., Zeng, X., Zeng, Y., & Wang, Y. (2005). The role of poly(ethylene
glycol) in the formation of silver nanoparticles. J. Colloid Interface Sci., 288(2),
444-448. doi: http://dx.doi.org/10.1016/j.jcis.2005.03.005
Lutz, J.-F. (2008). Polymerization of oligo(ethylene glycol) (meth)acrylates: Toward new
generations of smart biocompatible materials. J. Polym. Sci. Part A: Polym.
Chem., 46(11), 3459-3470. doi: 10.1002/pola.22706
Ma, W., Yang, C., Gong, X., Lee, K., & Heeger, A. J. (2005). Thermally stable, efficient
polymer solar cells with nanoscale control of the interpenetrating network
morphology. Adv. Funct. Mater., 15(10), 1617-1622.
Macheroux, P. (1999). UV-Visible Spectroscopy as a Tool to Study Flavoproteins. In S.
K. Chapman & G. A. Reid (Eds.), Flavoprotein Protocols (pp. 1-7). Totowa, NJ:
Humana Press.
143
Magenheim, B., Levy, M., & Benita, S. (1993). A new in vitro technique for the
evaluation of drug release profile from colloidal carriers-ultrafiltration technique
at low pressure. Int. J. Pharm. , 94(1-3), 115-123.
Magonov, S. N., Bar, G., Cantow, H. J., Bauer, H. D., Müller, I., & Schwoerer, M.
(1991). Atomic force microscopy on polymers and polymer related compounds.
Polym. Bull., 26(2), 223-230. doi: 10.1007/BF00297531
Mahoney, G. N., & Al-Delaimy, W. (2001). Measurement of nicotine in hair by reversed-
phase high-performance liquid chromatography with electrochemical detection. J.
Chromatogr. B, 753(2), 179-187. doi: https://doi.org/10.1016/S0378-4347(00)0
0540-5
Mamián-López, M. B., & Poppi, R. J. (2013). Standard addition method applied to the
urinary quantification of nicotine in the presence of cotinine and anabasine using
surface enhanced Raman spectroscopy and multivariate curve resolution. Anal.
Chim. Acta, 760(Supplement C), 53-59. doi: https://doi.org/10.1016/j.aca.2012.1
1.023
Matysik, F.-M. (1999). Application of non-aqueous capillary electrophoresis with
electrochemical detection to the determination of nicotine in tobacco. J.
Chromatogr. A, 853(1), 27-34. doi: https://doi.org/10.1016/S0021-9673(99)005
12-9
McManus, K. T., deBethizy, J. D., Garteiz, D. A., Kyerematen, G. A., & Vesell, E. S.
(1990). A new quantitative thermospray LC-MS method for nicotine and its
metabolites in biological fluids. J. Chromatogr. Sci., 28(10), 510-516.
Mei, L., Somesfalean, G., & Svanberg, S. (2014). Pathlength Determination for Gas in
Scattering Media Absorption Spectroscopy. Sensors, 14(3), 3871.
Mei, Y., Lu, Y., Polzer, F., Ballauff, M., & Drechsler, M. (2007). Catalytic Activity of
Palladium Nanoparticles Encapsulated in Spherical Polyelectrolyte Brushes and
Core−Shell Microgels. Chem. Mater., 19(5), 1062-1069. doi: 10.1021/cm062554s
144
Meulenkamp, E. A. (1998). Synthesis and growth of ZnO nanoparticles. J. Phys. Chem.
B, 102(29), 5566-5572.
Moerner, W., & Fromm, D. P. (2003). Methods of single-molecule fluorescence
spectroscopy and microscopy. Rev. Sci. Instrum., 74(8), 3597-3619.
Molpeceres, J., Aberturas, M., & Guzman, M. (2000). Biodegradable nanoparticles as a
delivery system for cyclosporine: preparation and characterization. J. Microen-
capsulation, 17(5), 599-614.
Mössmer, S., Spatz, J. P., Möller, M., Aberle, T., Schmidt, J., & Burchard, W. (2000).
Solution Behavior of Poly(styrene)-block-poly(2-vinylpyridine) Micelles
Containing Gold Nanoparticles. Macromolecules, 33(13), 4791-4798. doi: 10.10
21/ma992006i
Mulfinger, L., Solomon, S. D., Bahadory, M., Jeyarajasingam, A. V., Rutkowsky, S. A.,
& Boritz, C. (2007). Synthesis and study of silver nanoparticles. J. Chem. Educ,
84(2), 322.
Nagawa, Y., Saji, Y., Chiba, S., & Yui, T. (1971). Neuromuscular blocking actions of
nereistoxin and its derivatives and antagonism by sulfhydryl compounds. Jpn. J.
Pharmacol., 21(2), 185-197.
Nahar, M., Dutta, T., Murugesan, S., Asthana, A., Mishra, D., Rajkumar, V., Jain, N. K.
(2006). Functional polymeric nanoparticles: an efficient and promising tool for
active delivery of bioactives. Crit. Rev. in Therapeutic Drug Carrier Systems,
23(4).
Naka, K., Itoh, H., & Chujo, Y. (2003). Temperature-dependent reversible self-assembly
of gold nanoparticles into spherical aggregates by molecular recognition between
pyrenyl and dinitrophenyl units. Langmuir, 19(13), 5496-5501.
145
Namera, A., Watanabe, T., Yashiki, M., Kojima, T., & Urabe, T. (1999). Simple and
sensitive analysis of nereistoxin and its metabolites in human serum using
headspace solid-phase microextraction and gas chromatography-mass spectrometry.
J. Chromatogr. Sci., 37(3), 77-82.
Nasir, A., Kausar, A., & Younus, A. (2015). A review on preparation, properties and
applications of polymeric nanoparticle-based materials. Polym. Plast. Technol.
Eng., 54(4), 325-341.
Nicholson, R. S. (1965). Theory and Application of Cyclic Voltammetry for
Measurement of Electrode Reaction Kinetics. Anal. Chem., 37(11), 1351-1355.
O‘Farrell, N., Houlton, A., & Horrocks, B. R. (2006). Silicon nanoparticles: applications
in cell biology and medicine. Int. J. Nanomed., 1(4), 451.
Odegard, G. M., Clancy, T. C., & Gates, T. S. (2005). Modeling of the mechanical
properties of nanoparticle/polymer composites. Polymer, 46(2), 553-562. doi:
http://dx.doi.org/10.1016/j.polymer.2004.11.022
Paeng, K., Richert, R., & Ediger, M. (2012). Molecular mobility in supported thin films
of polystyrene, poly (methyl methacrylate), and poly (2-vinyl pyridine) probed by
dye reorientation. Soft Matter, 8(3), 819-826.
Pal, S. L., Jana, U., Manna, P. K., Mohanta, G. P., & Manavalan, R. (2011).
Nanoparticle: An overview of preparation and characterization (2000-2010).
Park, Y., Choe, S., Lee, H., Jo, J., Park, Y., Kim, E., Jung, J. H. (2015). Advanced
analytical method of nereistoxin using mixed-mode cationic exchange solid-phase
extraction and GC/MS. Forensic Sci. Int., 252, 143-149.
Pasch, H. (2013). Hyphenated separation techniques for complex polymers. Polymer
Chemistry, 4(9), 2628-2650.
146
Patil, V., Mayya, K., Pradhan, S., & Sastry, M. (1997). Evidence for novel interdigitated
bilayer formation of fatty acids during three-dimensional self-assembly on silver
colloidal particles. J. Am. Chem. Soc., 119(39), 9281-9282.
Patrianakos, C., & Hoffmann, D. (1979). Chemical Studies on Tobacco Smoke LXIV. On
the Analysis of Aromatic Amines in Cigarette Smoke. J. Anal. Toxicol., 3(4), 150-
154. doi: 10.1093/jat/3.4.150
Pecora, R. (1979). Dynamic light scattering from polymers. Die Makromol. Chem.,
2(S19791), 73-80. doi: 10.1002/macp.1979.020021979105
Perrault, S. D., & Chan, W. C. W. (2009). Synthesis and Surface Modification of Highly
Monodispersed, Spherical Gold Nanoparticles of 50−200 nm. J. Am. Chem. Soc.,
131(47), 17042-17043. doi: 10.1021/ja907069u
Podsiadlo, P., Paternel, S., Rouillard, J.-M., Zhang, Z., Lee, J., Lee, J.-W., Kotov, N. A.
(2005). Layer-by-layer assembly of nacre-like nanostructured composites with
antimicrobial properties. Langmuir, 21(25), 11915-11921.
Podsiadlo, P., Sinani, V. A., Bahng, J. H., Kam, N. W. S., Lee, J., & Kotov, N. A. (2008).
Gold nanoparticles enhance the anti-leukemia action of a 6-mercaptopurine
chemotherapeutic agent. Langmuir, 24(2), 568-574.
Pooja, D., Panyaram, S., Kulhari, H., Rachamalla, S. S., & Sistla, R. (2014). Xanthan
gum stabilized gold nanoparticles: characterization, biocompatibility, stability and
cytotoxicity. Carbohydr. Polym., 110, 1-9.
Pooja, D., Panyaram, S., Kulhari, H., Reddy, B., Rachamalla, S. S., & Sistla, R. (2015).
Natural polysaccharide functionalized gold nanoparticles as biocompatible drug
delivery carrier. Int. J. Biol. Macromol., 80, 48-56.
Puhakainen, E. V. J., Barlow, R. D., & Salonen, J. T. (1987). An automated colorimetric
assay for urine nicotine metabolites: a suitable alternative to cotinine assays for
the assessment of smoking status. Clin. Chim. Acta, 170(2), 255-262. doi:
https://doi.org/10.1016/0009-8981(87)90135-5
147
Quake, S. R., & Scherer, A. (2000). From Micro- to Nanofabrication with Soft Materials.
Science, 290(5496), 1536-1540. doi: 10.1126/science.290.5496.1536
Rahim, S., Ali, S. A., Ahmed, F., Imran, M., Shah, M. R., & Malik, M. I. (2017).
Evaluation of morphology, aggregation pattern and size-dependent drug-loading
efficiency of gold nanoparticles stabilised with poly (2-vinyl pyridine). J.
Nanopart. Res., 19(7), 259.
Rahim, S., Khalid, S., Bhanger, M. I., Shah, M. R., & Malik, M. I. (2018). Polystyrene-
block-poly(2-vinylpyridine)-conjugated silver nanoparticles as colorimetric
sensor for quantitative determination of Cartap in aqueous media and blood
plasma. Sens. Actuators, B, 259, 878-887. doi: https://doi.org/10.1016/j.snb.2017
.12.138
Rai, M., Yadav, A., & Gade, A. (2009). Silver nanoparticles as a new generation of
antimicrobials. Biotechnol. Adv., 27(1), 76-83.
Raymond-Delpech, V., Matsuda, K., Sattelle, B. M., Rauh, J. J., & Sattelle, D. B. (2005).
Ion channels: molecular targets of neuroactive insecticides. Invertebrate Neurosci.,
5(3-4), 119-133.
Ribbe, A. E., Okumura, A., Matsushige, K., & Hashimoto, T. (2001). Element
Spectroscopic Imaging of Poly(2-vinylpyridine)-block-polyisoprene Microdomains
Containing Palladium Nanoparticles. Macromolecules, 34(23), 8239-8245. doi:
10.1021/ma0100091
Riess, G. (2003). Micellization of block copolymers. Prog. Polym. Sci., 28(7), 1107-
1170. doi: http://dx.doi.org/10.1016/S0079-6700(03)00015-7
Riess, G., & Labbe, C. (2004). Block Copolymers in Emulsion and Dispersion
Polymerization. Macromol. Rapid Commun., 25(2), 401-435. doi: 10.1002/marc.
200300048
148
Robinson, I., Ung, D., Tan, B., Long, J., Cooper, A. I., Fernig, D. G., & Thanh, N. T. K.
(2008). Size and shape control for water-soluble magnetic cobalt nanoparticles
using polymer ligands. J. Mater. Chem., 18(21), 2453-2458.
Rogach, A. L., Eychmüller, A., Hickey, S. G., & Kershaw, S. V. (2007). Infrared‐
emitting colloidal nanocrystals: synthesis, assembly, spectroscopy, and
applications. Small, 3(4), 536-557.
Rosen, J. E., Chan, L., Shieh, D.-B., & Gu, F. X. (2012). Iron oxide nanoparticles for
targeted cancer imaging and diagnostics. Nanomed. Nanotechnol. Biol. Med.,
8(3), 275-290.
Roy, S., & Sharma, A. (2015). Self-organized morphological evolution and dewetting in
solvent vapor annealing of spin coated polymer blend nanostructures. J. Colloid
Interface Sci., 449, 215-225.
Ruparelia, J. P., Chatterjee, A. K., Duttagupta, S. P., & Mukherji, S. (2008). Strain
specificity in antimicrobial activity of silver and copper nanoparticles. Acta
Biomater., 4(3), 707-716.
Saha, K., Agasti, S. S., Kim, C., Li, X., & Rotello, V. M. (2012). Gold Nanoparticles in
Chemical and Biological Sensing. Chem. Rev., 112(5), 2739-2779. doi: 10.1021/
cr2001178
Sana Rahim, S. A. A., Farid Ahmed, Muhammad Imran, Muhammad Raza Shah,
Muhammad Imran Malik. (2017). Evaluation of morphology, aggregation pattern
and size-dependent drug-loading efficiency of gold nanoparticles stabilised with
poly (2-vinyl pyridine). J. Nanopart. Res.(19), 259. doi: doi.org/10.1007/s11051-
017-3933-4
Sarkar, B., & Alexandridis, P. (2015). Block copolymer–nanoparticle composites:
Structure, functional properties, and processing. Prog. Polym. Sci., 40, 33-62.
149
Sartor, M. Dynamic Light Scattering University of California, San Diego.
Schaaff, T. G., & Whetten, R. L. (2000). Giant gold− glutathione cluster compounds:
intense optical activity in metal-based transitions. J. Phys. Chem. B, 104(12),
2630-2641.
Schmitt, J., Decher, G., Dressick, W. J., Brandow, S. L., Geer, R. E., Shashidhar, R., &
Calvert, J. M. (1997). Metal nanoparticle/polymer superlattice films: Fabrication
and control of layer structure. Adv. Mater., 9(1), 61-65. doi: 10.1002/
adma.19970090114
Selmar, D., Radwan, A., & Nowak, M. (2015). Horizontal natural product transfer: a so
far unconsidered source of contamination of plant-derived commodities. J.
Environ. Anal. Toxicol., 5(287), 2161-0525.1000287.
Shan, J., & Tenhu, H. (2007). Recent advances in polymer protected gold nanoparticles:
synthesis, properties and applications. Chem. Commun.(44), 4580-4598. doi:
10.1039/B707740H
Shenhar, R., Norsten, T. B., & Rotello, V. M. (2005). Polymer‐Mediated Nanoparticle
Assembly: Structural Control and Applications. Adv. Mater., 17(6), 657-669.
Shenton, W., Davis, S. A., & Mann, S. (1999). Directed Self‐Assembly of Nanoparticles
into Macroscopic Materials Using Antibody–Antigen Recognition. Adv. Mater.,
11(6), 449-452.
Shimmin, R. G., Schoch, A. B., & Braun, P. V. (2004). Polymer Size and Concentration
Effects on the Size of Gold Nanoparticles Capped by Polymeric Thiols.
Langmuir, 20(13), 5613-5620. doi: 10.1021/la036365p
Shiraishi, Y., Ikeda, M., Tsukamoto, D., Tanaka, S., & Hirai, T. (2011). One-pot
synthesis of imines from alcohols and amines with TiO 2 loading Pt nanoparticles
under UV irradiation. Chem. Commun., 47(16), 4811-4813.
150
Shukla, R., Bansal, V., Chaudhary, M., Basu, A., Bhonde, R. R., & Sastry, M. (2005).
Biocompatibility of gold nanoparticles and their endocytotic fate inside the
cellular compartment: a microscopic overview. Langmuir, 21(23), 10644-10654.
Sims, M. J., Rees, N. V., Dickinson, E. J. F., & Compton, R. G. (2010). Effects of thin-
layer diffusion in the electrochemical detection of nicotine on basal plane pyrolytic
graphite (BPPG) electrodes modified with layers of multi-walled carbon nanotubes
(MWCNT-BPPG). Sens. Actuators, B, 144(1), 153-158. doi: https://doi.org
/10.1016/j.snb.2009. 10.055
Sohn, B. H., & Seo, B. H. (2001). Fabrication of the multilayered nanostructure of
alternating polymers and gold nanoparticles with thin films of self-assembling
diblock copolymers. Chem. Mater., 13(5), 1752-1757.
Solomon, S. D., Bahadory, M., Jeyarajasingam, A. V., Rutkowsky, S. A., Boritz, C., &
Mulfinger, L. (2007). Synthesis and Study of Silver Nanoparticles. J. Chem.
Educ., 84(2), 322. doi: 10.1021/ed084p322
Sparks, T. C., & Nauen, R. (2015). IRAC: Mode of action classification and insecticide
resistance management. Pestic. Biochem. Physiol., 121, 122-128. doi: http://dx.doi.
org/10.1016/j.pestbp.2014.11.014
Spatz, J. P., Mößmer, S., & Möller, M. (1996). Mineralization of Gold Nanoparticles in a
Block Copolymer Microemulsion. Chem. Eur. J., 2(12), 1552-1555. doi: 10.1002/
chem.19960021213
Speight, J. G. (2010). Handbook of industrial hydrocarbon processes: Gulf Professional
Publishing.
Suffredini, H. B., Santos, M. C., De Souza, D., Codognoto, L., Homem‐de‐Mello, P.,
Honório, K. M., Avaca, L. A. (2005). Electrochemical behavior of nicotine
studied by voltammetric techniques at boron‐doped diamond electrodes. Anal.
Lett., 38(10), 1587-1599.
151
Sun, S., & Zeng, H. (2002). Size-controlled synthesis of magnetite nanoparticles. JACS,
124(28), 8204-8205.
Švorc, Ľ., Stanković, D. M., & Kalcher, K. (2014). Boron-doped diamond
electrochemical sensor for sensitive determination of nicotine in tobacco products
and anti-smoking pharmaceuticals. Diamond Relat. Mater., 42(Supplement C), 1-
7. doi: https://doi.org/10.1016/j.diamond.2013.11.012
Tan, E. P. S., & Lim, C. T. (2004). Physical properties of a single polymeric nanofiber.
Appl. Phys. Lett., 84(9), 1603-1605. doi: doi:http://dx.doi.org/10.1063/1.1651643
Thesleff, S. (1955). The Mode of Neuromuscular Block Caused by Acetylcholine,
Nicotine, Decamethonium and Suecinylcholine1. Acta Physiol. Scand., 34(2-3),
218-231. doi: 10.1111/j.1748-1716.1955.tb01242.x
Thurmond, K. B., Kowalewski, T., & Wooley, K. L. (1997). Shell Cross-Linked Knedels:
A Synthetic Study of the Factors Affecting the Dimensions and Properties of
Amphiphilic Core-Shell Nanospheres. J. Am. Chem. Soc., 119(28), 6656-6665.
doi: 10.1021/ja9710520
Torrisi, V., Ruffino, F., Licciardello, A., Grimaldi, M. G., & Marletta, G. (2011).
Memory effects in annealed hybrid gold nanoparticles/block copolymer bilayers.
Nanoscale Res. Lett., 6(1), 167. doi: 10.1186/1556-276x-6-167
Toshima, N., & Yonezawa, T. (1998). Bimetallic nanoparticles—novel materials for
chemical and physical applications. New J. Chem., 22(11), 1179-1201.
Trathnigg, B. (1995). Determination of MWD and chemical composition of polymers by
chromatographic techniques. Prog. Polym. Sci., 20(4), 615-650. doi:
http://dx.doi.org/10.1016/0079-6700(95)00005-Z
Turkevich, J., Stevenson, P. C., & Hillier, J. (1951). A study of the nucleation and growth
processes in the synthesis of colloidal gold. Discuss. Faraday Soc., 11, 55-75.
152
Tyagi, H., Kushwaha, A., Kumar, A., & Aslam, M. (2011a). pH-dependent synthesis of
stabilized gold nanoparticles using ascorbic acid. Int. J. Nanosci., 10(04n05), 857-
860. doi: 10.1142/s0219581x11009301
Umali, A. P., & Anslyn, E. V. (2010). A general approach to differential sensing using
synthetic molecular receptors. Curr. Opin. Chem. Biol., 14(6), 685-692.
Ung, D., Tung, L. D., Caruntu, G., Delaportas, D., Alexandrou, I., Prior, I. A., & Thanh,
N. T. (2009). Variant shape growth of nanoparticles of metallic Fe–Pt, Fe–Pd and
Fe–Pt–Pd alloys. CrystEngComm, 11(7), 1309-1316.
Vaia, R. A., & Maguire, J. F. (2007). Polymer Nanocomposites with Prescribed
Morphology: Going beyond Nanoparticle-Filled Polymers. Chem. Mater., 19(11),
2736-2751. doi: 10.1021/cm062693+
Verploegen, E., Mondal, R., Bettinger, C. J., Sok, S., Toney, M. F., & Bao, Z. (2010).
Effects of thermal annealing upon the morphology of polymer–fullerene blends.
Adv. Funct. Mater., 20(20), 3519-3529.
Vivek, C., Veeraiah, K., Padmavathi, P., Rao, H. D., & Bramhachari, P. V. (2016). Acute
toxicity and residue analysis of cartap hydrochloride pesticide: Toxicological
implications on the fingerlings of fresh water fish Labeo rohita. Biocatal. Agric.
Biotechnol.,7(SupplementC),193-201.doi:https://doi.org/10.1016/j.bcab.
2016.06.005
Voulgaris, D., Tsitsilianis, C., Grayer, V., Esselink, F. J., & Hadziioannou, G. (1999).
Amphiphile micelles formed by polystyrene/poly(2-vinyl pyridine) heteroarm star
copolymers in toluene. Polymer, 40(21), 5879-5889. doi: http://dx.doi.org/10.
1016/S0032-3861(98)00815-5
Walker, C. H., St. John, J. V., & Wisian-Neilson, P. (2001). Synthesis and Size Control
of Gold Nanoparticles Stabilized by Poly(methylphenylphosphazene). J. Am.
Chem. Soc., 123(16), 3846-3847. doi: 10.1021/ja005812+
153
Wang, H., Winnik, M. A., & Manners, I. (2007). Synthesis and Self-Assembly of
Poly(ferrocenyldimethylsilane-b-2-vinylpyridine) Diblock Copolymers. Macro-
molecules, 40(10), 3784-3789. doi: 10.1021/ma062728r
Weibel, M., Caseri, W., Suter, U. W., Kiess, H., & Wehrli, E. (1991). Preparation of
polymer nanocomposites with ―ultrahigh‖ refractive index. Polym. Adv. Technol.,
2(2), 75-80.
Weiss, S. (1999). Fluorescence spectroscopy of single biomolecules. Science, 283(5408),
1676-1683.
Wu, C., Siems, W. F., Hill, J. H. H., & Hannan, R. M. (1998). Analytical determination
of nicotine in tobacco by supercritical fluid chromatography–ion mobility
detection. J. Chromatogr. A, 811(1), 157-161. doi: https://doi.org/10.1016/S0021-
9673(98)00223-4
Wu, N., Zheng, A., Huang, Y., & Liu, H. (2007). Morphology of poly (styrene‐block‐
dimethylsiloxane) copolymer films. J. Appl. Polym. Sci., 104(2), 1010-1018.
Xia, Y., Kim, E., Zhao, X.-M., Rogers, J. A., Prentiss, M., & Whitesides, G. M. (1996).
Complex Optical Surfaces Formed by Replica Molding Against Elastomeric
Masters. Science, 273(5273), 347-349. doi: 10.1126/science.273.5273.347
Xue, K., Zhou, S., Shi, H., Feng, X., Xin, H., & Song, W. (2014). A novel amperometric
glucose biosensor based on ternary gold nanoparticles/polypyrrole/reduced
graphene oxide nanocomposite. Sens. Actuators B, 203, 412-416.
Yildiz, D. (2004). Nicotine, its metabolism and an overview of its biological effects.
Toxicon, 43(6), 619-632.
Youk, J. H., Park, M.-K., Locklin, J., Advincula, R., Yang, J., & Mays, J. (2002).
Preparation of Aggregation Stable Gold Nanoparticles Using Star-Block
Copolymers. Langmuir, 18(7), 2455-2458. doi: 10.1021/la015730e
154
Yu, Y. Y., Chien, W. C., & Chen, S. T. (2008). Preparation and morphology of
amphiphilic polystyrene–poly (2‐vinylpyridine) heteroarm star copolymers
prepared by ATRP. Polym. Int., 57(12), 1369-1376.
Yuan, P., Ma, R., & Xu, Q. (2016). Highly sensitive and selective two-photon sensing of
cartap using Au@Ag core-shell nanoparticles. Sci. China Chem., 59(1), 78-82.
doi: 10.1007/s11426-015-5532-5
Yusa, S.-i., Fukuda, K., Yamamoto, T., Iwasaki, Y., Watanabe, A., Akiyoshi, K., &
Morishima, Y. (2007). Salt Effect on the Heat-Induced Association Behavior of
Gold Nanoparticles Coated with Poly(N-isopropylacrylamide) Prepared via
Reversible Addition−Fragmentation Chain Transfer (RAFT) Radical
Polymerization. Langmuir, 23(26), 12842-12848. doi: 10.1021/la702741q
Zhang, H., Liu, Y., Yao, D., & Yang, B. (2012). Hybridization of inorganic nanoparticles
and polymers to create regular and reversible self-assembly architectures. Chem.
Soc. Rev., 41(18), 6066-6088.
155
LIST OF PUBLICATIONS
Sana Rahim, Sadia Khalid, Muhammad Iqbal Bhanger, Muhammad Raza Shah,
Muhammad ImranMalik, ―Polystyrene-block-poly(2-vinylpyridine)-conjugated
silver nanoparticles as colorimetric sensor for quantitative determination of
Cartap in aqueous media and blood plasma‖, Sensors and Actuators B: Chemical,
2018
Sana Rahim, Syed Abid Ali, Farid Ahmed, Muhammad Imran, Muhammad Raza
Shah, Muhammad Imran Malik, ―Evaluation of morphology, aggregation pattern
and size-dependent drug-loading efficiency of gold nanoparticles stabilised with
poly (2-vinyl pyridine)‖, Journal of Nanoparticle Research, 2017
Muhammad Khurram Tufail, Rubina Abdul-Karim, Sana Rahim, Syed Ghulam
Musharraf and Muhammad Imran Malik, ―Analysis of individual block length of
Amphiphilic di- & tri-block copolymers containing poly(ethylene oxide) and
poly(methyl methacrylate)‖, RSC Adv., 2017
Muhammad Imran Malik, Muhammad Irfan, Akbar Khan, Sana Rahim, Rubina
Abdul-Karim, Jamshed Hashim, ―Alkylene oxide poylmerizations: identification of
side reactions and by-products‖, Journal of Polymer Research, 2016.
Sana Rahim, Asma Rauf, Saba Rauf, Muhammad Iqbal Bhanger, Muhammad Raza
Shah, Muhammad Imran Malik, ―Enhanced Electrochemical Response of Modified
Glassy Carbon Electrode by poly(2-vinlypyridine-b-methyl methacrylate)
Conjugated Gold Nanoparticles for Detection of Nicotine‖, (Submitted)
Sana Rahim, Muhammad Raza Shah, Muhammad Imran Malik, ―Selectivity of
thin films of poly(2-vinylpyridine-block-methyl methacrylate) copolymers: an
AFM study‖, (In progress)