Embed Size (px)
Citation preview
Marine Geology 299–302 (2012) 43–50
Contents lists available at SciVerse ScienceDirect
Marine Geology
j ourna l homepage: www.e lsev ie r .com/ locate /margeo
Submarine slide initiation and evolution offshore Pointe Odden, Gabon — Analysisfrom annual bathymetric data (2004–2009)
L. Biscara a,⁎, V. Hanquiez a, D. Leynaud a, V. Marieu a, T. Mulder a, J.-M. Gallissaires b,J.-P. Crespin c, E. Braccini c, T. Garlan d
a Université de Bordeaux, CNRS 5805 EPOC, Avenue des Facultés, 33405 Talence cedex, Franceb IOTA SURVEY, 302 rue Charles Lindbergh, CS 90018, 34137 Mauguio Cedex, Francec TOTAL Centre Scientifique et Technique Jean Feger, Avenue Larribau, 64018 Pau Cedex, Franced Service Hydrographique et Océanographique de la Marine (SHOM), 13 rue du Chatellier, 29228 Brest Cedex 2, France
⁎ Corresponding author.E-mail address: [email protected] (L. Bi
0025-3227/$ – see front matter © 2012 Elsevier B.V. Alldoi:10.1016/j.margeo.2011.11.008
a b s t r a c t
a r t i c l e i n f oArticle history:Received 28 April 2011Received in revised form 7 November 2011Accepted 14 November 2011Available online 25 November 2011
Communicated by: D.J.W. Piper
Keywords:GabonCap Lopezbathymetrysubmarine slidechannel formationliquefaction
Time serial bathymetric data acquired between 2004 and 2009 are used to evaluate the morphological evo-lution of the coastal area offshore Pointe Odden, located on the Mandji Island (Gabon). Data analysis high-lights the alternation between fast sedimentation periods at shallow water depth related to intenselongshore drift and catastrophic erosional events. Because of sediment overloading and slope oversteepening,small-scale instabilities are generated (successive slide scars, channel formation and growth by retrogressiveerosion). However, when critical stability conditions are reached, large failures occur (2005 submarine slide).Geotechnical measurements and sedimentological analyses on the study area suggest that flow liquefactionwould be the triggering mechanism of the 2005 event. Moreover, our analysis shows that the associated slidescar is rapidly filled by compensation and that failure morphology could disappear from the seafloor in about15–20 years.
© 2012 Elsevier B.V. All rights reserved.
1. Introduction
Slope instabilities have been studied in many different environ-ments all over the world (e.g. Hampton et al., 1996; Mienert et al.,2002; Masson et al., 2006; Leynaud et al., 2009 and references therein).Due to the growing development of human activities on subaqueousenvironments,mass-wasting on coastal and underwater slopes are con-sidered as major geological hazards. Analyses of these events weretherefore often carried out for a better understanding of geological phe-nomena which represent a risk for the safety to the coastline areas andoffshore infrastructures (Locat and Lee, 2002, Dan et al., 2007).
Since the last decades, bathymetric surveys have become an es-sential component to describe and understand slope instabilities. De-spite extensive works, the short-term evolution of areas subject tomass wasting is poorly documented. Although some recent studieshave focused on this particular issue (Mitchell, 2005; Smith et al.,2005; Smith et al., 2007), little is known about the frequency or sig-nificance of these processes in the short term. Therefore, annualor multi-annual monitoring of sensitive coastal areas using high-resolution bathymetric data is needed to understand submarine
scara).
rights reserved.
mass wasting and prevent damages to both coastline areas and off-shore infrastructures (Kulikov et al., 1996; Mulder et al., 1997;L'Heureux et al., 2010).
This study analyses bathymetric data acquired annually between2004 and 2009 and explores the short-term sedimentary processesshaping the Pointe Odden area (Gabon) based on our interpretationof morphological changes. Geotechnical measurements were also per-formed on the study site in order to characterize the lithology and themechanical properties of the sediment. From this multidisciplinaryapproach, we propose to explain development and potential triggersof the sedimentary processes observed during the survey period.
2. Environmental settings
The present-day climate on the Gabon basin is influenced by thepermanent Atlantic monsoon (Nicholson, 1996). Annual precipitationsare significant and reach 2.1 m at Port Gentil (Ondo Assoumou, 2006;Fig. 1A). Mean monthly rainfalls are close to 200 mm, except betweenJune and September where they largely decrease (b5 mm/month).
The Ogooué River drains more than 95% of the Gabon basin(203,000 km2, Mahé and Olivry, 1995) and constitutes the third-largest African freshwater source flowing into the Gulf of Guinea(Mahé et al., 1990). The mean annual discharge of the Ogooué River
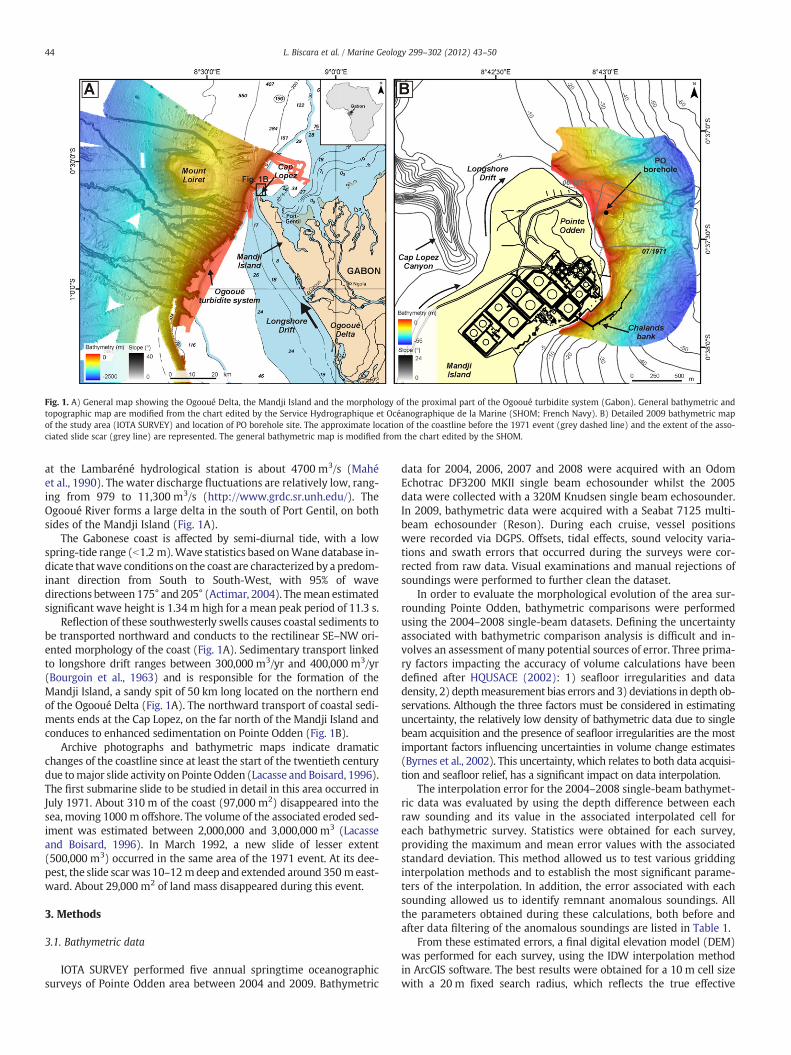
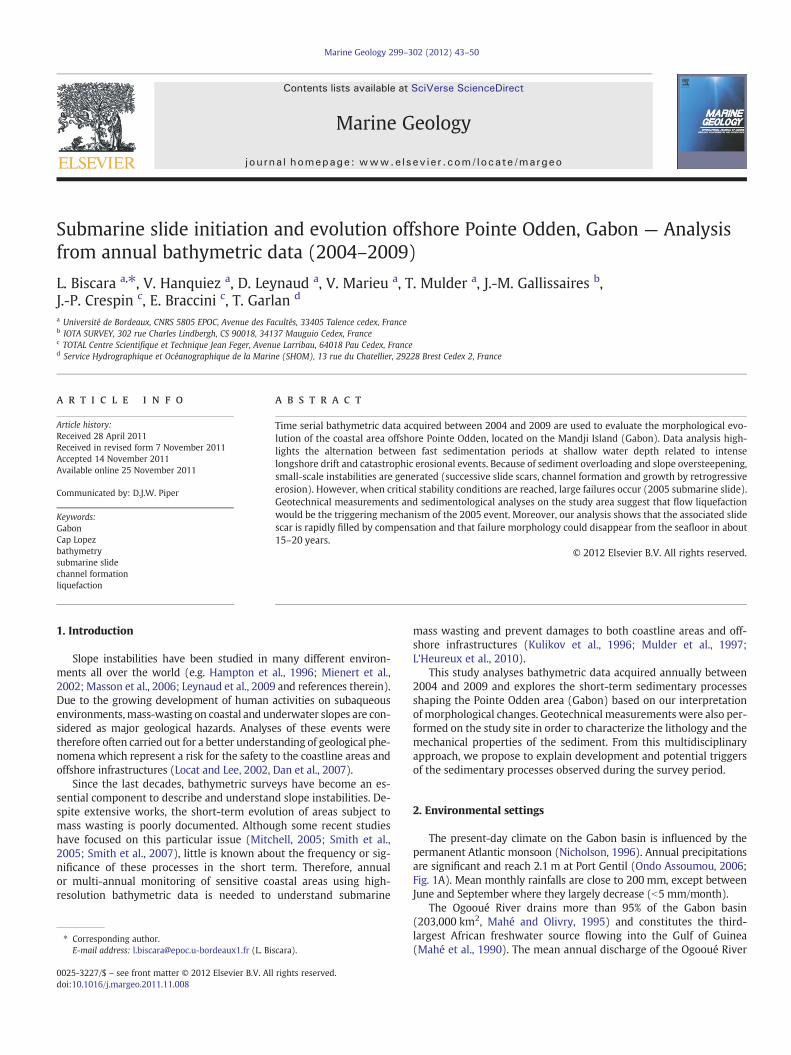
Fig. 1. A) General map showing the Ogooué Delta, the Mandji Island and the morphology of the proximal part of the Ogooué turbidite system (Gabon). General bathymetric andtopographic map are modified from the chart edited by the Service Hydrographique et Océanographique de la Marine (SHOM; French Navy). B) Detailed 2009 bathymetric mapof the study area (IOTA SURVEY) and location of PO borehole site. The approximate location of the coastline before the 1971 event (grey dashed line) and the extent of the asso-ciated slide scar (grey line) are represented. The general bathymetric map is modified from the chart edited by the SHOM.
44 L. Biscara et al. / Marine Geology 299–302 (2012) 43–50
at the Lambaréné hydrological station is about 4700 m3/s (Mahéet al., 1990). The water discharge fluctuations are relatively low, rang-ing from 979 to 11,300 m3/s (http://www.grdc.sr.unh.edu/). TheOgooué River forms a large delta in the south of Port Gentil, on bothsides of the Mandji Island (Fig. 1A).
The Gabonese coast is affected by semi-diurnal tide, with a lowspring-tide range (b1.2 m).Wave statistics based onWane database in-dicate thatwave conditions on the coast are characterized by a predom-inant direction from South to South-West, with 95% of wavedirections between 175° and 205° (Actimar, 2004). Themean estimatedsignificant wave height is 1.34 m high for a mean peak period of 11.3 s.
Reflection of these southwesterly swells causes coastal sediments tobe transported northward and conducts to the rectilinear SE–NW ori-ented morphology of the coast (Fig. 1A). Sedimentary transport linkedto longshore drift ranges between 300,000 m3/yr and 400,000 m3/yr(Bourgoin et al., 1963) and is responsible for the formation of theMandji Island, a sandy spit of 50 km long located on the northern endof the Ogooué Delta (Fig. 1A). The northward transport of coastal sedi-ments ends at the Cap Lopez, on the far north of the Mandji Island andconduces to enhanced sedimentation on Pointe Odden (Fig. 1B).
Archive photographs and bathymetric maps indicate dramaticchanges of the coastline since at least the start of the twentieth centurydue tomajor slide activity on Pointe Odden (Lacasse and Boisard, 1996).The first submarine slide to be studied in detail in this area occurred inJuly 1971. About 310 m of the coast (97,000 m2) disappeared into thesea, moving 1000 m offshore. The volume of the associated eroded sed-iment was estimated between 2,000,000 and 3,000,000 m3 (Lacasseand Boisard, 1996). In March 1992, a new slide of lesser extent(500,000 m3) occurred in the same area of the 1971 event. At its dee-pest, the slide scarwas 10–12 mdeep and extended around 350 meast-ward. About 29,000 m2 of land mass disappeared during this event.
3. Methods
3.1. Bathymetric data
IOTA SURVEY performed five annual springtime oceanographicsurveys of Pointe Odden area between 2004 and 2009. Bathymetric
data for 2004, 2006, 2007 and 2008 were acquired with an OdomEchotrac DF3200 MKII single beam echosounder whilst the 2005data were collected with a 320M Knudsen single beam echosounder.In 2009, bathymetric data were acquired with a Seabat 7125 multi-beam echosounder (Reson). During each cruise, vessel positionswere recorded via DGPS. Offsets, tidal effects, sound velocity varia-tions and swath errors that occurred during the surveys were cor-rected from raw data. Visual examinations and manual rejections ofsoundings were performed to further clean the dataset.
In order to evaluate the morphological evolution of the area sur-rounding Pointe Odden, bathymetric comparisons were performedusing the 2004–2008 single-beam datasets. Defining the uncertaintyassociated with bathymetric comparison analysis is difficult and in-volves an assessment of many potential sources of error. Three prima-ry factors impacting the accuracy of volume calculations have beendefined after HQUSACE (2002): 1) seafloor irregularities and datadensity, 2) depthmeasurement bias errors and 3) deviations in depth ob-servations. Although the three factors must be considered in estimatinguncertainty, the relatively low density of bathymetric data due to singlebeam acquisition and the presence of seafloor irregularities are the mostimportant factors influencing uncertainties in volume change estimates(Byrnes et al., 2002). This uncertainty, which relates to both data acquisi-tion and seafloor relief, has a significant impact on data interpolation.
The interpolation error for the 2004–2008 single-beam bathymet-ric data was evaluated by using the depth difference between eachraw sounding and its value in the associated interpolated cell foreach bathymetric survey. Statistics were obtained for each survey,providing the maximum and mean error values with the associatedstandard deviation. This method allowed us to test various griddinginterpolation methods and to establish the most significant parame-ters of the interpolation. In addition, the error associated with eachsounding allowed us to identify remnant anomalous soundings. Allthe parameters obtained during these calculations, both before andafter data filtering of the anomalous soundings are listed in Table 1.
From these estimated errors, a final digital elevation model (DEM)was performed for each survey, using the IDW interpolation methodin ArcGIS software. The best results were obtained for a 10 m cell sizewith a 20 m fixed search radius, which reflects the true effective
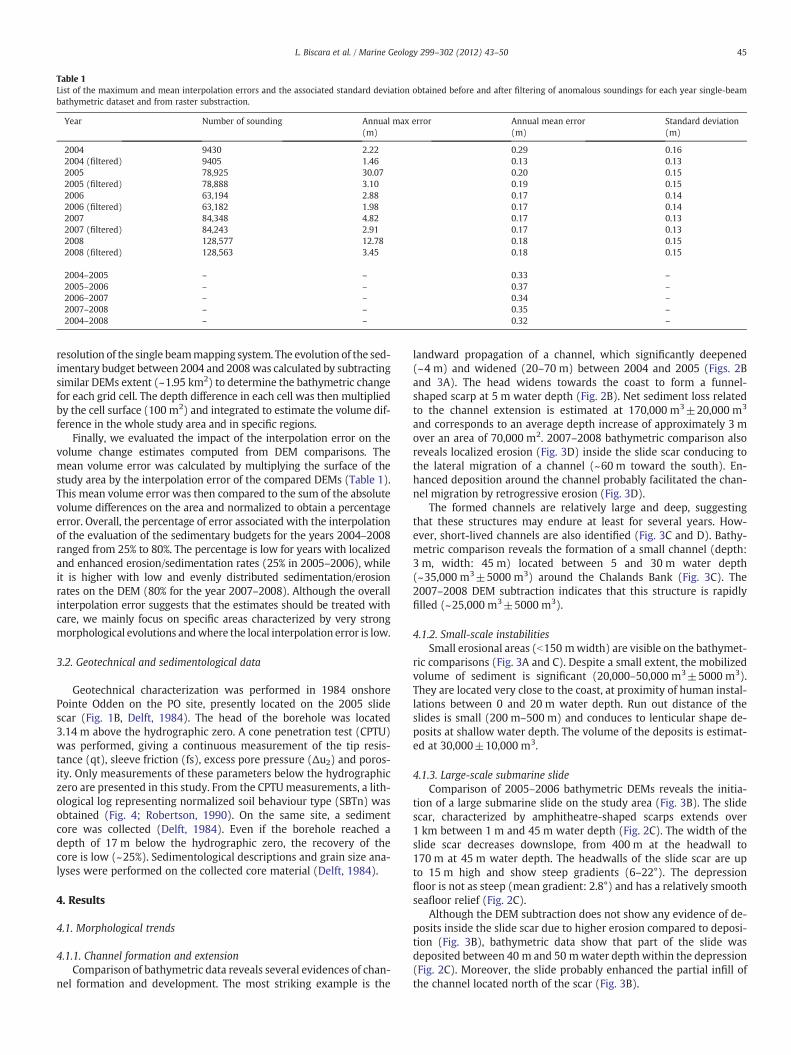
Table 1List of the maximum and mean interpolation errors and the associated standard deviation obtained before and after filtering of anomalous soundings for each year single-beambathymetric dataset and from raster substraction.
Year Number of sounding Annual max error(m)
Annual mean error(m)
Standard deviation(m)
2004 9430 2.22 0.29 0.162004 (filtered) 9405 1.46 0.13 0.132005 78,925 30.07 0.20 0.152005 (filtered) 78,888 3.10 0.19 0.152006 63,194 2.88 0.17 0.142006 (filtered) 63,182 1.98 0.17 0.142007 84,348 4.82 0.17 0.132007 (filtered) 84,243 2.91 0.17 0.132008 128,577 12.78 0.18 0.152008 (filtered) 128,563 3.45 0.18 0.15
2004–2005 – – 0.33 –
2005–2006 – – 0.37 –
2006–2007 – – 0.34 –
2007–2008 – – 0.35 –
2004–2008 – – 0.32 –
45L. Biscara et al. / Marine Geology 299–302 (2012) 43–50
resolution of the single beammapping system. The evolution of the sed-imentary budget between 2004 and 2008was calculated by subtractingsimilar DEMs extent (~1.95 km2) to determine the bathymetric changefor each grid cell. The depth difference in each cell was then multipliedby the cell surface (100 m2) and integrated to estimate the volume dif-ference in the whole study area and in specific regions.
Finally, we evaluated the impact of the interpolation error on thevolume change estimates computed from DEM comparisons. Themean volume error was calculated by multiplying the surface of thestudy area by the interpolation error of the compared DEMs (Table 1).This mean volume error was then compared to the sum of the absolutevolume differences on the area and normalized to obtain a percentageerror. Overall, the percentage of error associated with the interpolationof the evaluation of the sedimentary budgets for the years 2004–2008ranged from 25% to 80%. The percentage is low for years with localizedand enhanced erosion/sedimentation rates (25% in 2005–2006), whileit is higher with low and evenly distributed sedimentation/erosionrates on the DEM (80% for the year 2007–2008). Although the overallinterpolation error suggests that the estimates should be treated withcare, we mainly focus on specific areas characterized by very strongmorphological evolutions andwhere the local interpolation error is low.
3.2. Geotechnical and sedimentological data
Geotechnical characterization was performed in 1984 onshorePointe Odden on the PO site, presently located on the 2005 slidescar (Fig. 1B, Delft, 1984). The head of the borehole was located3.14 m above the hydrographic zero. A cone penetration test (CPTU)was performed, giving a continuous measurement of the tip resis-tance (qt), sleeve friction (fs), excess pore pressure (Δu2) and poros-ity. Only measurements of these parameters below the hydrographiczero are presented in this study. From the CPTUmeasurements, a lith-ological log representing normalized soil behaviour type (SBTn) wasobtained (Fig. 4; Robertson, 1990). On the same site, a sedimentcore was collected (Delft, 1984). Even if the borehole reached adepth of 17 m below the hydrographic zero, the recovery of thecore is low (~25%). Sedimentological descriptions and grain size ana-lyses were performed on the collected core material (Delft, 1984).
4. Results
4.1. Morphological trends
4.1.1. Channel formation and extensionComparison of bathymetric data reveals several evidences of chan-
nel formation and development. The most striking example is the
landward propagation of a channel, which significantly deepened(~4 m) and widened (20–70 m) between 2004 and 2005 (Figs. 2Band 3A). The head widens towards the coast to form a funnel-shaped scarp at 5 m water depth (Fig. 2B). Net sediment loss relatedto the channel extension is estimated at 170,000 m3±20,000 m3
and corresponds to an average depth increase of approximately 3 mover an area of 70,000 m2. 2007–2008 bathymetric comparison alsoreveals localized erosion (Fig. 3D) inside the slide scar conducing tothe lateral migration of a channel (~60 m toward the south). En-hanced deposition around the channel probably facilitated the chan-nel migration by retrogressive erosion (Fig. 3D).
The formed channels are relatively large and deep, suggestingthat these structures may endure at least for several years. How-ever, short-lived channels are also identified (Fig. 3C and D). Bathy-metric comparison reveals the formation of a small channel (depth:3 m, width: 45 m) located between 5 and 30 m water depth(~35,000 m3±5000 m3) around the Chalands Bank (Fig. 3C). The2007–2008 DEM subtraction indicates that this structure is rapidlyfilled (~25,000 m3±5000 m3).
4.1.2. Small-scale instabilitiesSmall erosional areas (b150 mwidth) are visible on the bathymet-
ric comparisons (Fig. 3A and C). Despite a small extent, the mobilizedvolume of sediment is significant (20,000–50,000 m3±5000 m3).They are located very close to the coast, at proximity of human instal-lations between 0 and 20 m water depth. Run out distance of theslides is small (200 m–500 m) and conduces to lenticular shape de-posits at shallow water depth. The volume of the deposits is estimat-ed at 30,000±10,000 m3.
4.1.3. Large-scale submarine slideComparison of 2005–2006 bathymetric DEMs reveals the initia-
tion of a large submarine slide on the study area (Fig. 3B). The slidescar, characterized by amphitheatre-shaped scarps extends over1 km between 1 m and 45 m water depth (Fig. 2C). The width of theslide scar decreases downslope, from 400 m at the headwall to170 m at 45 m water depth. The headwalls of the slide scar are upto 15 m high and show steep gradients (6–22°). The depressionfloor is not as steep (mean gradient: 2.8°) and has a relatively smoothseafloor relief (Fig. 2C).
Although the DEM subtraction does not show any evidence of de-posits inside the slide scar due to higher erosion compared to deposi-tion (Fig. 3B), bathymetric data show that part of the slide wasdeposited between 40 m and 50 mwater depth within the depression(Fig. 2C). Moreover, the slide probably enhanced the partial infill ofthe channel located north of the scar (Fig. 3B).

Fig. 2. Annual bathymetric maps offshore Pointe Odden (IOTA SURVEY) — A: 2004; B: 2005; C: 2006; D: 2007; E: 2008; F: 2009.
46 L. Biscara et al. / Marine Geology 299–302 (2012) 43–50
The 2006 bathymetry dataset shows the slide geometry at mostwithin 8 months after the event occurred, allowing a realistic estima-tion of the eroded sediment volume involved in the slide. Depthdifferences calculated from DEM subtraction show enhanced erosionpatterns close to the coast (up to 23 m, Fig. 3B). The apparent slide vol-ume (SVa; Smith et al., 2007), corresponding to the slide volume basedupon the 2005–2006 DEM subtraction, is estimated at 2,460,000 m3
over an area of 290,000 m2. This estimate takes into account the subma-rine portion of the slide (2,290,000 m3±100,000 m3) and the subaerialportion of the sand bank, resulting in a significant landward migrationof the coastline of ca. 230 m (Fig. 3B). Considering a mean elevation of2 m of the coast (IOTA SURVEY, 2006), the eroded subaerial portion ofthe sand bank (85,000 m2) may be estimated at ~170,000 m3.
4.1.4. Slide scar infillAnalysis of the 2006–2008 DEM indicates that the slide scar infill
occurs by migration of deposits inside the depression. Initial deposi-tion during the post-failure stage occurs essentially on the northside and headwalls of the slide scar due to its proximity to the sourceof sediment supply (Fig. 3C). Between 2006 and 2007, around120,000±20,000 m3 of sediment are deposited between 15 m and35 m water depth, which is equivalent to an average sedimentationrate of ~1.5 m over an area of 50,000 m2 (Fig. 3C). Once this areais partially filled, the deposits successively migrate southward(~120,000±30,000 m3, Fig. 3D) and then eastward (not shown) tofill other areas of bathymetric lows. Therefore, the infill of the scardoes not occur homogeneously throughout the depression but bycompensation until its complete infill.
Concerning the morphological evolution of the depression, the spe-cific sediment budget of the slide scar has been evaluated for the2005–2006 and 2005–2008 periods. To compare these two estimates,we focused on the 2005–2008 slide scar extent, which is slightlylower compared to the real dimensions of the slide scar. The apparentslide volume (Smith et al., 2007) between 2005 and 2006 is estimatedat 2,260,000±100,000 m3 over an area of 270,000 m2, which corre-sponds to an average depth increase of approximately 8.4 m. Incontrast, the apparent slide volume between 2005 and 2008 is estimat-ed at 1,930,000±100,000 m3, reflecting an average depth increase of7.1 m. From these estimates, a filling rate of ~160,000 m3/yr may beproposed. Assuming a constant deposition rate, the 2005 slide scarwould be filled within 14 years. The same calculations performed withan average deposition rate of ~120,000 m3/yr (volume of the deposi-tional units in the slide scar between 2006 and 2008) suggest a totalinfill of the slide scar within 19 years.
4.1.5. Sedimentary budgetAnnual erosion rate offshore Pointe Odden ranges between
310,000±210,000 m3 and 2,660,000±450,000 m3 while sedi-mentation rate is estimated between 150,000±120,000 m3 and570,000±300,000 m3 (Fig. 3F). Due to few bathymetric surveysand recurrent erosional phenomena during the period of study, itis difficult to estimate a truly representative sediment budget. How-ever, a first estimate may be proposed using the average volume ofdeposited and eroded sediment during the year 2007–2008, whichis the most significant period of natural sediment accumulationalong the coastline (Fig. 3D). If we consider an average annualerosion rate of ~350,000 m3/yr and a sedimentation rate of
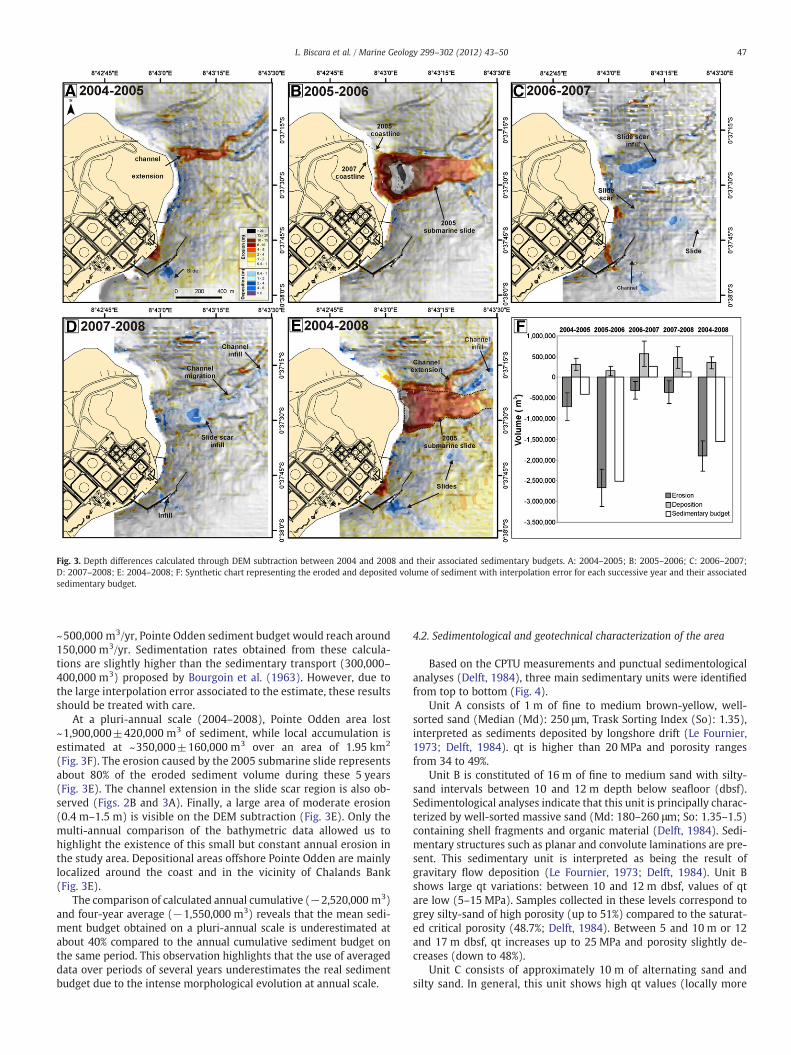
Fig. 3. Depth differences calculated through DEM subtraction between 2004 and 2008 and their associated sedimentary budgets. A: 2004–2005; B: 2005–2006; C: 2006–2007;D: 2007–2008; E: 2004–2008; F: Synthetic chart representing the eroded and deposited volume of sediment with interpolation error for each successive year and their associatedsedimentary budget.
47L. Biscara et al. / Marine Geology 299–302 (2012) 43–50
~500,000 m3/yr, Pointe Odden sediment budget would reach around150,000 m3/yr. Sedimentation rates obtained from these calcula-tions are slightly higher than the sedimentary transport (300,000–400,000 m3) proposed by Bourgoin et al. (1963). However, due tothe large interpolation error associated to the estimate, these resultsshould be treated with care.
At a pluri-annual scale (2004–2008), Pointe Odden area lost~1,900,000±420,000 m3 of sediment, while local accumulation isestimated at ~350,000±160,000 m3 over an area of 1.95 km2
(Fig. 3F). The erosion caused by the 2005 submarine slide representsabout 80% of the eroded sediment volume during these 5 years(Fig. 3E). The channel extension in the slide scar region is also ob-served (Figs. 2B and 3A). Finally, a large area of moderate erosion(0.4 m–1.5 m) is visible on the DEM subtraction (Fig. 3E). Only themulti-annual comparison of the bathymetric data allowed us tohighlight the existence of this small but constant annual erosion inthe study area. Depositional areas offshore Pointe Odden are mainlylocalized around the coast and in the vicinity of Chalands Bank(Fig. 3E).
The comparison of calculated annual cumulative (−2,520,000 m3)and four-year average (−1,550,000 m3) reveals that the mean sedi-ment budget obtained on a pluri-annual scale is underestimated atabout 40% compared to the annual cumulative sediment budget onthe same period. This observation highlights that the use of averageddata over periods of several years underestimates the real sedimentbudget due to the intense morphological evolution at annual scale.
4.2. Sedimentological and geotechnical characterization of the area
Based on the CPTU measurements and punctual sedimentologicalanalyses (Delft, 1984), three main sedimentary units were identifiedfrom top to bottom (Fig. 4).
Unit A consists of 1 m of fine to medium brown-yellow, well-sorted sand (Median (Md): 250 μm, Trask Sorting Index (So): 1.35),interpreted as sediments deposited by longshore drift (Le Fournier,1973; Delft, 1984). qt is higher than 20 MPa and porosity rangesfrom 34 to 49%.
Unit B is constituted of 16 m of fine to medium sand with silty-sand intervals between 10 and 12 m depth below seafloor (dbsf).Sedimentological analyses indicate that this unit is principally charac-terized by well-sorted massive sand (Md: 180–260 μm; So: 1.35–1.5)containing shell fragments and organic material (Delft, 1984). Sedi-mentary structures such as planar and convolute laminations are pre-sent. This sedimentary unit is interpreted as being the result ofgravitary flow deposition (Le Fournier, 1973; Delft, 1984). Unit Bshows large qt variations: between 10 and 12 m dbsf, values of qtare low (5–15 MPa). Samples collected in these levels correspond togrey silty-sand of high porosity (up to 51%) compared to the saturat-ed critical porosity (48.7%; Delft, 1984). Between 5 and 10 m or 12and 17 m dbsf, qt increases up to 25 MPa and porosity slightly de-creases (down to 48%).
Unit C consists of approximately 10 m of alternating sand andsilty sand. In general, this unit shows high qt values (locally more
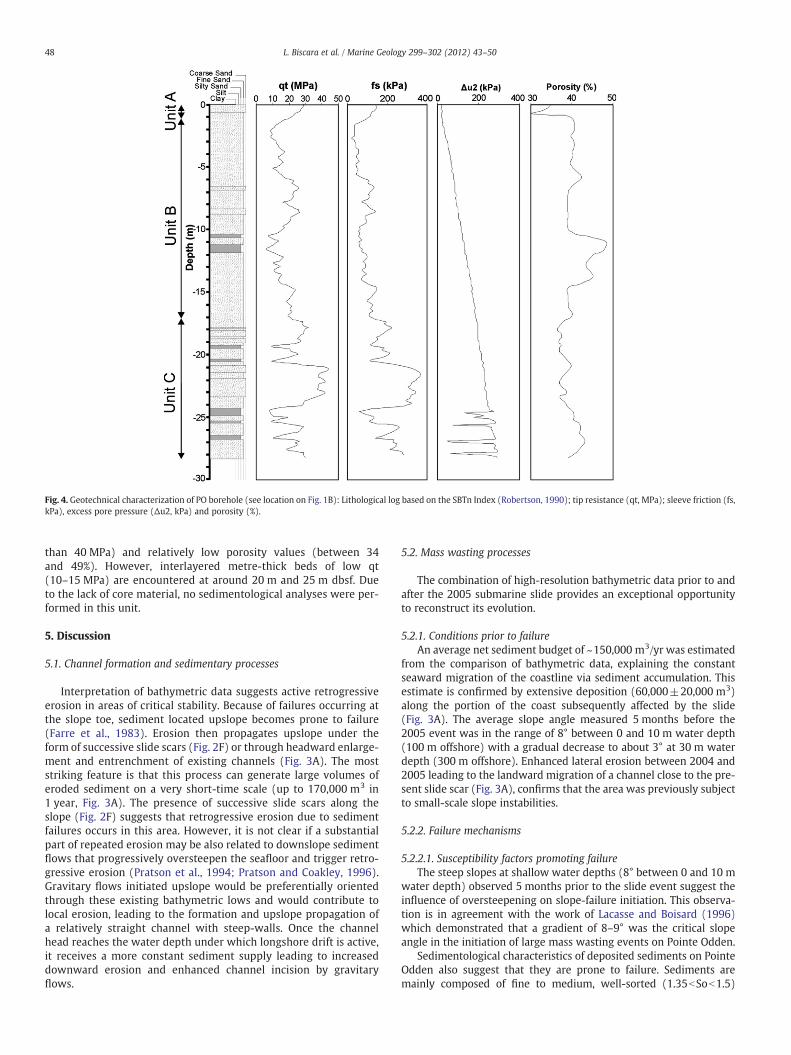
Fig. 4. Geotechnical characterization of PO borehole (see location on Fig. 1B): Lithological log based on the SBTn Index (Robertson, 1990); tip resistance (qt, MPa); sleeve friction (fs,kPa), excess pore pressure (Δu2, kPa) and porosity (%).
48 L. Biscara et al. / Marine Geology 299–302 (2012) 43–50
than 40 MPa) and relatively low porosity values (between 34and 49%). However, interlayered metre-thick beds of low qt(10–15 MPa) are encountered at around 20 m and 25 m dbsf. Dueto the lack of core material, no sedimentological analyses were per-formed in this unit.
5. Discussion
5.1. Channel formation and sedimentary processes
Interpretation of bathymetric data suggests active retrogressiveerosion in areas of critical stability. Because of failures occurring atthe slope toe, sediment located upslope becomes prone to failure(Farre et al., 1983). Erosion then propagates upslope under theform of successive slide scars (Fig. 2F) or through headward enlarge-ment and entrenchment of existing channels (Fig. 3A). The moststriking feature is that this process can generate large volumes oferoded sediment on a very short-time scale (up to 170,000 m3 in1 year, Fig. 3A). The presence of successive slide scars along theslope (Fig. 2F) suggests that retrogressive erosion due to sedimentfailures occurs in this area. However, it is not clear if a substantialpart of repeated erosion may be also related to downslope sedimentflows that progressively oversteepen the seafloor and trigger retro-gressive erosion (Pratson et al., 1994; Pratson and Coakley, 1996).Gravitary flows initiated upslope would be preferentially orientedthrough these existing bathymetric lows and would contribute tolocal erosion, leading to the formation and upslope propagation ofa relatively straight channel with steep-walls. Once the channelhead reaches the water depth under which longshore drift is active,it receives a more constant sediment supply leading to increaseddownward erosion and enhanced channel incision by gravitaryflows.
5.2. Mass wasting processes
The combination of high-resolution bathymetric data prior to andafter the 2005 submarine slide provides an exceptional opportunityto reconstruct its evolution.
5.2.1. Conditions prior to failureAn average net sediment budget of ~150,000 m3/yr was estimated
from the comparison of bathymetric data, explaining the constantseaward migration of the coastline via sediment accumulation. Thisestimate is confirmed by extensive deposition (60,000±20,000 m3)along the portion of the coast subsequently affected by the slide(Fig. 3A). The average slope angle measured 5 months before the2005 event was in the range of 8° between 0 and 10 m water depth(100 m offshore) with a gradual decrease to about 3° at 30 m waterdepth (300 m offshore). Enhanced lateral erosion between 2004 and2005 leading to the landward migration of a channel close to the pre-sent slide scar (Fig. 3A), confirms that the area was previously subjectto small-scale slope instabilities.
5.2.2. Failure mechanisms
5.2.2.1. Susceptibility factors promoting failureThe steep slopes at shallow water depths (8° between 0 and 10 m
water depth) observed 5 months prior to the slide event suggest theinfluence of oversteepening on slope-failure initiation. This observa-tion is in agreement with the work of Lacasse and Boisard (1996)which demonstrated that a gradient of 8–9° was the critical slopeangle in the initiation of large mass wasting events on Pointe Odden.
Sedimentological characteristics of deposited sediments on PointeOdden also suggest that they are prone to failure. Sediments aremainly composed of fine to medium, well-sorted (1.35bSob1.5)
49L. Biscara et al. / Marine Geology 299–302 (2012) 43–50
sand. The uniform grain size distribution observed in the samples fa-cilitates flow sliding (Kramer, 1988). High porosity and correspond-ing low qt values in the studied samples are preferentially observedin laminated and convoluted thick sandy beds (Le Fournier, 1973).The qt variations measured in Unit B and occasionally Unit C may cor-respond to an alternation of easily drainable massive sand beds andless permeable convoluted sandy beds. In-situ salinity measurementsin a borehole located on the coast 120 m from the PO site show lowsalinity values (0.5–1.7 g/L) in buried layers and higher values in su-perficial layers (2.5–10 g/L; Delft, 1972) confirming that permeabilitybarriers may be present.
These observations are consistent with the hypothesis of liquefac-tion processes offshore Pointe Oden. Liquefaction flow slides are re-current phenomena in coastal and deltaic deposits (Sladen et al.,1985; Kramer, 1988; Christian et al., 1997; L'Heureux et al., 2010).The liquefaction process is generated when the excess pore pressurein sandy sediments balances the initial vertical effective stress, lead-ing to a sudden behaviour change of the sediment from solid to liquid(Terzaghi and Peck, 1967). Liquefiable material is usually poorlypacked and highly-porous, allowing high water content and relativelylow density sediments to eventually fail when an external stress isadded. Such a stress can be the result of dynamic effects producedby earthquakes, surface waves or to static effects produced by tidalvariations, sediment piling and shear state of sand at critical densitystate (Chillarige et al., 1997). The good agreement between the thick-ness of the eroded sediment and the depth of highly porous sandylayers in the borehole site (−10 m) suggests that these weak layersmay form a preferential slip plane for the failure. Even if the geotech-nical data do not permit to completely banish the role of sensitive clayin the occurrence of the 2005 slide, the existence of such loose sandyintervals more likely appears to be at the origin of the event.
5.2.2.2. Possible triggering mechanismsDifferent environmental processes such as exceptional meteoro-
logical conditions, cyclic loading, rapid sedimentation or dredging op-erations may trigger or contribute to the initiation of mass wasting insensitive coastal areas.
Particularly intense meteorological or oceanographic conditionsmay trigger submarine mass wasting. Exceptionally heavy rainfall be-fore the 1979 Nice harbour disaster accelerated the seepage of freshwater and the decrease of the effective stress of the sensitive claylayer which lead to slope failure (Dan et al., 2007). Moreover, highswell conditions can generate significant dynamic pressures on theseafloor, inducing pore water pressure fluctuations within the seabed(Jeng, 2001) and liquefaction of soils (Dalrymple, 1979). Transientchanges in pore water pressure associated with high swell conditionshave been suggested as a triggering mechanism for slope failures andgravitary flows (Paull et al., 2003; Xu et al., 2004). However, neithersignificant precipitation rates (b5 mm/h; http://www.sat-ocean.com/squalls.html) nor exceptionally high surf conditions susceptibleto generate excess pore pressure were recorded between June andJuly 2005 in Port-Gentil area. Moreover, considering the absence ofthe precise date of the event, it appears difficult to involve tidal vari-ations as a triggering mechanism.
Cyclic loading may also induce excess pore pressure and conductsto liquefaction processes. Earthquake data along the Gabonesemargin were collected from the United States Geological Survey data-base (http://earthquake.usgs.gov). No significant earthquakes wererecorded during the year 2005, suggesting that seismic loading can-not be considered as a triggering mechanism. Moreover, no pile in-stallations susceptible to generate vibrations were reported beforethe event.
Static loading may result from dredging operations or longshoredrift sedimentation. To our knowledge, no dumping/dredging opera-tions were performed during the period of study. Frequent dredgingoperations on the Chalands bank were performed until the year
1993 (Lateux, 2007). Since this year, the abandonment of dredgingoperations suggests that the erosive structures observed in2004–2005 and 2006–2007 have a natural origin rather than anthro-pogenic. Indeed, the orientation change of the coast in the area ofPointe Odden conduces to a sharp decrease of the intensity of long-shore drift and contributes to high sedimentation rates. Sediment ac-cumulation may generate excess pore pressure in underlying layerswhich dissipates at a rate depending on the degree of accumulationand permeability of the sediment. Shear stress related to sedimentload on loose layers may conduce to overpressure development inthe pores and generates liquefaction processes. Even if the triggeringmechanism of the 2005 slide remains still uncertain, our results sug-gest that shear stress associated to sediment overloading and slopeoversteepening would be an important mechanism.
6. Conclusions
This contribution presents the first detailed study of submarineslide initiation and evolution using recurrent bathymetric analysis.The comparison of annual bathymetric data highlights the constantsediment load and deposition along the coast of Pointe Odden bylongshore drift, resulting in high sediment accumulation at shallowwater depth. Because of sediment overloading and slope overstee-pening, small-scale instabilities are generated (successive slidescars, channel formation and growth by retrogressive erosion). How-ever, when stability becomes critical, large failures occur (e.g. 2005submarine slide). Geotechnical measurements and sedimentologicalanalyses on the study area suggest that flow liquefaction would beat the origin of the 2005 event. Even if the triggering mechanisms ofthe 2005 slide remain still uncertain, shearing of loose sandy layersrelated to both sediment overloading and slope oversteepeningseems to be the most probable triggering mechanism of the event.
Since the 2005 slide, substantial morphologic changes are ob-served, indicating that the slide scar is currently experiencing aninfilling stage. This infill does not occur homogeneously throughoutthe depression but via migrating deposits that progressively fill theslide scar by compensation. Assuming a constant deposition rate,the total infill of the slide scar would occur between 14 and19 years. These results suggest that 1) slide scars may evolve quicklythrough time, by enlargement or filling processes; 2) they can disap-pear rapidly from seafloor morphology and 3) Pointe Odden areacould once again be in a state of critical stability from 2020 onwards.
Overall, this study confirms that monitoring of sensitive areaswith high-resolution bathymetric tools brings new elements on theunderstanding of submarine mass failure mechanisms and their de-velopment. Comparison of bathymetric data forms a preliminarysource of information for anticipating potential damages to bothcoastal areas and offshore infrastructures.
Acknowledgements
We are grateful to the SHOM and TOTAL for making their data avail-able. We acknowledge the “Action Marges” French Consortium for fi-nancial support. We gratefully acknowledge Sylvie Bretelle, HervéGillet and Samuel Etienne for their critical and constructive reading ofan earlier version of this paper. We gratefully acknowledge SimonLaugier and Ben Smith for proof reading. Finally, we have benefitedfrom constructive reviews by Doug Smith, Jean-Sébastien L'Heureuxand David Piper. Laurie Biscara's PhD thesis is funded by a DGA (FrenchMinistry of Defence)-CNRS doctoral fellowship. This is an UMR CNRS5805 EPOC (University Bordeaux 1) contribution no. 1845.
References
Actimar, 2004. Offshore Gabon: analysis of extreme and operational sea conditions &analysis of currents. Total internal report. . 67 pp.
50 L. Biscara et al. / Marine Geology 299–302 (2012) 43–50
Bourgoin, J., Reyre, D., Magloire, P., Krichewsky, M., 1963. Les canyons sous-marins duCap Lopez (Gabon). Cahiers Océanographiques15ème Année 6: 372–387.
Byrnes, M.R., Baker, J.L., Li, F., 2002. Quantifying Potential Measurement Errors and Un-certainties Associated with Bathymetric Change Analysis. ERDC/CHL CHETN-IV-50,U.S. Army Engineer Research and Development Center, Vicksburg, MS http://chl.wes.army.mil/library/publications/chetn.
Chillarige, A.V., Morgenstern, N.R., Robertson, P.K., Christian, H.A., 1997. Seabed insta-bility due to flow liquefaction in the Fraser River delta. Canadian GeotechnicalJournal 34, 520–533.
Christian, H.A., Woeller, D.J., Robertson, P.K., Courtney, R.C., 1997. Site investigations toevaluate flow liquefaction slides at Sand Heads, Fraser River delta. Canadian Geo-technical Journal 34, 384–397.
Dalrymple, R.W., 1979. Wave-induced liquefaction: a modern example from the Bay ofFundy. Sedimentology 26 (6), 835–844.
Dan, G., Sultan, N., Savoye, B., 2007. The 1979 Nice harbour catastrophe revisited: trig-ger mechanism inferred from geotechnical measurements and numerical model-ling. Marine Geology 245 (1–4), 40–64.
Delft, 1972. Etude du glissement 1971 au Cap Lopez, Gabon. Total internal report. . 26pp.
Delft, 1984. Etude géotechnique de la stabilité du littoral à la tête de canyon du CapLopez — Rapport final. Total internal report. . 43 pp.
Farre, J.A., McGregor, B.A., Ryan, W.B.F., Robb, J.M., 1983. Breaching the shelfbreak: pas-sage from youthful to mature phase in submarine canyon evolution. In: Stanley,D.J., Moore, G.T. (Eds.), The Shelfbreak: Critical Interface on Continental Margins.Society of Economic Paleontologists and Mineralogists Special Publication, Tulsa(U.S.A), pp. 25–39.
Hampton, M.A., Lee, H.J., Locat, J., 1996. Submarine landslides. Reviews of Geophysics34 (1), 33–59.
Headquarters, U.S. Army Corps of Engineers, 2002. Hydrographic Surveying. Draft En-gineer Manual EM 1110-2-1003. U.S. Army Corps of Engineers, Washington, DC:506. http://www.usace.army.mil/inet/usace-docs/eng-manuals/em1110-2-1003/toc.htm.
IOTA SURVEY, 2006. Gabon, Cap Lopez : Reconnaissances bathymétriques — Campagneannuelle. Total internal report. 71 pp.
Jeng, D.S., 2001. Mechanism of the wave-induced seabed instability in the vicinity of abreakwater: a review. Ocean Engineering 28 (5), 537–570.
Kramer, S.L., 1988. Triggering of liquefaction flow slides in coastal soil deposits. Engi-neering Geology 26 (1), 17–31.
Kulikov, E.A., Rabinovich, A.B., Thomson, R.E., Bornhold, B.D., 1996. The landslide tsuna-mi of November 3, 1994, Skagway Harbor, Alaska. Journal of Geophysical Research101 (C3), 6609–6615.
Lacasse, S., Boisard, P., 1996. Recurrent sliding of underwater slope on Cap Lopez inGabon. 7th Symposium on Landslides, Trondheim, Norway.
Lateux, B., 2007. Problèmes liés à l'érosion de la côte et des fonds au Cap Lopez(Gabon) — Diagnostic détaillé. Elaboration de principes de solutions, Total internalreport. 131 pp.
Le Fournier, J., 1973. Architecture des dépôts du Cap Lopez — Etude sédimentologiquede l'interprétation C.G.G. et laboratoire d'Hydraulique/Mécanique des Sols deDELFT. Total internal report. . 17 pp.
Leynaud, D., Mienert, J., Vanneste, M., 2009. Submarine mass movements on glaciatedand non-glaciated European continental margins: a review of triggering mecha-nisms and preconditions to failure. Marine and Petroleum Geology 26 (5),618–632.
L'Heureux, J.S., Hansen, L., Longva, O., Emdal, A., Grande, L.O., 2010. Amultidisciplinary studyof submarine landslides at the Nidelva fjord delta, Central Norway — implications forgeohazard assessment. Norwegian Journal of Geology 90, 1–20.
Locat, J., Lee, H.J., 2002. Submarine landslides: advances and challenges. Canadian Geo-technical Journal 39 (1), 193–212.
Mahé, G., Olivry, J.-C., 1995. Variations des précipitations et des écoulements en Afriquede l'Ouest et centrale de 1951 à 1989. Sécheresse 1 (6), 109–117.
Mahé, G., Lerique, J., Olivry, J.-C., 1990. Le fleuve Ogooué au Gabon. Reconstitution desdébits manquants et mise en évidence des variations climatiques à l'équateur.Hydrologie Continentale 5 (2), 105–124.
Masson, D.G., Harbitz, C.B., Wynn, R.B., Pedersen, G., Løvholt, F., 2006. Submarine land-slides: processes, triggers and hazard prediction. Philosophical Transactions of theRoyal Society A 364, 2009–2039.
Mienert, J., Berndt, C., Laberg, J.S., Vorren, T.O., 2002. Slope instability of continentalmargins. In: Wefer, G., Billett, D., Hebbeln, D., Jørgensen, B.B., Schlüter, M., vanWeering, T.C.E. (Eds.), Ocean Margin Systems. Springer-Verlag, Berlin Heidelberg,pp. 179–193.
Mitchell, N.C., 2005. Channelled erosion through a marine dump site of dredge spoils atthe mouth of the Puyallup River, Washington State, USA. Marine Geology 220(1–4), 131–151.
Mulder, T., Savoye, B., Syvitski, J.P.M., 1997. Numerical modelling of a mid-sized gravityflow: the 1979 Nice turbidity current (dynamics, processes, sediment budget andseafloor impact). Sedimentology 44 (2), 305–326.
Nicholson, S.E., 1996. A review of climate dynamics and climate variability in EasternAfrica. In: Johnson, T.C., Odada, E.O. (Eds.), The Limnology, Climatology and Paleo-climatology of the East African Lakes. Gordon and Breach, Amsterdam, pp. 25–56.
Ondo Assoumou, E., 2006. Dynamique des paysages végétaux du littoral centre-ouestdu Gabon autour de Port-Gentil. Unpubl. Ph.D. thesis, Université Paul-Valéry Mont-pellier III, pp. 302.
Paull, C.K., Ussler, W., Greene, H.G., Keaten, R., Mitts, P., Barry, J., 2003. Caught in theact: the 20 December 2001 gravity flow event in Monterey Canyon. Geo-MarineLetters 22 (4), 227–232.
Pratson, L.F., Coakley, B.J., 1996. A model for the headward erosion of submarine can-yons induced by downslope-eroding sediment flows. Geological Society of AmericaBulletin 108 (2), 225–234.
Pratson, L.F., Ryan, W.B.F., Mountain, G.S., Twichell, D.C., 1994. Submarine canyon initi-ation by downslope-eroding sediment flows: evidence in late Cenozoic strata onthe New Jersey continental slope. Geological Society of America Bulletin 106 (3),395–412.
Robertson, P.K., 1990. Soil classification using the cone penetration test. Canadian Geo-technical Journal 27, 151–158.
Sladen, J.A., D'Hollander, R.D., Krahn, J., Mitchell, D.E., 1985. Back analysis of the Nerlekberm liquefaction slides. Canadian Geotechnical Journal 22 (4), 579–588.
Smith, D.P., Ruiz, G., Kvitek, R., Iampietro, P.J., 2005. Semiannual patterns of erosion anddeposition in upper Monterey Canyon from serial multibeam bathymetry. Geolog-ical Society of America Bulletin 117 (9), 1123–1133.
Smith, D.P., Kvitek, R., Iampietro, P.J., Wong, K., 2007. Twenty-nine months of geomor-phic change in upper Monterey Canyon (2002–2005). Marine Geology 236 (1–2),79–94.
Terzaghi, K., Peck, R.B., 1967. Soil Mechanics in Engineering Practice, 2nd ed. JonhWiley & Sons, Inc., New York.
Xu, J.P., Noble, M.A., Rosenfeld, L.K., 2004. In-situ measurements of velocity structurewithin turbidity currents. Geophysical Research Letters 31 (9), L09311.