Embed Size (px)
Citation preview
Policy Research Working Paper 6990
Stylized Facts on Productivity Growth
Evidence from Firm-Level Data in Croatia
Mariana IoottyPaulo CorreaSonja Radas
Bruno Škrinjarić
Trade and Competitiveness Global Practice GroupJuly 2014
WPS6990P
ublic
Dis
clos
ure
Aut
horiz
edP
ublic
Dis
clos
ure
Aut
horiz
edP
ublic
Dis
clos
ure
Aut
horiz
edP
ublic
Dis
clos
ure
Aut
horiz
ed
Produced by the Research Support Team
Abstract
The Policy Research Working Paper Series disseminates the findings of work in progress to encourage the exchange of ideas about development issues. An objective of the series is to get the findings out quickly, even if the presentations are less than fully polished. The papers carry the names of the authors and should be cited accordingly. The findings, interpretations, and conclusions expressed in this paper are entirely those of the authors. They do not necessarily represent the views of the International Bank for Reconstruction and Development/World Bank and its affiliated organizations, or those of the Executive Directors of the World Bank or the governments they represent.
Policy Research Working Paper 6990
This paper is a product of the Trade and Competitiveness Global Practice Group. It is part of a larger effort by the World Bank to provide open access to its research and make a contribution to development policy discussions around the world. Policy Research Working Papers are also posted on the Web at http://econ.worldbank.org. The authors may be contacted at [email protected].
Drawing on a representative sample of firms, this paper presents some microeconomic evidence on the productiv-ity growth process in Croatia since the onset of recession (2008–12). Four types of results are highlighted. First, there is a persistent (and increasing) heterogeneity in the performance of Croatian firms along outcome measures. Second, Croatia lags behind regional peers in entrepre-neurship measures, which suggests a comparatively lower economic dynamism. Third, the lack of dynamism dis-played by the Croatian economy is confirmed when looking at the firm entry and exit process: the analytical results point to reduced firm dynamism compared with Croatia’s peers in Europe and Central Asia. Fourth, the contribu-tion of net entry to overall productivity growth in Croatia
is surprisingly negative. This is contrary to what would be expected based on the literature and suggests that the process of “destructive creation” in Croatia has not been efficient, as the market might be eliminating firms that are potentially productive. Policies that foster market con-testability should be pursued, especially policies aiming at better product market regulation (such as liberalization of entry into the service sector, particularly retail and infra-structure). Measures to help finance entrepreneurship (in promising sectors) should be used to support enhancements in firm productivity. In addition, appropriate bankruptcy rules play a key role by easing the exit process and allowing low-productive units to leave the market and free resources that can be better used by other, more efficient, firms.
Stylized Facts on Productivity Growth: Evidence from Firm-Level Data in
Croatia
Mariana Iootty, Paulo Correa, Sonja Radas and Bruno Škrinjarić*
Keywords: firm entry,firm exit, survival, productivity growth JEL: D21, D22, L11, L16, L25, O4 __________________________________________________________________________________ Mariana Iootty and Paulo Correa are, respectively, economist and lead economist at the Trade and Competitiveness Global Practice at the World Bank; Sonja Radas and Bruno Škrinjarić are at the Institute of Economics, Zagreb. We thank Arabela Aprahamian, Ana Paula Cusolito and workshop participants at the World Bank office in Zagreb in March 2014 for comments and suggestions. All errors are our own. The paper was prepared as part of the Croatia Smart Specialization Technical Assistance. Financial support by the Competitive Industries and Innovation Program trust fund is acknowledged. This paper's findings interpretations, and conclusions are entirely those of the authors and do not necessarily represent the views or policies of the World Bank, their Executive Directors, or the countries they represent. Corresponding author: Mariana Iootty, E-mail [email protected].

1 Context and Objective Croatia’s economic achievement over the beginning of the 2000s decade looks
notable. In the 2003-08 period, growth in incomes and the country’s economic expansion were fueled by a growth pattern based on domestic consumption, growing current account deficit and increasing dependence on international finance. In this period, the Croatian economy experienced healthy rates of growth averaging 4.31% per annum and saw GDP per capita rise from 22.84% of the EU average to 37.8% between 2000 and 2008, falling back to 34.34 % in 2012 (see Figure 1).
The global financial crisis in 2008, and the prolonged recession experienced so far has unveiled certain structural weaknesses of the Croatian economy. Since the beginning of global recession in 2008, the Croatian economy has been contracting steadily. The real GDP decrease in 2012 was 2%, while the estimates for 2013 indicate the further GDP decline of 0.7%. Starting from 2008, the cumulative GDP decrease is estimated to be 12%. Greece and Croatia are the two EU countries that have experienced the longest recession, and in the case of Croatia it seems that the recovery will be rather slow. As for the future growth, Nestić et al. (2014) forecast stagnation in 2014 and slow recovery (about 1%) in 2015.
Against this backdrop, Croatia needs to switch to a growth model driven by exports, current account surpluses and less dependence on international finance. To the extent that countries do not trade, but firms do (Leighton, 1970), it is key to enhance the competitiveness of Croatian firms as a way to support a larger and more diversified exports, sustained growth and job creation. The main factors lying behind firm competitiveness – as size, organization, technological capacity and their ability to successfully operate in international markets – are ultimately related to firm-level productivity. In this sense, the main objective of this note is to present some microeconomic evidence on the productivity growth process in Croatia in the period since the onset of the crisis as a way to help formulate growth oriented policies.
Figure 1. Croatian GDP per capita and growth rates (a) Croatian GDP per capita as % of
EU15, 2000-2012 (b) GDP per capita and GDP growth rate from
2003-2012
Source: Eurostat Source: Croatian Bureau of Statistics: Statistical yearbook 2013,
Statistical yearbook 2010
The aim of this paper is to present some microeconomic evidence on the productivity growth process in Croatia in the period since the onset of the recession.The paper is organized as follows: Section 2 describes the firm level data set used and the methodology applied and some descriptive statistics on firm performance measures. Section 3 explores firm
20%
25%
30%
35%
40%
2000
2001
2002
2003
2004
2005
2006
2007
2008
2009
2010
2011
2012
-8%
-6%
-4%
-2%
02%
4%6%
8%G
DP
gro
wth
02,
000€
4,00
0€6,
000€
8,00
0€10
,000
€G
DP
per
cap
ita
2003 2004 2005 2006 2007 2008 2009 2010 2011 2012
GDP per capita (EUR) GDP growth (%)
2

heterogeneity while Section 4 focuses on firm dynamics and productivity growth. Section 5 concludes.
2 Methodology: Data cleaning, deflation process, performance measures and descriptive statistics
Our analysis was performed on a representative sample of Croatian companies. The sample consists of 2,000 firms obtained from the Croatian Financial Agency (FINA).1 For large companies, a census was applied and all companies that had the status of large company during at least one of the analyzed years were included in the final data set. The rest of the sample was roughly equally divided between small and medium enterprises. For small and medium companies, two proportional stratified samples were constructed, one for small companies and one for medium-sized companies, with county and sector (two digit level) as control variables.
For both samples, the size of a sample in each stratum was specified to be proportional to the size of each stratum in 2012, and therefore the first stage in our sample selection process included creation of the table containing data on the size of each county-sector stratum. The next stage of the sample selection involved calculation of the share of each stratum in the population. Finally, these shares were then used to calculate the number of companies from each stratum to be selected in the sample.
The sample included 729 small, 719 medium and 552 large enterprises, as defined by the Croatian Law of Accounting.2 Considering population sizes, this means that the sample contains a census of large firms, 55.5% of medium firms, and 0.97% of small firms. Within each of the three size groups, the sample is representative regarding sector and county.3
Industry sectors are classified according to NKD20074 classification (Croatian equivalent of NACE Rev.2). The following sectors are excluded from analysis: K 64.1 (Monetary intermediation), O (Public administration and defense; compulsory social security), P (Education), T (Activities of households as employers) and U (Activities of extraterritorial organizations and bodies). In total, that leaves us with 81 sectors (2 digit specification).
The analysis covered all of Croatia’s 21 counties, which are aggregated according to NUTS 2 regions.5 Croatia has two NUTS 2 regions: Adriatic Croatia (7 counties/NUTS 3 regions) and Continental Croatia (14 counties/NUTS 3 regions).
The analyzed time period was from 2008 to 2012. Although data are available for further back in the past, January 1, 2008, marks the date when Croatia moved to NKD2007 (NACE Rev.2) national classification of activities and consequently many firms changed their sector codes. Tracking them back in time would take too much time and resources, and the marginal benefit they would bring to the analysis is simply lower than the extra costs included. Data was obtained for the years 2008, 2010 and 2012 with the exception of the variable “Sales revenue” which is obtained for every year in the period 2007-2012.
1 FINancial Agency [Hrv. FINancijska Agencija] 2 Law of Accounting 109/97 [Hrv. Zakon o računovodstvu 109/97] 3 Although about 99% of enterprises in Croatia are small enterprises (less than 50 employees), they are responsible for about 40% of value added. 4 National Classification of Activities [Hrv. Nacionalna Klasifikacija Djelatnosti] 5 Regulation (EC) No. 1059/2003 of 26 May 2003
3
Firms included in the analysis are both publicly and privately owned. The sample consists only of trade associations as defined by the Croatian Law of Trade Associations.6 The distributions of firms in the sample with respect to counties and activity sectors are presented in Table A1 and Table A2 of Appendix A. All the tables and figures in this paper, unless stated otherwise, come from FINA data and our own calculations.
Before starting the analysis, the outliers were removed. First, observations for which values of employment, stock of fixed assets, material costs or value added (at factor cost)7 are missing or equal to or less than zero are dropped from the panel. Second, observations with tangible fixed assets to employee ratio and value added to employee ratio greater (smaller) than 95th (5th) percentile in corresponding 2 digit sector and year are also dropped from the panel. After this process we are left with 1,419 firms (381 small, 594 medium and 444 large).8
Taking into account that we track firm data in 2008, 2010 and 2012, we can have between one and three observations per firm (depending on whether the firm is a start-up, active during the entire period, or has left the market). That said, among the final sample of 1,419 firms, for 1,041 firms we have observations for all three years, for 193 we have observations for two years, and for 185 of the firms there is only one observation (i.e. for only one year). That being said, for some firms we were not able to identify whether they were active in those years for which we did not have the FINA data. Fortunately, FINA data included the personal identification number of each firm, and using that and the website Biznet.hr,9 we were able to identify if a firm was active in the missing year.10
All monetary values are expressed in Croatian kunas (HRK). Nominal values are deflated with country or sector deflator to express values in 2005 HRK. Value added (at factor cost) and turnovers were deflated using sector deflators (“Price deflator gross value added by main branch”) built on AMECO data set.11 Sectors used in AMECO data set are: agriculture, forestry and fishing; industry excluding building and construction; building and construction; and services. Stock of capital, material costs, export and import values were deflated by “Price deflator gross domestic product at market prices,”12 also built on the AMECO data set. Both “Price deflator gross value added by main branch” and “Price deflator gross domestic product at market prices” were calculated using the formula:
𝑑𝑒𝑓𝑙𝑎𝑡𝑜𝑟 = �𝐺𝑉𝐴(𝐺𝐷𝑃)𝑐𝑢𝑟𝑟𝑒𝑛𝑡
𝐺𝑉𝐴(𝐺𝐷𝑃)𝑐𝑜𝑛𝑠𝑡𝑎𝑛𝑡,2005�× 100
Firms are further classified according to four main categories: size, ownership, macro sectors and international exposure.
Size classes are based on the (average) number of (full) time employees per year. Four size groups are defined: “1-9” (micro), “10-49” (small), “50-249” (medium) and “>=250” (large). Ownership category is built from FINA data that differentiates between 8 types of ownership which were coded by using the variable ownership, as described in Table 1(a). Macro sectors category is defined according to NACE Rev.2 code 2 digit level, as presented in Table 1(b). Service and Manufacturing sector groups can be then further divided into sub
6 Law of trade associations, article 2 [Hrv. Zakon o trgovačkim društvima, članak 2] 7 Calculated using formula from pg. 19 of the Regulation (EC) No. 250/2009 of 11 March 2009 8 Again, as defined by Croatian Law of Accounting 109/97 [Hrv. Zakon o računovodstvu 109/97] 9 Biznet.hr was developed by Croatian Chamber of Commerce and is available at http://www1.biznet.hr/HgkWeb/do/extlogon. 10 A cut-off date was January 25th 2014 11 AMECO database is available at: http://ec.europa.eu/economy_finance/db_indicators/ameco/zipped_en.htm 12 Value added is also deflated by this deflator in order to compute Unit labour cost
4

groups, based on Eurostat definition as shown in Tables 1(c) and 1(d). Finally, export status is based on information on revenues from exports and was defined in the following way: if the revenue from export was greater than zero in a given year, the firm was classified as exporter for that year, otherwise it was classified as non-exporter. Similarly the firms that report expense of importing in a given year are classified as importers, and as non-importers otherwise. This classification extends to further division of firms into four groups according to international exposure: exporters only, importers only, exporter and importer, neither exporter nor importer.
Table 1. Analytical categories (a) Ownership (b) Macro sectors
Ownership FINA types of ownership
State Public, communal…
Conversion process in progress
Conversion has not started
Private Private since incorporation
Private since conversion
Other
Cooperative Mixed with more than 50% private capital Mixed with more than 50% public capital
Macro sector NACE Rev.2 code - 2 digit level
Agriculture, forestry and fishery products
1 - 3
Mining and quarrying 5 - 9
Manufacturing 10 - 33
Electricity, water supply 35 - 39
Construction 41 - 43
Services 45 - 99
(c) Within – service sector groups (Eurostat) (d) Within – manufacturing sector groups
(Eurostat)
Service group Service group1
NACE Rev.2 code - 2 digit level
Knowledge-intensive services (KIS)
Knowledge-intensive market
50 - 51, 69 - 71, 73 - 74, 78, 80
High-tech knowledge-intensive
59 - 63, 72
Knowledge-intensive financial
64 - 66
Other knowledge-intensive
58, 75, 84 - 93
Less knowledge-intensive services (LKIS)
Less knowledge-intensive market
45 - 47, 49, 52, 55 - 56, 68, 77, 79, 81 - 82, 95
Other less knowledge-intensive
53, 94, 96 - 99
Manufacturing NACE Rev.2 code - 2 digit level
High-technology 21, 26 Medium-high technology
20, 27 - 30
Medium-low technology
19, 22 - 25, 33
Low-technology 10 - 18, 31 - 32
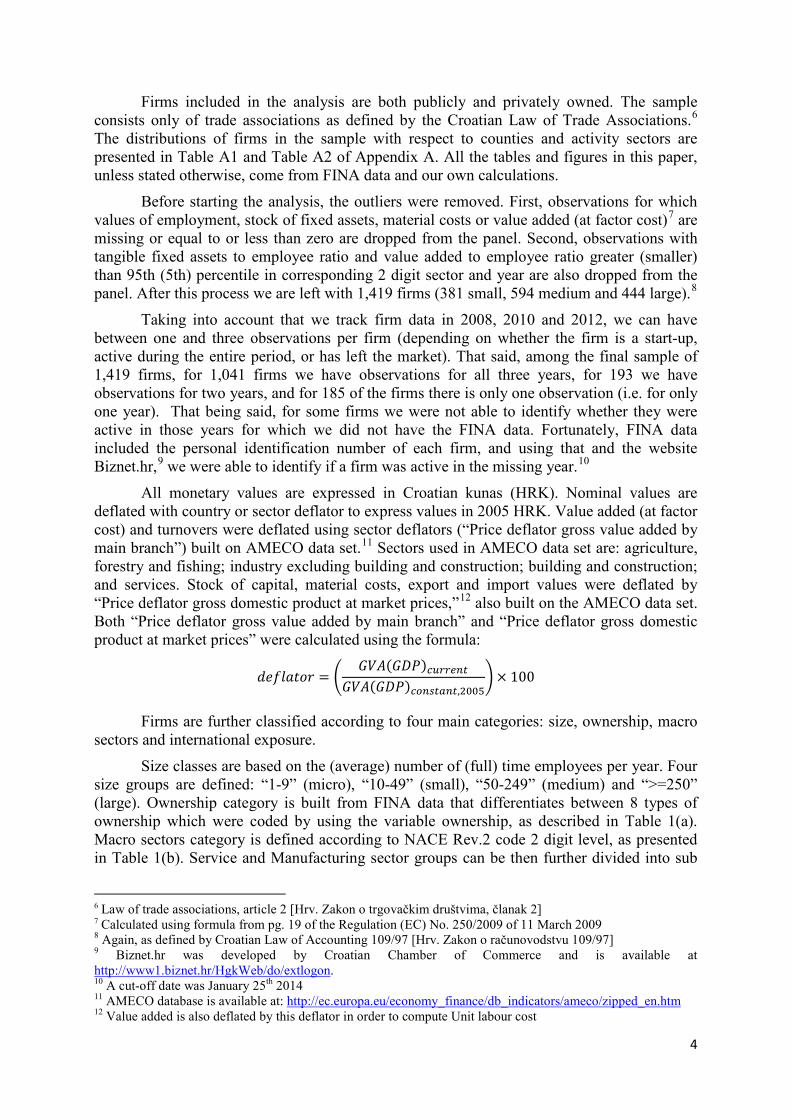
Table 2(a) shows the final number of observations (not the number of firms) by region and by year used in the analysis. Table 2(b) shows the number of observations per ownership structure, Table 2(c) per macro sector, and Table 2(d) does the same across sizes. In order to obtain a more detailed picture, from now on we divide small enterprises into those that have less than 10 employees (so called micro enterprises), and those with 10 to 49 employees (from now referred to as small enterprises).
5
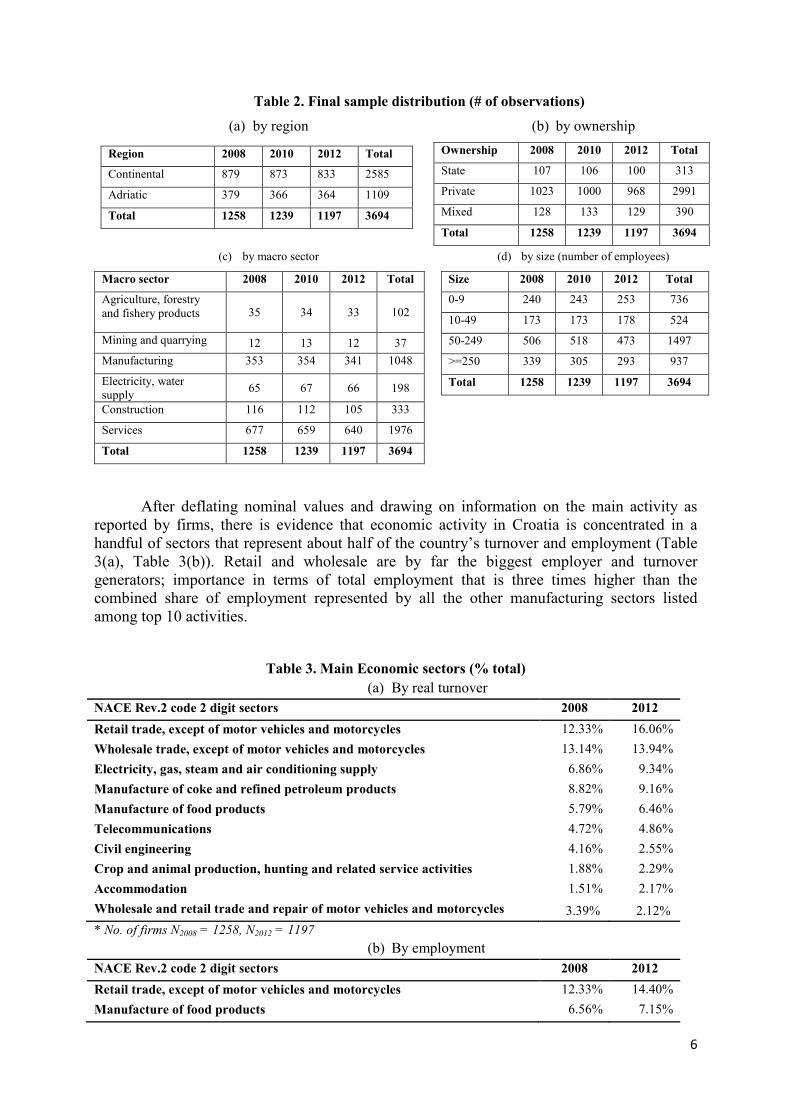
Table 2. Final sample distribution (# of observations)
(a) by region (b) by ownership
Region 2008 2010 2012 Total
Continental 879 873 833 2585
Adriatic 379 366 364 1109
Total 1258 1239 1197 3694
Ownership 2008 2010 2012 Total
State 107 106 100 313
Private 1023 1000 968 2991
Mixed 128 133 129 390
Total 1258 1239 1197 3694
(c) by macro sector (d) by size (number of employees)
Macro sector 2008 2010 2012 Total
Agriculture, forestry and fishery products 35 34 33 102
Mining and quarrying 12 13 12 37 Manufacturing 353 354 341 1048
Electricity, water supply 65 67 66 198
Construction 116 112 105 333
Services 677 659 640 1976
Total 1258 1239 1197 3694
Size 2008 2010 2012 Total
0-9 240 243 253 736
10-49 173 173 178 524
50-249 506 518 473 1497
>=250 339 305 293 937
Total 1258 1239 1197 3694
After deflating nominal values and drawing on information on the main activity as reported by firms, there is evidence that economic activity in Croatia is concentrated in a handful of sectors that represent about half of the country’s turnover and employment (Table 3(a), Table 3(b)). Retail and wholesale are by far the biggest employer and turnover generators; importance in terms of total employment that is three times higher than the combined share of employment represented by all the other manufacturing sectors listed among top 10 activities.
Table 3. Main Economic sectors (% total)
(a) By real turnover NACE Rev.2 code 2 digit sectors 2008 2012 Retail trade, except of motor vehicles and motorcycles 12.33% 16.06% Wholesale trade, except of motor vehicles and motorcycles 13.14% 13.94% Electricity, gas, steam and air conditioning supply 6.86% 9.34% Manufacture of coke and refined petroleum products 8.82% 9.16% Manufacture of food products 5.79% 6.46% Telecommunications 4.72% 4.86% Civil engineering 4.16% 2.55% Crop and animal production, hunting and related service activities 1.88% 2.29% Accommodation 1.51% 2.17% Wholesale and retail trade and repair of motor vehicles and motorcycles 3.39% 2.12% * No. of firms N2008 = 1258, N2012 = 1197
(b) By employment NACE Rev.2 code 2 digit sectors 2008 2012 Retail trade, except of motor vehicles and motorcycles 12.33% 14.40% Manufacture of food products 6.56% 7.15%
6
Wholesale trade, except of motor vehicles and motorcycles 5.51% 5.91% Electricity, gas, steam and air conditioning supply 3.92% 4.39% Accommodation 3.99% 4.18% Warehousing and support activities for transportation 4.45% 3.92% Real estate activities 3.51% 3.65% Land transport and transport via pipelines 2.50% 3.29% Civil engineering 4.57% 3.20% Postal and courier activities 3.02% 3.13% * No. of firms N2008 = 1258, N2012 = 1197
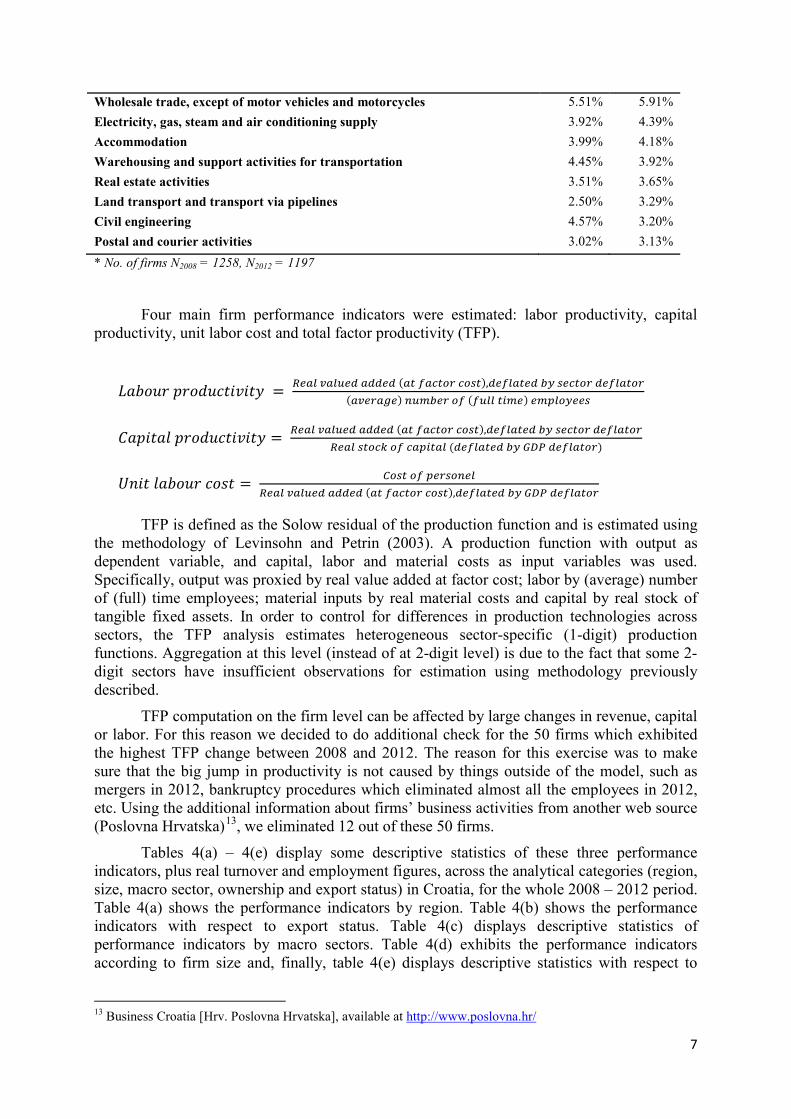
Four main firm performance indicators were estimated: labor productivity, capital productivity, unit labor cost and total factor productivity (TFP).
𝐿𝑎𝑏𝑜𝑢𝑟 𝑝𝑟𝑜𝑑𝑢𝑐𝑡𝑖𝑣𝑖𝑡𝑦 = 𝑅𝑒𝑎𝑙 𝑣𝑎𝑙𝑢𝑒𝑑 𝑎𝑑𝑑𝑒𝑑 (𝑎𝑡 𝑓𝑎𝑐𝑡𝑜𝑟 𝑐𝑜𝑠𝑡),𝑑𝑒𝑓𝑙𝑎𝑡𝑒𝑑 𝑏𝑦 𝑠𝑒𝑐𝑡𝑜𝑟 𝑑𝑒𝑓𝑙𝑎𝑡𝑜𝑟(𝑎𝑣𝑒𝑟𝑎𝑔𝑒) 𝑛𝑢𝑚𝑏𝑒𝑟 𝑜𝑓 (𝑓𝑢𝑙𝑙 𝑡𝑖𝑚𝑒) 𝑒𝑚𝑝𝑙𝑜𝑦𝑒𝑒𝑠
𝐶𝑎𝑝𝑖𝑡𝑎𝑙 𝑝𝑟𝑜𝑑𝑢𝑐𝑡𝑖𝑣𝑖𝑡𝑦 = 𝑅𝑒𝑎𝑙 𝑣𝑎𝑙𝑢𝑒𝑑 𝑎𝑑𝑑𝑒𝑑 (𝑎𝑡 𝑓𝑎𝑐𝑡𝑜𝑟 𝑐𝑜𝑠𝑡),𝑑𝑒𝑓𝑙𝑎𝑡𝑒𝑑 𝑏𝑦 𝑠𝑒𝑐𝑡𝑜𝑟 𝑑𝑒𝑓𝑙𝑎𝑡𝑜𝑟𝑅𝑒𝑎𝑙 𝑠𝑡𝑜𝑐𝑘 𝑜𝑓 𝑐𝑎𝑝𝑖𝑡𝑎𝑙 (𝑑𝑒𝑓𝑙𝑎𝑡𝑒𝑑 𝑏𝑦 𝐺𝐷𝑃 𝑑𝑒𝑓𝑙𝑎𝑡𝑜𝑟)
𝑈𝑛𝑖𝑡 𝑙𝑎𝑏𝑜𝑢𝑟 𝑐𝑜𝑠𝑡 = 𝐶𝑜𝑠𝑡 𝑜𝑓 𝑝𝑒𝑟𝑠𝑜𝑛𝑒𝑙𝑅𝑒𝑎𝑙 𝑣𝑎𝑙𝑢𝑒𝑑 𝑎𝑑𝑑𝑒𝑑 (𝑎𝑡 𝑓𝑎𝑐𝑡𝑜𝑟 𝑐𝑜𝑠𝑡),𝑑𝑒𝑓𝑙𝑎𝑡𝑒𝑑 𝑏𝑦 𝐺𝐷𝑃 𝑑𝑒𝑓𝑙𝑎𝑡𝑜𝑟
TFP is defined as the Solow residual of the production function and is estimated using the methodology of Levinsohn and Petrin (2003). A production function with output as dependent variable, and capital, labor and material costs as input variables was used. Specifically, output was proxied by real value added at factor cost; labor by (average) number of (full) time employees; material inputs by real material costs and capital by real stock of tangible fixed assets. In order to control for differences in production technologies across sectors, the TFP analysis estimates heterogeneous sector-specific (1-digit) production functions. Aggregation at this level (instead of at 2-digit level) is due to the fact that some 2-digit sectors have insufficient observations for estimation using methodology previously described.
TFP computation on the firm level can be affected by large changes in revenue, capital or labor. For this reason we decided to do additional check for the 50 firms which exhibited the highest TFP change between 2008 and 2012. The reason for this exercise was to make sure that the big jump in productivity is not caused by things outside of the model, such as mergers in 2012, bankruptcy procedures which eliminated almost all the employees in 2012, etc. Using the additional information about firms’ business activities from another web source (Poslovna Hrvatska)13, we eliminated 12 out of these 50 firms.
Tables 4(a) – 4(e) display some descriptive statistics of these three performance indicators, plus real turnover and employment figures, across the analytical categories (region, size, macro sector, ownership and export status) in Croatia, for the whole 2008 – 2012 period. Table 4(a) shows the performance indicators by region. Table 4(b) shows the performance indicators with respect to export status. Table 4(c) displays descriptive statistics of performance indicators by macro sectors. Table 4(d) exhibits the performance indicators according to firm size and, finally, table 4(e) displays descriptive statistics with respect to
13 Business Croatia [Hrv. Poslovna Hrvatska], available at http://www.poslovna.hr/
7

ownership of the firm. Table A3 of Appendix A presents these descriptive statistics when state owned enterprises (SOEs) are excluded.
8

Table 4. Descriptive statistics of performance indicators
(a) By region
* No. of firms, N=1400
(b) By export status
* No. of firms, N=1400
(c) By macro sector
* No. of firms, N=1400
Mean Median Std Dev Mean Median Std Dev Mean Median Std Dev Mean Median Std Dev Mean Median Std DevContinental 238,004.90 57,585.91 944,132.40 323.95 95.00 979.16 1,592.25 371.80 16,092.64 96.49 2.72 2,092.60 0.73 0.26 19.02Adriatic 102,857.20 34,456.37 231,264.30 195.29 78.00 348.49 594.51 277.88 1,342.41 22.02 1.47 225.23 1.11 0.33 22.41Total 197,902.00 48,626.34 804,040.90 285.77 89.00 844.78 1,296.19 338.94 13,522.13 74.39 2.32 1,759.39 0.84 0.28 20.08
ULC (in HRK per unit of value added)
Real Turnover (1.000 HRK) Number of employeesLabour Productivity (value
added per employee, in 1.000 HRK)
Capital Productivity (value added per unit of
capital)
Mean Median Std Dev Mean Median Std Dev Mean Median Std Dev Mean Median Std Dev Mean Median Std DevNon exporters 84,609.92 14,761.21 267,208.30 161.14 44.00 565.16 640.45 266.85 2,107.95 33.75 2.98 341.71 1.02 0.30 24.13Exporters 285,742.10 81,320.69 1,036,794.00 382.41 148.00 999.12 1,804.60 411.30 17,906.70 105.91 1.88 2,324.61 0.70 0.27 16.26Total 197,902.00 48,626.34 804,040.90 285.77 89.00 844.78 1,296.19 338.94 13,522.13 74.39 2.32 1,759.39 0.84 0.28 20.08
Real Turnover (1.000 HRK) Number of employeesLabour Productivity (value
added per employee, in 1.000 HRK)
Capital Productivity (value added per unit of
capital)ULC (in HRK per unit of
value added)
Mean Median Std Dev Mean Median Std Dev Mean Median Std Dev Mean Median Std Dev Mean Median Std DevAgriculture, forestry and fishery 188,398.00 52,999.97 337,893.80 527.12 135.50 1,475.86 448.02 240.73 547.48 2.72 0.76 6.03 0.48 0.28 1.09Mining and quarrying 258,865.70 67,458.05 391,263.40 343.55 70.00 615.16 31,022.41 432.35 120,960.80 2.01 1.67 1.79 0.25 0.25 0.17Manufacturing 235,072.90 62,352.39 1,160,132.00 324.00 153.00 662.03 478.05 240.79 2,289.00 13.07 1.26 199.43 0.47 0.36 0.92Electricity, water supply 329,100.70 32,354.83 1,291,342.00 325.30 100.50 1,136.76 4,683.59 224.78 27,973.73 803.75 0.31 7,438.44 0.40 0.43 0.19Construction 137,657.20 46,074.20 252,260.60 221.86 112.00 327.25 557.91 301.83 859.30 11.22 2.81 78.13 0.33 0.25 0.25Services 174,602.00 43,685.49 552,565.40 258.77 58.00 911.28 1,051.97 493.53 1,665.84 48.49 4.63 334.82 1.20 0.19 27.47Total 197,902.00 48,626.34 804,040.90 285.77 89.00 844.78 1,296.19 338.94 13,522.13 74.39 2.32 1,759.39 0.84 0.28 20.08
Real Turnover (1.000 HRK) Number of employeesLabour Productivity (value
added per employee, in 1.000 HRK)
Capital Productivity (value added per unit of capital)
ULC (in HRK per unit of value added)
1
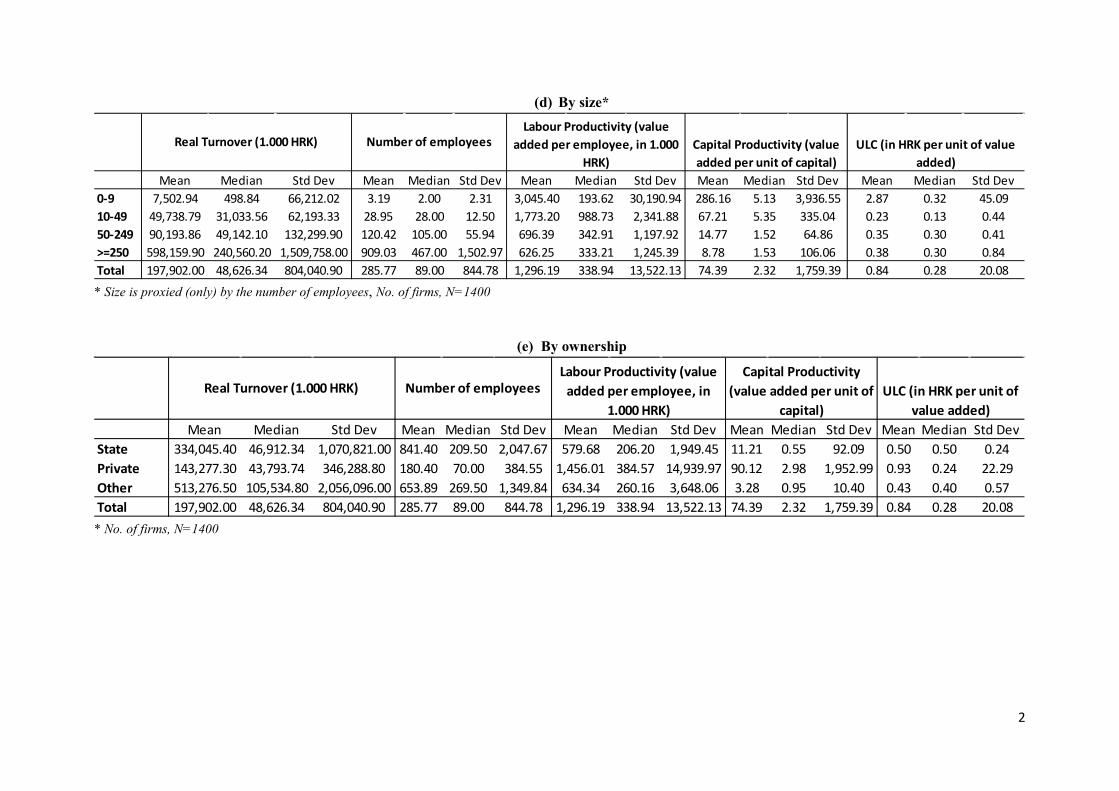
(d) By size*
* Size is proxied (only) by the number of employees, No. of firms, N=1400
(e) By ownership
* No. of firms, N=1400
Mean Median Std Dev Mean Median Std Dev Mean Median Std Dev Mean Median Std Dev Mean Median Std Dev0-9 7,502.94 498.84 66,212.02 3.19 2.00 2.31 3,045.40 193.62 30,190.94 286.16 5.13 3,936.55 2.87 0.32 45.0910-49 49,738.79 31,033.56 62,193.33 28.95 28.00 12.50 1,773.20 988.73 2,341.88 67.21 5.35 335.04 0.23 0.13 0.4450-249 90,193.86 49,142.10 132,299.90 120.42 105.00 55.94 696.39 342.91 1,197.92 14.77 1.52 64.86 0.35 0.30 0.41>=250 598,159.90 240,560.20 1,509,758.00 909.03 467.00 1,502.97 626.25 333.21 1,245.39 8.78 1.53 106.06 0.38 0.30 0.84Total 197,902.00 48,626.34 804,040.90 285.77 89.00 844.78 1,296.19 338.94 13,522.13 74.39 2.32 1,759.39 0.84 0.28 20.08
Real Turnover (1.000 HRK) Number of employeesLabour Productivity (value
added per employee, in 1.000 HRK)
Capital Productivity (value added per unit of capital)
ULC (in HRK per unit of value added)
Mean Median Std Dev Mean Median Std Dev Mean Median Std Dev Mean Median Std Dev Mean Median Std DevState 334,045.40 46,912.34 1,070,821.00 841.40 209.50 2,047.67 579.68 206.20 1,949.45 11.21 0.55 92.09 0.50 0.50 0.24Private 143,277.30 43,793.74 346,288.80 180.40 70.00 384.55 1,456.01 384.57 14,939.97 90.12 2.98 1,952.99 0.93 0.24 22.29Other 513,276.50 105,534.80 2,056,096.00 653.89 269.50 1,349.84 634.34 260.16 3,648.06 3.28 0.95 10.40 0.43 0.40 0.57Total 197,902.00 48,626.34 804,040.90 285.77 89.00 844.78 1,296.19 338.94 13,522.13 74.39 2.32 1,759.39 0.84 0.28 20.08
Real Turnover (1.000 HRK) Number of employeesLabour Productivity (value
added per employee, in 1.000 HRK)
Capital Productivity (value added per unit of
capital)ULC (in HRK per unit of
value added)
2
3. Exploring firm heterogeneity: Are there regional/export status, size, or trade related disparities?
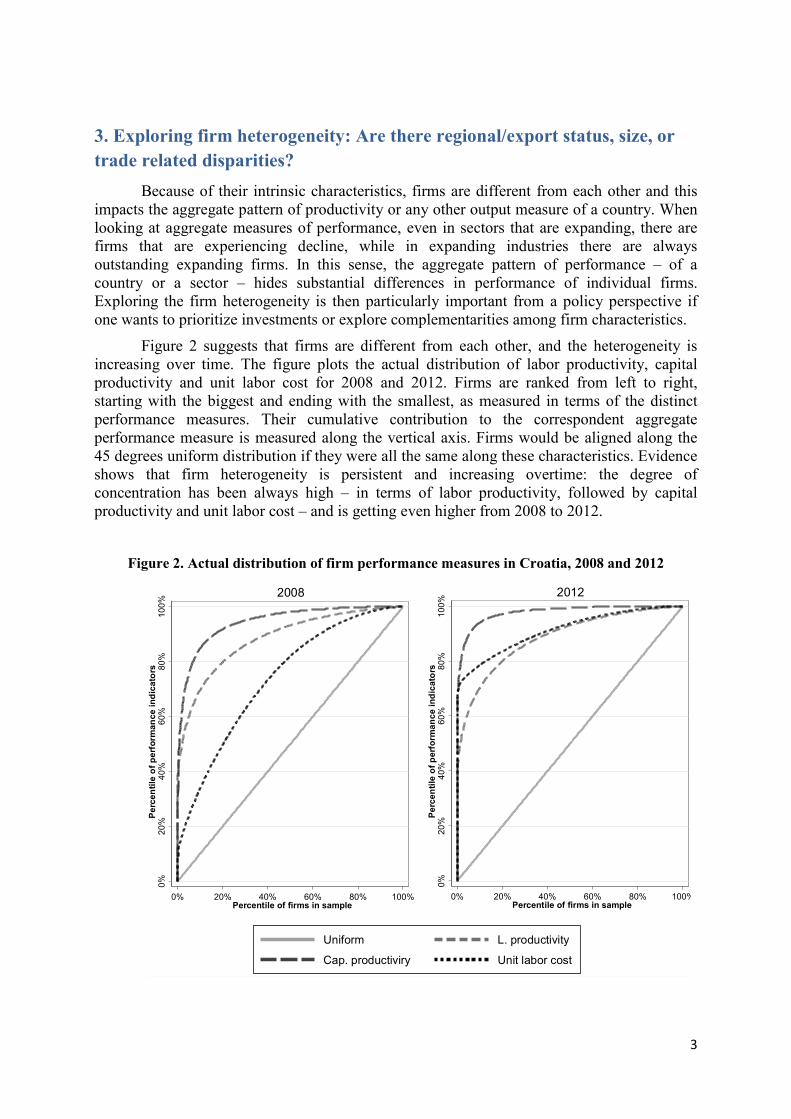
Because of their intrinsic characteristics, firms are different from each other and this impacts the aggregate pattern of productivity or any other output measure of a country. When looking at aggregate measures of performance, even in sectors that are expanding, there are firms that are experiencing decline, while in expanding industries there are always outstanding expanding firms. In this sense, the aggregate pattern of performance – of a country or a sector – hides substantial differences in performance of individual firms. Exploring the firm heterogeneity is then particularly important from a policy perspective if one wants to prioritize investments or explore complementarities among firm characteristics.
Figure 2 suggests that firms are different from each other, and the heterogeneity is increasing over time. The figure plots the actual distribution of labor productivity, capital productivity and unit labor cost for 2008 and 2012. Firms are ranked from left to right, starting with the biggest and ending with the smallest, as measured in terms of the distinct performance measures. Their cumulative contribution to the correspondent aggregate performance measure is measured along the vertical axis. Firms would be aligned along the 45 degrees uniform distribution if they were all the same along these characteristics. Evidence shows that firm heterogeneity is persistent and increasing overtime: the degree of concentration has been always high – in terms of labor productivity, followed by capital productivity and unit labor cost – and is getting even higher from 2008 to 2012.
Figure 2. Actual distribution of firm performance measures in Croatia, 2008 and 2012
0%20
%40
%60
%80
%10
0% P
erce
ntile
of p
erfo
rman
ce in
dica
tors
0% 20% 40% 60% 80% 100% Percentile of firms in sample
2008
0%20
%40
%60
%80
%10
0% P
erce
ntile
of p
erfo
rman
ce in
dica
tors
0% 20% 40% 60% 80% 100% Percentile of firms in sample
2012
Uniform L. productivity
Cap. productiviry Unit labor cost
3
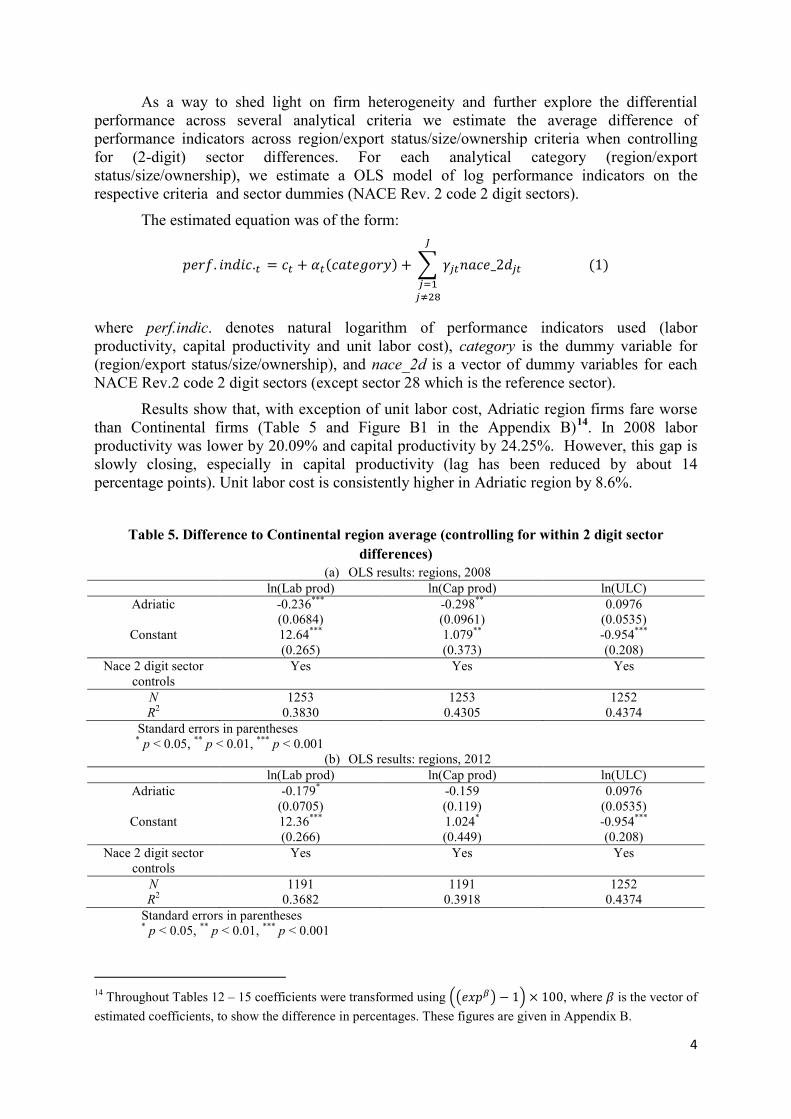
As a way to shed light on firm heterogeneity and further explore the differential performance across several analytical criteria we estimate the average difference of performance indicators across region/export status/size/ownership criteria when controlling for (2-digit) sector differences. For each analytical category (region/export status/size/ownership), we estimate a OLS model of log performance indicators on the respective criteria and sector dummies (NACE Rev. 2 code 2 digit sectors).
The estimated equation was of the form:
𝑝𝑒𝑟𝑓. 𝑖𝑛𝑑𝑖𝑐.𝑡 = 𝑐𝑡 + 𝛼𝑡(𝑐𝑎𝑡𝑒𝑔𝑜𝑟𝑦) + � 𝛾𝑗𝑡𝑛𝑎𝑐𝑒_2𝑑𝑗𝑡
𝐽
𝑗=1𝑗≠28
(1)
where perf.indic. denotes natural logarithm of performance indicators used (labor productivity, capital productivity and unit labor cost), category is the dummy variable for (region/export status/size/ownership), and nace_2d is a vector of dummy variables for each NACE Rev.2 code 2 digit sectors (except sector 28 which is the reference sector).
Results show that, with exception of unit labor cost, Adriatic region firms fare worse than Continental firms (Table 5 and Figure B1 in the Appendix B)14. In 2008 labor productivity was lower by 20.09% and capital productivity by 24.25%. However, this gap is slowly closing, especially in capital productivity (lag has been reduced by about 14 percentage points). Unit labor cost is consistently higher in Adriatic region by 8.6%.
Table 5. Difference to Continental region average (controlling for within 2 digit sector
differences) (a) OLS results: regions, 2008
ln(Lab prod) ln(Cap prod) ln(ULC) Adriatic -0.236*** -0.298** 0.0976
(0.0684) (0.0961) (0.0535) Constant 12.64*** 1.079** -0.954***
(0.265) (0.373) (0.208) Nace 2 digit sector
controls Yes Yes Yes
N 1253 1253 1252 R2 0.3830 0.4305 0.4374
Standard errors in parentheses * p < 0.05, ** p < 0.01, *** p < 0.001
(b) OLS results: regions, 2012 ln(Lab prod) ln(Cap prod) ln(ULC)
Adriatic -0.179* -0.159 0.0976 (0.0705) (0.119) (0.0535)
Constant 12.36*** 1.024* -0.954*** (0.266) (0.449) (0.208)
Nace 2 digit sector controls
Yes Yes Yes
N 1191 1191 1252 R2 0.3682 0.3918 0.4374
Standard errors in parentheses * p < 0.05, ** p < 0.01, *** p < 0.001
14 Throughout Tables 12 – 15 coefficients were transformed using ��𝑒𝑥𝑝𝛽� − 1� × 100, where 𝛽 is the vector of estimated coefficients, to show the difference in percentages. These figures are given in Appendix B.
4

Table 6 and Figure B2 in the Appendix B show benchmarking according to trade integration status. The results show that trade integrated firms (i.e. those firms that are both exporters and importers) have better performance in all three indicators. Also, firms that are either exposed to international competition by exporting products, or connected to global markets through direct imports (most likely of intermediate inputs) perform better than the firms that operate solely on domestic market. Being “neither an importer nor an exporter” firm is then the worst “combination”. In 2012, labor productivity of those firms was 51.76% lower when compared to trade integrated firms, their capital productivity was by 27.42% lower and their unit labor cost was by 27.72% higher compared to trade integrated firms. Table 6. Difference to “Exporters and Importers” average (controlling for within 2 digit sector
differences) (a) OLS results: international exposure, 2008
ln(Lab prod) ln(Cap prod) ln(ULC) Importer only -0.315*** -0.125 0.100
(0.0904) (0.132) (0.0727) Exporter only -0.366*** -0.0940 0.203*
(0.0990) (0.145) (0.0796) Neither Importer nor
Exporter -0.777*** -0.110 0.306***
(0.0764) (0.112) (0.0615) Constant 12.69*** 0.998** -0.970***
(0.255) (0.374) (0.205) Nace 2 digit sector
controls Yes Yes Yes
N 1253 1253 1252 R2 0.4278 0.4266 0.4484
Standard errors in parentheses * p < 0.05, ** p < 0.01, *** p < 0.001
(b) OLS results: international exposure, 2012 ln(Lab prod) ln(Cap prod) ln(ULC)
Importer only -0.359*** -0.368* 0.102 (0.100) (0.175) (0.0852)
Exporter only -0.129 -0.354* 0.000593 (0.0945) (0.165) (0.0805)
Neither Importer nor Exporter
-0.716*** -0.360** 0.241***
(0.0766) (0.134) (0.0652) Constant 12.38*** 1.044* -0.737***
(0.256) (0.446) (0.218) Nace 2 digit sector
controls Yes Yes Yes
N 1191 1191 1191 R2 0.4130 0.3962 0.3762
Standard errors in parentheses * p < 0.05, ** p < 0.01, *** p < 0.001
Small firms (from 10 to 49 employees) seem to perform better than large companies
along all indicators (Table 7 and Figure B3 in the Appendix B). They have higher labor productivity (42.15% higher than large firms in 2012), higher capital productivity (51.47% higher than large firms in 2012), and lower unit labor cost (by 23.16% lower than large firms
5

in 2012). Micro enterprises (0 to 9 employees) seem to perform better in capital productivity and unit labor cost, but fare worse in labor productivity.
6

Table 7. Difference to large firm’s (>=250) average (controlling for within 2 digit sector
differences) (a) OLS results: size, 2008
ln(Lab prod) ln(Cap prod) ln(ULC) 0-9 -0.756*** 0.585*** 0.150*
(0.0934) (0.139) (0.0757) 10-49 0.525*** 0.734*** -0.511***
(0.0958) (0.142) (0.0776) 50-249 0.0536 0.114 -0.0347
(0.0687) (0.102) (0.0556) Constant 12.41*** 0.759* -0.792***
(0.252) (0.374) (0.204) Nace 2 digit sector
controls Yes Yes Yes
N 1253 1253 1252 R2 0.4583 0.4433 0.4700
Standard errors in parentheses * p < 0.05, ** p < 0.01, *** p < 0.001
(b) OLS results: size, 2012 ln(Lab prod) ln(Cap prod) ln(ULC)
0-9 -0.583*** 0.447** 0.0798 (0.0976) (0.170) (0.0827)
10-49 0.349*** 0.384* -0.268** (0.0992) (0.172) (0.0841)
50-249 -0.0248 0.0124 0.0251 (0.0749) (0.130) (0.0634)
Constant 12.30*** 0.874 -0.693** (0.261) (0.453) (0.221)
Nace 2 digit sector controls
Yes Yes Yes
N 1191 1191 1191 R2 0.4100 0.3973 0.3784
Standard errors in parentheses * p < 0.05, ** p < 0.01, *** p < 0.001 As expected, SOEs have lower productivity (labor and capital) and higher unit labor
cost when compared to other firms (Table 8 and Figure B4 in the Appendix B). In 2012, labor and capital productivity of private firms was 69.4% and 125.69% higher than SOEs, respectively. This gap between private firms and SOEs is widening over observed time period.
Table 8. Difference to “SOEs” average (controlling for within 2 digit sector differences)
(a) OLS results: ownership, 2008 ln(Lab prod) ln(Cap prod) ln(ULC)
Private 0.341* 0.744*** -0.585*** (0.133) (0.185) (0.102)
Mixed 0.0910 0.250 -0.286* (0.157) (0.219) (0.121)
Constant 12.29*** 0.388 -0.440* (0.292) (0.407) (0.224)
Nace 2 digit sector controls
Yes Yes Yes
N 1253 1253 1252 R2 0.3826 0.4378 0.4554
Standard errors in parentheses
7
* p < 0.05, ** p < 0.01, *** p < 0.001
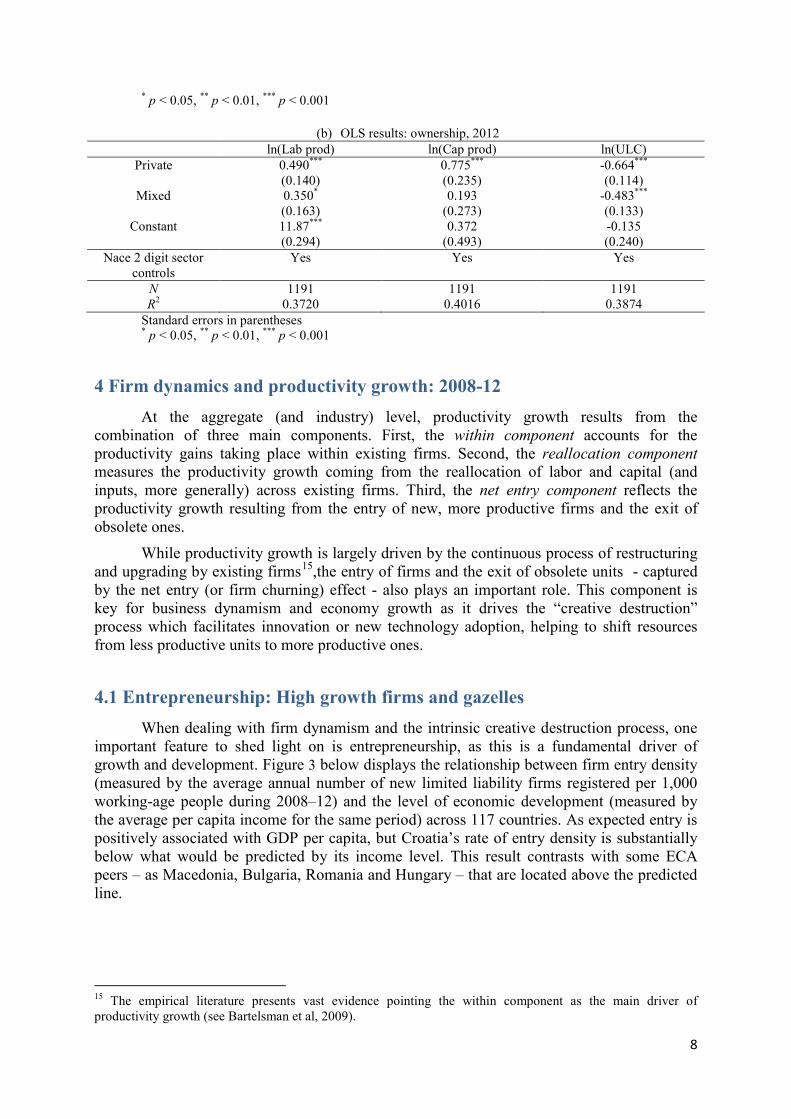
(b) OLS results: ownership, 2012 ln(Lab prod) ln(Cap prod) ln(ULC)
Private 0.490*** 0.775*** -0.664*** (0.140) (0.235) (0.114)
Mixed 0.350* 0.193 -0.483*** (0.163) (0.273) (0.133)
Constant 11.87*** 0.372 -0.135 (0.294) (0.493) (0.240)
Nace 2 digit sector controls
Yes Yes Yes
N 1191 1191 1191 R2 0.3720 0.4016 0.3874
Standard errors in parentheses * p < 0.05, ** p < 0.01, *** p < 0.001
4 Firm dynamics and productivity growth: 2008-12 At the aggregate (and industry) level, productivity growth results from the
combination of three main components. First, the within component accounts for the productivity gains taking place within existing firms. Second, the reallocation component measures the productivity growth coming from the reallocation of labor and capital (and inputs, more generally) across existing firms. Third, the net entry component reflects the productivity growth resulting from the entry of new, more productive firms and the exit of obsolete ones.
While productivity growth is largely driven by the continuous process of restructuring and upgrading by existing firms15,the entry of firms and the exit of obsolete units - captured by the net entry (or firm churning) effect - also plays an important role. This component is key for business dynamism and economy growth as it drives the “creative destruction” process which facilitates innovation or new technology adoption, helping to shift resources from less productive units to more productive ones.
4.1 Entrepreneurship: High growth firms and gazelles When dealing with firm dynamism and the intrinsic creative destruction process, one
important feature to shed light on is entrepreneurship, as this is a fundamental driver of growth and development. Figure 3 below displays the relationship between firm entry density (measured by the average annual number of new limited liability firms registered per 1,000 working-age people during 2008–12) and the level of economic development (measured by the average per capita income for the same period) across 117 countries. As expected entry is positively associated with GDP per capita, but Croatia’s rate of entry density is substantially below what would be predicted by its income level. This result contrasts with some ECA peers – as Macedonia, Bulgaria, Romania and Hungary – that are located above the predicted line.
15 The empirical literature presents vast evidence pointing the within component as the main driver of productivity growth (see Bartelsman et al, 2009).
8

Figure 3. Entry density and GDP per capita, 2008 – 2012
Source: authors elaboration based on on data from World Development Indicators and World Bank Group Entrepreneurship Snapshots (WBGES)
Also important is the entry of high growth enterprises and the subset of gazelles. Using the OECD definition, “High-growth enterprises” (HGE) are enterprises with average annualized growth in employees (or in turnover) greater than 20% a year, over a three-year period, and with ten or more employees at the beginning of the observation period”. The special case of a HGE is a so called gazelle; gazelles are the subset of HGE which are up to five years old.
These types of firms are of particular importance for two reasons. First, by their extraordinary growth these firms can make the largest contribution to net job creation, despite typically representing a small proportion of the business population. Recent studies have alerted policy makers to the importance of high-growth firms as job creators; see Henrekson and Johansson’s (2010) for a survey. Second, they are also recognized as an important source of innovation. Because their success often comes from innovation - such as product or process, or innovative approaches to marketing/distribution/organization, or from entering new markets – these types of firms (and in particular gazelles) outperform average industry growth in a Schumpeterian sense; they combine existing input factors in a new way and thus produce an innovation that enables them to outperform the market.
Against this backdrop, Figures 4 and 5 compare HGF and gazelles for Croatia and some selected countries. Results suggest that Croatia visibly lags behind them in terms of both HGF and gazelles. Some caveats need to be stressed however (our numbers were not drawn from the population figures).
Bosnia and Herzegovina
HungaryMacedonia, FYR
Montenegro
Romania
Serbia
Bulgaria
Czech RepublicSlovak Republic
Croatia
05
1015
2025
Ave
rage
ent
ry d
ensi
ty
6 7 8 9 10 11(ln) average GDP per capita (PPP)
9
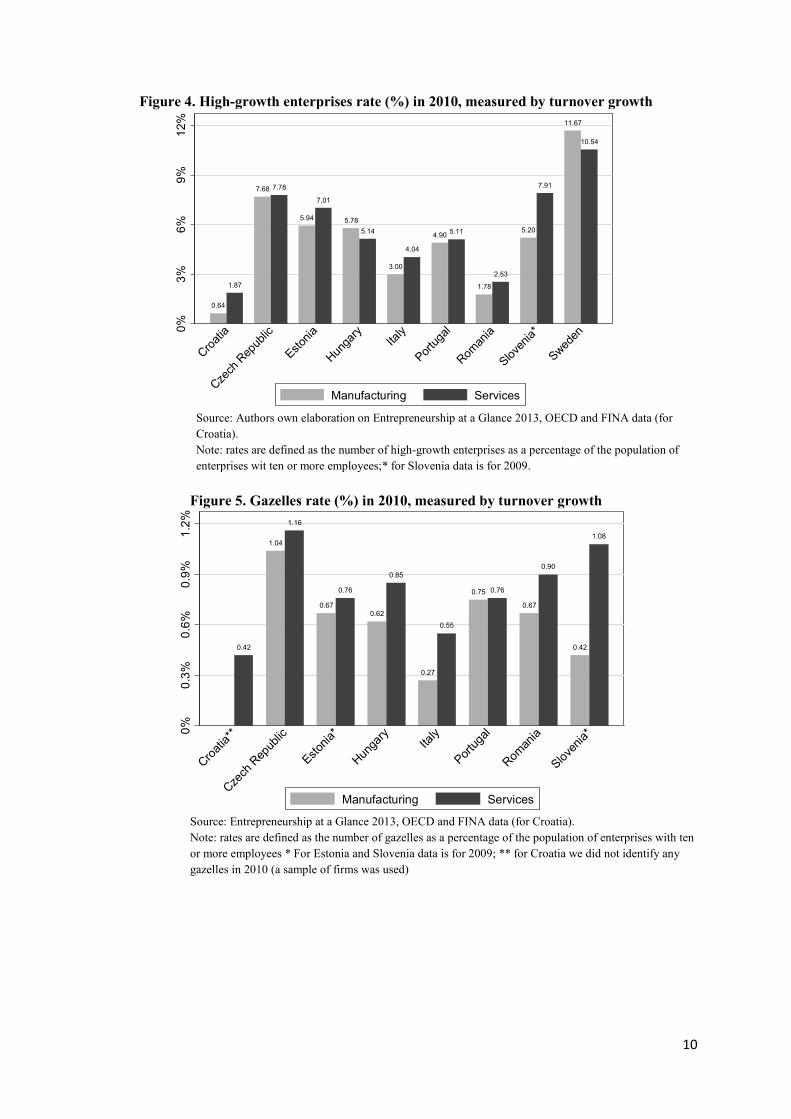
Figure 4. High-growth enterprises rate (%) in 2010, measured by turnover growth
Source: Authors own elaboration on Entrepreneurship at a Glance 2013, OECD and FINA data (for Croatia). Note: rates are defined as the number of high-growth enterprises as a percentage of the population of enterprises wit ten or more employees;* for Slovenia data is for 2009.
Figure 5. Gazelles rate (%) in 2010, measured by turnover growth
Source: Entrepreneurship at a Glance 2013, OECD and FINA data (for Croatia). Note: rates are defined as the number of gazelles as a percentage of the population of enterprises with ten or more employees * For Estonia and Slovenia data is for 2009; ** for Croatia we did not identify any gazelles in 2010 (a sample of firms was used)
0.64
1.87
7.68 7.78
5.94
7.01
5.785.14
3.00
4.04
4.90 5.11
1.78
2.53
5.20
7.91
11.67
10.54
0%3%
6%9%
12%
Croatia
Czech
Rep
ublic
Estonia
Hunga
ryIta
ly
Portug
al
Roman
ia
Sloven
ia*
Sweden
Manufacturing Services
0.42
1.04
1.16
0.67
0.76
0.62
0.85
0.27
0.55
0.75 0.76
0.67
0.90
0.42
1.08
0%0.
3%0.
6%0.
9%1.
2%
Croatia
**
Czech
Rep
ublic
Estonia
*
Hunga
ryIta
ly
Portug
al
Roman
ia
Sloven
ia*
Manufacturing Services
10

4.2 Entry, exit, survival and contributions to productivity growth While the previous section has pointed some evidence of a lack of dynamism in the
Croatian economy, this section aims at complementing the analysis by shedding light on the links between productivity growth (proxied by TFP growth) and firm dynamics.
In light of methodology used by Geishecker, Gorg and Taglioni (2009) we introduce a two-step approach. First we identify groups of entering, surviving and exit firms. Second, we calculate the contribution of each of those groups to aggregate domestic productivity change.
Based on our final sample from FINA data, as defined in Section 2, we identify four groups of firms: surviving firms (S), new “start-ups” (NSU), new “big-entries” (NBE) and exit firms (X). In this sense, surviving firms are those that were active in both years 2008-2012 while exit enterprises16 were active only in 200817. New “start-ups” are those firms with date of incorporation later than 2008 which were sampled only in 2012. Finally, new “big-entries” are firms which were incorporated prior to 2008, were active in both 2008 and 2012, and sometimes within that period they grew in size until they reached 50 or more employees.
Table 9 summarizes the entry and exit rates in Croatia in a 5 year period (2008 - 2012). Entry and exit rates for international peers are also presented for benchmarking purposes. Healthy market economies exhibit high rates of firm entry and exit, which indicates an intense process of creative destruction, whereby a significant number of business startup or close their operations (see Foster et al. (2001) and Bartelsman et al. (2009) for more evidence). Against this backdrop, evidence presented in Table 10 suggests that Croatia seems to be a less dynamic economy when compared to ECA peers.
In these comparator countries, between 9 and 18 percent of all firms are new to the market on average every year. In Croatia, this rate is only 5.5 percent when considering the real entry firms, i.e. the “start-ups” (the rate is 8 percent if we super estimate the entry process by including also the firms that have transitioned from micro/small to medium sized companies in the 2008-12 period). The lagging performance of Croatia is even more pronounced when it comes to exit process. While in Croatia 6.5 percent of total firms leave the market on average every year, exit rates in comparator countries vary from 7 to 26 percent on average. When looking at net entry rates (entry minus exit) two interesting results emerge. First, a common pattern across countries is that the net entry is far less important than the gross entry and exit of firms which means that changes in total number of active firms are generally small despite gross entry and exit. This confirms previous findings from the empirical literature (see Bartelsman et al., 2009, for instance) and suggests that the entry of new firms in the market is part of a process of search and of experimentation (rather than a response to sub or supra normal profits).18 The second emerging results is that while in some
16 Firm, however, might still exist without doing any business activities 17 In the data set there are 160 companies for which the financial data in 2012 is missing, which would classify them as “exiters“. However, to make sure this is not caused by incompleteness in the FINA data, we checked all these companies by hand using other sources of information like Poslovna Hrvatska and web pages of various business associations. Consequently 51 companies were discovered to have been still active in 2012, and therefore were moved from “exiters” to “survivors”.
18 See Audretsch (1995) for a theoretical explanation. In sum, if firm turnover (entry and exit)was driven by profit attained in the market this should have a sizeable effect on the total numbers of firms actives in the market. Contrariwise,
11
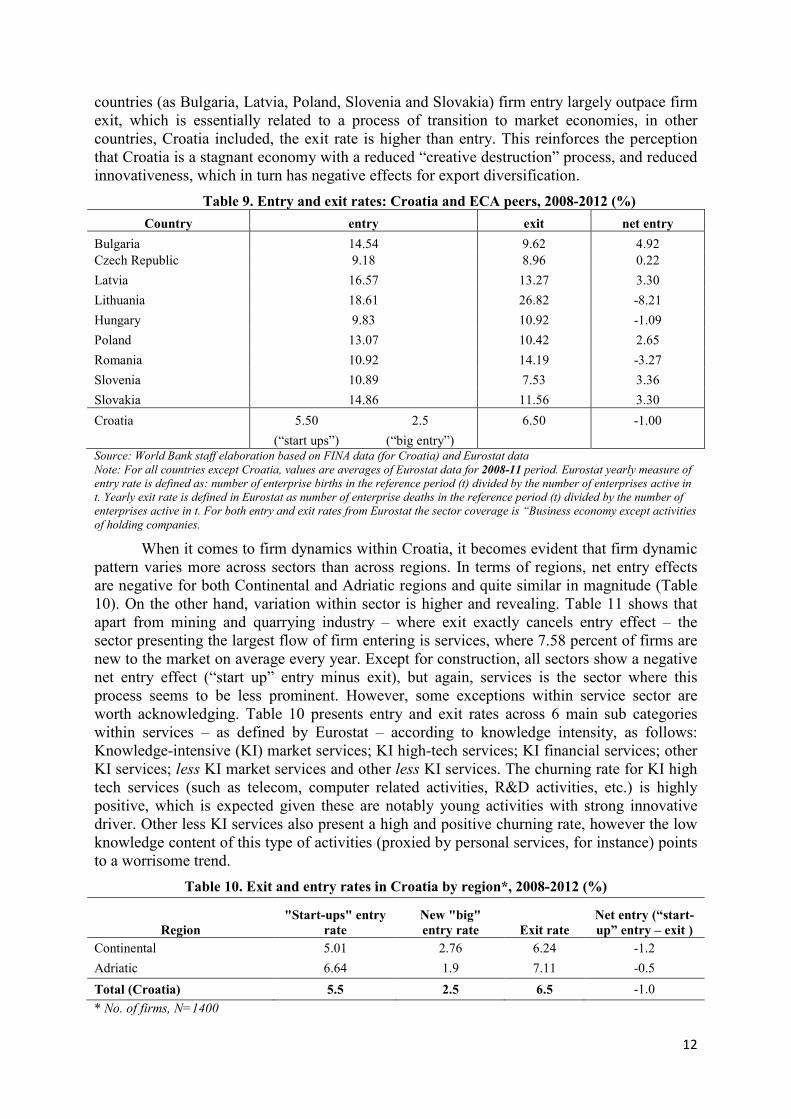
countries (as Bulgaria, Latvia, Poland, Slovenia and Slovakia) firm entry largely outpace firm exit, which is essentially related to a process of transition to market economies, in other countries, Croatia included, the exit rate is higher than entry. This reinforces the perception that Croatia is a stagnant economy with a reduced “creative destruction” process, and reduced innovativeness, which in turn has negative effects for export diversification.
Table 9. Entry and exit rates: Croatia and ECA peers, 2008-2012 (%) Country entry exit net entry
Bulgaria 14.54 9.62 4.92 Czech Republic 9.18 8.96 0.22 Latvia 16.57 13.27 3.30 Lithuania 18.61 26.82 -8.21 Hungary 9.83 10.92 -1.09 Poland 13.07 10.42 2.65 Romania 10.92 14.19 -3.27 Slovenia 10.89 7.53 3.36 Slovakia 14.86 11.56 3.30 Croatia 5.50 2.5 6.50 -1.00
(“start ups”) (“big entry”)
Source: World Bank staff elaboration based on FINA data (for Croatia) and Eurostat data Note: For all countries except Croatia, values are averages of Eurostat data for 2008-11 period. Eurostat yearly measure of entry rate is defined as: number of enterprise births in the reference period (t) divided by the number of enterprises active in t. Yearly exit rate is defined in Eurostat as number of enterprise deaths in the reference period (t) divided by the number of enterprises active in t. For both entry and exit rates from Eurostat the sector coverage is “Business economy except activities of holding companies.
When it comes to firm dynamics within Croatia, it becomes evident that firm dynamic pattern varies more across sectors than across regions. In terms of regions, net entry effects are negative for both Continental and Adriatic regions and quite similar in magnitude (Table 10). On the other hand, variation within sector is higher and revealing. Table 11 shows that apart from mining and quarrying industry – where exit exactly cancels entry effect – the sector presenting the largest flow of firm entering is services, where 7.58 percent of firms are new to the market on average every year. Except for construction, all sectors show a negative net entry effect (“start up” entry minus exit), but again, services is the sector where this process seems to be less prominent. However, some exceptions within service sector are worth acknowledging. Table 10 presents entry and exit rates across 6 main sub categories within services – as defined by Eurostat – according to knowledge intensity, as follows: Knowledge-intensive (KI) market services; KI high-tech services; KI financial services; other KI services; less KI market services and other less KI services. The churning rate for KI high tech services (such as telecom, computer related activities, R&D activities, etc.) is highly positive, which is expected given these are notably young activities with strong innovative driver. Other less KI services also present a high and positive churning rate, however the low knowledge content of this type of activities (proxied by personal services, for instance) points to a worrisome trend.
Table 10. Exit and entry rates in Croatia by region*, 2008-2012 (%)
Region "Start-ups" entry
rate New "big" entry rate Exit rate
Net entry (“start-up” entry – exit )
Continental 5.01 2.76 6.24 -1.2 Adriatic 6.64 1.9 7.11 -0.5 Total (Croatia) 5.5 2.5 6.5 -1.0 * No. of firms, N=1400
12

Table 11. Exit and entry rates in Croatia by macro sector*, 2008-2012 (%)
Macro sector "Start-up" entry rate
New "big" entry rate
Exit rate
Net entry (“start-up” entry – exit )
Agriculture, forestry and fishery products 2.63 7.89 5.26 -2.6
Mining and quarrying 7.69 0.0 7.69 0.0
Manufacturing 2.67 2.67 4.8 -2.1
Electricity, water supply 0.0 1.47 1.47 -1.5
Construction 4.69 2.34 2.34 2.4
Services 7.58 2.31 8.48 -0.9 Total (Croatia) 5.5 2.5 6.5 -1.0 * No. of firms, N=1400
Table 12. Exit and entry rates in Croatia in Service macro sector (only)*, 2008-2012 (%)
Service macro sector "Start-ups" entry rate
New "big" entry rate
Exit rate
Net entry (“start-up” entry – exit )
KIS,market 10.17 0.00 6.78 3.39
KIS,high-tech 20.00 4.00 8.00 12.00 KIS,financial 0.00 0.00 25.00 -25.00 KIS,other 2.27 2.27 6.82 -4.55 LKIS,market 6.38 2.81 8.63 -2.25 LKIS,other 15.38 0.00 0.00 15.38 Total (Services only) 7.58 2.31 8.48 -0.90
* No. of firms, N=778
To what extent is the firm churning process in Croatia productivity enhancing? In order to answer this question we estimate the aggregate TFP change for the period 2008 -2012 by using Equation 2, where πi,t denotes the firm i’s productivity (natural logarithm of TFP or labor productivity) in year t, θij,t is the share of firm i in total employment (turnover) of a NACE Rev.2 code 1 digit sector j in a given year t, and ΔΠt denotes aggregate productivity (TFP or labor productivity) change between 2008 and 2012. Variables on the right hand side of Equation 2 stand for the contribution of each group of firms to the overall productivity change: the first term denotes the overall growth contribution of surviving firms, while the second term represents the growth contribution of new market entries as “start-ups”; similarly, the third term denotes the contribution of market entries as “new bigs" while the last term represents the growth contribution of market exits.19
ΔΠt = ��θij,2012 × πi,2012 − θij,2008 × πi,2008�i∈S
+ � �θij,2012 × πi,2012�i∈NSU
+ � �θij,2012 × πi,2012 − θij,2008 × πi,2008�i∈NBE
− ��θij,2008 × πi,2008� (2)i∈X
For values of t ∈ {2008, 2012}, θij,t for employment weighting is calculated as:
𝜃𝑖𝑗,𝑡 = 𝑙𝑖,𝑡
∑ 𝑙𝑖,𝑡𝑖∈𝑗
19 The exit effect is always positive; it has however a negative sign in the overall decomposition as it needs to be discounted from the entry effect.
13
where li,t is the employment of firm i in time t. In addition to weighting by employment, in the Equation 2 we can also weight by turnover. In that case instead of θij,t we use µij,t , t ∈ {2008, 2012}, which is defined in the following way:
µij,t = τi,t
∑ τi,ti∈j
where τi,t is the turnover of firm i in time t.20 This basic decomposition is afterwards extended by adding more criteria to distinguish firms by region, size, ownership, macro sector and international exposure.
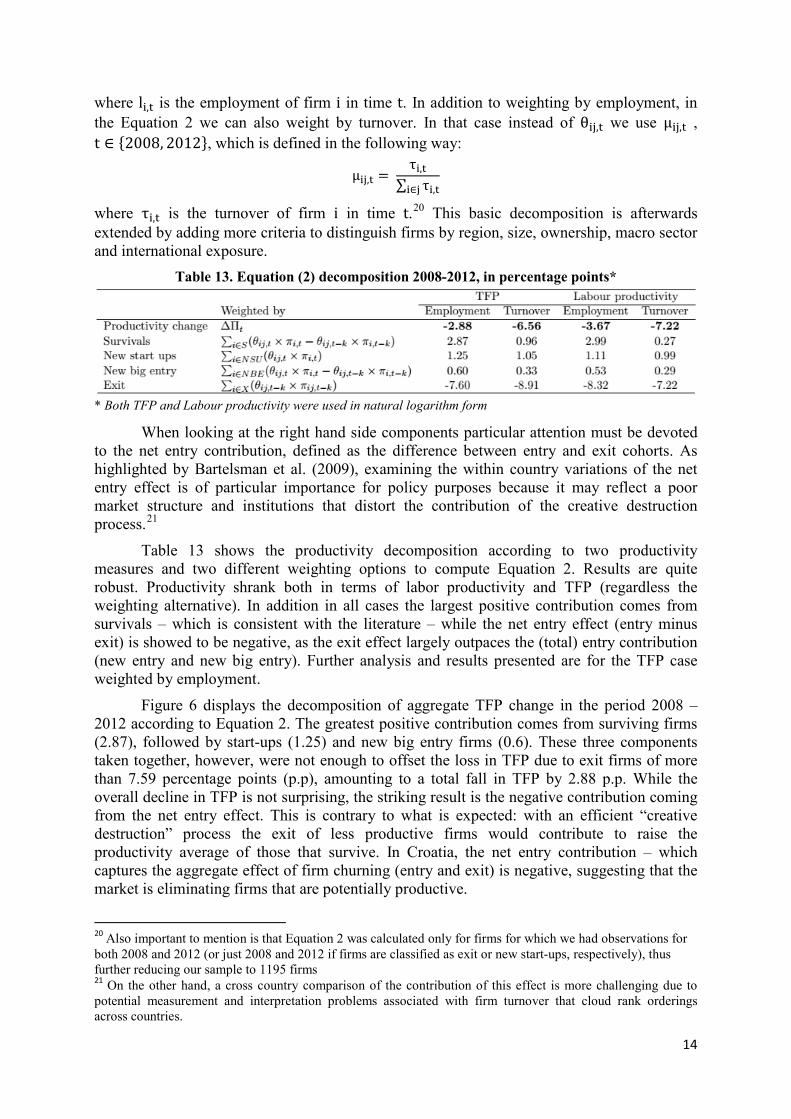
Table 13. Equation (2) decomposition 2008-2012, in percentage points*
* Both TFP and Labour productivity were used in natural logarithm form
When looking at the right hand side components particular attention must be devoted to the net entry contribution, defined as the difference between entry and exit cohorts. As highlighted by Bartelsman et al. (2009), examining the within country variations of the net entry effect is of particular importance for policy purposes because it may reflect a poor market structure and institutions that distort the contribution of the creative destruction process.21
Table 13 shows the productivity decomposition according to two productivity measures and two different weighting options to compute Equation 2. Results are quite robust. Productivity shrank both in terms of labor productivity and TFP (regardless the weighting alternative). In addition in all cases the largest positive contribution comes from survivals – which is consistent with the literature – while the net entry effect (entry minus exit) is showed to be negative, as the exit effect largely outpaces the (total) entry contribution (new entry and new big entry). Further analysis and results presented are for the TFP case weighted by employment.
Figure 6 displays the decomposition of aggregate TFP change in the period 2008 – 2012 according to Equation 2. The greatest positive contribution comes from surviving firms (2.87), followed by start-ups (1.25) and new big entry firms (0.6). These three components taken together, however, were not enough to offset the loss in TFP due to exit firms of more than 7.59 percentage points (p.p), amounting to a total fall in TFP by 2.88 p.p. While the overall decline in TFP is not surprising, the striking result is the negative contribution coming from the net entry effect. This is contrary to what is expected: with an efficient “creative destruction” process the exit of less productive firms would contribute to raise the productivity average of those that survive. In Croatia, the net entry contribution – which captures the aggregate effect of firm churning (entry and exit) is negative, suggesting that the market is eliminating firms that are potentially productive.
20 Also important to mention is that Equation 2 was calculated only for firms for which we had observations for both 2008 and 2012 (or just 2008 and 2012 if firms are classified as exit or new start-ups, respectively), thus further reducing our sample to 1195 firms 21 On the other hand, a cross country comparison of the contribution of this effect is more challenging due to potential measurement and interpretation problems associated with firm turnover that cloud rank orderings across countries.
14
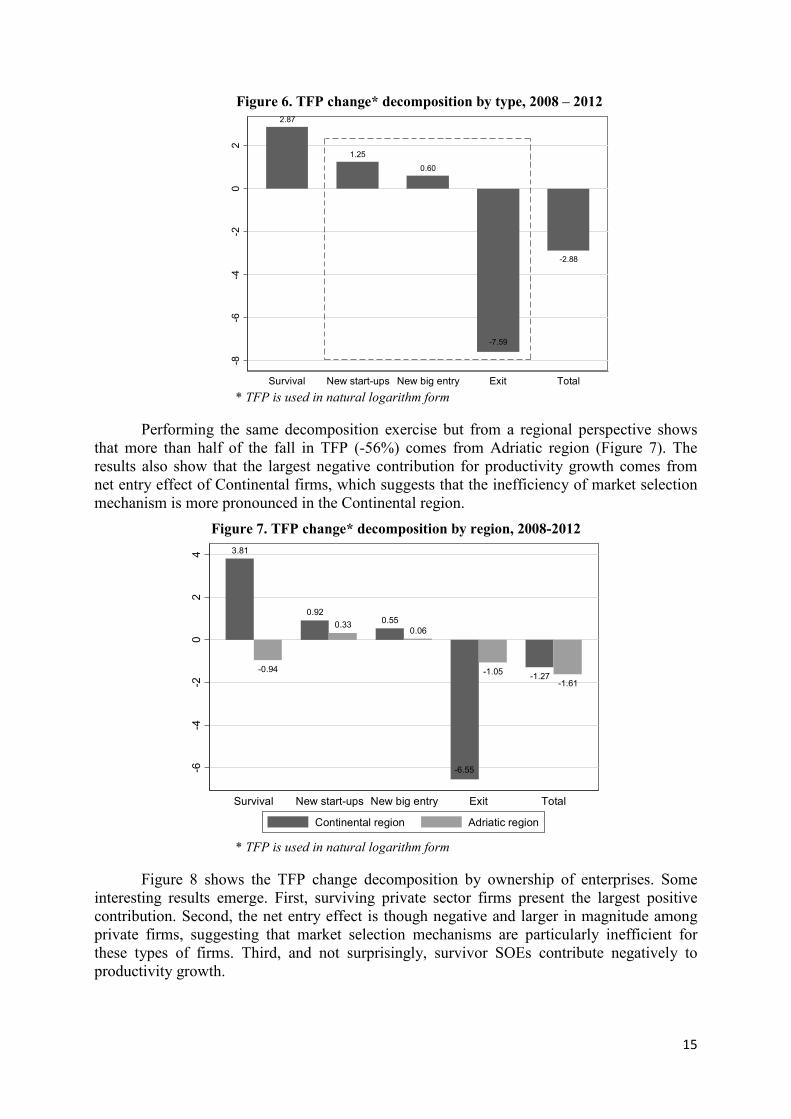
Figure 6. TFP change* decomposition by type, 2008 – 2012
* TFP is used in natural logarithm form
Performing the same decomposition exercise but from a regional perspective shows that more than half of the fall in TFP (-56%) comes from Adriatic region (Figure 7). The results also show that the largest negative contribution for productivity growth comes from net entry effect of Continental firms, which suggests that the inefficiency of market selection mechanism is more pronounced in the Continental region.
Figure 7. TFP change* decomposition by region, 2008-2012
* TFP is used in natural logarithm form
Figure 8 shows the TFP change decomposition by ownership of enterprises. Some interesting results emerge. First, surviving private sector firms present the largest positive contribution. Second, the net entry effect is though negative and larger in magnitude among private firms, suggesting that market selection mechanisms are particularly inefficient for these types of firms. Third, and not surprisingly, survivor SOEs contribute negatively to productivity growth.
2.87
1.25
0.60
-7.59
-2.88
-8-6
-4-2
02
Survival New start-ups New big entry Exit Total
3.81
-0.94
0.920.33 0.55
0.06
-6.55
-1.05 -1.27-1.61
-6-4
-20
24
Survival New start-ups New big entry Exit Total
Continental region Adriatic region
15
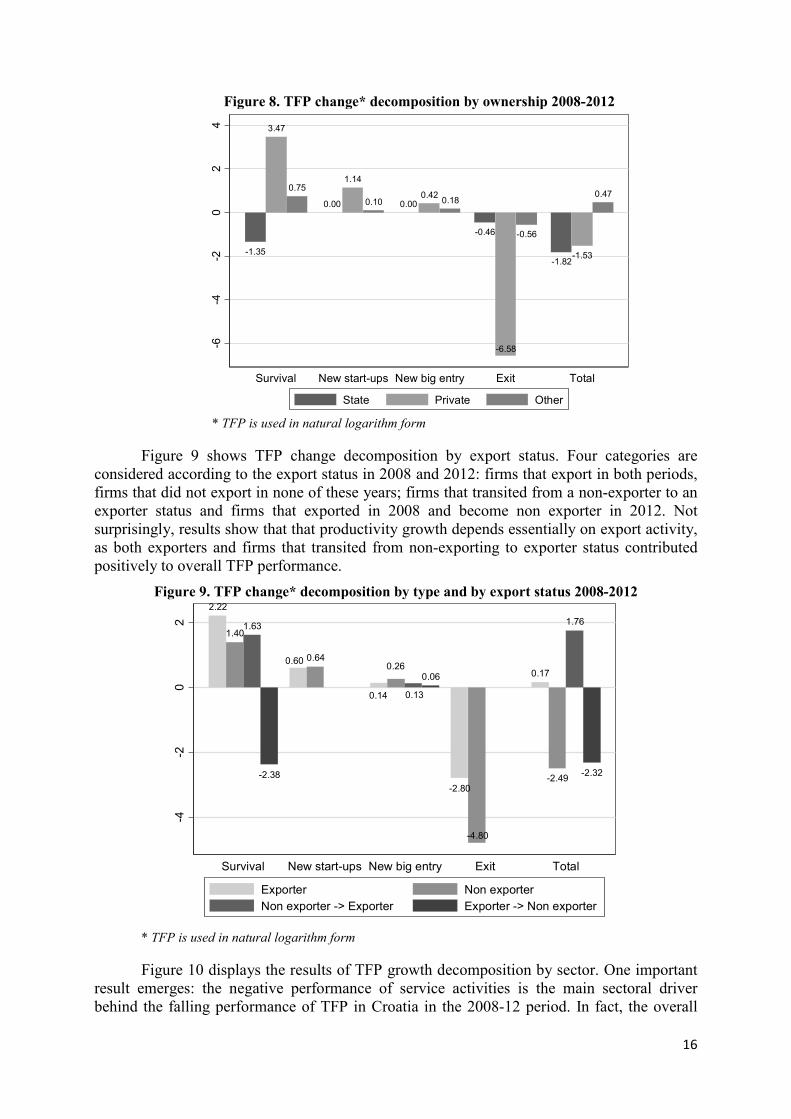
Figure 8. TFP change* decomposition by ownership 2008-2012
* TFP is used in natural logarithm form
Figure 9 shows TFP change decomposition by export status. Four categories are considered according to the export status in 2008 and 2012: firms that export in both periods, firms that did not export in none of these years; firms that transited from a non-exporter to an exporter status and firms that exported in 2008 and become non exporter in 2012. Not surprisingly, results show that that productivity growth depends essentially on export activity, as both exporters and firms that transited from non-exporting to exporter status contributed positively to overall TFP performance.
Figure 9. TFP change* decomposition by type and by export status 2008-2012
* TFP is used in natural logarithm form
Figure 10 displays the results of TFP growth decomposition by sector. One important result emerges: the negative performance of service activities is the main sectoral driver behind the falling performance of TFP in Croatia in the 2008-12 period. In fact, the overall
-1.35
3.47
0.75
0.00
1.14
0.10 0.000.42 0.18
-0.46
-6.58
-0.56
-1.82-1.53
0.47
-6-4
-20
24
Survival New start-ups New big entry Exit Total
State Private Other
2.22
1.401.63
-2.38
0.60 0.64
0.14
0.26
0.13
0.06
-2.80
-4.80
0.17
-2.49
1.76
-2.32
-4-2
02
Survival New start-ups New big entry Exit Total
Exporter Non exporterNon exporter -> Exporter Exporter -> Non exporter
16

shrank in productivity in the service sector was -3.93 pp, outpacing the negative performance of the whole economy (-2.88 p.p). When looking at both the survival and the net entry contributions, services sector emerges again as the main driver. First, service firms present the highest positive contribution to productivity performance among surviving firms. Second, though the entry of new service firms has showed to be largely positive, it was not large enough to compensate the negative effect coming from the exit of service firms. In this regard, the fact that the net entry effect is particularly negative for service firms suggests that inefficient market selection is particularly pronounced for service firms.
Figure 10. TFP change* decomposition by type and by macro sectors, 2008 – 2012
* TFP is used in natural logarithm form
A closer inspection revels however that not all service firms had a negative performance. Figure 11 presents the TFP growth decomposition across 6 main sub categories within services according to knowledge intensity, as follows: Knowledge-intensive (KI) market services; KI high-tech services; KI financial services; other KI services; less KI market services and other less KI services. Results show that some groups of services have outperformerd: KI market services (as such water, air, real state, etc.) KI high tech (such as telecom, computer related activities, R&D activities, etc.) have and other less KI services (as personal services, etc.) contributed positively to overall productivity performance of service industry. Figure 11 also reveals some untapped potential coming from entry cohorts. Contribution to productivity coming from start-ups and dynamic micro/small firms (the ”new big entry“) is particularly low among KI services.
-0.07
1.17
0.25
-0.34
0.07
1.79
0.10 0.05
0.95
0.12 0.230.14
-0.12-0.57
-6.81
-0.08
1.24
-0.14-0.27
0.30
-3.93
-6-5
-4-3
-2-1
01
2
Survival New start-ups New big entry Exit Total
Agriculture Mining Manufacturing
Electricity Construction Services
17
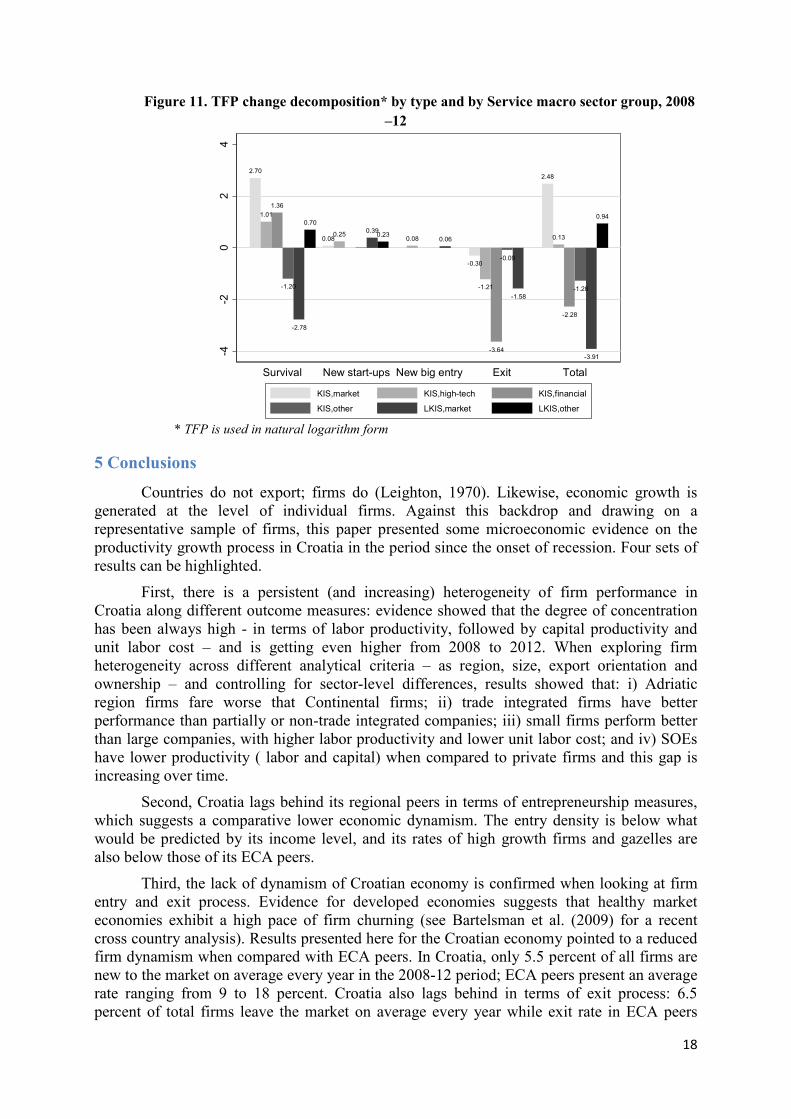
Figure 11. TFP change decomposition* by type and by Service macro sector group, 2008 –12
* TFP is used in natural logarithm form
5 Conclusions
Countries do not export; firms do (Leighton, 1970). Likewise, economic growth is generated at the level of individual firms. Against this backdrop and drawing on a representative sample of firms, this paper presented some microeconomic evidence on the productivity growth process in Croatia in the period since the onset of recession. Four sets of results can be highlighted.
First, there is a persistent (and increasing) heterogeneity of firm performance in Croatia along different outcome measures: evidence showed that the degree of concentration has been always high - in terms of labor productivity, followed by capital productivity and unit labor cost – and is getting even higher from 2008 to 2012. When exploring firm heterogeneity across different analytical criteria – as region, size, export orientation and ownership – and controlling for sector-level differences, results showed that: i) Adriatic region firms fare worse that Continental firms; ii) trade integrated firms have better performance than partially or non-trade integrated companies; iii) small firms perform better than large companies, with higher labor productivity and lower unit labor cost; and iv) SOEs have lower productivity ( labor and capital) when compared to private firms and this gap is increasing over time.
Second, Croatia lags behind its regional peers in terms of entrepreneurship measures, which suggests a comparative lower economic dynamism. The entry density is below what would be predicted by its income level, and its rates of high growth firms and gazelles are also below those of its ECA peers.
Third, the lack of dynamism of Croatian economy is confirmed when looking at firm entry and exit process. Evidence for developed economies suggests that healthy market economies exhibit a high pace of firm churning (see Bartelsman et al. (2009) for a recent cross country analysis). Results presented here for the Croatian economy pointed to a reduced firm dynamism when compared with ECA peers. In Croatia, only 5.5 percent of all firms are new to the market on average every year in the 2008-12 period; ECA peers present an average rate ranging from 9 to 18 percent. Croatia also lags behind in terms of exit process: 6.5 percent of total firms leave the market on average every year while exit rate in ECA peers
2.70
1.011.36
-1.20
-2.78
0.70
0.080.25 0.390.23 0.08 0.06
-0.30
-1.21
-3.64
-0.09
-1.58
2.48
0.13
-2.28
-1.28
-3.91
0.94-4
-20
24
Survival New start-ups New big entry Exit Total
KIS,market KIS,high-tech KIS,financial
KIS,other LKIS,market LKIS,other
18

varies from 7 to 26 percent on average. When looking at net entry rates (entry minus exit) Croatia presented negative values which indicate that exit outpaced entry in the 2008-12 period. This finding reinforces the perception that Croatia is a stagnant economy with a reduced “creative destruction” process, and reduced innovativeness, which in turn has negative effects for export diversification. There is some sector variation, however. All macro sectors have showed a negative entry effect, but services showed to be the one where this process seems to be less prominent. In addition, when focusing only on service activities there is evidence of a strong firm dynamism for both knowledge intensive services (such as telecom, computer related activities, R&D activities, etc) and other less knopwledge services (such as personal activities).
Fourth, the contribution of firm dynamism (proxied by net entry) for productivity growth in Croatia is surprisingly negative. Empirical evidence for developed countries shows that the churning process is productivity enhancing, in the sense that new business entry and the market exit of less productivity firms contribute to spur productivity average. For Croatia, evidence presented a decrease of 2.88 p.p in TFP in the 2008-12 period for the overall economy. The decomposition of this variation in contributions from survival, start-up entry, big entry and exit firms has revealed interesting results, some of them surprising. As expected, productivity growth is largely driven by survival firm performance while the entry effect is normally (but not always) positive (depending on the analytical cut). The striking result comes from the negative contribution from net entry effect. This is contrary to what is expected and suggests that the destructive creation process in Croatia has not been efficient as the market might be eliminating firms that are potentially productive. When performing this exercise across several analytical criteria, results suggest that this inefficient market selection process is more pronounced among private sector firms, Continental region firms and firms in the service sector. Again, not all service sub sectors had a negative performance however. The exercise showed also some untapped potential for productivity growth in services industry coming entry of knowledge intensive service companies.
The magnitude of costs imposed by the creative destruction process on firms is influenced by institutional and regulation configurations in both product and factor markets. In this regard, a number of general policy implications for Croatia can be listed drawing on the evidence presented here. As usual, technology-driven strategies to enhance growth among survival firms – which still accounts for the largest positive contribution to overall productivity growth in the country - should be accompanied by moves to remove restrictions that reduce the cost of entry and exit in the market. Therefore, policies that foster market contestability should be pursued, in particular those aiming at better product market regulation (as: liberalization of entry into the service sector, particularly retail and infrastructure). Financing entrepreneurship (in promising sectors!) can be also pointed as encouraging options. In addition, appropriate bankruptcy rules play also a key role by easing the exit process and allowing low-productive units to leave the market and free resources which can be better used by other firms.
While the general policy options highlighted above are not surprising and are consistent with the usual recommendations highlighted by the literature, there are still a lot to be done regarding the identification of specific policy strategies that could spur productivity growth in Croatia. An in-depth investigation on the role of policies and institutions to explain the inefficient destructive creation process in Croatia must be developed. In this regard, potential areas for further investigation include the state aid system, particularly at the sector level to investigate possible distortions in terms of vertical aid, and product market regulation for services. Preliminary evidence suggests there is a still pervasive economy-wide system of product market regulation in Croatia. For instance, total state aid (excluding aid to railways)
19
granted in Croatia in 2011 amounted to 2.47% of GDP22; which is much higher than the average for EU 27 in the same period (0.51% of GDP).23 In addition, the perception of intensity of local competition in the Croatian economy is well below the regional peers (see WEF data for 2011-12).
22 Annual State Aid report Croatian Competition Agency 23 Croatian data draws on the “Annual Report on State Aid for 20122”- Croatian Competition Agency. EU-27 average is from European Commission- DG Competition.
20
Bibliography
AMECO database, available at: http://ec.europa.eu/economy_finance/db_indicators/ameco/zipped_en.htm (accessed November 5th 2013)
Audretsch, D. B., (1995). Innovation and Industry Evolution, Cambridge: MIT Press.
Bartelsman, E., Haltiwanger, J. & Scarpetta, S. (2009). Measuring and Analyzing Cross-Country Differences in Firm Dynamics. In T. Dunne, J.B. Jensen & M. Roberts (Eds.). Producer Dynamics: New Evidence from Micro Data. National Bureau of Economic Research, Inc. University of Chicago Press Biznet database, available at: http://www1.biznet.hr/HgkWeb/do/extlogon (accessed January 25th 2013)
Business Croatia [Hrv. Poslovna Hrvatska] database, available at http://www.poslovna.hr/ (accessed January 13th 2014)
Croatian Bureau of Statistics, available at: http://www.dzs.hr/default_e.htm (accessed January 13th 2014) Eurostat database, available at: http://epp.eurostat.ec.europa.eu/portal/page/portal/statistics/search_database (accessed January 13th 2014)
Foster, L., Haltiwanger, J. & Krizan, C.J. (2001). Aggregate productivity Growth: Lessons from Microeconomic Evidence. in New Developments in Productivity Analysis, NBER/University of Chicago Press. Geishecker, I., Gorg, G. & Taglioni, D. (2009). Characterizing Euro Area Multinationals. The World Economy, 32(1), 49-76.
Henrekson, M., & Johansson, D. (2010). Gazelles as Job Creators: A Survey and Interpretation of the Evidence. Small Business Economics, 35(2), 227–44.
Leighton, D. S. R. (1970) The Internationalization of American Business. The Third Industrial Revolution. Journal of Marketing, 34(3), 3-6.
Levinsohn, J. & Petrin, A. (2003). Estimating Production Functions Using Inputs to Control for Unobservables. Review of Economic Studies, 70(2), 317-342.
Nestić, D., Mervar, A., Rubil, I., Škrinjarić, B., Tkalec, M. & Tomić, I. (2014). Recent developments; Policy assumptions and projections summary; Uncertainties and risks to projections. Croatian economic outlook quarterly, 16 (57), 1-12.
21

Appendix A – Methodology: data cleaning, deflation process, performance measures and descriptive statistics
Table 14. A1. Distribution of firms in the original sample by counties (NUTS 3) and NACE Rev.2 code 1 digit sectors
ZAG
REBA
CKA
KRAP
INSK
O-
ZAG
ORS
KA
SISA
CKO
-M
OSL
AVAC
KA
KARL
OVA
CKA
VARA
ZDIN
SKA
KOPR
IVNIČKO
-KR
IZEV
ACKA
BJEL
OVA
RSKO
-BI
LOG
ORS
KA
PRIM
ORS
KO-
GO
RAN
SKA
LICK
OSE
NJS
KA
VIRO
VITI
CKO
-PO
DRAV
SKA
POZE
SKO
-SL
AVO
NSK
A
BRO
DSKO
-PO
SAVS
KA
ZADA
RSKA
OSI
JECK
O-
BARA
NJS
KA
SIBE
NSK
O-
KNIN
SKA
VUKO
VARS
KO-
SRIJE
MSK
A
SPLI
TSKO
-DA
LMAT
INSK
A
ISTA
RSKA
DUBR
OVA
CKO
-N
ERET
VAN
SKA
MED
IMU
RSKA
CITY
OF
ZAG
REB
TOTA
L
Agriculture, forestry and fishing A 2 1 2 2 2 4 1 3 4 10 6 5 2 2 5 51Mining and quarrying B 1 1 2 1 1 1 1 1 7 16Manufacturing C 39 14 12 11 27 9 12 38 1 8 6 11 8 32 12 11 39 33 1 28 120 472Electricity, gas, steam and air conditioning supply D 1 1 1 1 1 1 1 2 1 12 22Water supply; seweage; waste managment and remediation activi E 5 2 4 2 2 1 2 8 2 1 1 1 2 5 3 6 5 2 8 62Construction F 12 3 2 4 7 3 4 12 1 2 8 5 11 2 5 25 14 8 7 74 209Wholesale and retail trade; repair of motor vehicles and motorcyclG 44 6 4 4 13 4 8 35 2 4 1 4 9 22 7 9 39 22 9 7 272 525Transporting and storage H 5 2 2 1 4 2 14 2 1 3 4 1 11 5 6 1 29 93Accommodation and food service activities I 2 1 1 2 1 18 6 3 5 18 17 19 1 20 114Information and communication J 1 1 6 1 2 4 2 1 60 78Financial and insurance activities K 4 1 2 1 52 60Real estate activities L 1 1 3 1 1 2 4 8 1 16 38Professional, scientific and technical activities M 7 1 2 5 2 12 2 3 7 1 1 12 11 3 3 93 165Administrative and support service activities N 1 5 2 1 2 6 6 4 19 46Public administration and defence; compulsatory social security O 2 2Human health and social work activities Q 1 1 3 5Arts, entertainment and recreation R 2 1 1 1 1 2 2 8 18Other services activities S 2 1 4 1 4 1 1 1 9 24
121 30 26 25 70 20 34 162 7 18 13 31 46 102 34 36 178 131 55 52 809 2000
NACE Rev. 2 1 digit / counties (NUTS 3)
TOTAL
22
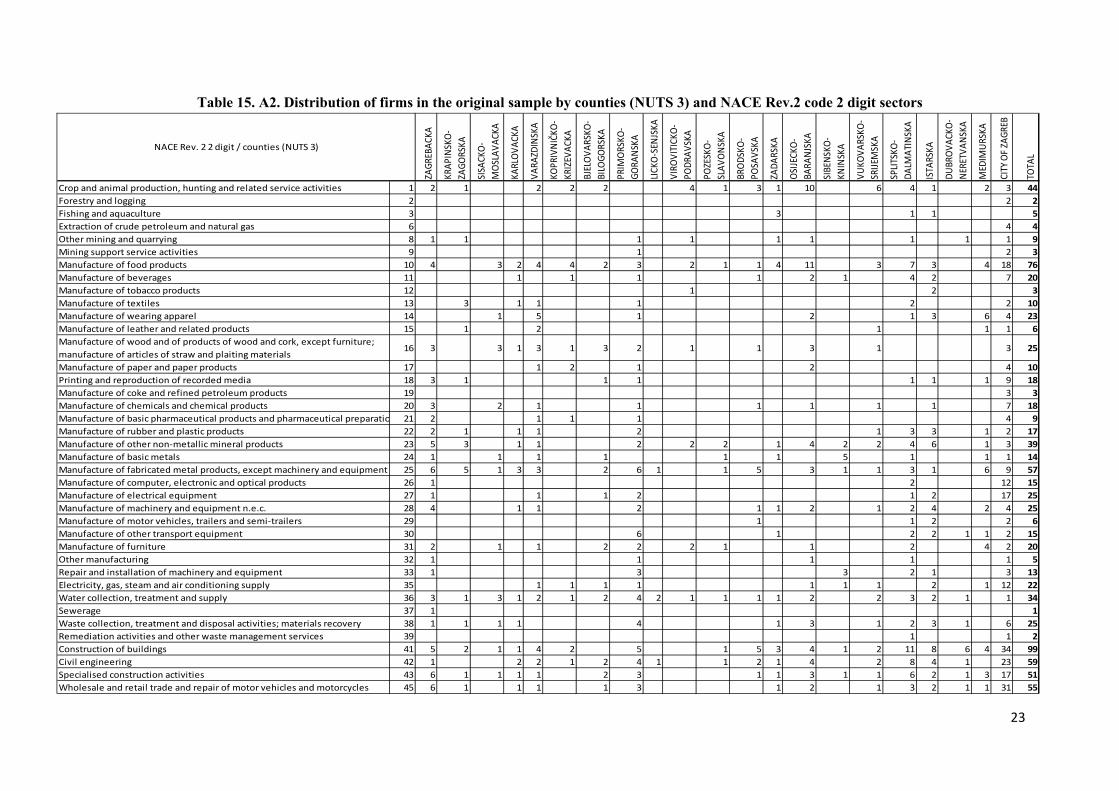
Table 15. A2. Distribution of firms in the original sample by counties (NUTS 3) and NACE Rev.2 code 2 digit sectors
ZAGR
EBAC
KA
KRAP
INSK
O-ZA
GORS
KA
SISA
CKO-
MOS
LAVA
CKA
KARL
OVAC
KA
VARA
ZDIN
SKA
KOPR
IVNIČK
O-KR
IZEV
ACKA
BJEL
OVAR
SKO-
BILO
GORS
KA
PRIM
ORSK
O-GO
RANS
KA
LICKO
-SEN
JSKA
VIRO
VITI
CKO-
PODR
AVSK
A
POZE
SKO-
SLAV
ONSK
A
BROD
SKO-
POSA
VSKA
ZADA
RSKA
OSIJE
CKO-
BARA
NJSK
A
SIBE
NSKO
-KN
INSK
A
VUKO
VARS
KO-
SRIJE
MSK
A
SPLIT
SKO-
DALM
ATIN
SKA
ISTA
RSKA
DUBR
OVAC
KO-
NERE
TVAN
SKA
MED
IMUR
SKA
CITY
OF Z
AGRE
B
TOTA
L
Crop and animal production, hunting and related service activities 1 2 1 2 2 2 4 1 3 1 10 6 4 1 2 3 44Forestry and logging 2 2 2Fishing and aquaculture 3 3 1 1 5Extraction of crude petroleum and natural gas 6 4 4Other mining and quarrying 8 1 1 1 1 1 1 1 1 1 9Mining support service activities 9 1 2 3Manufacture of food products 10 4 3 2 4 4 2 3 2 1 1 4 11 3 7 3 4 18 76Manufacture of beverages 11 1 1 1 1 2 1 4 2 7 20Manufacture of tobacco products 12 1 2 3Manufacture of textiles 13 3 1 1 1 2 2 10Manufacture of wearing apparel 14 1 5 1 2 1 3 6 4 23Manufacture of leather and related products 15 1 2 1 1 1 6Manufacture of wood and of products of wood and cork, except furniture; manufacture of articles of straw and plaiting materials
16 3 3 1 3 1 3 2 1 1 3 1 3 25
Manufacture of paper and paper products 17 1 2 1 2 4 10Printing and reproduction of recorded media 18 3 1 1 1 1 1 1 9 18Manufacture of coke and refined petroleum products 19 3 3Manufacture of chemicals and chemical products 20 3 2 1 1 1 1 1 1 7 18Manufacture of basic pharmaceutical products and pharmaceutical preparatio 21 2 1 1 1 4 9Manufacture of rubber and plastic products 22 2 1 1 1 2 1 3 3 1 2 17Manufacture of other non-metallic mineral products 23 5 3 1 1 2 2 2 1 4 2 2 4 6 1 3 39Manufacture of basic metals 24 1 1 1 1 1 1 5 1 1 1 14Manufacture of fabricated metal products, except machinery and equipment 25 6 5 1 3 3 2 6 1 1 5 3 1 1 3 1 6 9 57Manufacture of computer, electronic and optical products 26 1 2 12 15Manufacture of electrical equipment 27 1 1 1 2 1 2 17 25Manufacture of machinery and equipment n.e.c. 28 4 1 1 2 1 1 2 1 2 4 2 4 25Manufacture of motor vehicles, trailers and semi-trailers 29 1 1 2 2 6Manufacture of other transport equipment 30 6 1 2 2 1 1 2 15Manufacture of furniture 31 2 1 1 2 2 2 1 1 2 4 2 20Other manufacturing 32 1 1 1 1 1 5Repair and installation of machinery and equipment 33 1 3 3 2 1 3 13Electricity, gas, steam and air conditioning supply 35 1 1 1 1 1 1 1 2 1 12 22Water collection, treatment and supply 36 3 1 3 1 2 1 2 4 2 1 1 1 1 2 2 3 2 1 1 34Sewerage 37 1 1Waste collection, treatment and disposal activities; materials recovery 38 1 1 1 1 4 1 3 1 2 3 1 6 25Remediation activities and other waste management services 39 1 1 2Construction of buildings 41 5 2 1 1 4 2 5 1 5 3 4 1 2 11 8 6 4 34 99Civil engineering 42 1 2 2 1 2 4 1 1 2 1 4 2 8 4 1 23 59Specialised construction activities 43 6 1 1 1 1 2 3 1 1 3 1 1 6 2 1 3 17 51Wholesale and retail trade and repair of motor vehicles and motorcycles 45 6 1 1 1 1 3 1 2 1 3 2 1 1 31 55
NACE Rev. 2 2 digit / counties (NUTS 3)
23

(Table A2 continued)
Wholesale trade, except of motor vehicles and motorcycles 46 29 3 2 2 7 1 4 21 1 1 3 3 11 3 6 17 13 6 3 175 311Retail trade, except of motor vehicles and motorcycles 47 9 2 2 1 5 3 3 11 1 3 1 1 5 9 4 2 19 7 2 3 66 159Land transport and transport via pipelines 49 3 2 1 1 4 2 4 2 1 1 3 1 3 2 1 1 13 45Water transport 50 1 3 1 2 1 1 9Air transport 51 3 3Warehousing and support activities for transportation 52 2 7 1 1 6 2 4 11 34Postal and courier activities 53 2 2Accommodation 55 1 14 5 2 4 15 13 17 9 80Food and beverage service activities 56 2 1 1 1 1 4 1 1 1 3 4 2 1 11 34Publishing activities 58 2 1 2 16 21Motion picture, video and television programme production, sound recording and music publishing activities
59 4 4
Programming and broadcasting activities 60 1 1 5 7Telecommunications 61 1 12 13Computer programming, consultancy and related activities 62 1 1 2 1 1 2 1 20 29Information service activities 63 1 3 4Financial service activities, except insurance and pension funding 64 2 1 1 31 35Insurance, reinsurance and pension funding, except compulsory social securit 65 2 2Activities auxiliary to financial services and insurance activities 66 2 1 1 19 23Real estate activities 68 1 1 3 1 1 2 4 8 1 16 38Legal and accounting activities 69 2 1 1 1 3 1 1 1 1 3 3 1 1 14 34Activities of head offices; management consultancy activities 70 1 2 2 1 4 2 2 1 23 38Architectural and engineering activities; technical testing and analysis 71 2 1 1 2 1 5 1 1 1 1 4 4 1 1 29 55Scientific research and development 72 5 5Advertising and market research 73 1 1 1 1 1 16 21Other professional, scientific and technical activities 74 1 1 1 1 5 9Veterinary activities 75 1 1 1 3Rental and leasing activities 77 1 1 1 2 1 1 4 11Employment activities 78 1 1Travel agency, tour operator reservation service and related activities 79 2 1 1 2 4 3 6 19Security and investigation activities 80 1 3 4Services to buildings and landscape activities 81 1 2 1 3 7Office administrative, office support and other business support activities 82 1 1 2 4Public administration and defence; compulsory social security 84 2 2Human health activities 86 1 2 3Residential care activities 87 1 1Social work activities without accommodation 88 1 1Creative, arts and entertainment activities 90 1 1Libraries, archives, museums and other cultural activities 91 1 1Gambling and betting activities 92 1 5 6Sports activities and amusement and recreation activities 93 2 1 1 1 2 1 2 10Repair of computers and personal and household goods 95 1 1 2 3 7Other personal service activities 96 1 1 3 1 2 1 1 1 6 17
121 30 26 25 70 20 34 162 7 18 13 31 46 102 34 36 178 131 55 52 809 2000Total
24

Table 16. A3. Descriptive statistics of performance indicators excluding State owned enterprises (SOEs)
(a) By region
* No. of firms, N=1299
(b) By export status
* No. of firms, N=1299
Mean Median Std Dev Mean Median Std Dev Mean Median Std Dev Mean Median Std Dev Mean Median Std DevContinental 216,731.90 57,061.63 902,749.20 253.65 86.00 675.88 1,662.40 389.49 16,723.13 103.09 2.98 2,176.29 0.75 0.24 19.78Adriatic 107,960.50 33,985.38 242,687.50 186.11 69.00 344.61 627.72 300.82 1,399.55 24.27 1.81 238.25 1.17 0.30 23.71Total 185,239.40 48,828.12 773,567.30 234.10 81.00 599.84 1,362.83 360.59 14,122.86 80.27 2.60 1,839.09 0.87 0.26 20.99
ULC (in HRK per unit of value added)
Real Turnover (1.000 HRK) Number of employeesLabour Productivity (value
added per employee, in 1.000 HRK)
Capital Productivity (value added per unit of
capital)
Mean Median Std Dev Mean Median Std Dev Mean Median Std Dev Mean Median Std Dev Mean Median Std DevNon exporters 71,374.83 9,548.06 194,341.30 115.52 22.00 263.78 670.24 289.74 2,227.44 37.24 3.51 364.53 1.10 0.27 25.78Exporters 267,099.80 79,464.80 992,804.70 319.34 135.00 742.44 1,860.75 428.72 18,405.53 111.20 2.05 2,391.08 0.71 0.25 16.73Total 185,239.40 48,828.12 773,567.30 234.10 81.00 599.84 1,362.83 360.59 14,122.86 80.27 2.60 1,839.09 0.87 0.26 20.99
Real Turnover (1.000 HRK) Number of employeesLabour Productivity (value
added per employee, in 1.000 HRK)
Capital Productivity (value added per unit of
capital)ULC (in HRK per unit of
value added)
25

(c) By macro sectors
* No. of firms, N=1299
(d) By size
* Size is proxied (only) by the number of employees, No. of firms, N=1299
Mean Median Std Dev Mean Median Std Dev Mean Median Std Dev Mean Median Std Dev Mean Median Std DevAgriculture, forestry and fishery 150,669.30 49,738.48 277,202.60 276.43 109.00 428.41 450.16 243.85 543.10 2.84 0.73 6.23 0.48 0.28 1.13Mining and quarrying 208,145.80 52,398.13 333,027.70 244.21 70.00 450.96 35,150.73 425.70 128,748.00 2.14 1.68 1.85 0.24 0.25 0.16Manufacturing 238,278.30 62,255.68 1,178,082.00 320.65 148.00 668.60 485.10 243.45 2,324.31 13.32 1.25 202.59 0.47 0.35 0.93Electricity, water supply 86,128.77 44,651.50 101,774.80 96.22 66.50 85.20 14,042.02 380.72 50,588.55 2,725.83 1.64 13,634.73 0.27 0.31 0.17Construction 136,797.80 45,860.41 254,404.80 217.56 105.00 328.68 565.84 305.71 871.80 11.44 2.76 79.45 0.33 0.25 0.25Services 169,344.20 42,051.34 558,883.10 191.70 53.00 610.86 1,092.64 514.28 1,701.64 50.36 5.10 343.44 1.24 0.17 28.33Total 185,239.40 48,828.12 773,567.30 234.10 81.00 599.84 1,362.83 360.59 14,122.86 80.27 2.60 1,839.09 0.87 0.26 20.99
ULC (in HRK per unit of value added)
Capital Productivity (value added per unit of capital)
Labour Productivity (value added per employee, in 1.000
HRK)Number of employeesReal Turnover (1.000 HRK)
Mean Median Std Dev Mean Median Std Dev Mean Median Std Dev Mean Median Std Dev Mean Median Std Dev0-9 7,521.87 497.94 66,442.09 3.17 2.00 2.29 3,061.61 192.68 30,295.67 285.69 5.04 3,949.99 2.89 0.32 45.2410-49 49,542.91 31,400.71 61,019.17 28.85 28.00 12.44 1,786.33 1,029.37 2,344.88 68.30 5.42 337.90 0.23 0.13 0.4450-249 94,841.01 55,509.15 133,026.40 120.20 105.00 56.05 731.48 381.40 1,219.79 15.53 1.81 66.30 0.33 0.28 0.43>=250 584,499.10 246,953.30 1,509,095.00 765.52 464.00 1,064.98 604.95 353.18 756.86 9.88 1.70 115.09 0.36 0.28 0.90Total 185,239.40 48,828.12 773,567.30 234.10 81.00 599.84 1,362.83 360.59 14,122.86 80.27 2.60 1,839.09 0.87 0.26 20.99
Real Turnover (1.000 HRK) Number of employeesLabour Productivity (value
added per employee, in 1.000 HRK)
Capital Productivity (value added per unit of capital)
ULC (in HRK per unit of value added)
26
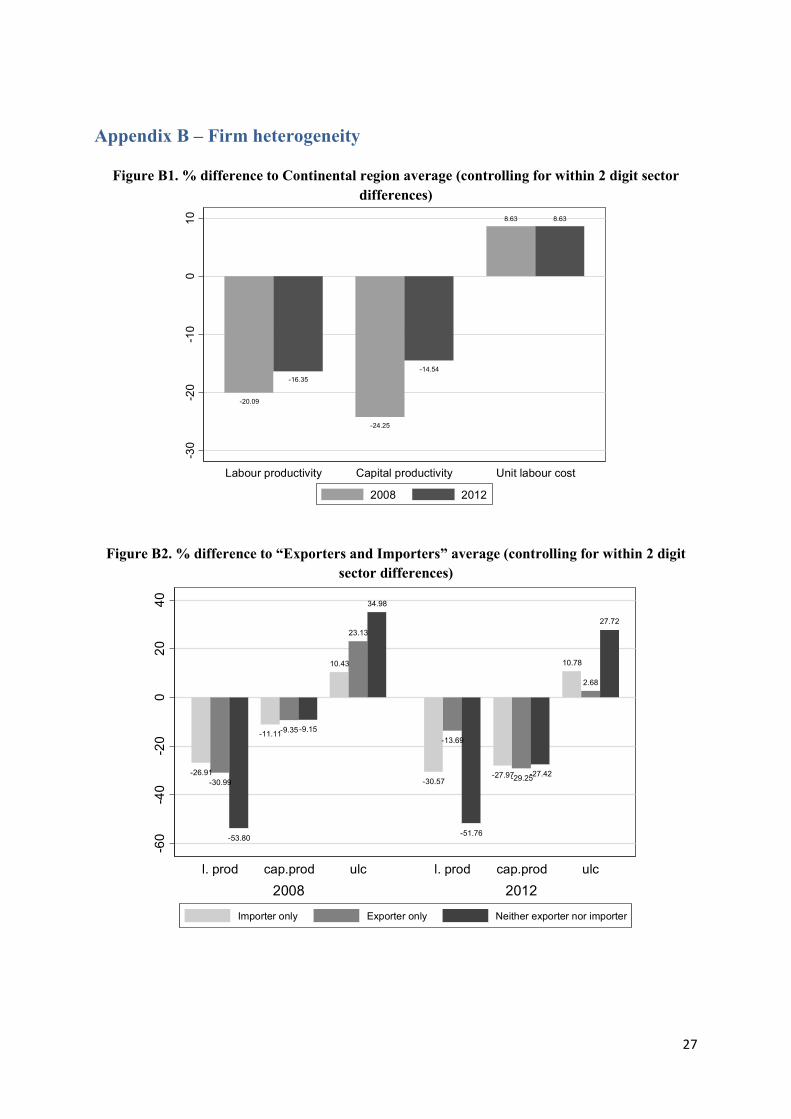
Appendix B – Firm heterogeneity
Figure B1. % difference to Continental region average (controlling for within 2 digit sector differences)
Figure B2. % difference to “Exporters and Importers” average (controlling for within 2 digit sector differences)
-20.09
-16.35
-24.25
-14.54
8.63 8.63
-30
-20
-10
010
Labour productivity Capital productivity Unit labour cost
2008 2012
-26.91-30.99
-53.80
-11.11-9.35-9.15
10.43
23.13
34.98
-30.57
-13.69
-51.76
-27.97-29.25-27.42
10.78
2.68
27.72
-60
-40
-20
020
40
2008 2012l. prod cap.prod ulc l. prod cap.prod ulc
Importer only Exporter only Neither exporter nor importer
27
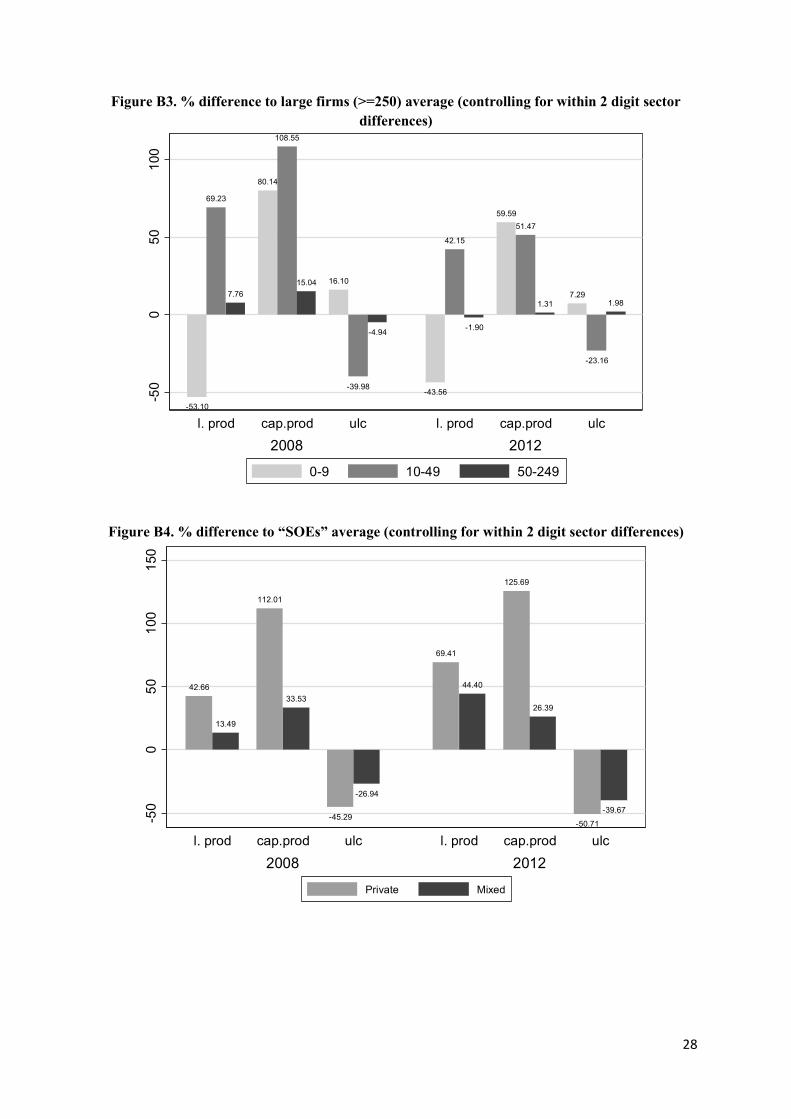
Figure B3. % difference to large firms (>=250) average (controlling for within 2 digit sector differences)
Figure B4. % difference to “SOEs” average (controlling for within 2 digit sector differences)
-53.10
69.23
7.76
80.14
108.55
15.04 16.10
-39.98
-4.94
-43.56
42.15
-1.90
59.5951.47
1.317.29
-23.16
1.98
-50
050
100
2008 2012l. prod cap.prod ulc l. prod cap.prod ulc
0-9 10-49 50-249
42.66
13.49
112.01
33.53
-45.29
-26.94
69.41
44.40
125.69
26.39
-50.71
-39.67
-50
050
100
150
2008 2012l. prod cap.prod ulc l. prod cap.prod ulc
Private Mixed
28

Appendix C – High growing firms and “gazelles”
Figure C1. Distribution of high growing firms* and gazelles** by year and region
* No. of high growing firms, N2010=13, N2012=9 ** No. of gazelles, N2010=2, N2012=2
Figure C2. Share of high growing firms* and gazelles** among all firms with 10 or more
employees, by year and region
* No. of high growing firms, N2010=13, N2011=6, N2012=9 ** No. of gazelles, N2010=2, N2011=2, N2012=2
77%
23%
Continental region
Adriatic region
89%
11%
Continental region
Adriatic region
2010 2012
High growing firms
100%
Continental region
100%
Continental region
2010 2012
Gazelles
0.20 1.10
1.06
0.28 1.12 1.40
1.06
1.31 0.21 0.42
0.30 0.60 0.90
0.63
0.21 0.74
0.37
0.30 0.89 1.19
0.37
0.95
0 0.3% 0.6% 0.9% 1.2% 1.5%
0 0.3% 0.6% 0.9% 1.2% 1.5%
Total
Adriatic
Continental
Total
Adriatic
Continental
Total
Adriatic
Continental
2010 2011
2012
Gazelles High growing firms
29
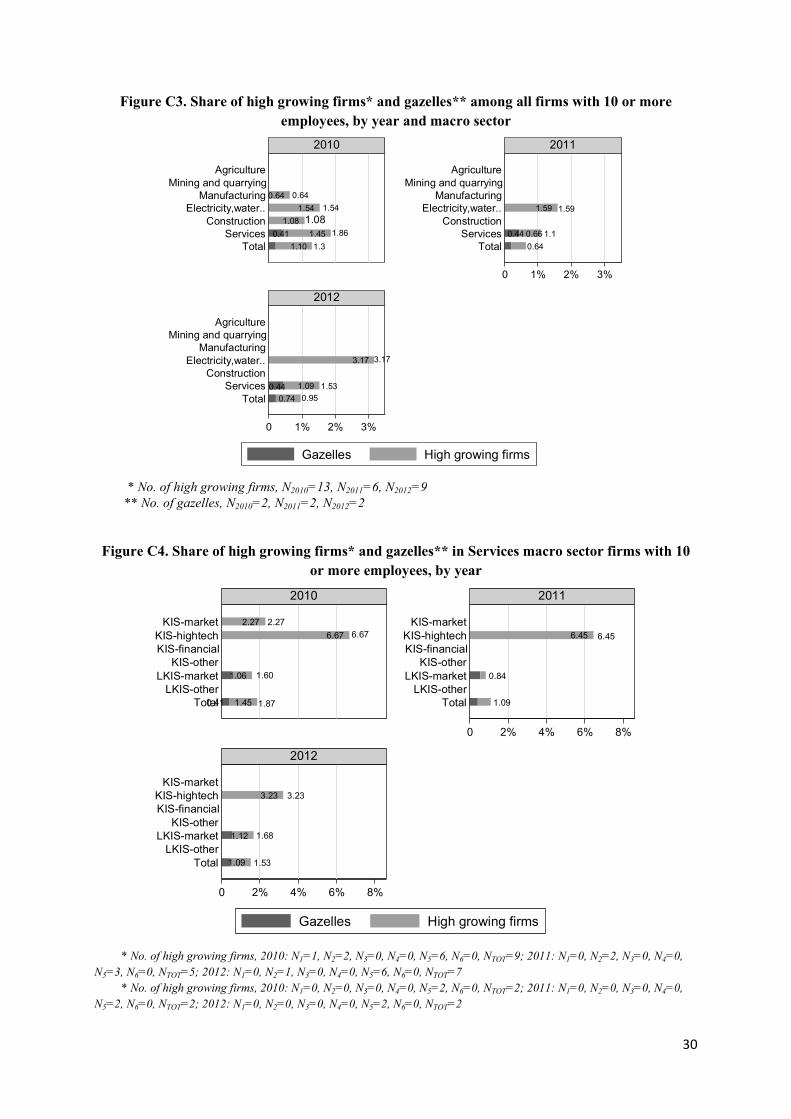
Figure C3. Share of high growing firms* and gazelles** among all firms with 10 or more employees, by year and macro sector
* No. of high growing firms, N2010=13, N2011=6, N2012=9 ** No. of gazelles, N2010=2, N2011=2, N2012=2
Figure C4. Share of high growing firms* and gazelles** in Services macro sector firms with 10 or more employees, by year
* No. of high growing firms, 2010: N1=1, N2=2, N3=0, N4=0, N5=6, N6=0, NTOT=9; 2011: N1=0, N2=2, N3=0, N4=0, N5=3, N6=0, NTOT=5; 2012: N1=0, N2=1, N3=0, N4=0, N5=6, N6=0, NTOT=7 * No. of high growing firms, 2010: N1=0, N2=0, N3=0, N4=0, N5=2, N6=0, NTOT=2; 2011: N1=0, N2=0, N3=0, N4=0, N5=2, N6=0, NTOT=2; 2012: N1=0, N2=0, N3=0, N4=0, N5=2, N6=0, NTOT=2
1.100.41 1.45
1.081.54
0.64 0.641.54
1.081.86
1.30.44 0.66
1.59 1.59
1.10.64
0.740.44 1.09
3.17 3.17
1.530.95
0 1% 2% 3%
0 1% 2% 3%
TotalServices
ConstructionElectricity,water..
ManufacturingMining and quarrying
Agriculture
TotalServices
ConstructionElectricity,water..
ManufacturingMining and quarrying
Agriculture
TotalServices
ConstructionElectricity,water..
ManufacturingMining and quarrying
Agriculture
2010 2011
2012
Gazelles High growing firms
0.41 1.45
1.06
6.672.27 2.27
6.67
1.60
1.87
6.45 6.45
0.84
1.09
1.09
1.12
3.23 3.23
1.68
1.53
0 2% 4% 6% 8%
0 2% 4% 6% 8%
TotalLKIS-other
LKIS-marketKIS-other
KIS-financialKIS-hightech
KIS-market
TotalLKIS-other
LKIS-marketKIS-other
KIS-financialKIS-hightech
KIS-market
TotalLKIS-other
LKIS-marketKIS-other
KIS-financialKIS-hightech
KIS-market
2010 2011
2012
Gazelles High growing firms
30
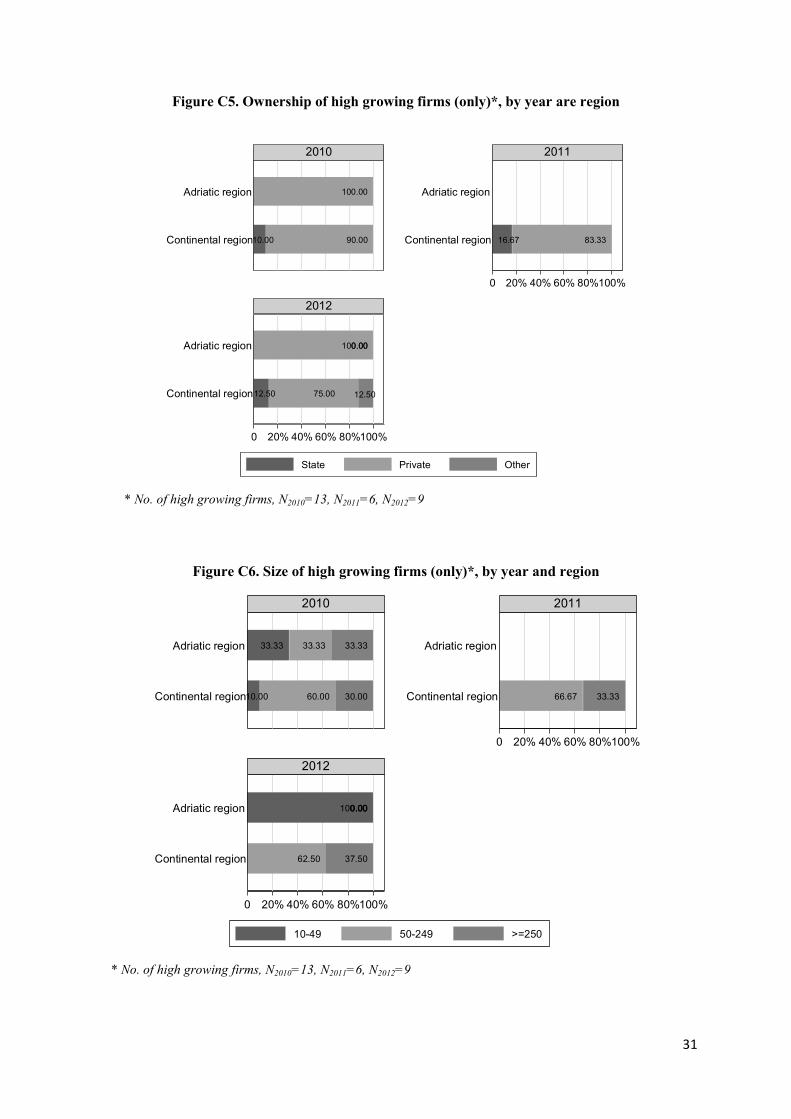
Figure C5. Ownership of high growing firms (only)*, by year are region
* No. of high growing firms, N2010=13, N2011=6, N2012=9
Figure C6. Size of high growing firms (only)*, by year and region
* No. of high growing firms, N2010=13, N2011=6, N2012=9
10.00 90.00
100.00
16.67 83.33
12.50 75.00 12.50
100.000.00
0 20% 40% 60% 80%100%
0 20% 40% 60% 80%100%
Continental region
Adriatic region
Continental region
Adriatic region
Continental region
Adriatic region
2010 2011
2012
State Private Other
10.00 60.00 30.00
33.33 33.33 33.33
66.67 33.33
62.50 37.50
100.000.000.00
0 20% 40% 60% 80%100%
0 20% 40% 60% 80%100%
Continental region
Adriatic region
Continental region
Adriatic region
Continental region
Adriatic region
2010 2011
2012
10-49 50-249 >=250
31

Figure C7. Sector composition (1 digit) of high growing firms (only), by region (2012)
* No. of high growing firms, N2012=9
22%
11%
11%
56%
Total Croatia
13%13%
13%63%
100%
Continental region Adriatic region
By region
Energy ICT
Transport, storage Wholesale, retail
32

Appendix D – Firm decomposition and productivity This section mimics analysis in section 4.3, but uses labor productivity instead of total factor productivity as productivity metric.
Figure D1. Labor productivity change* decomposition by several categories, 2008-2012
Figure D2. Labor productivity change* decomposition by several macro sector categories, 2008-2012
3.00
1.12 0.54
-8.33
-3.67
-10
-50
5
S NSU NBE X Total
(a) Total3.30
-0.31
0.830.29 0.490.05
-7.26
-1.06-2.64
-1.03
-10
-50
5
S NSU NBE X Total
(b) Region
Continental Adriatic
-0.57
2.79
0.78 1.020.10 0.380.16
-0.72
-6.93
-0.67-1.29
-2.75
0.36
-8-6
-4-2
02
S NSU NBE X Total
(c) Ownership
State Private Other
-1.95 -1.78
8.99
0.34 0.50 0.38
-1.43-3.22
-0.88
-2.80 -3.05
-5.38
-1.77
6.52
-50
510
S NSU NBE X Total
(d) Size
0-9 10-49 50-249 >=250
-0.08
0.56
-0.40
0.28
2.35
0.14 0.050.86
0.10 0.21
-0.10-0.53
-7.62
-0.08
0.61
-0.06-0.33
0.48
-4.29
-8-6
-4-2
02
S NSU NBE X Total
(a) Macro sectors (Total)
Agriculture Mining Manufacturing
Electricity Construction Services
1.86
0.73
1.54
-0.95-1.38
0.530.20 0.38
0.20 0.07 0.06
-0.26
-0.94
-4.40
-1.94
1.68
0.07
-2.86
-1.02
-2.89
0.74
-4-2
02
S NSU NBE X Total
(b) Service macro sector groups
KIS,market KIS,high-tech KIS,financial
KIS,other LKIS,market LKIS,other
0.03
-0.02
0.22
0.06
0.10
0.040.01 0.02
-0.27
-0.12-0.13
0.02
-0.28
0.21
-0.02
-.3-.2
-.10
.1.2
S NSU NBE X Total
(c) Manufacturing macro sector groups
High-tech Medium high-tech
Medium low-tech Low-tech
33