Embed Size (px)
Citation preview
Studying Consumption with the Panel Study of Income Dynamics:
Comparisons with the Consumer Expenditure Survey and an Application to
the Intergenerational Transmission of Well-being
Kerwin Kofi Charles, University of Chicago
Sheldon Danziger, University of Michigan
Geng Li, Federal Reserve Board
Robert F. Schoeni, University of Michigan
Population Studies Center Research Report 06-590
_____________ Financial support was received from a grant to the National Poverty Center at the University of Michigan from the Assistant Secretary for Planning and Evaluation, U. S. Department of Health and Human Services. We thank Laurie Pounder and Jonathan Fisher for assisting with the validation of the mapping of UCC codes from the CE into the PSID. We also thank Richard Bavier, Rebecca Blank, Jonathan Fischer, Gary Solon, James Sullivan, and seminar participants at the Bureau of Labor Statistics for comments. Address correspondence to Robert Schoeni, University of Michigan, Institute for Social Research, Ann Arbor, MI 48104; [email protected]. Any views expressed in this paper are those of the authors and not necessarily those of the National Poverty Center or the Federal Reserve Board or other members of its staff.
Studying Consumption with the Panel Study of Income Dynamics: Comparisons with the Consumer Expenditure Survey and an Application to the
Intergenerational Transmission of Well-being Abstract
Beginning in 1999, the Panel Study of Income Dynamics (PSID) added new questions about several categories of consumption expenditure. The PSID now covers items that constitute more than seventy percent of total expenditure measured in the Consumer Expenditure Survey (CE). We show that expenditure for each of the broad categories in the PSID aligns closely with corresponding measures from the CE. Using the new PSID data, we impute total expenditure in the PSID and show that this is also very close to total measured CE expenditure. For several distinct categories and for total consumption, we show that cross-sectional life cycle estimates of household expenditure activity are very similar across the two surveys. Finally, we illustrate the unique research value of the PSID for studying consumption by exploiting the survey’s longitudinal design and genealogical structure to estimate the intergenerational elasticity of consumption expenditure, which is found to be 0.32-0.34.
Studying Consumption with the PSID, Page 1
INTRODUCTION
Consumption is a fundamental concept in economics, figuring prominently in the theoretical literatures of both micro and macroeconomics. Unfortunately, data on consumption have been quite limited. The Consumer Expenditure Survey (CE), which began regular data collection in 1980, is the most widely-used dataset for studying consumption in the U.S. Although many important findings come from analyses of the CE, it was not principally designed for empirical research, but rather as a tool for periodic revision of the Consumer Price Index.
The only other national survey that has consistently collected data on consumption expenditures is the Panel Study of Income Dynamics (PSID).1 Historically, this information was limited to reports about food and housing expenditures. Beginning in 1999, however, the PSID added a series of questions about other expenditures, such as spending on transportation, health care, education, utilities, and child care. Indeed, with the expanded consumption questions, the PSID now covers more than seventy percent of total outlays measured in the CE.
Several PSID design features make it a unique resource for studying particular questions about consumption that cannot be addressed with other surveys. The three most important features are its longitudinal design, the inclusion of parents and siblings of sample respondents, and the extensive array of variables including health, wealth, pensions, income, employment, and family structure.
In this paper, we describe the expanded expenditure data collected in the PSID, outline the questions that have been included in each wave, examine item non-response, and then compare estimates of total expenditures based on the PSID and the CE. We conduct a further assessment of the quality of the PSID expenditure data using the CE as a benchmark. Specifically, we present cross-sectional estimates of life-cycle expenditure patterns – a topic of great interest to economists – from the two surveys. Finally, having demonstrated the quality of the new PSID expenditure data, we illustrate their empirical value by addressing an issue that cannot be addressed with any other national survey: the intergenerational transmission of consumption expenditures. THE DATA: PSID AND CE
The Panel Study of Income Dynamics
The PSID began in 1968 with a sample of roughly 5,000 families, including a low-income over-sample. Individuals in these families and their descendants have been followed ever since, with the sample growing to nearly 10,000 by 1997. Then, because of budget constraints, the sample was trimmed to 6,500 families by dropping roughly two-thirds of the low-income over-sample.
The sample has grown since 1997, with 7,822 families completing interviews in the most recent wave, 2003. Because of consistently high response rates of 95-98 percent, and the fact that the sample is replenished through births and marriage, the PSID, when weighted appropriately, remains representative of the U.S. population (Fitzgerald et al. 1998; Becketti et al. 1997).
Families were interviewed annually from 1968 to 1997, and biannually since 1997. The interview, which averaged 72 minutes in 2003, is completed by telephone for 97 percent of the families and face-to-face for the remaining 3 percent. Expenditures are reported for the family as a whole, where a
1 The 2001 and 2003 Consumption and Activities Mail Surveys, which are supplements to the Health and Retirement Study, consist of comprehensive assessments of expenditures for people 50 and older.
Studying Consumption with the PSID, Page 2
PSID family is defined as a group of people living together as a family. Family members are generally related by blood, marriage, or adoption, but unrelated persons can be part of the same PSID family unit if they permanently reside together and share both income and expenses.
A unique feature of the PSID is its genealogical design. All family members living in households interviewed in 1968 are followed in future waves. When children left their parents’ home or when couples who were married in 1968 separated or divorced, both individuals were followed and continue to be interviewed. In addition, children born to sample members after 1968 inherit the “PSID gene” and are followed as well. As a result, since 1968, interviews have been completed with numerous members of the same extended family, including siblings, parents and adult children, and in some cases grandparents and grandchildren. Therefore, adding questions to even one wave of the PSID allows analyses of the relationship between those variables among various family members.
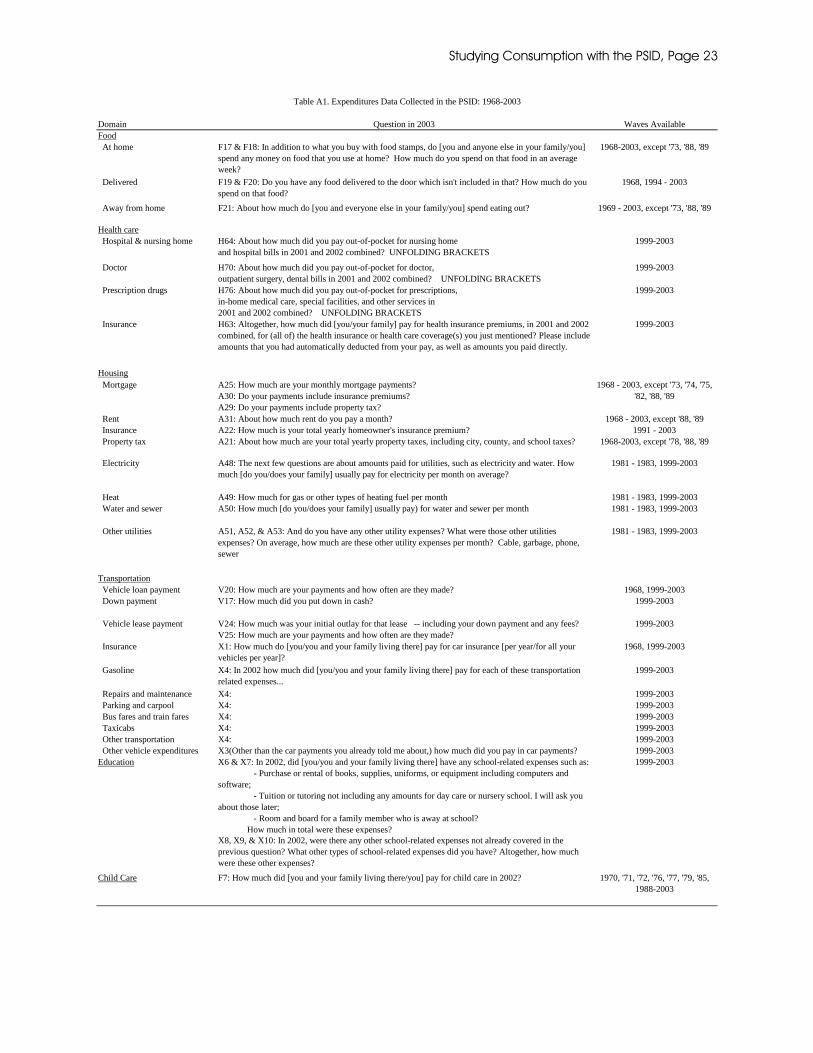
Table A1 reports the spending questions used in the 2003 wave along with an indication of whether the same or a similar question was asked in earlier waves. As mentioned, the PSID included a few expenditure questions from the start. Most notably, spending on food eaten at home (away from home) has been collected in all but three (four) waves. Housing-related expenditures have been included in many waves, with data on mortgage payments collected in all but six years since 1968. Rental payments for housing and property taxes have been included in most waves as well. Utility payments were collected from 1981 to 1983, dropped for 15 years, and then added back in 1999. Child care spending was asked in each wave since 1988, and in several earlier years.
In 1999, questions on expenditures were expanded. Four questions on out-of-pocket spending for health care were added: hospital and nursing home, doctor visits, prescription drugs, and insurance premiums.2 Assessments of educational expenses included payments for tuition, books, supplies, and room and board. Transportation-related expenses included vehicle loan and lease payments, vehicle down payments, vehicle insurance payments, gasoline, repairs and maintenance, parking, bus fares, and taxicabs.
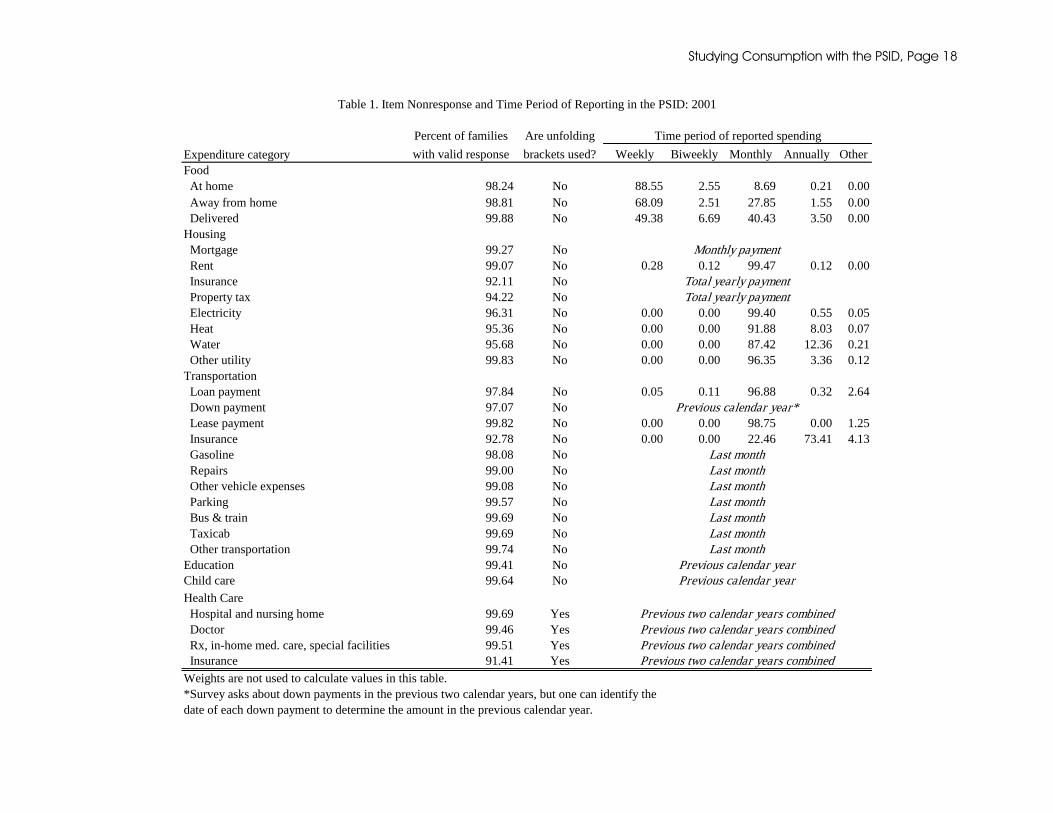
The time period over which PSID expenditure data are reported – i.e., weekly, monthly, yearly -- varies across spending categories (Table 1). Moreover, even when a preferred time period is stated in the question, respondents are usually allowed to report spending over alternative periods if it facilitates recall. For food at home, respondents are asked to report the amount they currently spend in an average week, although they are allowed to report annual or monthly amounts. Because the question stem states “average week,” 89 percent of respondents report a weekly amount (Table 1). Spending on food delivered and food away from home are asked right after the question about food at home, but the stem does not suggest that the report be for an average week. As a result, a smaller share of families reports these categories in weekly amounts: 49 and 68 percent, respectively.
Education and child care spending are reported on an annual basis for the previous calendar year (i.e., in the 2003 interview, respondents report spending for calendar year 2002), while health care spending is reported for the previous two calendar years combined. Most housing and transportation 2 Unfolding brackets are extensively used in the PSID wealth questions and it has been found that they reduce item non-response substantially (Juster and Smith, 1997). The health care expenditure questions added in 1999 also offer respondents unfolding brackets. For example, if when asked the amount spent on prescription drugs the respondent says they do not know, they are asked “Would it amount to $5,000 or more?” If they say yes, then they are asked in subsequent questions whether it is more than $10,000, and then more than $20,000. If they say no, then they are asked in subsequent questions whether it was more than $1,000, and then more than $500. If they continue to respond “don’t know,” the question series is terminated.
Studying Consumption with the PSID, Page 3
expenses refer to current spending, where the time period is not explicitly mentioned in the question. Housing and transportation-related expenses are typically reported for an average month. Home and vehicle insurance and property taxes are the exception, with respondents asked to report annual spending because these payments are not typically made on a monthly basis.
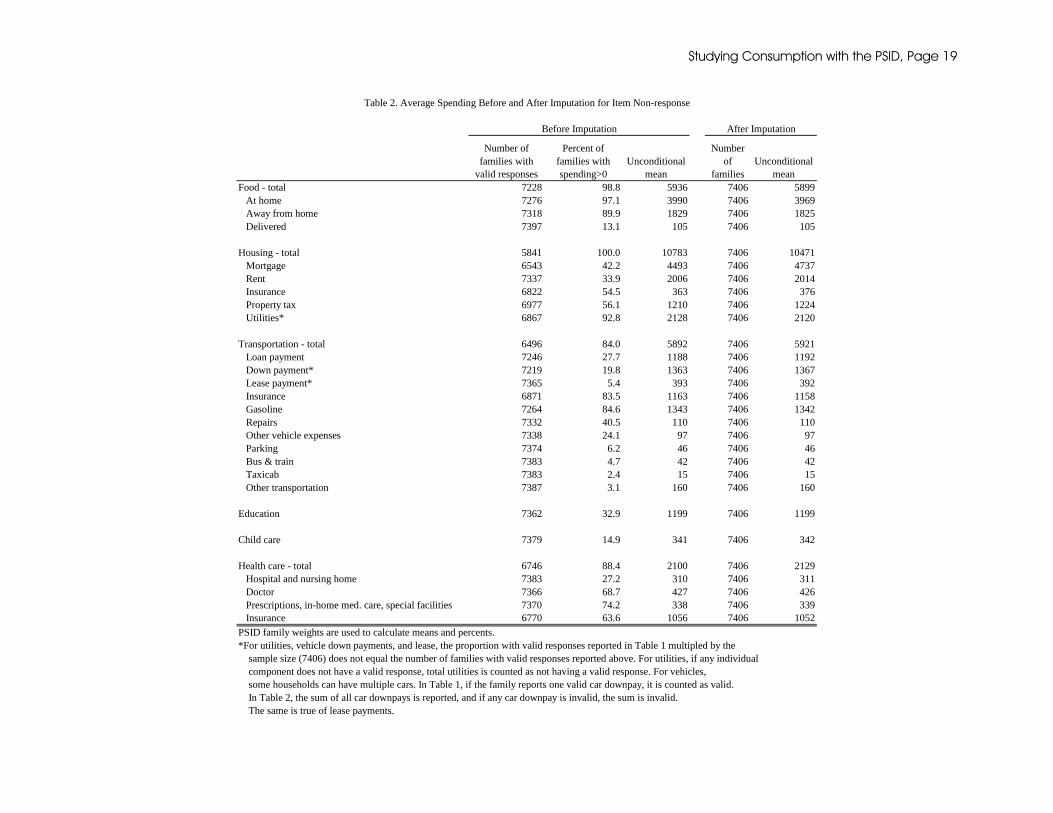
Item non-response is low in the PSID (Table 1). In most categories, less than 1-2 percent of families did not report a valid response to a given spending question. Non-response was highest for insurance payments – both housing and health – at 7-8 percent. For food, the most common expenditure item, 1.8 percent had invalid responses for food at home, while 1.2 percent had invalid responses for food eaten away from home.3
The Consumer Expenditure Survey
The CE consists of two surveys—the quarterly interview survey (IS) and the diary survey (DS)—that provide data on the buying habits of consumers, including expenditures, income, and basic demographic characteristics. (See U.S. Department of Labor, 2003b for a detailed description.) The DS collects information on all spending in each day for two consecutive one-week periods, focusing on frequently-purchased items such as food, tobacco, and personal care products. The IS, conducted in person, consists of five interviews three months apart; the key expenditure data are collected in the last four interviews, covering a 12 month period. In both the DS and IS expenditures are reported for the “consumer unit.”4 The sample frame includes the non-institutionalized population, which is comparable to the PSID.
In this paper, we compare the PSID with the IS. Since the first quarter of 1999, the IS has interviewed 7,000 to 8,000 households each quarter, with respondents reporting spending during the previous 3 months. The IS measures 578 separate categories at the Universal Classification Code (UCC) level, covering an estimated 95 percent of total spending, with spending on nonprescription drugs, household supplies, and personal care items excluded (U.S. Department of Labor, 2003). The response rate in the CE was 80 percent in 2000 (U.S. Department of Labor, Bureau of Labor Statistics, 2003a, page 247).
The focus of this paper is on expenditures, not consumption. Therefore, the value of durables is not converted into a flow of services received. The central purpose is to compare reports of expenditures in the PSID with those in the CE. Note, however, that the conventional method for imputing consumption is to apply a linear transformation to the stock of durable goods. Although durable good stocks are not the focus of either the PSID or CE, if expenditure outlays on durables are similar across the two surveys, it is likely that the stock of durables would be similar across surveys as well, were those stocks measured.
3 Over all three waves of data combined, fifteen cases had values for expenditures in one category that were several orders of magnitude larger than the average spending across all families for the given category. In these cases, the value was assumed to be invalid and it was imputed using the same approach that was used for item nonresponse described below. 4 A consumer unit is defined as: (1) all members of a particular household who are related by blood, marriage, adoption, or other legal arrangements; (2) a person living alone or sharing a household with others or living as a roomer in a private home or lodging house or in permanent living quarters in a hotel or motel, but who is financially independent; or (3) two or more persons living together who use their income to make joint expenditure decisions. Financial independence is determined by three major expense categories: housing, food, and other living expenses. To be considered financially independent, at least two of the three major expense categories have to be provided entirely, or in part, by the respondent.
Studying Consumption with the PSID, Page 4
A COMPARISON OF EXPENDITURES IN THE PSID AND CE
To conduct our comparison, we annualized all reported consumption expenditure in both the PSID and the CE. For the PSID, if an amount is reported for a time period of less than one year, we inflate it by the inverse of the fraction of the year for which the report covers. If the report is for more than one year, we deflate the amount assuming that spending was uniform across the period. For the CE, we follow the procedures provided by the BLS to calculate the weighted mean.5
There are many reasonable alternative approaches for imputing values for families with item non-response. However, given PSID’s low rate of non-response, estimates of spending are relatively insensitive to the imputation strategy. Table 2 reports average PSID spending for each category when the missing data are dropped (implicitly assuming that spending for families with item non-response is equal to the average among families who responded), and when the missing data are imputed using a model that includes a third order polynomial in age, and an unrestricted spline for family size. The imputation models were fit separately for each expenditure category listed in Table 2 using ordinary least squares.
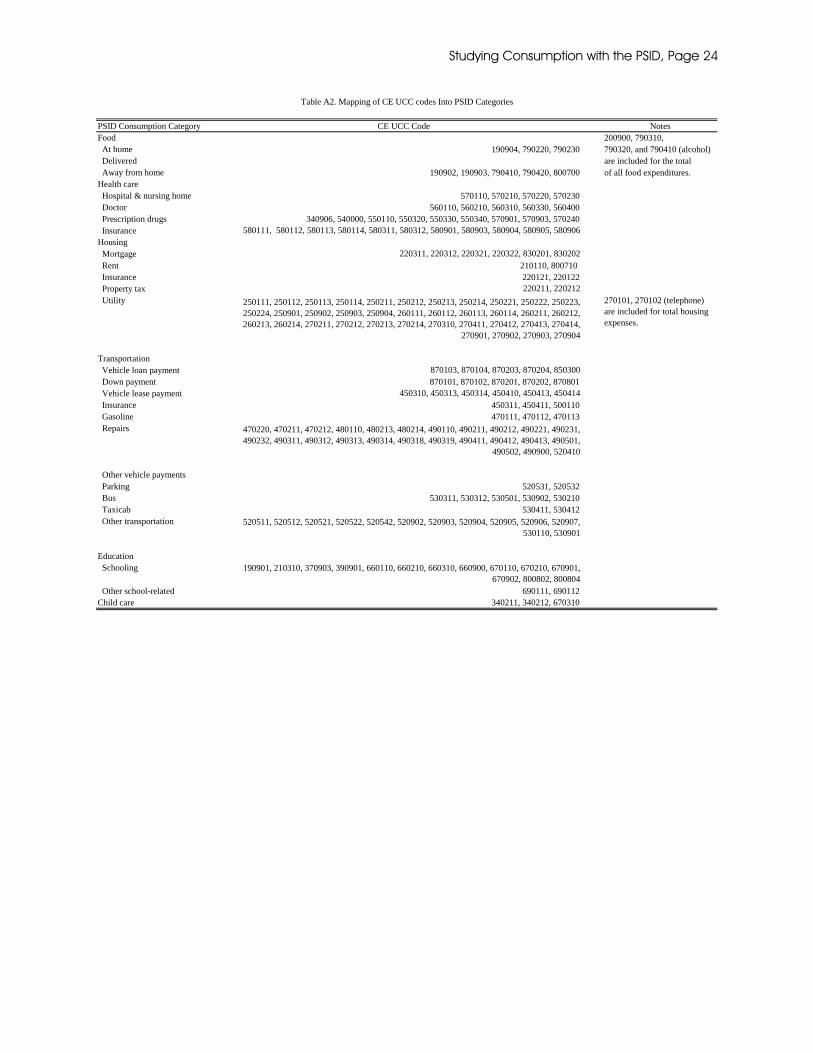
Because the CE measures many more spending categories than the PSID, the CE categories, i.e., UCC codes, were mapped into the PSID categories. The mapping is provided in Table A2. The cross-walk was determined by having two coders independently map the UCC codes into the PSID categories. Differences were reconciled through close inspection of each UCC.
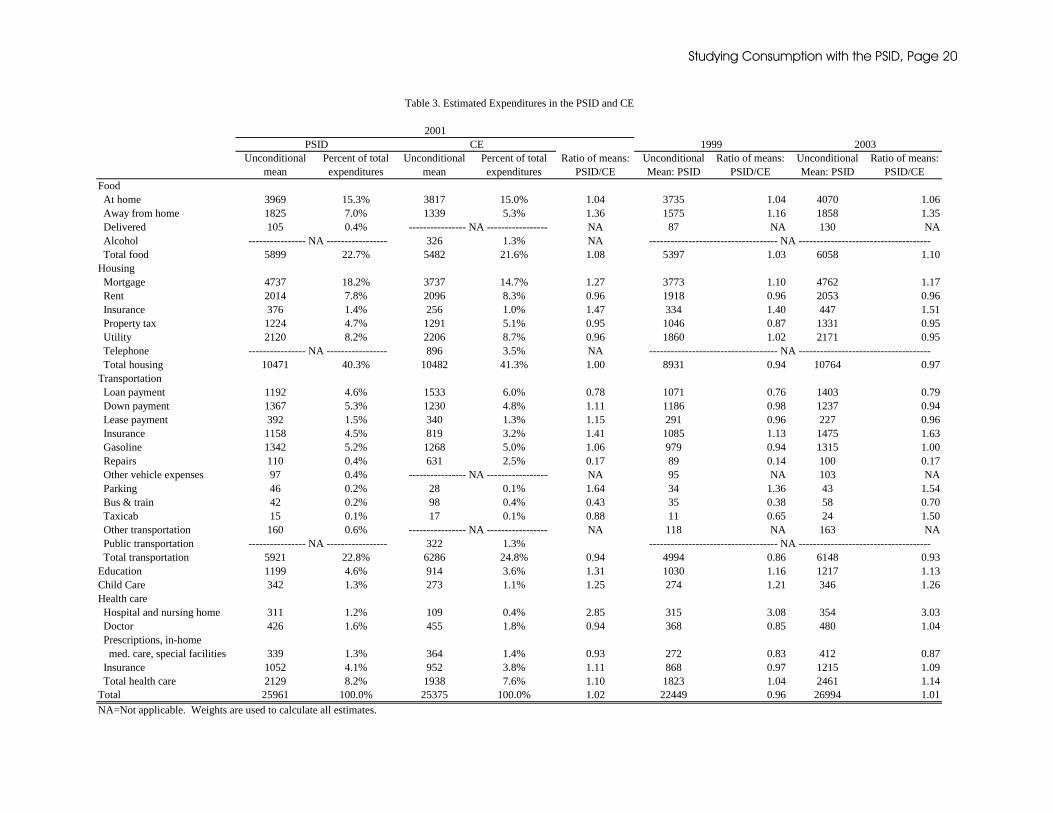
Average spending for the PSID and the CE in 2001 – for each PSID category– is reported in the first columns of Table 3; subsequent columns report comparisons for 1999 and 2003. Estimates for specific subcategories disagree significantly in some cases, most likely due to misallocation of spending into narrowly-defined categories. For example, food away from home is 32 percent higher in the PSID than the CE.
These discrepancies aside, total spending in each major category aligns fairly closely across the two surveys, especially considering differences in survey design. For example in 2001 (column 5, Table 3) comparing the PSID to the CE, spending on total food is 8 percent higher, total housing aligns exactly, and total transportation spending is 6 percent lower. These three categories account for 86 percent of spending measured in the PSID. The gap is larger for health care spending, education, and child care, with the PSID finding higher amounts in each case. Combining all PSID categories, spending totals $25,961, 2 percent greater than CE spending for these categories. Estimates for 1999 and 2003 are fairly similar, with the PSID 4 percent lower in 1999 and 1 percent higher in 2003.
The PSID spending categories total $25,961 as measured by the CE, which accounts for 72 percent of total spending measured across all CE categories, including those not collected in the PSID (not shown in tables). This 28 percent spending gap falls largely into five categories not measured in the PSID: home repairs and maintenance ($1,200 in the 2001 CE), household furnishing and equipment ($1,400), clothing and apparel ($1,300), trips and vacations ($1,300), and recreation and entertainment ($1,200). These categories were not asked in the PSID, even in the expanded set of questions in 1999, 2001, and 2003. To capture spending on these items, questions were added in the 2005 wave, with the goal of having the PSID obtain a nearly comprehensive measurement of expenditures from 2005 onwards.
5 Due to the evolving structure of the CE sample design, the weight assigned to each consumer unit changes over quarters. Therefore, the annual weighted mean is computed by adding four quarterly weighted means together. For details, see U.S. Department of Labor, 2003.
Studying Consumption with the PSID, Page 5
Life-Cycle Expenditure Profiles
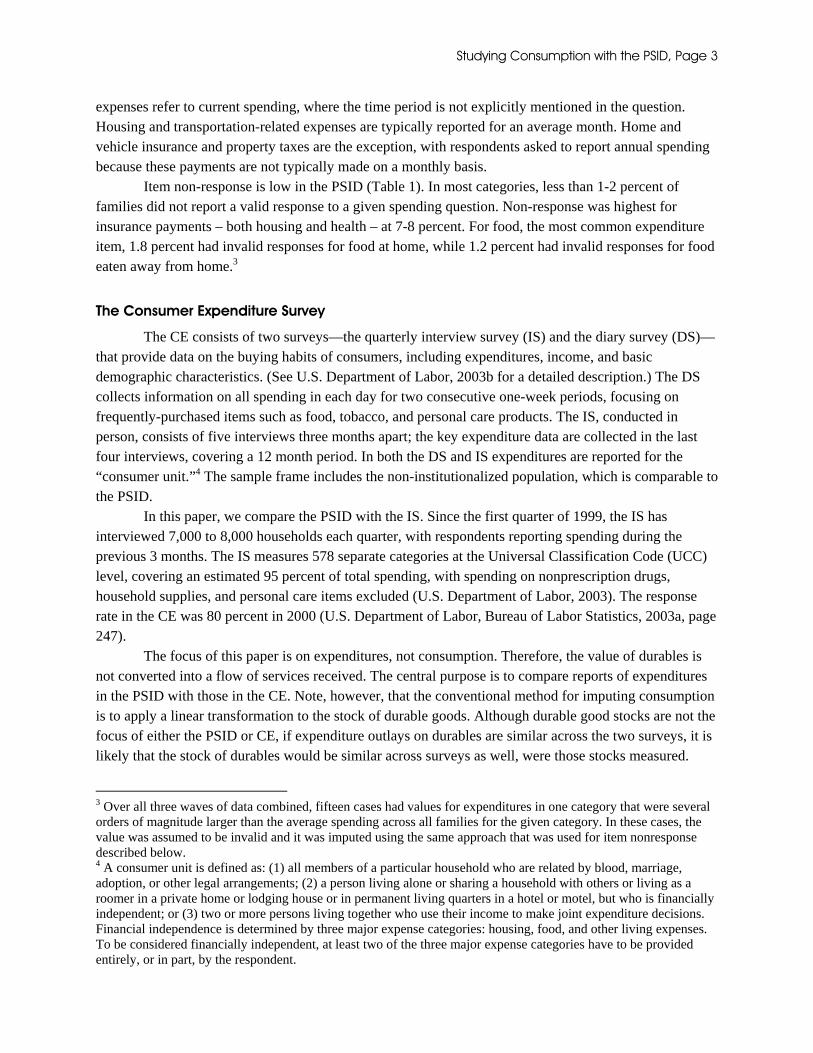
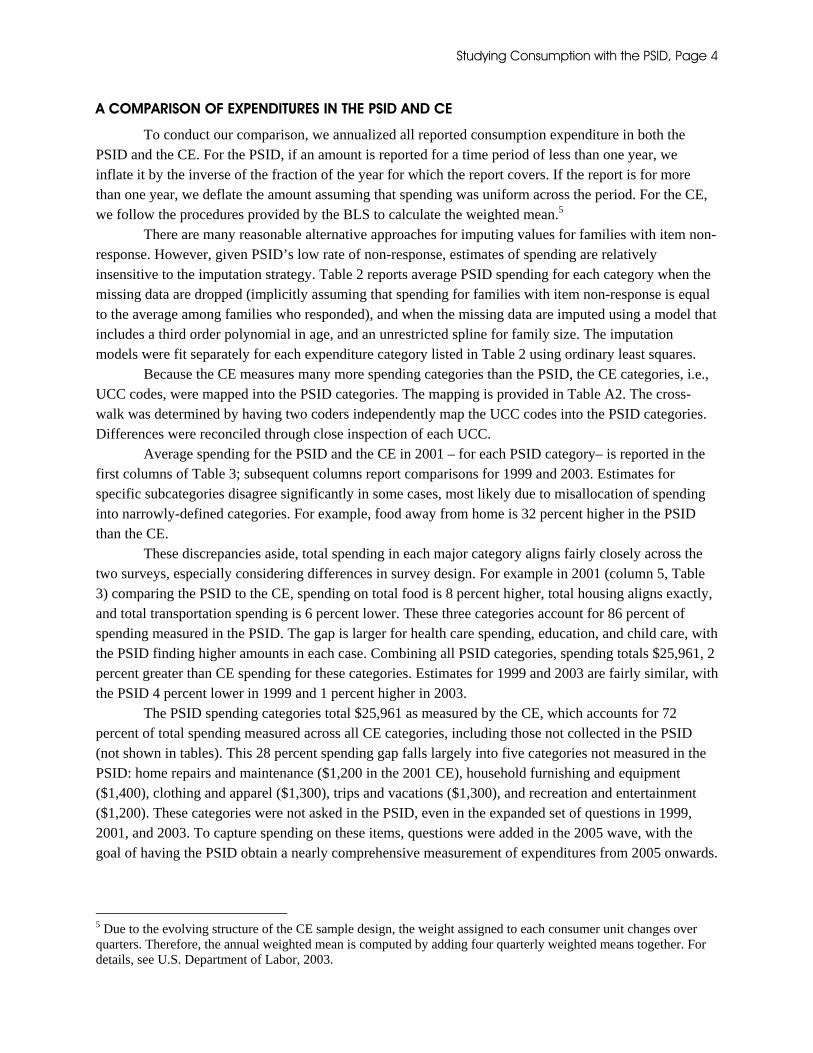
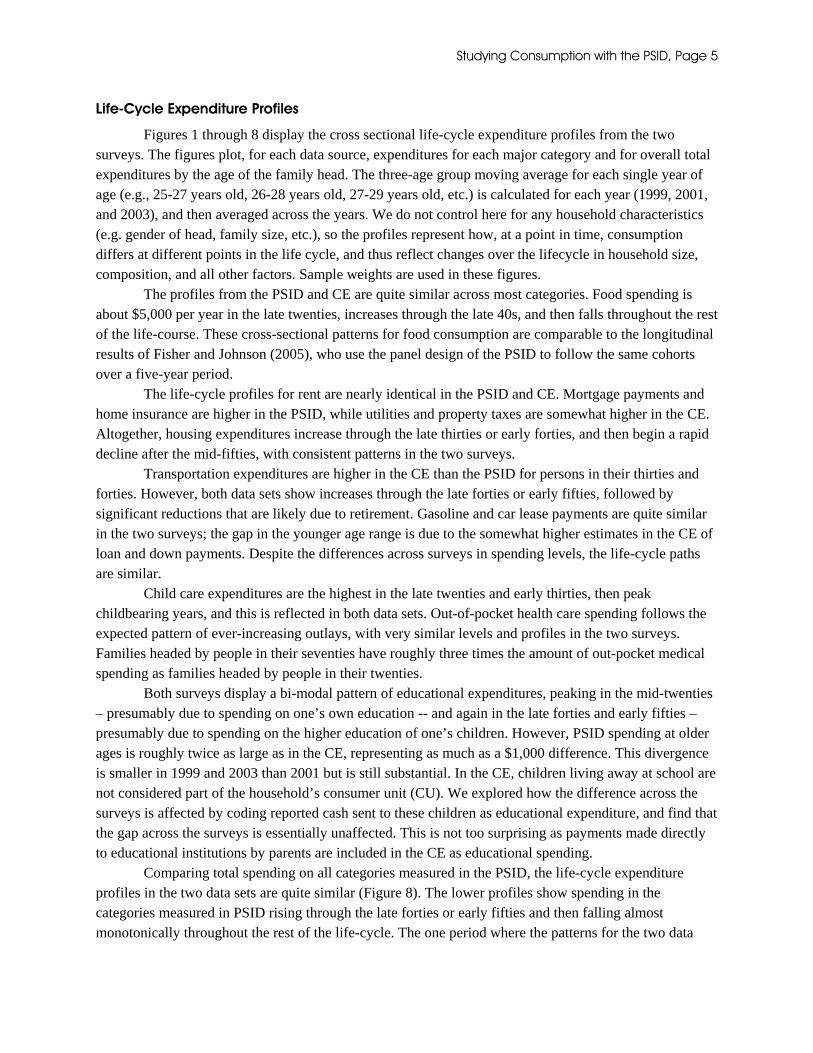
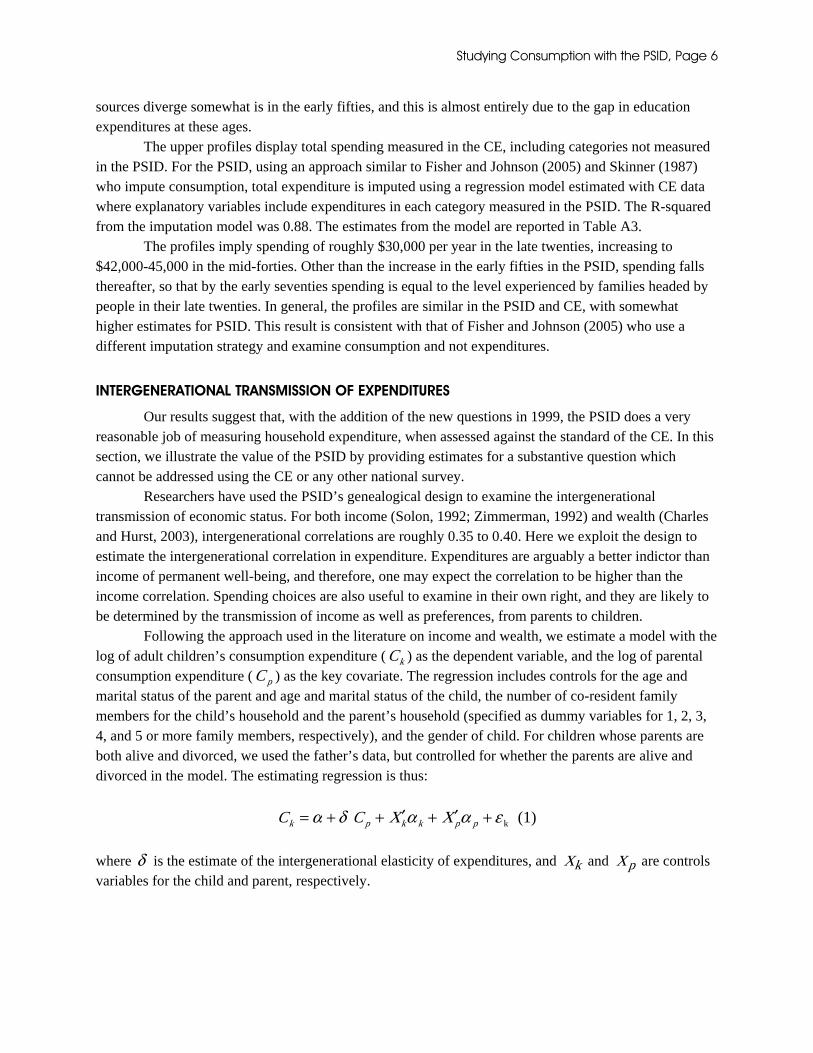
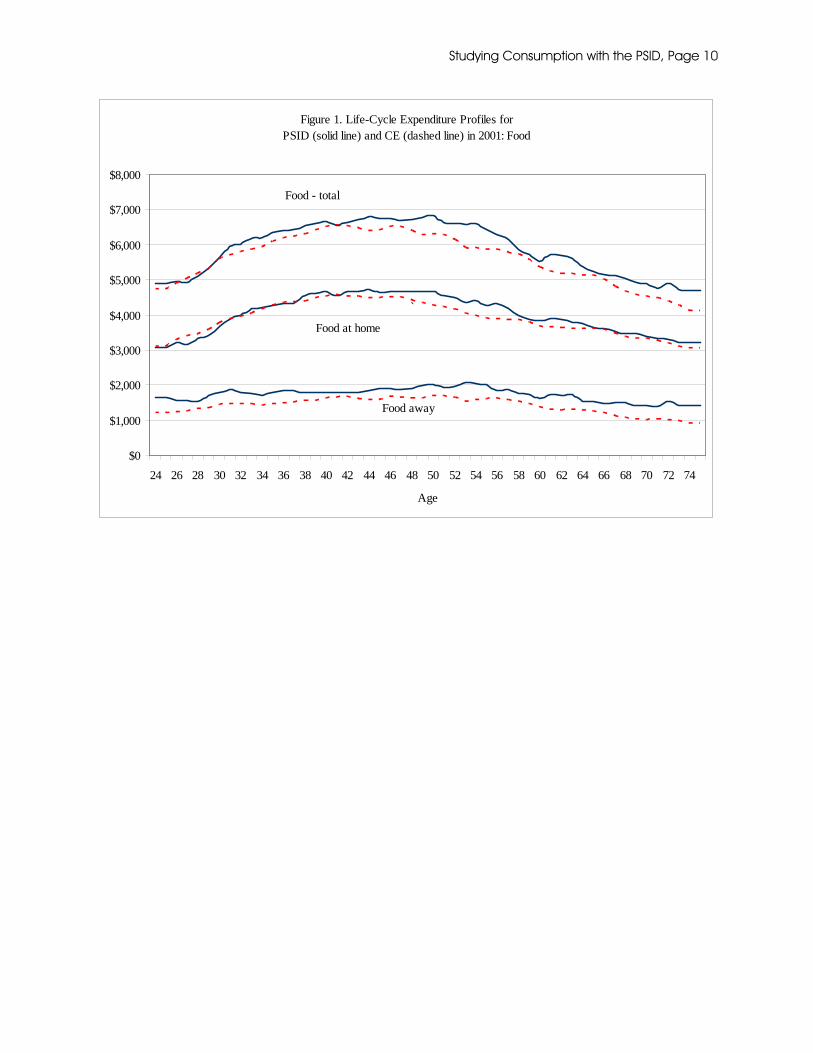
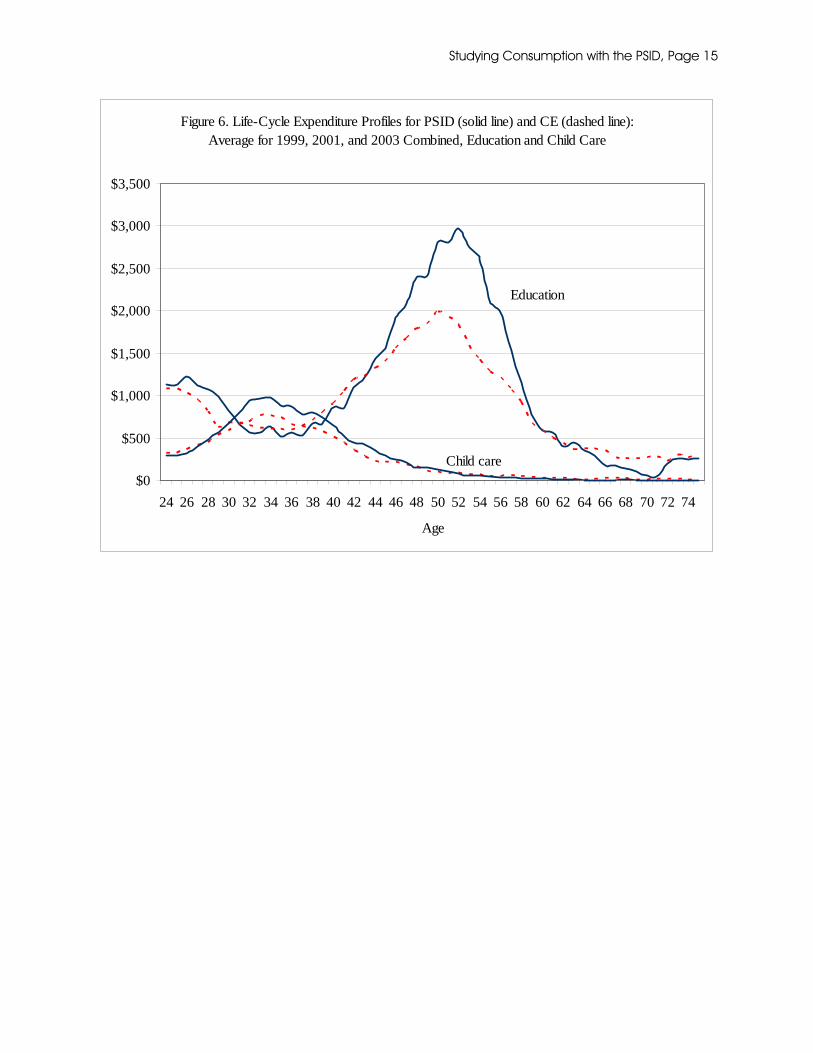
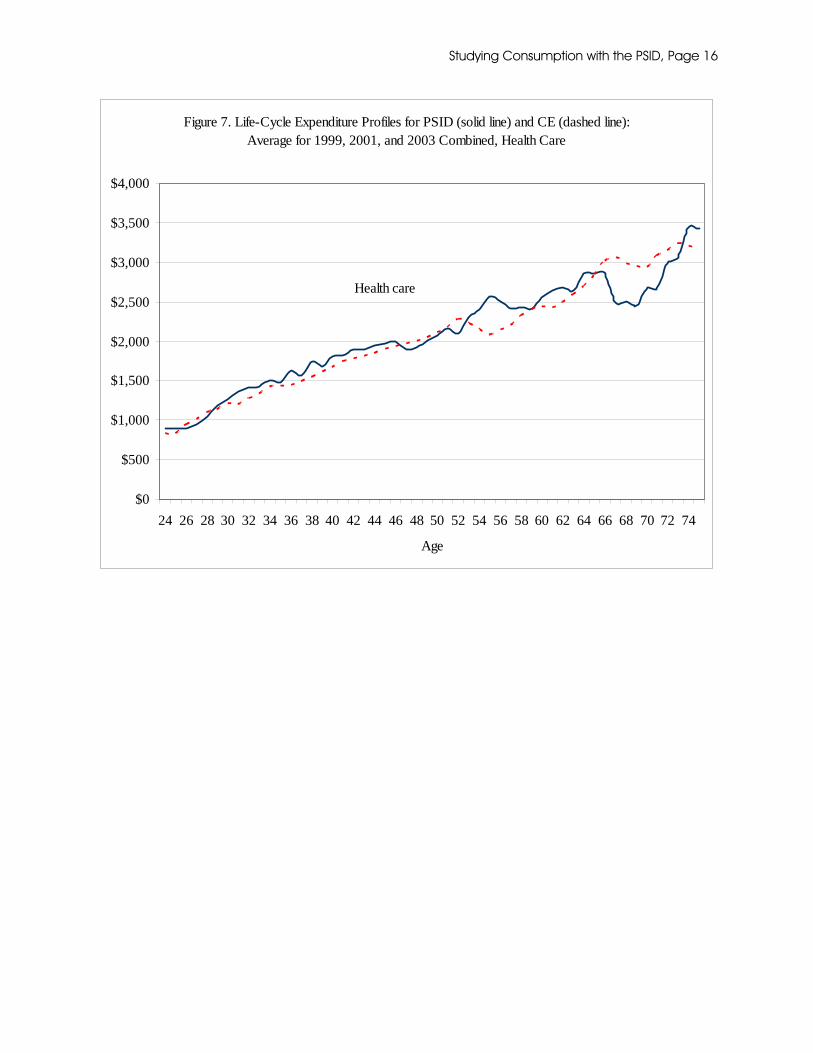
Figures 1 through 8 display the cross sectional life-cycle expenditure profiles from the two surveys. The figures plot, for each data source, expenditures for each major category and for overall total expenditures by the age of the family head. The three-age group moving average for each single year of age (e.g., 25-27 years old, 26-28 years old, 27-29 years old, etc.) is calculated for each year (1999, 2001, and 2003), and then averaged across the years. We do not control here for any household characteristics (e.g. gender of head, family size, etc.), so the profiles represent how, at a point in time, consumption differs at different points in the life cycle, and thus reflect changes over the lifecycle in household size, composition, and all other factors. Sample weights are used in these figures.
The profiles from the PSID and CE are quite similar across most categories. Food spending is about $5,000 per year in the late twenties, increases through the late 40s, and then falls throughout the rest of the life-course. These cross-sectional patterns for food consumption are comparable to the longitudinal results of Fisher and Johnson (2005), who use the panel design of the PSID to follow the same cohorts over a five-year period.
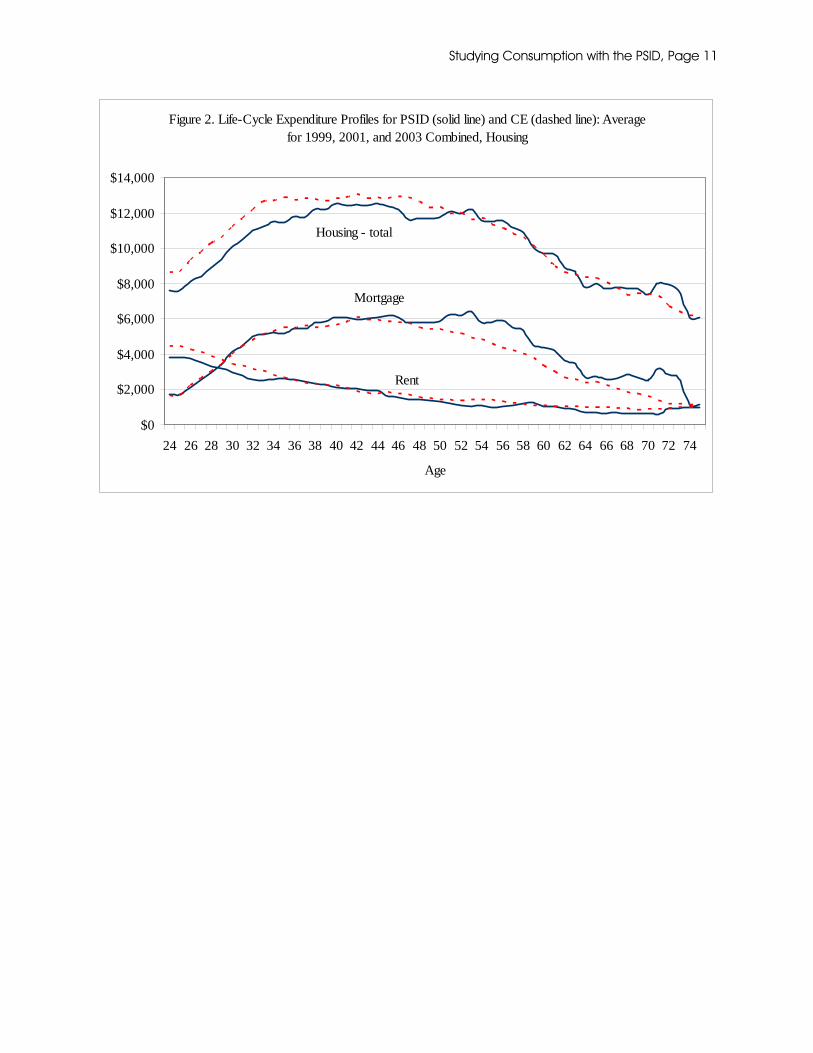
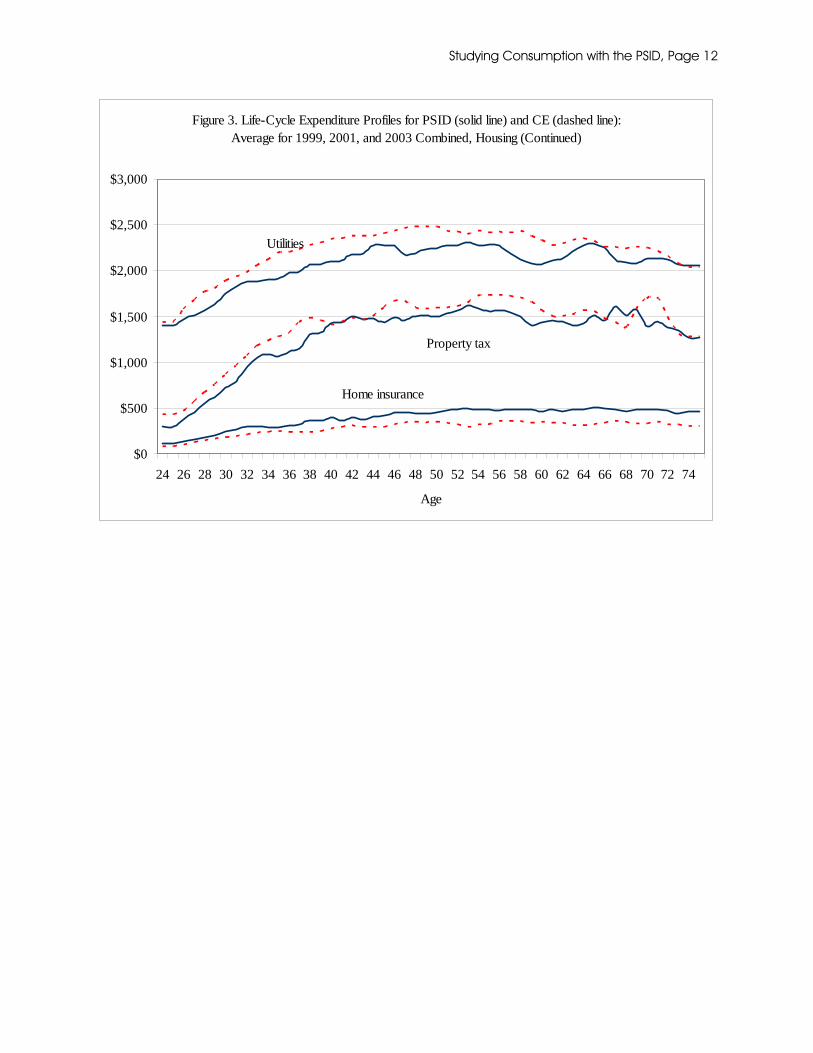
The life-cycle profiles for rent are nearly identical in the PSID and CE. Mortgage payments and home insurance are higher in the PSID, while utilities and property taxes are somewhat higher in the CE. Altogether, housing expenditures increase through the late thirties or early forties, and then begin a rapid decline after the mid-fifties, with consistent patterns in the two surveys.
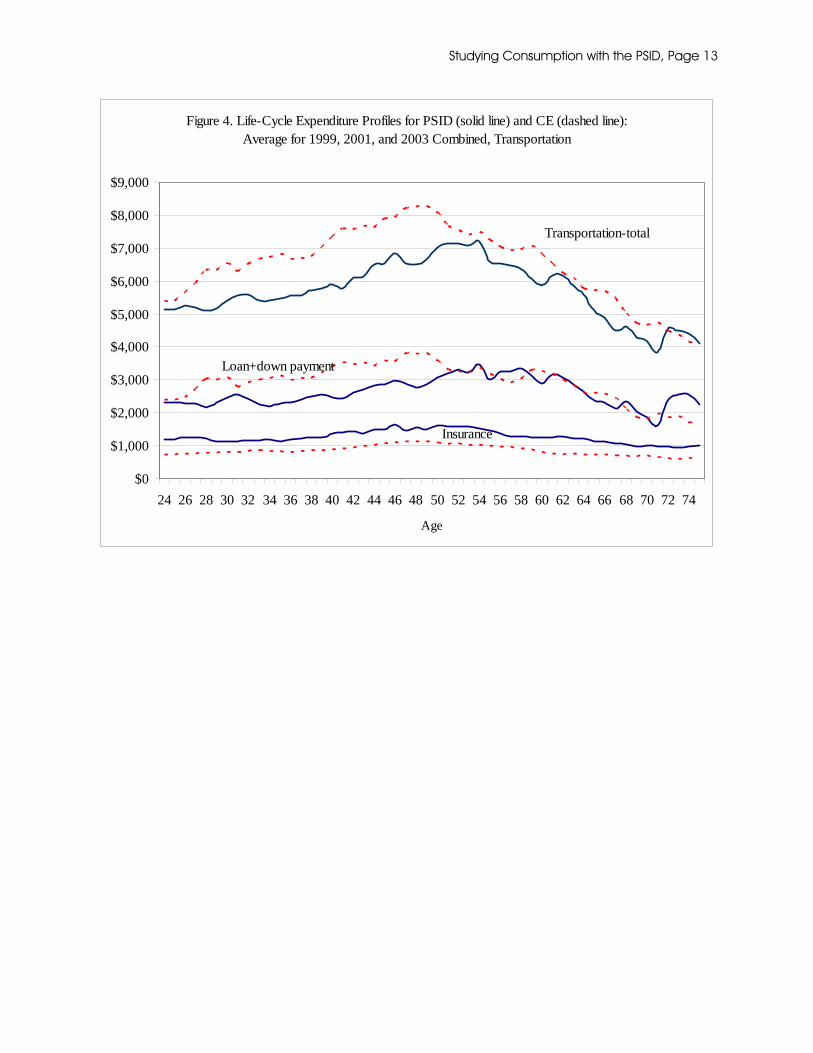
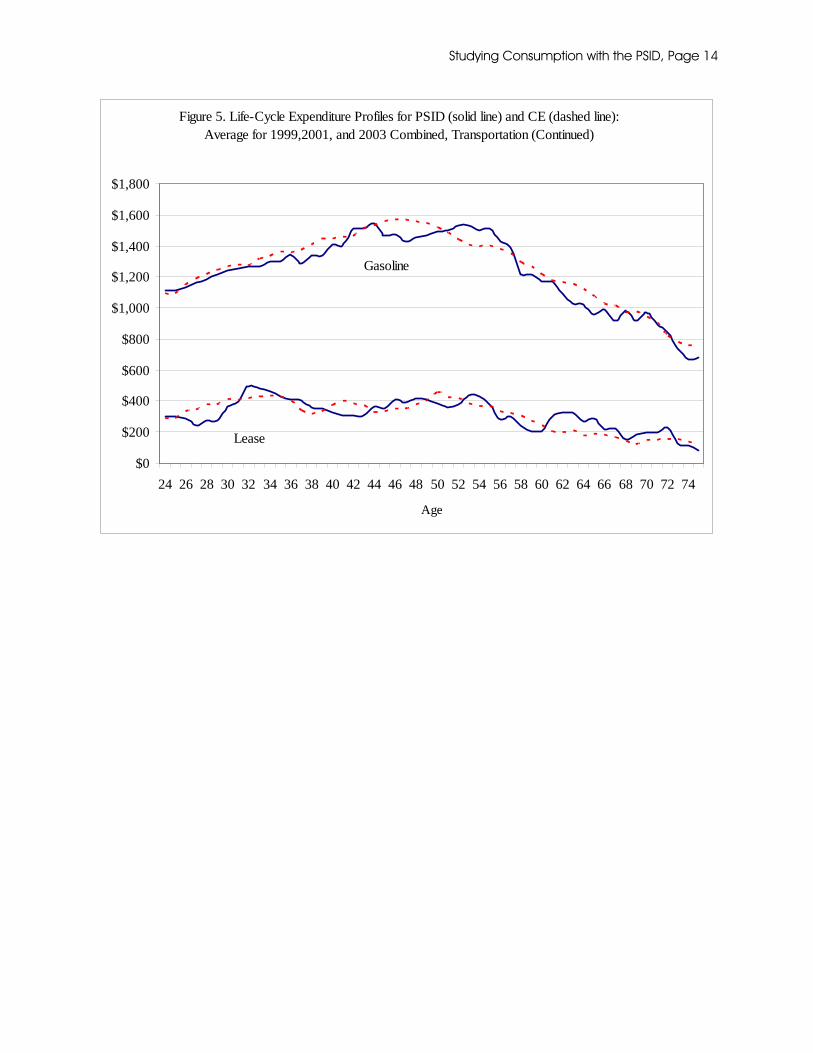
Transportation expenditures are higher in the CE than the PSID for persons in their thirties and forties. However, both data sets show increases through the late forties or early fifties, followed by significant reductions that are likely due to retirement. Gasoline and car lease payments are quite similar in the two surveys; the gap in the younger age range is due to the somewhat higher estimates in the CE of loan and down payments. Despite the differences across surveys in spending levels, the life-cycle paths are similar.
Child care expenditures are the highest in the late twenties and early thirties, then peak childbearing years, and this is reflected in both data sets. Out-of-pocket health care spending follows the expected pattern of ever-increasing outlays, with very similar levels and profiles in the two surveys. Families headed by people in their seventies have roughly three times the amount of out-pocket medical spending as families headed by people in their twenties.
Both surveys display a bi-modal pattern of educational expenditures, peaking in the mid-twenties – presumably due to spending on one’s own education -- and again in the late forties and early fifties – presumably due to spending on the higher education of one’s children. However, PSID spending at older ages is roughly twice as large as in the CE, representing as much as a $1,000 difference. This divergence is smaller in 1999 and 2003 than 2001 but is still substantial. In the CE, children living away at school are not considered part of the household’s consumer unit (CU). We explored how the difference across the surveys is affected by coding reported cash sent to these children as educational expenditure, and find that the gap across the surveys is essentially unaffected. This is not too surprising as payments made directly to educational institutions by parents are included in the CE as educational spending.
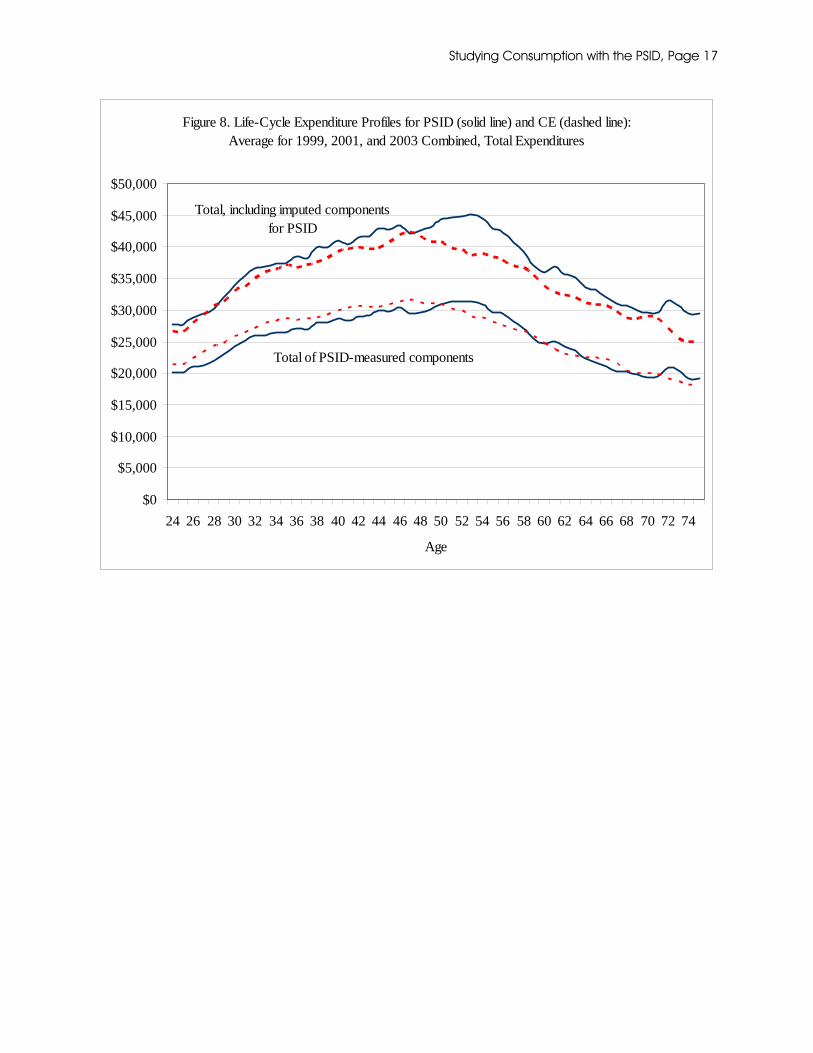
Comparing total spending on all categories measured in the PSID, the life-cycle expenditure profiles in the two data sets are quite similar (Figure 8). The lower profiles show spending in the categories measured in PSID rising through the late forties or early fifties and then falling almost monotonically throughout the rest of the life-cycle. The one period where the patterns for the two data
Studying Consumption with the PSID, Page 6
sources diverge somewhat is in the early fifties, and this is almost entirely due to the gap in education expenditures at these ages.
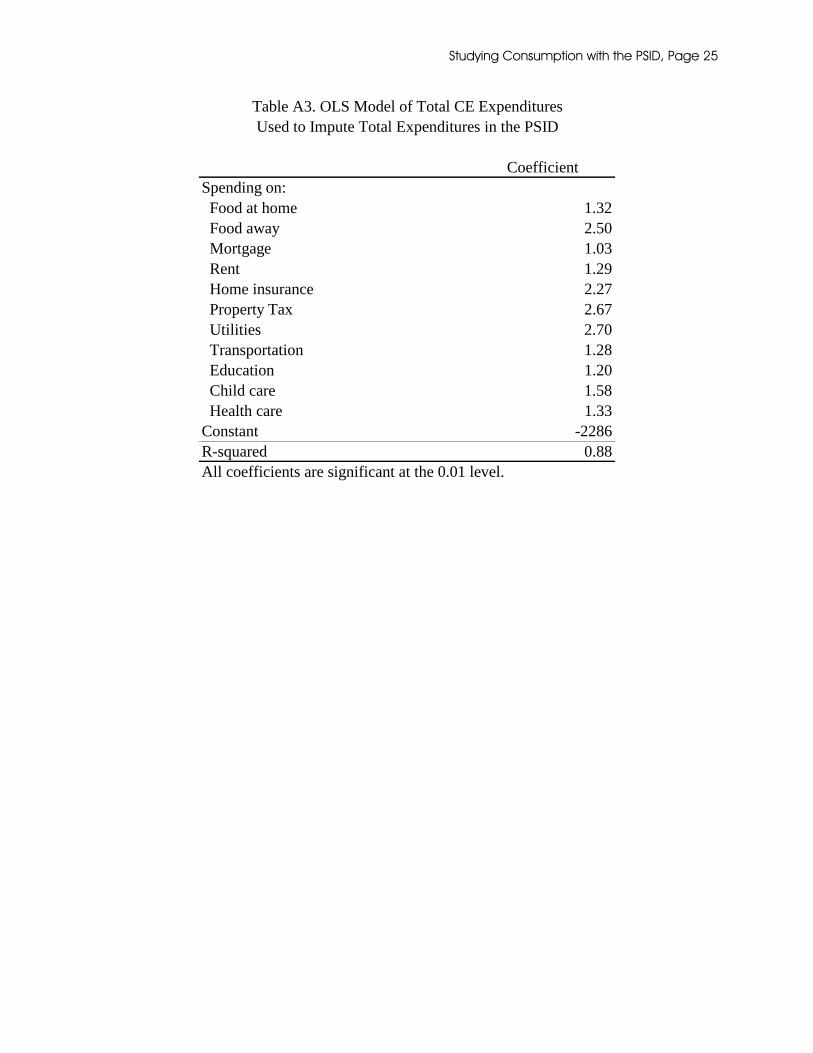
The upper profiles display total spending measured in the CE, including categories not measured in the PSID. For the PSID, using an approach similar to Fisher and Johnson (2005) and Skinner (1987) who impute consumption, total expenditure is imputed using a regression model estimated with CE data where explanatory variables include expenditures in each category measured in the PSID. The R-squared from the imputation model was 0.88. The estimates from the model are reported in Table A3.
The profiles imply spending of roughly $30,000 per year in the late twenties, increasing to $42,000-45,000 in the mid-forties. Other than the increase in the early fifties in the PSID, spending falls thereafter, so that by the early seventies spending is equal to the level experienced by families headed by people in their late twenties. In general, the profiles are similar in the PSID and CE, with somewhat higher estimates for PSID. This result is consistent with that of Fisher and Johnson (2005) who use a different imputation strategy and examine consumption and not expenditures.
INTERGENERATIONAL TRANSMISSION OF EXPENDITURES
Our results suggest that, with the addition of the new questions in 1999, the PSID does a very reasonable job of measuring household expenditure, when assessed against the standard of the CE. In this section, we illustrate the value of the PSID by providing estimates for a substantive question which cannot be addressed using the CE or any other national survey.
Researchers have used the PSID’s genealogical design to examine the intergenerational transmission of economic status. For both income (Solon, 1992; Zimmerman, 1992) and wealth (Charles and Hurst, 2003), intergenerational correlations are roughly 0.35 to 0.40. Here we exploit the design to estimate the intergenerational correlation in expenditure. Expenditures are arguably a better indictor than income of permanent well-being, and therefore, one may expect the correlation to be higher than the income correlation. Spending choices are also useful to examine in their own right, and they are likely to be determined by the transmission of income as well as preferences, from parents to children.
Following the approach used in the literature on income and wealth, we estimate a model with the log of adult children’s consumption expenditure ( kC ) as the dependent variable, and the log of parental consumption expenditure ( pC ) as the key covariate. The regression includes controls for the age and marital status of the parent and age and marital status of the child, the number of co-resident family members for the child’s household and the parent’s household (specified as dummy variables for 1, 2, 3, 4, and 5 or more family members, respectively), and the gender of child. For children whose parents are both alive and divorced, we used the father’s data, but controlled for whether the parents are alive and divorced in the model. The estimating regression is thus:
(1) kεααδα +′+′++= ppkkpk XXCC
where δ is the estimate of the intergenerational elasticity of expenditures, and kX and pX are controls variables for the child and parent, respectively.
Studying Consumption with the PSID, Page 7
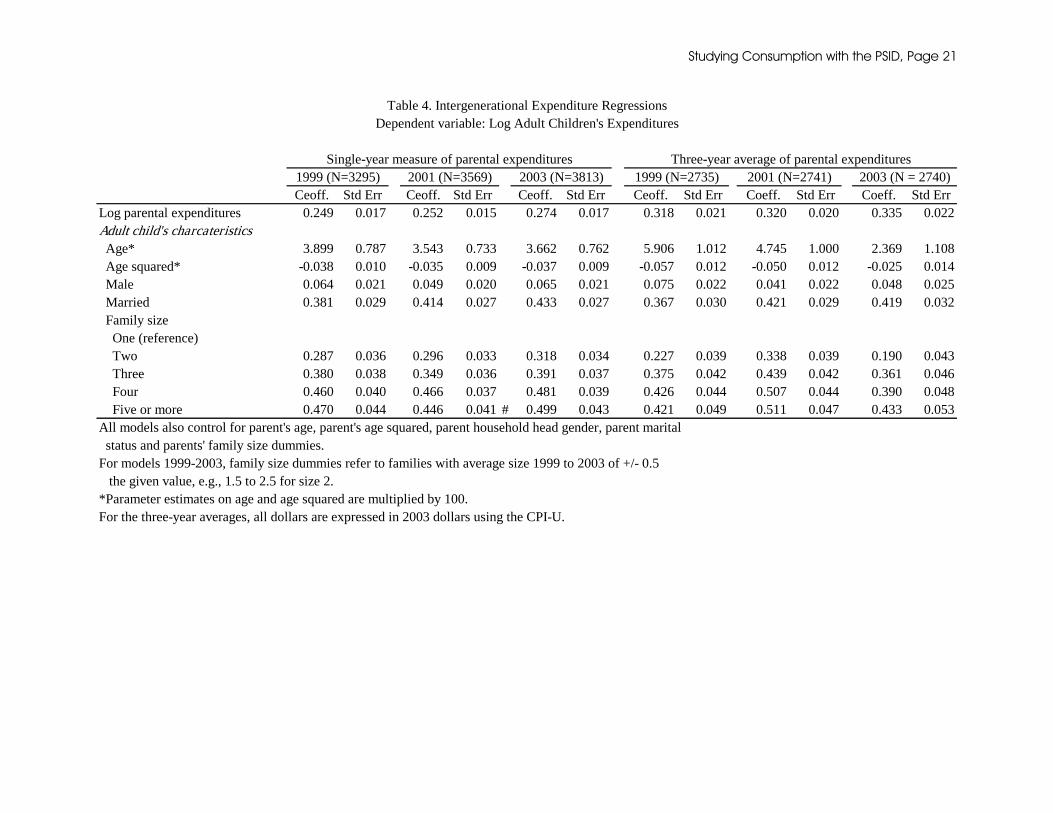
Estimates are calculated for two measures: total spending measured in the 1999, 2001, and 2003 PSID ( PSIDC ), and total spending that includes the amount imputed because it is not assessed in the PSID ( TotalC ). Table 4 reports estimates for the former, but estimates of the latter are very similar (available on request).
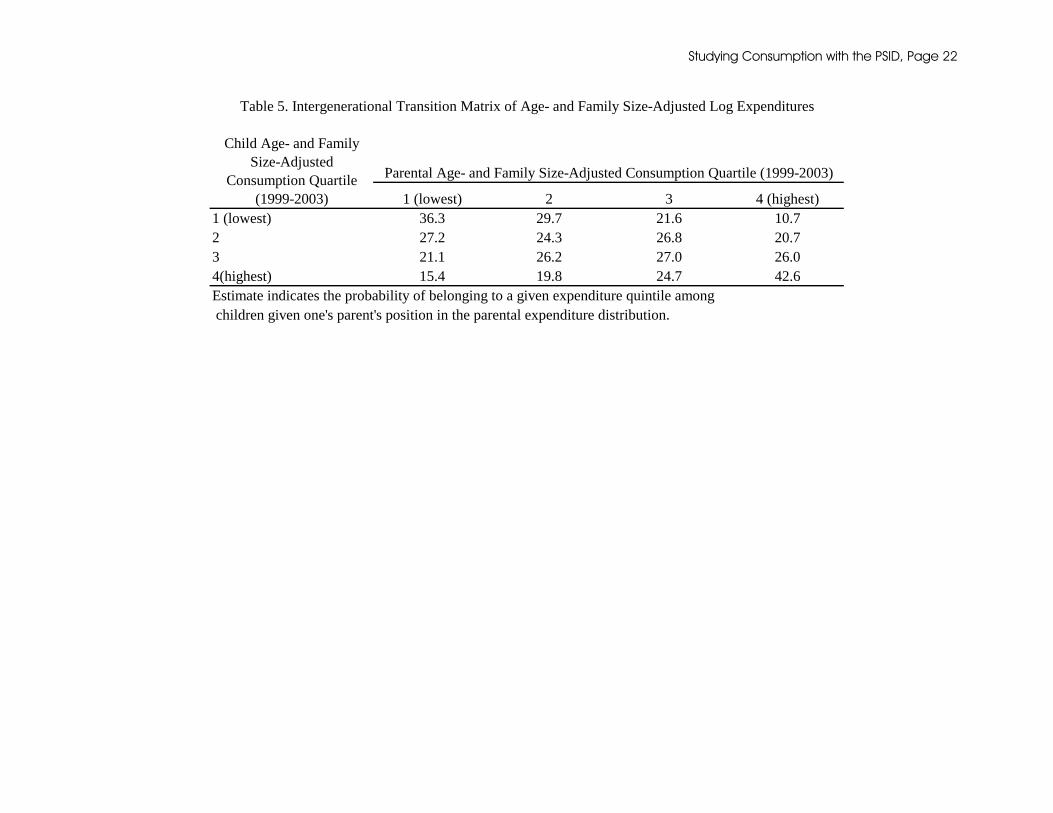
The literature on the estimation of intergenerational correlations suggests that estimates of the relevant parameter,δ , might be biased downwards because of measurement error (Solon, 1992). To address that concern, we estimate regressions in which parental expenditure, pC , is measured as the average over three waves (1999, 2001, and 2003). The intergenerational elasticity in PSIDC for a single year ranges from 0.25 to 0.27, which is similar to the single year elasticity in earnings (Solon, 1992). Averaging over multiple years increases the correlation to 0.32 to .34, or as much as nine percentage points, which is similar in magnitude to the increase in intergenerational correlation in earnings when averaging is used (Solon, 1992).6,7 An alternative approach is to estimate the probability that adult children fall into various percentiles in the expenditure distribution among adult children given one’s parent’s place in the parental consumption distribution. For the sample of children and parents in each year, spending is regressed on age (specified as a cubic) and family size (specified as dummy variables as in equation 1). The residuals from this regression are ranked and children are identified as falling into one of the age- and family-size adjusted spending quartiles among adult children. The same procedure is conducted to find the parent’s place within the parental spending distribution. A cross-tabulation of the quartiles in which children belong and the quartile in which the parent belongs provides estimates of quartile-specific mobility.
Results are presented in Table 5, where the residuals for the three years are first averaged for each family and then ranked. Among children whose parents are in the top quartile, 42.6 percent are themselves in the top quartile (Table 5). At the other end of the distribution, among children whose parents are in the lowest quartile, 36.3 percent are themselves in the lowest quartile. Furthermore, the degree of upward and downward mobility is similar; while 15.4 percent of children with the lowest-spending parents are in the highest quartile, 10.7 percent of the children with the highest-spending parents are in the lowest quartile. In sum, it is unlikely that consumption by a family in one generation will depart dramatically from what prevailed for that family in the preceding generation. The likelihood that families move across generations from the highest to the lowest levels of consumption is especially low.
6 Solon (1992) uses different years of data and analyzes information from adult children and their parents when they are at similar life stages. Because the broad set of expenditure data has only been available since 1999, our estimates are based on expenditures of adult children and parents at the same point in time and, therefore, quite different life stages, although we adjust for life stage by controlling for age. We estimated models identical to (1) but examined total family income instead of expenditures to determine if the sample and years we used led to different estimates of intergenerational transmission. A pattern similar to Solon’s emerges: single year correlations are lower than correlations using multi-year average of parental income. And for 1999, 2001, and 2003, the intergenerational income elasticity using three-year average of parental income are 0.30, 0.33, and 0.35, slightly lower than Solon’s estimates. 7 Aughinbaugh (2000), using the data on food and housing expenditures available in the PSID prior to 1999, has reported correlations larger than those reported here or in other intergenerational papers. When we restrict our intergenerational models to expenditures on food and housing, our correlations are quite close to the estimates of all expenditures reported in Table 4.
Studying Consumption with the PSID, Page 8
SUMMARY AND DISCUSSION
We have demonstrated that estimates of expenditures in most broad categories align closely in the PSID and CE despite substantial differences in their instruments and design features. We also found that cross-sectional life-cycle consumption profiles are similar in the two surveys, both for total consumption and most of its major components. Because the PSID expanded the set of consumption expenditure questions in 1999, it now provides a fairly accurate picture of most household consumption expenditure and is thus an even more useful resource for studying consumption. For example, combined with the PSID’s detailed income data, estimates of the effect of income on expenditures can now be derived for a variety of expenditure categories. If the additional questions introduced in the 2005 wave are as successful, future waves will contain a nearly-complete assessment of total expenditures. Given the PSID’s unique design features, several new areas of scientific exploration can be addressed using these data.
Although the PSID can be used to study questions that cannot be addressed with other data sources, such as intergenerational consumption patterns, the PSID cannot replace the CE, which has far greater detail on expenditures. Moreover, the CE collects data continuously, allowing more accurate assessment of year-to-year changes in expenditures. Finally, because the CE has collected comprehensive expenditure data for over two decades, long-term trends can only be analyzed with the CE. To illustrate the uniqueness of the PSID, we estimate the magnitude of the intergenerational elasticity in consumption expenditure and find it to be 0.32-0.34. This estimate is of comparable magnitude to estimates for intergenerational elasticities in wealth of 0.37 (Charles and Hurst, 2003) and income of 0.40 (Solon, 1992). With the richer set of expenditure data, analyses such as Mulligan’s (1997) that attempt to understand the relationship between the intergenerational transmission in earnings, income, wealth, consumption, and even health can be more fully explored.
Studying Consumption with the PSID, Page 9
REFERENCES Aughinbaugh, Alison (2000). “Reapplication and Extension: Intergenerational Mobility in the United
States,” Labour Economics, 7: 785-796. Becketti Sean, William Gould, Lee Lillard and Finis Welch, “The Panel Study of Income Dynamics after
Fourteen Years: An Evaluation,” Journal of Labor Economics, Vol. 6, No. 4, Oct., 1988. p. 472-492. Charles, Kerwin Kofi, and Erik Hurst (2003). “The Correlation of Wealth across Generations. Journal of
Political Economy.” 111(6): 1155-1182. Fisher, Jonathan D., and David S. Johnson (2005). “Consumption Mobility in the United States: Evidence
from Tow Panel Data Sets,” U.S. Bureau of Labor Statistics working paper. Fitzgerald, John, Peter Gottschalk and Robert Moffitt (1998). “An Analysis of Sample Attrition in Panel
Data,” Journal of Human Resources, Vol. 33, No. 2, Spring 1998a. p. 251-299. Juster, Thomas, and James P. Smith (1997). “Improving Quality of Economic Data: Lessons from the
HRS and AHEAD,” Journal of the American Statistical Association, 92, 1268-1278. Mulligan, Casey (1997). Parental Priorities and Economic Inequality. University of Chicago Press:
Chicago. Skinner, Jonathan. (1987). “A Superior Measure of Consumption from the Panel Study of Income
Dynamics,” Economics Letters, 23: 213-216. Solon, Gary (1992). “Intergenerational Income Mobility in the United States,” American Economic
Review. 82(June): 393-408. U.S. Department of Labor, Bureau of Labor Statistics. 2003. Consumer Expenditure Survey, 2000:
Interview Survey and Detailed Expenditure Files [Computer file]. Washington, DC: U.S. Dept. of Labor, Bureau of Labor Statistics [producer], 2002. Ann Arbor, MI: Inter-university Consortium for Political and Social Research [distributor], 2002.
U.S. Department of Labor, Bureau of Labor Statistics. 2003. Consumer Expenditure Survey Anthology, 2003. Report 967. Washington, D.C. http://www.bls.gov/cex/csxanthol03.pdf
Zimmerman, David J. (1992). “Regression Toward Mediocrity in Economic Status,” American Economic Review 82(3): 409-429.
Studying Consumption with the PSID, Page 10
Figure 1. Life-Cycle Expenditure Profiles for PSID (solid line) and CE (dashed line) in 2001: Food
$0
$1,000
$2,000
$3,000
$4,000
$5,000
$6,000
$7,000
$8,000
24 26 28 30 32 34 36 38 40 42 44 46 48 50 52 54 56 58 60 62 64 66 68 70 72 74
Age
Food - total
Food at home
Food away
`
Studying Consumption with the PSID, Page 11
Figure 2. Life-Cycle Expenditure Profiles for PSID (solid line) and CE (dashed line): Average for 1999, 2001, and 2003 Combined, Housing
$0
$2,000
$4,000
$6,000
$8,000
$10,000
$12,000
$14,000
24 26 28 30 32 34 36 38 40 42 44 46 48 50 52 54 56 58 60 62 64 66 68 70 72 74
Age
Housing - total
Mortgage
Rent
Studying Consumption with the PSID, Page 12
Figure 3. Life-Cycle Expenditure Profiles for PSID (solid line) and CE (dashed line):Average for 1999, 2001, and 2003 Combined, Housing (Continued)
$0
$500
$1,000
$1,500
$2,000
$2,500
$3,000
24 26 28 30 32 34 36 38 40 42 44 46 48 50 52 54 56 58 60 62 64 66 68 70 72 74
Age
Utilities
Property tax
Home insurance
Studying Consumption with the PSID, Page 13
Figure 4. Life-Cycle Expenditure Profiles for PSID (solid line) and CE (dashed line):Average for 1999, 2001, and 2003 Combined, Transportation
$0
$1,000
$2,000
$3,000
$4,000
$5,000
$6,000
$7,000
$8,000
$9,000
24 26 28 30 32 34 36 38 40 42 44 46 48 50 52 54 56 58 60 62 64 66 68 70 72 74
Age
Transportation-total
Loan+down payment
Insurance
Studying Consumption with the PSID, Page 14
Figure 5. Life-Cycle Expenditure Profiles for PSID (solid line) and CE (dashed line):Average for 1999,2001, and 2003 Combined, Transportation (Continued)
$0
$200
$400
$600
$800
$1,000
$1,200
$1,400
$1,600
$1,800
24 26 28 30 32 34 36 38 40 42 44 46 48 50 52 54 56 58 60 62 64 66 68 70 72 74
Age
Gasoline
Lease
Studying Consumption with the PSID, Page 15
Figure 6. Life-Cycle Expenditure Profiles for PSID (solid line) and CE (dashed line):Average for 1999, 2001, and 2003 Combined, Education and Child Care
$0
$500
$1,000
$1,500
$2,000
$2,500
$3,000
$3,500
24 26 28 30 32 34 36 38 40 42 44 46 48 50 52 54 56 58 60 62 64 66 68 70 72 74
Age
Education
Child care
Studying Consumption with the PSID, Page 16
Figure 7. Life-Cycle Expenditure Profiles for PSID (solid line) and CE (dashed line):Average for 1999, 2001, and 2003 Combined, Health Care
$0
$500
$1,000
$1,500
$2,000
$2,500
$3,000
$3,500
$4,000
24 26 28 30 32 34 36 38 40 42 44 46 48 50 52 54 56 58 60 62 64 66 68 70 72 74
Age
Health care
Studying Consumption with the PSID, Page 17
Figure 8. Life-Cycle Expenditure Profiles for PSID (solid line) and CE (dashed line): Average for 1999, 2001, and 2003 Combined, Total Expenditures
$0
$5,000
$10,000
$15,000
$20,000
$25,000
$30,000
$35,000
$40,000
$45,000
$50,000
24 26 28 30 32 34 36 38 40 42 44 46 48 50 52 54 56 58 60 62 64 66 68 70 72 74
Age
Total, including imputed components for PSID
Total of PSID-measured components
Studying Consumption with the PSID, Page 18
Percent of families Are unfoldingExpenditure category with valid response brackets used? Weekly Biweekly Monthly Annually OtherFood At home 98.24 No 88.55 2.55 8.69 0.21 0.00 Away from home 98.81 No 68.09 2.51 27.85 1.55 0.00 Delivered 99.88 No 49.38 6.69 40.43 3.50 0.00Housing Mortgage 99.27 No Rent 99.07 No 0.28 0.12 99.47 0.12 0.00 Insurance 92.11 No Property tax 94.22 No Electricity 96.31 No 0.00 0.00 99.40 0.55 0.05 Heat 95.36 No 0.00 0.00 91.88 8.03 0.07 Water 95.68 No 0.00 0.00 87.42 12.36 0.21 Other utility 99.83 No 0.00 0.00 96.35 3.36 0.12Transportation Loan payment 97.84 No 0.05 0.11 96.88 0.32 2.64 Down payment 97.07 No Lease payment 99.82 No 0.00 0.00 98.75 0.00 1.25 Insurance 92.78 No 0.00 0.00 22.46 73.41 4.13 Gasoline 98.08 No Repairs 99.00 No Other vehicle expenses 99.08 No Parking 99.57 No Bus & train 99.69 No Taxicab 99.69 No Other transportation 99.74 NoEducation 99.41 NoChild care 99.64 NoHealth Care Hospital and nursing home 99.69 Yes Doctor 99.46 Yes Rx, in-home med. care, special facilities 99.51 Yes Insurance 91.41 YesWeights are not used to calculate values in this table.*Survey asks about down payments in the previous two calendar years, but one can identify the date of each down payment to determine the amount in the previous calendar year.
Time period of reported spending
Table 1. Item Nonresponse and Time Period of Reporting in the PSID: 2001
Previous two calendar years combined
Previous calendar yearPrevious calendar year
Last monthLast monthLast monthLast monthLast month
Previous two calendar years combined
Total yearly payment
Monthly payment
Previous two calendar years combinedPrevious two calendar years combined
Last monthLast month
Previous calendar year*
Total yearly payment
Studying Consumption with the PSID, Page 19
Number of families with
valid responses
Percent of families with spending>0
Unconditional mean
Number of
familiesUnconditional
meanFood - total 7228 98.8 5936 7406 5899 At home 7276 97.1 3990 7406 3969 Away from home 7318 89.9 1829 7406 1825 Delivered 7397 13.1 105 7406 105
Housing - total 5841 100.0 10783 7406 10471 Mortgage 6543 42.2 4493 7406 4737 Rent 7337 33.9 2006 7406 2014 Insurance 6822 54.5 363 7406 376 Property tax 6977 56.1 1210 7406 1224 Utilities* 6867 92.8 2128 7406 2120
Transportation - total 6496 84.0 5892 7406 5921 Loan payment 7246 27.7 1188 7406 1192 Down payment* 7219 19.8 1363 7406 1367 Lease payment* 7365 5.4 393 7406 392 Insurance 6871 83.5 1163 7406 1158 Gasoline 7264 84.6 1343 7406 1342 Repairs 7332 40.5 110 7406 110 Other vehicle expenses 7338 24.1 97 7406 97 Parking 7374 6.2 46 7406 46 Bus & train 7383 4.7 42 7406 42 Taxicab 7383 2.4 15 7406 15 Other transportation 7387 3.1 160 7406 160
Education 7362 32.9 1199 7406 1199
Child care 7379 14.9 341 7406 342
Health care - total 6746 88.4 2100 7406 2129 Hospital and nursing home 7383 27.2 310 7406 311 Doctor 7366 68.7 427 7406 426 Prescriptions, in-home med. care, special facilities 7370 74.2 338 7406 339 Insurance 6770 63.6 1056 7406 1052PSID family weights are used to calculate means and percents.*For utilities, vehicle down payments, and lease, the proportion with valid responses reported in Table 1 multipled by the sample size (7406) does not equal the number of families with valid responses reported above. For utilities, if any individual component does not have a valid response, total utilities is counted as not having a valid response. For vehicles, some households can have multiple cars. In Table 1, if the family reports one valid car downpay, it is counted as valid. In Table 2, the sum of all car downpays is reported, and if any car downpay is invalid, the sum is invalid. The same is true of lease payments.
Before Imputation After Imputation
Table 2. Average Spending Before and After Imputation for Item Non-response
Studying Consumption with the PSID, Page 20
Unconditional
meanPercent of total
expendituresUnconditional
meanPercent of total expenditures
Ratio of means: PSID/CE
Unconditional Mean: PSID
Ratio of means: PSID/CE
Unconditional Mean: PSID
Ratio of means: PSID/CE
Food At home 3969 15.3% 3817 15.0% 1.04 3735 1.04 4070 1.06 Away from home 1825 7.0% 1339 5.3% 1.36 1575 1.16 1858 1.35 Delivered 105 0.4% NA 87 NA 130 NA Alcohol 326 1.3% NA Total food 5899 22.7% 5482 21.6% 1.08 5397 1.03 6058 1.10Housing Mortgage 4737 18.2% 3737 14.7% 1.27 3773 1.10 4762 1.17 Rent 2014 7.8% 2096 8.3% 0.96 1918 0.96 2053 0.96 Insurance 376 1.4% 256 1.0% 1.47 334 1.40 447 1.51 Property tax 1224 4.7% 1291 5.1% 0.95 1046 0.87 1331 0.95 Utility 2120 8.2% 2206 8.7% 0.96 1860 1.02 2171 0.95 Telephone 896 3.5% NA Total housing 10471 40.3% 10482 41.3% 1.00 8931 0.94 10764 0.97Transportation Loan payment 1192 4.6% 1533 6.0% 0.78 1071 0.76 1403 0.79 Down payment 1367 5.3% 1230 4.8% 1.11 1186 0.98 1237 0.94 Lease payment 392 1.5% 340 1.3% 1.15 291 0.96 227 0.96 Insurance 1158 4.5% 819 3.2% 1.41 1085 1.13 1475 1.63 Gasoline 1342 5.2% 1268 5.0% 1.06 979 0.94 1315 1.00 Repairs 110 0.4% 631 2.5% 0.17 89 0.14 100 0.17 Other vehicle expenses 97 0.4% NA 95 NA 103 NA Parking 46 0.2% 28 0.1% 1.64 34 1.36 43 1.54 Bus & train 42 0.2% 98 0.4% 0.43 35 0.38 58 0.70 Taxicab 15 0.1% 17 0.1% 0.88 11 0.65 24 1.50 Other transportation 160 0.6% NA 118 NA 163 NA Public transportation 322 1.3% Total transportation 5921 22.8% 6286 24.8% 0.94 4994 0.86 6148 0.93Education 1199 4.6% 914 3.6% 1.31 1030 1.16 1217 1.13Child Care 342 1.3% 273 1.1% 1.25 274 1.21 346 1.26Health care Hospital and nursing home 311 1.2% 109 0.4% 2.85 315 3.08 354 3.03 Doctor 426 1.6% 455 1.8% 0.94 368 0.85 480 1.04 Prescriptions, in-home med. care, special facilities 339 1.3% 364 1.4% 0.93 272 0.83 412 0.87 Insurance 1052 4.1% 952 3.8% 1.11 868 0.97 1215 1.09 Total health care 2129 8.2% 1938 7.6% 1.10 1823 1.04 2461 1.14Total 25961 100.0% 25375 100.0% 1.02 22449 0.96 26994 1.01NA=Not applicable. Weights are used to calculate all estimates.
Table 3. Estimated Expenditures in the PSID and CE
CE
---------------- NA -----------------
20012003
---------------- NA -----------------
---------------- NA -----------------
---------------- NA -----------------
1999
------------------------------------ NA -------------------------------------
------------------------------------ NA -------------------------------------
------------------------------------ NA -------------------------------------
---------------- NA -----------------
---------------- NA -----------------
PSID
Studying Consumption with the PSID, Page 21
Ceoff. Std Err Ceoff. Std Err Ceoff. Std Err Ceoff. Std Err Coeff. Std Err Coeff. Std ErrLog parental expenditures 0.249 0.017 0.252 0.015 0.274 0.017 0.318 0.021 0.320 0.020 0.335 0.022Adult child's charcateristics Age* 3.899 0.787 3.543 0.733 3.662 0.762 5.906 1.012 4.745 1.000 2.369 1.108 Age squared* -0.038 0.010 -0.035 0.009 -0.037 0.009 -0.057 0.012 -0.050 0.012 -0.025 0.014 Male 0.064 0.021 0.049 0.020 0.065 0.021 0.075 0.022 0.041 0.022 0.048 0.025 Married 0.381 0.029 0.414 0.027 0.433 0.027 0.367 0.030 0.421 0.029 0.419 0.032 Family size One (reference) Two 0.287 0.036 0.296 0.033 0.318 0.034 0.227 0.039 0.338 0.039 0.190 0.043 Three 0.380 0.038 0.349 0.036 0.391 0.037 0.375 0.042 0.439 0.042 0.361 0.046 Four 0.460 0.040 0.466 0.037 0.481 0.039 0.426 0.044 0.507 0.044 0.390 0.048 Five or more 0.470 0.044 0.446 0.041 # 0.499 0.043 0.421 0.049 0.511 0.047 0.433 0.053All models also control for parent's age, parent's age squared, parent household head gender, parent marital status and parents' family size dummies.For models 1999-2003, family size dummies refer to families with average size 1999 to 2003 of +/- 0.5 the given value, e.g., 1.5 to 2.5 for size 2.*Parameter estimates on age and age squared are multiplied by 100.For the three-year averages, all dollars are expressed in 2003 dollars using the CPI-U.
1999 (N=3295)
Table 4. Intergenerational Expenditure RegressionsDependent variable: Log Adult Children's Expenditures
Single-year measure of parental expenditures Three-year average of parental expenditures2001 (N=3569) 2003 (N=3813) 1999 (N=2735) 2001 (N=2741) 2003 (N = 2740)
Studying Consumption with the PSID, Page 22
1 (lowest) 2 3 4 (highest)1 (lowest) 36.3 29.7 21.6 10.72 27.2 24.3 26.8 20.73 21.1 26.2 27.0 26.04(highest) 15.4 19.8 24.7 42.6Estimate indicates the probability of belonging to a given expenditure quintile among children given one's parent's position in the parental expenditure distribution.
Table 5. Intergenerational Transition Matrix of Age- and Family Size-Adjusted Log Expenditures
Child Age- and Family Size-Adjusted
Consumption Quartile (1999-2003)
Parental Age- and Family Size-Adjusted Consumption Quartile (1999-2003)
Studying Consumption with the PSID, Page 23
Domain Question in 2003 Waves AvailableFood At home F17 & F18: In addition to what you buy with food stamps, do [you and anyone else in your family/you]
spend any money on food that you use at home? How much do you spend on that food in an average week?
1968-2003, except '73, '88, '89
Delivered F19 & F20: Do you have any food delivered to the door which isn't included in that? How much do you spend on that food?
1968, 1994 - 2003
Away from home F21: About how much do [you and everyone else in your family/you] spend eating out? 1969 - 2003, except '73, '88, '89
Health care Hospital & nursing home H64: About how much did you pay out-of-pocket for nursing home
and hospital bills in 2001 and 2002 combined? UNFOLDING BRACKETS1999-2003
Doctor H70: About how much did you pay out-of-pocket for doctor, outpatient surgery, dental bills in 2001 and 2002 combined? UNFOLDING BRACKETS
1999-2003
Prescription drugs H76: About how much did you pay out-of-pocket for prescriptions, in-home medical care, special facilities, and other services in 2001 and 2002 combined? UNFOLDING BRACKETS
1999-2003
Insurance H63: Altogether, how much did [you/your family] pay for health insurance premiums, in 2001 and 2002 combined, for (all of) the health insurance or health care coverage(s) you just mentioned? Please include amounts that you had automatically deducted from your pay, as well as amounts you paid directly.
1999-2003
Housing Mortgage A25: How much are your monthly mortgage payments?
A30: Do your payments include insurance premiums?A29: Do your payments include property tax?
1968 - 2003, except '73, '74, '75, '82, '88, '89
Rent A31: About how much rent do you pay a month? 1968 - 2003, except '88, '89 Insurance A22: How much is your total yearly homeowner's insurance premium? 1991 - 2003 Property tax A21: About how much are your total yearly property taxes, including city, county, and school taxes? 1968-2003, except '78, '88, '89
Electricity A48: The next few questions are about amounts paid for utilities, such as electricity and water. How much [do you/does your family] usually pay for electricity per month on average?
1981 - 1983, 1999-2003
Heat A49: How much for gas or other types of heating fuel per month 1981 - 1983, 1999-2003 Water and sewer A50: How much [do you/does your family] usually pay) for water and sewer per month 1981 - 1983, 1999-2003
Other utilities A51, A52, & A53: And do you have any other utility expenses? What were those other utilities expenses? On average, how much are these other utility expenses per month? Cable, garbage, phone, sewer
1981 - 1983, 1999-2003
Transportation Vehicle loan payment V20: How much are your payments and how often are they made? 1968, 1999-2003 Down payment V17: How much did you put down in cash? 1999-2003
Vehicle lease payment V24: How much was your initial outlay for that lease -- including your down payment and any fees?V25: How much are your payments and how often are they made?
1999-2003
Insurance X1: How much do [you/you and your family living there] pay for car insurance [per year/for all your vehicles per year]?
1968, 1999-2003
Gasoline X4: In 2002 how much did [you/you and your family living there] pay for each of these transportation related expenses...
1999-2003
Repairs and maintenance X4: 1999-2003 Parking and carpool X4: 1999-2003 Bus fares and train fares X4: 1999-2003 Taxicabs X4: 1999-2003 Other transportation X4: 1999-2003 Other vehicle expenditures X3(Other than the car payments you already told me about,) how much did you pay in car payments? 1999-2003Education X6 & X7: In 2002, did [you/you and your family living there] have any school-related expenses such as:
- Purchase or rental of books, supplies, uniforms, or equipment including computers and software; - Tuition or tutoring not including any amounts for day care or nursery school. I will ask you about those later; - Room and board for a family member who is away at school? How much in total were these expenses?
1999-2003
X8, X9, & X10: In 2002, were there any other school-related expenses not already covered in the previous question? What other types of school-related expenses did you have? Altogether, how much were these other expenses?
Child Care F7: How much did [you and your family living there/you] pay for child care in 2002? 1970, '71, '72, '76, '77, '79, '85, 1988-2003
Table A1. Expenditures Data Collected in the PSID: 1968-2003
Studying Consumption with the PSID, Page 24
PSID Consumption Category CE UCC Code NotesFood 200900, 790310, At home 190904, 790220, 790230 790320, and 790410 (alcohol) Delivered are included for the total Away from home 190902, 190903, 790410, 790420, 800700 of all food expenditures.Health care Hospital & nursing home 570110, 570210, 570220, 570230 Doctor 560110, 560210, 560310, 560330, 560400 Prescription drugs 340906, 540000, 550110, 550320, 550330, 550340, 570901, 570903, 570240 Insurance 580111, 580112, 580113, 580114, 580311, 580312, 580901, 580903, 580904, 580905, 580906Housing Mortgage 220311, 220312, 220321, 220322, 830201, 830202 Rent 210110, 800710 Insurance 220121, 220122 Property tax 220211, 220212 Utility 250111, 250112, 250113, 250114, 250211, 250212, 250213, 250214, 250221, 250222, 250223,
250224, 250901, 250902, 250903, 250904, 260111, 260112, 260113, 260114, 260211, 260212, 260213, 260214, 270211, 270212, 270213, 270214, 270310, 270411, 270412, 270413, 270414,
270901, 270902, 270903, 270904
270101, 270102 (telephone) are included for total housing expenses.
Transportation Vehicle loan payment 870103, 870104, 870203, 870204, 850300 Down payment 870101, 870102, 870201, 870202, 870801 Vehicle lease payment 450310, 450313, 450314, 450410, 450413, 450414 Insurance 450311, 450411, 500110 Gasoline 470111, 470112, 470113 Repairs 470220, 470211, 470212, 480110, 480213, 480214, 490110, 490211, 490212, 490221, 490231,
490232, 490311, 490312, 490313, 490314, 490318, 490319, 490411, 490412, 490413, 490501,490502, 490900, 520410
Other vehicle payments Parking 520531, 520532 Bus 530311, 530312, 530501, 530902, 530210 Taxicab 530411, 530412 Other transportation 520511, 520512, 520521, 520522, 520542, 520902, 520903, 520904, 520905, 520906, 520907,
530110, 530901
Education Schooling 190901, 210310, 370903, 390901, 660110, 660210, 660310, 660900, 670110, 670210, 670901,
670902, 800802, 800804 Other school-related 690111, 690112 Child care 340211, 340212, 670310
Table A2. Mapping of CE UCC codes Into PSID Categories
Studying Consumption with the PSID, Page 25
CoefficientSpending on: Food at home 1.32 Food away 2.50 Mortgage 1.03 Rent 1.29 Home insurance 2.27 Property Tax 2.67 Utilities 2.70 Transportation 1.28 Education 1.20 Child care 1.58 Health care 1.33Constant -2286R-squared 0.88All coefficients are significant at the 0.01 level.
Table A3. OLS Model of Total CE ExpendituresUsed to Impute Total Expenditures in the PSID