Embed Size (px)
Citation preview

STUDY REPORT No. 127 (2004)
FIREBARRIER Technical Reference Guide
P C R Collier
The work reported here was jointly funded by the Building Research Levy and the Foundation for Research, Science and Technology from the Public Good Science Fund.
BRANZ 2004
ISSN: 0113-3675

i
FireBarrier − Technical Reference Guide BRANZ Study Report No. SR127(2004)
by
P C R Collier
BRANZ Ltd
Private Bag 50908, Porirua New Zealand

ii
REFERENCE Collier, P C R. (2004) FIREBARRIER Technical Reference Guide, Building Research Association of New Zealand, Study Report No. 127, Judgeford, Wellington KEYWORDS Charring, compartment fires, computer modelling, concrete, design, fire resistance, floor-ceilings, gypsum plasterboard, linings, Insulation, timber frame, steel frame, walls ACKNOWLEDGEMENTS
The work reported here was jointly funded by the Building Research Levy and the Foundation for Research, Science and Technology, from the Public Good Science Fund ABSTRACT FireBarrier is a computer model, which integrates a finite difference heat transfer model with a combination charring and structural model for timber studs or joists and a heat transfer structural model for steel studs. The finite difference heat transfer model determines the heat transfer across a fire barrier, such as a wall or ceiling, when subjected to an elevated temperature on one side such as would be expected in a fire exposure. The internal structure may range from a timber or steel framed cavity wall (or floor/ceiling) lined with plasterboard or other similar lining products, to solid core barriers, such as concrete, which may also be lined on one or both sides. Physical properties of the linings/barrier are updated with changing temperatures and the changing heat transfer conditions are used to predict the failure criteria of ‘Insulation’ and ‘Structural Adequacy’, ‘Integrity’ failure is not predicted. FireBarrier has been developed by the author, using the collective results of research conducted at BRANZ, into charring rates of timber and design of lightweight timber and steel framed walls and floors for fire resistance.

iii
CONTENTS Page No.
1. INTRODUCTION ......................................................................................................1
2. FINITE DIFFERENCE MODEL .............................................................................1
2.1. Principle of finite difference method as applied to a single sheet ................................1
2.2. Extension to a cavity wall system.................................................................................3
2.3. Multiple layers of lining ...............................................................................................4
2.4. The addition of insulation to the cavity........................................................................5 2.4.1 Various types of cavity insulation.......................................................................6
2.5. Radiation and convection coefficients ..........................................................................6
3. THERMAL PROPERTIES OF COMMON LINING MATERIALS ...................7
3.1. Gypsum plasterboard ....................................................................................................7 3.1.1 Ablation of gypsum plasterboard ........................................................................9
3.2. Brick ...........................................................................................................................10
3.3. Wood and wood composite ........................................................................................10
3.4. Concrete ......................................................................................................................11
4. CHARRING AND STRUCTURAL MODEL FOR TIMBER .............................11
4.1. Charring of timber studs in cavity..............................................................................11 4.1.1 Radiation model inside the cavity.....................................................................12
4.2. Reduction of loadbearing capacity with charring of timber studs ..............................14
5. STRUCTURAL MODEL FOR STEEL .................................................................17
5.1. Heat transfer in steel frame .........................................................................................17 5.1.1 Finite difference analysis ..................................................................................17 5.1.2 Lumped thermal analysis ..................................................................................17
5.2. Temperature effects on loadbearing capacity.............................................................18
6. EXTENSION OF MODEL TO FLOOR/CEILINGS ...........................................19
6.1. Fire exposure from below...........................................................................................20
6.2. Fire exposure from above ...........................................................................................21
7. CONCLUSIONS.......................................................................................................22
REFERENCES ...................................................................................................................23
iv
Figures Page No.
Figure 1: Applying finite difference grids to coarse and fine layers
with fire exposure on one side............................................................................2 Figure 2: Application of finite difference techniques to a cavity wall in
combination with radiation and convection.......................................................3 Figure 3: Temperature profile across a typical interface ...................................................5 Figure 4: Enthalpy vs temperature .....................................................................................8 Figure 5: Variation of enthalpy with moisture content......................................................8 Figure 6: Exposure of stud to radiation from lining ........................................................13 Figure 7: Cross-section view of radiation exposure on stud ............................................14 Figure 8: Loadbearing wall and charring of stud .............................................................16 Figure 9: Lumped thermal analysis .................................................................................17 Figure 10: Fire exposure from below a floor/ceiling .........................................................20 Figure 11: Fire Exposure from above a floor/ceiling ........................................................21 Tables Table 1: Heat transfer coefficients – walls ...........................................................................7 Table 2: Density and conductivity of gypsum .....................................................................9 Table 3: Heat transfer coefficients – floor/ceilings ............................................................19
1
1. INTRODUCTION
Traditionally the fire resistance of cavity wall systems is established by a fire resistance test at a recognised fire laboratory. Design variations to tested systems are permitted by an expert opinion, but in most cases, these are based on other test results and the judgement of the expert. In all cases, the variations are also limited to the standard fire resistance test (SA, 1997), which is not representative of real fires.
The development of computer models, based on finite difference techniques, to simulate the exposure of cavity walls to fire offers interesting possibilities, including the flexibility to trial a wide range of possible construction parameters and fire exposures. The majority of models reported in the past have not included a high degree of user-friendliness, if in fact the software has been available. Most that have been published are considered more as research tools. The software then requires some time to set up a particular wall system for fire exposure.
2. FINITE DIFFERENCE MODEL
A finite difference model evaluates heat transfer by considering the incremental heat transfer through discrete elements of a material over a fixed time-period. The temperature and physical properties are re-evaluated for the next time step and the process is repeated. Finite difference methods for determining heat transfer can be based on explicit or implicit equations. The equations may be in one, two, or three dimensions for solving heat transfer problems. For the FireBarrier model one-dimensional implicit equations are cast and solved using a ‘matrix inversion method’ (Wade, 2002). The implicit method has the advantage of being more stable, compared with the explicit method used by Collier (1996b). When using the explicit method the time step is sized so that several inequalities involving the Fourier and Biot numbers are satisfied. If these limits are exceeded instability results, which generates large positive and negative values such that temperatures diverge widely either side of the true temperature with each successive time step. The solution is in setting smaller and smaller time steps to maintain stability, but the disadvantage is that execution speed becomes very slow to the point where the programme appears to have totally locked up. With implicit equations, instability and slow execution are largely avoided. Some inaccuracies in the calculations are inherent if time steps are too large but realistic limits on time steps will produce accurate results in a reasonable execution time. The finite difference model developed in this study is a compilation of several component parts, which make up a cavity wall. For the lining layers it is a heat transfer by conduction problem, complicated by the changing properties of the lining with temperature. Heat transfer in the open cavities is by convection and radiation. When the lining cavity is filled with insulation, it becomes a conduction calculation. Strictly speaking heat transfer in the insulation is by convection and mass transfer (Gammon, 1987), but due to the complexities of the algorithms involved, reducing the problem to one of conduction is a justified simplification.
2.1. Principle of finite difference method as applied to a single sheet
To illustrate the application of the finite difference method a single sheet (of plasterboard or other suitable material) is illustrated in Figure 1. A finite difference grid was applied to the lining, dividing into 4 layers (5 nodes, coarse grid) or 8 layers (9 nodes, fine grid), but any other number of nodes would also work. Fewer nodes produce results of lower accuracy in a shorter time and larger numbers produce results that are more accurate over a longer period.

2
Figure 1: Applying finite difference grids to coarse and fine layers with fire exposure on one side
The heat transfer is described in implicit one-dimensional equations in equations 2.1 to 2.4. The subscripts on the temperatures T refer to the node position, F and A refer to the fire and ambient nodes respectively, while numbers 1,2,3, …m refer to nodes within the sheet. The superscript p refers to the time, and p+1 is the next time. Within each sheet, heat transfer is treated solely as a conduction problem and moisture transport can be ignored. Moisture transport originating from both the evaporation of water of hydration and free water is not modelled. This simplification is possible when it is considered that the moisture evaporates and condenses several times onto cooler surfaces before those surfaces heat up and it evaporates again. The net effect is that from an enthalpy consideration it is only evaporated once. On the fluid interfaces of the layer, heat transfer is by a combination of radiation and conduction as described in equation 2.1 where the Biot Number (Bi) in equation 2.3 is dependent on h, an overall heat transfer coefficient in equation 2.7, which is derived from the convective and radiative coefficients in equation 2.8 and 2.9.
ppF
pp T-TTTT 111
21
1 )FoBi(2Fo2Fo)21( +=−+ ++ Equation 2.1
Where the Fourier and Biot numbers are given by:
ck
with )(
Fo 2 ρα
α=
∆∆
=x
t Equation 2.2
kxh∆
=Bi Equation 2.3
h is defined in equations 2.7, 2.8 and 2.9.
The implicit form of the interior node is given by:
pm
pm
pm
pm TTTT =−++− +
+++
−11
111 FoFo)21(Fo Equation 2.4
1 2 3 4 5 Nodes in coarse grid
1 2 3 4 5 6 7 8 9 Nodes in fine grid
TF T1 T2 T3 T4 T5 TA
Temperature

3
Solution of the simultaneous implicit equations at each time step is performed by the matrix inversion method by expressing the equations in the form [A][T]=[C] where:
[ ]
+−
−+−+
+
=
2Fo1Fo200
0Fo2Fo1Fo000Fo-2Fo1Fo-0002Fo-2Fo1
A
KKMKKOMM
KKK
Equation 2.5
[ ]
+−
+−
=
pn
pnA
p
p
pPPFF
TTT
TT
TTT
)(FoBi2
)(FoBi2
C
A
3
2
11
M
Equation 2.6
The bottom rows of matrices [A] and [C] represent the ambient interface and are basically mirror images of the fire interface. The matrix [T] is the transpose of matrix [A].
The above treatment is a simple application of a finite difference as applied to a single layer or lining with fire exposure on one side. The basic method is reproduced again for more than one lining, usually with fluid interfaces on each side where a cavity is such an example.
2.2. Extension to a cavity wall system
Figure 2: Application of finite difference techniques to a cavity wall in combination with radiation and convection
Enlargement showing nodes and temperature gradient
Heat transfer from ambient side of wall mainly by convection
Heat transfer across cavity by radiation and convection
Heat transfer to wall predominantly by radiation
4
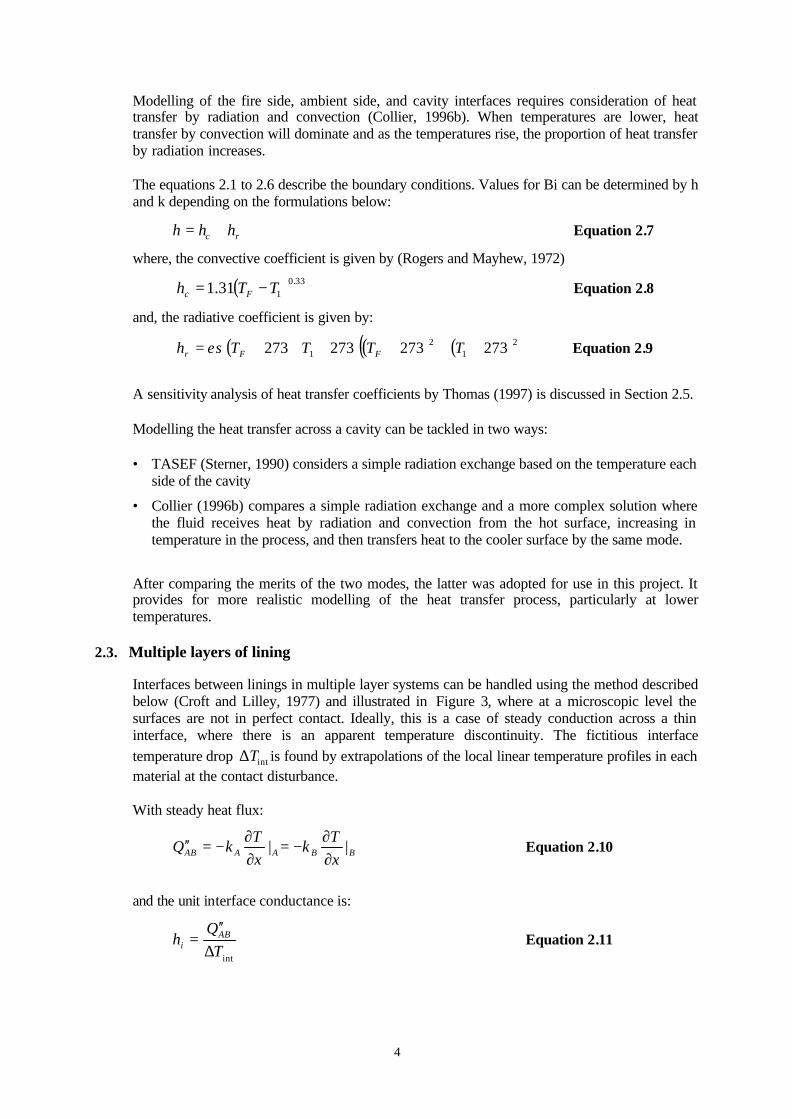
Modelling of the fire side, ambient side, and cavity interfaces requires consideration of heat transfer by radiation and convection (Collier, 1996b). When temperatures are lower, heat transfer by convection will dominate and as the temperatures rise, the proportion of heat transfer by radiation increases. The equations 2.1 to 2.6 describe the boundary conditions. Values for Bi can be determined by h and k depending on the formulations below:
rc hhh += Equation 2.7
where, the convective coefficient is given by (Rogers and Mayhew, 1972)
( ) 33.0131.1 TTh Fc −= Equation 2.8
and, the radiative coefficient is given by:
( ) ( ) ( )( )21
21 273273273273 ++++++= TTTTh FFr εσ Equation 2.9
A sensitivity analysis of heat transfer coefficients by Thomas (1997) is discussed in Section 2.5.
Modelling the heat transfer across a cavity can be tackled in two ways: • TASEF (Sterner, 1990) considers a simple radiation exchange based on the temperature each
side of the cavity
• Collier (1996b) compares a simple radiation exchange and a more complex solution where the fluid receives heat by radiation and convection from the hot surface, increasing in temperature in the process, and then transfers heat to the cooler surface by the same mode.
After comparing the merits of the two modes, the latter was adopted for use in this project. It provides for more realistic modelling of the heat transfer process, particularly at lower temperatures.
2.3. Multiple layers of lining
Interfaces between linings in multiple layer systems can be handled using the method described below (Croft and Lilley, 1977) and illustrated in Figure 3, where at a microscopic level the surfaces are not in perfect contact. Ideally, this is a case of steady conduction across a thin interface, where there is an apparent temperature discontinuity. The fictitious interface temperature drop intT∆ is found by extrapolations of the local linear temperature profiles in each material at the contact disturbance. With steady heat flux:
BBAAAB xT
kxT
kQ ||∂∂
−=∂∂
−=′′ Equation 2.10
and the unit interface conductance is:
intT
Qh AB
i ∆′′
= Equation 2.11

5
In the ideal case of perfect contact, the temperature drop ∆Tint vanishes and hi → ∞. Then there is temperature continuity TA = TB at the interface but perhaps a discontinuity in the temperature gradient, since kA ≠ kB if the linings are different.
Figure 3: Temperature profile across a typical interface
Finite difference equations can be derived the same way as for boundary nodes with convective (and radiative) conditions, but for the purposes of this model a simplification was employed empirically for the case of two sheets of lining touching (or almost) each other. A realistic value of hi was determined by optimisation trials, to match the test results and has been written into the code. The trials showed that the sensitivity to variations in hi is not significant for a realistic range of values.
2.4. The addition of insulation to the cavity
When insulation is included in the cavity, it is assumed the heat transfer mode changes from convection and radiation to a conduction type regime, and this offers a viable method of modelling the situation. The mode(s) of heat transfer through insulating materials is complex and a different approach depending on the type of insulation is justified. Gammon (1987) explains that most insulating materials are porous. The pore system can be closed, such as in wood and cellular plastics, or open, as in mineral wool. In a closed system, heat transfer can occur by radiation and gas conduction in the pores, as well as by solid phase conduction. In open pore systems, heat transfer can additionally occur by natural or forced convection, and therefore depends on whether the material is oriented horizontally in service. The basic equation for heat/mass flow in a porous medium, Darcy’s law, relates mass flow to pressure gradient by permeability. In fibrous materials, anatomical anisotropy results in at least two permeabilities, parallel and perpendicular to the fibres. Since practical applications are complex, semi-empirical solutions offer a possible solution. In the case of fibreglass insulation, the thermal conductivity is a function of temperature, with conductivity generally increasing as temperature rises. Radiation effects, which become pronounced at higher temperatures, are shown as a rise in conductivity at higher temperatures. Product literature, which shows the variation of the thermal conductivity, may be used as an input to the model. If this data is available then heat transfer across the cavity can be treated as a
Lining A
Temperature profile
Lining B
Rate of heat flow Q”
AB
intT∆

6
conduction problem, requiring some assumptions about heat transfer across the lining to insulation interface. Product literature (e.g. mineral fibre) sometimes gives a graph of conductivity Wm/k vs temperature ºC and the graph terminates at the maximum service temperature as specified by the manufacturer. Beyond this temperature, it is assumed that the insulation has melted or is otherwise no longer effective.
2.4.1 Various types of cavity insulation
The types of cavity insulation range from the extremes of fibreglass, which melts at a relatively low temperature, to mineral types that do not melt.
Irrespective of the type of insulation, the exposed lining is subjected to a more severe temperature exposure providing the insulation remains in place throughout the cavity. This is because the transmission of heat through the cavity is impeded, resulting in a temperature increase in the exposed lining. The elevated temperature will cause more rapid deterioration of the exposed lining, but this effect can be significantly mitigated if the lining is a fire-rated type, which commonly includes glass fibres in the core to reduce/delay cracking of the lining and detachment from the framing. Once the lining has fallen off the cavity, the insulation is then exposed to the full fire exposure conditions. If the insulation is resistant to high temperatures and secured to prevent it from falling out, it will continue to protect the unexposed lining and delay failure by the ‘Insulation’ criterion. Conversely, fibreglass insulation is likely to melt exposing the unexposed lining to full fire exposure conditions leading to a rapid degradation and failure by the ‘Insulation criterion’. Conditions where the inclusion of insulation will improve the performance of the wall require the exposed lining to remain in place and it is assumed that the insulation does not melt or shrink during the same period. Heat transmission through the assembly is impeded, and while this situation prevails failure by the ‘Insulation’ criterion and temperature rises on the ambient side are impeded. The insulation also affords some protection to the sides of the studs, provided the insulation does not shrink and open a gap allowing hot gases to heat the studs, which may be more severe than if there was no insulation at all. Charring on the sides of timber studs is reduced and the rate of temperature rise of steel studs is reduced. The exposed face of the studs will heat up in a similar scenario to the case where there is no insulation. Each application of insulation in the cavity should be considered on its relative merits and model trials are a valuable tool in assessing the likely benefit.
2.5. Radiation and convection coefficients
Thomas (1997) performed an extensive sensitivity analysis of the radiation and convection coefficients by demonstrating the effect on the wall surface temperature and net heat flux to the wall of high, low and mean values of those heat transfer coefficients. The results of the study showed in most cases a relative insensitivity to quite wide variations in the coefficients. The final values selected by Thomas (1997) are in the middle of the range as listed in Table 1.
The effective emissivity ε for radiation heat transfer as given by equation 2.9 is used in equation 2.12.
4Tq εσ=′′ Equation 2.12

7
while β and γ are the coefficient and index respectively in equation 2.8.
)1()( −−= γβ sg TTh Equation 2.13
In equation 2.8 the value of β was 1.31, as was shown by Thomas (1997) the overall results are not greatly sensitive to this value, so the values recommended by Thomas, as listed in Table 1 were used in the FireBarrier model.
Table 1: Heat transfer coe fficients – walls
Position ε β γ
Fire side 0.8 1.0 1.33
Lining, fire side of cavity 0.6 1.0 1.33
Lining, ambient side of cavity 0.6 1.0 1.33
Wood stud side of cavity 0.6 1.0 1.33
Ambient side 0.6 2.2 1.33
3. THERMAL PROPERTIES OF COMMON LINING MATERIALS
The thermal properties of the lining materials have a significant effect on the performance of a fire barrier. Properties such as conduction, specific heat, and density determine the heat flow through the lining. Moisture in the form of free moisture and water of hydration can impart a considerable time delay, with a plateau around 100oC during the temperature rise. This has the benefit of increasing the overall fire resistance. How long a layer of lining remains attached to the frame will also affect the overall fire performance.
3.1. Gypsum plasterboard
Gypsum plasterboard linings are commonly used to provide fire resistance in framed construction. When exposed to fire the free water and chemically combined water in the gypsum is gradually driven out as the temperature increases through the 100°C zone. This causes a temperature plateau on the unexposed face of the lining. The duration of this plateau is a function of the lining thickness, density, composition, and percentage of free moisture. As temperatures rise above 100°C, calcination of the gypsum plaster significantly reduces its strength. Thomas (1997) evaluates data measured by Mehaffey, Cuerrier and Carisse (1994), Andersson and Jansson (1987), and Harmathy (1988) for the thermal conductivity and enthalpy of glass-fibre reinforced gypsum plasterboard as a function of temperature. Thomas’s values for the enthalpy of gypsum plasterboard are presented in Figure 4 along with a selection from other researchers. The enthalpy values presented in Figure 4 represent the summation of the product of specific heat and temperature. Enthalpy values are used in modelling to avoid numerical instabilities resulting from the sharp peaks that may occur in the specific heat of materials containing water, due to evaporation of moisture over very narrow temperature intervals. Alternative sets of enthalpy data for gypsum plasterboard were obtained from Fuller (1992), Cooper (1997), Sultan (1996), and Perry (1997) and these are compared with Thomas’s (1997) values and are included in Figure 4. Thomas’s data has been converted from a kJ/m3 basis to kJ/kg using a density of 510 kg/m3 for purposes of comparison. The values used by Fuller for

8
enthalpy are generally higher up to about 300ºC, especially in the region of the spike around 100ºC where moisture is evaporated. This can be attributed to Fuller using a moisture content of 7% for the free water in the gypsum, a value higher than the 1-2% commonly found in BRANZ commercial testing but within Thomas’s quoted range of 4-8%. The enthalpy of gypsum is quite sensitive to the value of free moisture chosen.
0
500000
1000000
1500000
2000000
2500000
0 200 400 600 800 1000 1200
Temperature, ºC
En
thal
py,
kJ/
kg
Fuller 7%
Thomas
Cooper
Perry
Sultan
Figure 4: Enthalpy vs temperature
For Fuller’s enthalpy data, which is used in the FireBarrier model, it was necessary to be able to vary the moisture content from 0 to 7% and higher if required. Figure 5 shows a family of curves, which illustrate the proportion of the range of enthalpy attributable to the free moisture. These values where obtained by removing the contribution of the 7% of free moisture to the spike at 100oC and then putting it back in on a pro-rata basis according to the moisture content.
0
500000
1000000
1500000
2000000
2500000
0 200 400 600 800 1000 1200
Temperature, ºC
En
thal
py,
kJ/
kg
7.00%
5.00%
3.00%
1.00%
0.00%
Figure 5: Variation of enthalpy with moisture content

9
For density and conductivity, the values used by Fuller (1992) are typical of those used by other researchers and are presented in Table 2. In the context of this study the values of density were taken as relative, and used as a basis for the changes in the density of a measured sample that may have been 797 kg/m3 (in the case of 12.7 mm plasterboard) initially and reduced proportionally with temperature according to Table 2.
Table 2: Density and conductivity of gypsum
Temperature, oC Density, ρ , kg/m3 Conductivity, k, Wm-1K-1
25 678 0.25
98 651 0.25
100 651 0.25
103 648 0.25
115 646 0.25
125 644 0.25
200 642 0.13
300 638 0.13
360 642 0.13
400 641 0.13
500 638 0.13
600 632 0.13
3.1.1 Ablation of gypsum plasterboard
Thomas (1997) describes ablation as a process whereby consecutive layers of each individual sheet of lining material are shed as a material undergoes heating. This occurs because the material undergoes chemical and physical changes during heating which reduces the bonding of the material to itself. The material then tends to fall away because it is not firmly attached to the material underneath. As gypsum is heated, it is transformed into calcium anhydrate, which has the appearance of a dry cohesionless powder that will then fall off the unaffected board. If the powder is not lost in this process, the shrinkage of the gypsum causes fissures to penetrate into the core, which provides an additional path for heat transfer. This process is slowed if the board is reinforced with fibreglass, which improves cohesiveness and increases the temperature at which ablation occurs. The temperatures for which ablation occurs range from 500 to 700oC for standard (un-reinforced) gypsum board. For glass-fibre reinforced boards gypsum plasterboards, generally known as fire-rated boards, the ablation range is 700 to 900oC. The effect of ablation is more apparent when comparing the results of boards of different thicknesses. Ablation has a more serious effect on a thinner board due to the fact that a higher proportion of the board is lost. To model the phenomenon of ablation, a method (Gammon, 1987) that has been trialled with some success is to remove from further consideration layers of lining that have exceeded the ablation temperature. At the end of each time step when the temperature of each layer (between nodes) has been evaluated, those layers that exceed the ablation temperature are eliminated from

10
further consideration, so the lining sheet is progressively reduced in thickness simulating ablation. Plasterboard lining subjected to fire exposure is also observed to crack and craze. Attempts to model this phenomenon by increasing the conductivity leads to increases in the Fourier numbers exceeding the 0.5 limit where instabilities and truncation errors are likely. Using implicit equations for the finite difference analysis largely eliminates the instabilities but the truncation errors may still cause unpredictable results. Reducing the time step reduces the Fourier number, but increases execution time without contributing to a satisfactory solution to the problem of modelling ablation. So increasing the conduction does not affect a viable means of modelling ablation. The method of modelling the ablation, finally selected for the model, is initiated when the average temperature of the lining under consideration has exceeded the ablation temperature, and then the method of determining the heat transfer is changed accordingly. Initially heat transfer is determined by finite difference, but satisfactory results have not been achieved above the ablation temperature if the conductivity is increased and density reduced. An alternative method of heat transfer based on the thermally thin (lumped material) heat conduction (Rockett and Milke, 1995) is justified considering that the lining beyond the ablation temperature is likely to be significantly cracked/crazed and thus many passages for the transport of hot gases into the lining core are provided. Effectively the surface area of the lining is significantly increased, as is the heat transfer into the lining. If it is assumed that the temperature of the lining is uniform, then the unexposed side of the ablating lining asymptotically approaches the fire temperature as it finally breaks down and falls off the studs. The cavity is then exposed to the full fire exposure conditions and the unexposed lining undergoes the same ablation treatment once the same initiating temperature conditions are reached. A similar method of using lumped thermal analysis on a thermally thin material is applied to steel studs in Section 5.1.
3.2. Brick
The thermal properties of brick are quite different to gypsum; no spike in specific heat is encountered when water of hydration would normally be driven off. This is because bricks are baked in an oven as part of the curing process, so brick is essentially anhydrous, and any free moisture is not normally considered. For modelling purposes, it is assumed that the specific heat and conductivity are constant over the temperature range considered. The prevailing physical properties of the brick will dictate the performance and can be entered as inputs from actual measurements of the bricks used for density, with specific heat of 835 J/kg/K (assumed constant) and conductivity of 0.72 W/m.K from the best information available such as in Perry’s (1997) Chemical Engineers handbook). Asymmetric wall systems with bricks on one face, generally an external face are similarly treated as a cavity wall with a timber or steel frame, where the bricks are treated as a lining. The fire resistance is likely to be different depending on the direction of fire exposure. Concrete bricks behave similarly to gypsum, since the curing process is similar and water of hydration is retained. The fire performance of concrete is covered in Section 3.4 and is applicable to concrete bricks/blocks.
3.3. Wood and wood composite
Wood and wood composite may also be modelled as a lining. The thermal properties are similar to gypsum, as there is some free moisture to evaporate, which causes a spike in the specific heat. The structure breaks down or chars at approximately 300oC, or sooner in the case of wood

11
composites when some particular (heat affected) glues are used as the binding agent. Once the temperature has exceeded 300oC on the unexposed side of a barrier, it is considered to have charred through and no longer affords any protection to the framing and cavity, which is then subjected to the fire temperature.
3.4. Concrete
The thermal properties of concrete are similar to gypsum. The water of hydration retained in the curing process is lost on heating and contributes to a spike in the specific heat as the temperature increases through 100ºC. Thermal properties for various concrete aggregates at elevated temperatures can be obtained from Buchanan (2001) and Schneider (1988). Although concrete spalls at higher temperatures, similarly to ablation of gypsum, the effect was considered minimal and therefore not modelled. Concrete can also be modelled as the core of a construction system, where a concrete slab is covered with a sheet of plasterboard or similar lining on one or both sides. The exact properties of the concrete are not required if a fire resistance test result is available. Estimated physical properties of density and moisture content are input into the model, and several optimisation trials run until a match with the test result is obtained. Having established reasonable agreement with the test result, modifications to the system, such as the addition of plasterboard to concrete or increasing the concrete thickness, can be trialled to establish the probable improvement to the fire resistance.
4. CHARRING AND STRUCTURAL MODEL FOR TIMBER
The charring model for timber studs in a cavity wall used in the FireBarrier software is based on the method resulting from previous research (see Section 4.1). The loadbearing capacities of the timber studs in the wall being modelled are reduced as the timber cross-section is reduced by charring from the fire exposure. The charring of the studs in turn is dependent on the radiation exposure from the exposed face lining. Finally, the time of ‘Structural’ failure is when the loadbearing capacity reduces below the applied load.
4.1. Charring of timber studs in cavity
When the studs in the cavity of the wall begin to char, at a time when the temperature of the cavity side of the exposed lining exceeds 300oC, the resulting loss of stud section reduces the loadbearing capacity. Previous research by the author (Collier, 1991a, 1991b, 1992, 1996a and 1999) established a relationship between the depth of char, referred to as “charfactor” and a likely shape of the remaining cross-section. The loadbearing capacity based on the initial stud dimensions and wall height is reduced as the studs are consumed by charring. A radiation induced char model (Butler, 1971) on the basis of the incident radiation impinging on the stud surfaces causing charring and loss of stud (surface recession) was adopted. Butler demonstrated that the charring rate is proportional to the radiation such that:
2MW/min radiation theis where
mm/min9621
q
. q. Char rate &= Equation 4.1
12
Mikkola (1990) supports Butler’s finding that the charring rate is proportiona l to the external heat flux. Further adjustments to the charring rate can be based on density, moisture content, and oxygen concentration can be included based on the method developed by Mikkola (1990) and described as follows. Charring rate is approximately inversely proportional to the density of the timber, and a relative relationship is presented by:
1)120(~ −+ρβ Equation 4.2
where ρβ and are the charring rate in mm/min and the density in kg/m3 respectively. Charring rate is reduced by increases in moisture content according to:
)5.21(
1~
w+β Equation 4.3
where w is the moisture content given by:
o
o
mmm
w−
= Equation 4.4
and where m and mo are the mass of a wood sample before and after oven drying. Reducing oxygen content, as a fire progresses, also has the effect of retarding the charring rate. A reduction from 21%, as in ambient air (which is also the environment in a cone calorimeter exposure) down to 8–10% as would be encountered in a fire resistance test results in the charring rate reducing by approximately 20%. In a fully developed fire the oxygen content may drop to zero, in which case the charring rate could reduce by 35 to 50%. The environment in the cavity of a timber-framed wall may vary within the range covered above as the timber chars/combusts as a result predicting the char rate is further complicated.
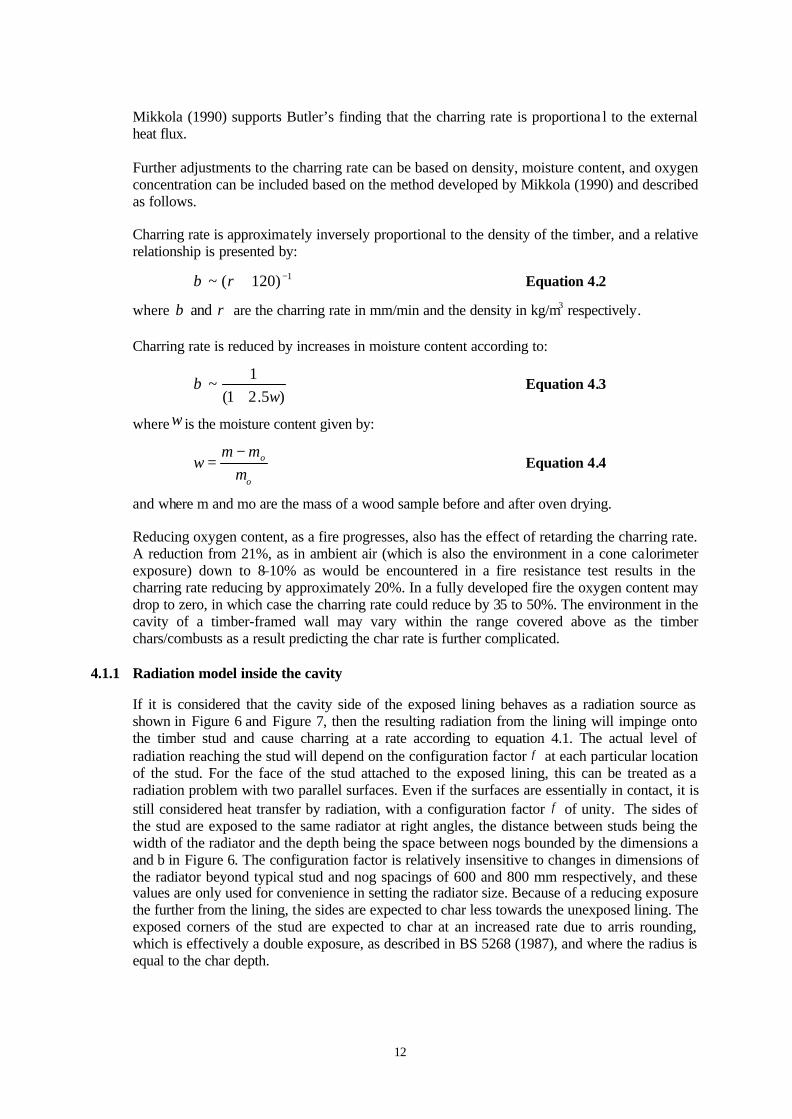
4.1.1 Radiation model inside the cavity
If it is considered that the cavity side of the exposed lining behaves as a radiation source as shown in Figure 6 and Figure 7, then the resulting radiation from the lining will impinge onto the timber stud and cause charring at a rate according to equation 4.1. The actual level of radiation reaching the stud will depend on the configuration factor φ at each particular location of the stud. For the face of the stud attached to the exposed lining, this can be treated as a radiation problem with two parallel surfaces. Even if the surfaces are essentially in contact, it is still considered heat transfer by radiation, with a configuration factor φ of unity. The sides of the stud are exposed to the same radiator at right angles, the distance between studs being the width of the radiator and the depth being the space between nogs bounded by the dimensions a and b in Figure 6. The configuration factor is relatively insensitive to changes in dimensions of the radiator beyond typical stud and nog spacings of 600 and 800 mm respectively, and these values are only used for convenience in setting the radiator size. Because of a reducing exposure the further from the lining, the sides are expected to char less towards the unexposed lining. The exposed corners of the stud are expected to char at an increased rate due to arris rounding, which is effectively a double exposure, as described in BS 5268 (1987), and where the radius is equal to the char depth.

13
Figure 6: Exposure of stud to radiation from lining
Figure 6 shows the basis for calculation of the configuration factor φ using formulations (Tien, Lee, and Stretton, 1995) for exposure where the receiver is perpendicular to the radiator where:
22/1,/,/ YXAbcYbaX +=== Equation 4.5
faceexposedfromdistancenogs,between spacingstuds,between spacingwhere === cba
]tan)/1([tan1 11 AAYY −− −=π
φ Equation 4.6
and the incident radiation at point C is given by:
4Tq εφσ=& Equation 4.7
where ε = emissivity, φ = configuration factor, σ = Stephan – Boltzman constant and T = absolute temperature of the exposed lining. Figure 7 shows a representation of the radiation impinging on the sides of the stud and an approximate charring profile .
a
Exposed lining (radiator)
b
c
Stud
C

14
Figure 7: Cross-section view of radiation exposure on stud
A further refinement was considered where the contribution of the cooler unexposed lining is also modelled and in fact would have the net effect of taking heat away from the stud. This would be more complex because the temperature of the stud would need to be known. Further development of this particular approach was abandoned when it was apparent that the reduction in charring resulting was minimal and did not have a significant effect on the stud cross section.
4.2. Reduction of loadbearing capacity with charring of timber studs
BRANZ Technical Recommendation TR9 “Design of light timber framed walls for fire resistance” (Collier, 1991b and 1996a) uses the charring of studs as a basis for a reduction in the loadbearing capacity of the studs. The studs in a light timber framed wall, when subjected to fire, are modelled as axially loaded columns. The effect of fire is simulated by the loss of timber cross-section in the studs and a calculation of the residual loadbearing capacity. The “secant formula” is applied to what is assumed to be eccentrically loaded studs (in a wall) and has been modified to include the effects of charring of the studs. The char rate in mm per minute determined from the charring model described in Section 4.1 is applied to the studs and the charred wood in mm is removed from the stud section at one minute intervals. The equation describing the stresses in the charred studs is a modified version of the "secant formula" as used in Collier (1991a) and is as follows:
)]2L
sec(1[AP
=2max
ασ
rec
+ Equation 4.8
Exposed lining (radiator)
Timber stud
Original shape Charred shape
Fire
15
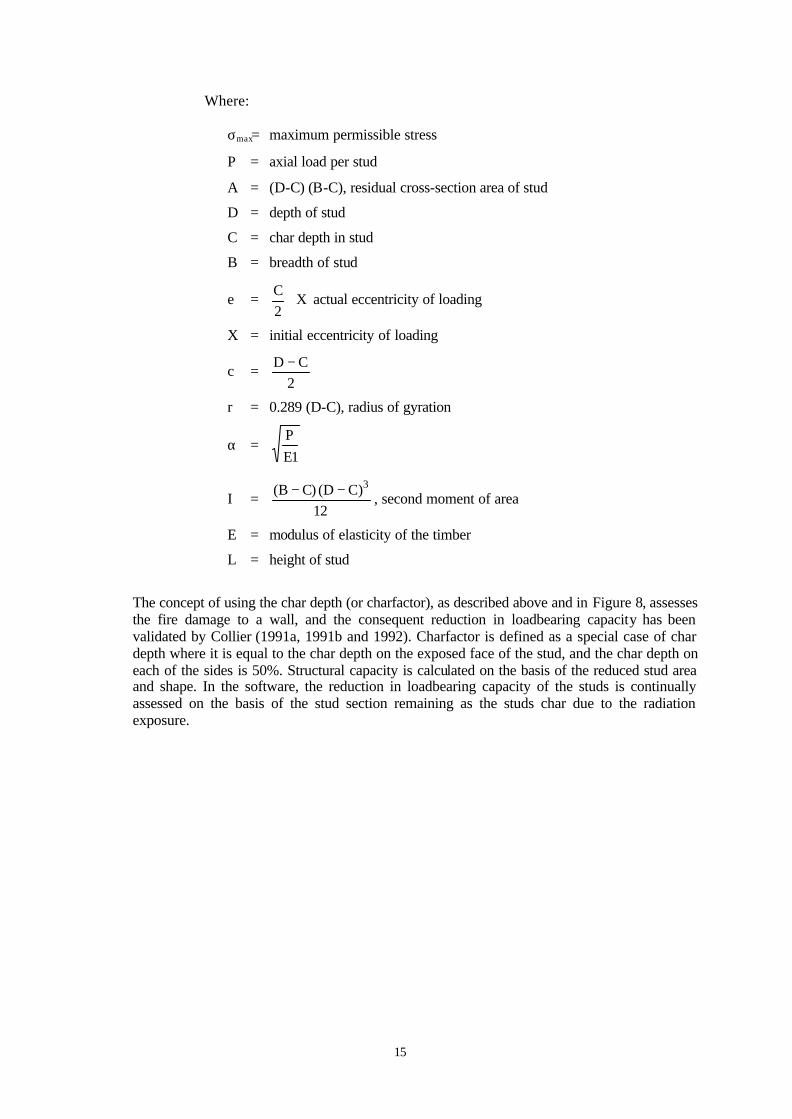
Where: σmax= maximum permissible stress
P = axial load per stud
A = (D-C) (B-C), residual cross-section area of stud
D = depth of stud
C = char depth in stud
B = breadth of stud
e = X2C + actual eccentricity of loading
X = initial eccentricity of loading
c = 2
CD −
r = 0.289 (D-C), radius of gyration
α = 1E
P
I = 12
)CD()CB( 3−− , second moment of area
E = modulus of elasticity of the timber
L = height of stud
The concept of using the char depth (or charfactor), as described above and in Figure 8, assesses the fire damage to a wall, and the consequent reduction in loadbearing capacity has been validated by Collier (1991a, 1991b and 1992). Charfactor is defined as a special case of char depth where it is equal to the char depth on the exposed face of the stud, and the char depth on each of the sides is 50%. Structural capacity is calculated on the basis of the reduced stud area and shape. In the software, the reduction in loadbearing capacity of the studs is continually assessed on the basis of the stud section remaining as the studs char due to the radiation exposure.

16
Figure 8: Loadbearing wall and charring of stud
An iterative procedure is used to calculate the loadbearing capacity since it occurs in two places on the right hand side of equation 4.8, as P andα and cannot be expressed in terms for P=f(c), where ‘P’ is an explicit function of ‘c’. Simulation proceeds comparing the applied load with the residual loadbearing capacity based on the depth of char in the stud. The loadbearing capacity reduces with respect to time, and a failure point can be predicted when the loadbearing capacity falls below the applied load.
Wall framing
L P
P P
P
fire
ambient
Original stud
Charred stud Nominal charred stud
B C/2 C/2
D C
Charred area
Uncharred area
B-C
Dimensions of nominal charred stud
Charfactor
Stud cross-section
Cavity wall construction

17
5. STRUCTURAL MODEL FOR STEEL
5.1. Heat transfer in steel frame
The modelling of heat transfer in the steel studs was trialled using two methods: finite difference analysis, and lumped thermal analysis.
5.1.1 Finite difference analysis
Using finite difference analysis to model the temperature distribution in the steel studs, heat transfer was by conduction from the exposed lining, to the adjoining flange, and to the web by convection and radiation. This approach proved to be unsuccessful. The high conductivity k of the steel contributes to a high Fourier Number (Fo) (refer to equation 2.2), which in turn requires very small time steps so that the Fo ma intains a value of approximately 0.5; otherwise the results obtained are not reliable. It was reported in Section 2 that the use of implicit equations has the advantage of being unconditionally stable, while performing the same calculation using explicit equations would result in instability if Fo ≥ 0.5. If implicit equations are used and Fo exceeds 0.5 even if instability is not apparent, which is usually obvious if values (such as temperatures) begin to oscillate between extreme negative and positive values, the quality and reliability of the calculation cannot be assured due to truncation errors. Alternatively, increasing the distance between nodes x∆ (resulting in a coarse grid) to counter the effect will also degrade the quality of the result, and in any case for a thin steel section there is little scope for increasing the grid size. Either way the result is a slow programme execution with meaningless results because of the coarse grid. For these reasons, further development of this approach was curtailed and an alternative sought.
5.1.2 Lumped thermal analysis
A more viable alternative is to consider heat input into the stud by convection/radiation on the web and conduction on the flange (see Figure 9). Heat transfer into the web can be treated as a lumped heat analysis on a thermally thin material.
Figure 9: Lumped thermal analysis
q
∞T
∞T
h h
q

18
Where the temperature rise of the stud due to cavity convection and radiation is given by:
−=
−−
∞
∞
po CLht
TTTT
ρ2
exp Equation 5.1
where:
T∞ = cavity temperature
T = steel temperature
To = initial steel temperature
h = convection/radiation coefficient
t = time
L = steel thickness / 2
ρ = steel density
Cp = specifier heat of steel
q = heat flow into and out of flanges
For conduction the entire stud is modelled as a thermal bridge between the exposed (hot) and unexposed (cold) linings. Heat enters the stud on the exposed flange and exits on the unexposed flange and consequently generates a temperature difference across the stud. Comparing modelling trials with test results indicated that there appears to be some additional resistance to the heat flow at the lining/stud interface, which is similar to the experience with multiple lining interfaces in Section 2.3. Croft and Lilley (1977) explore this phenomenon and conclude that an air gap effectively exists at the lining stud interface, although the two surfaces are essentially in contact, where the two surfaces are essentially rough and not in total contact as shown earlier in Figure 3. This is treated as an interface where the heat transfer is by convection, the convection coefficient hc
was determined by trials and a value of 10 W/mK delivered close agreement with experimental results. Further analysis of this thermal bridge effect showed that since it is a heat in-heat out on the two flanges and the net heat gain was insignificant compared with the heat received on each side of the web. Consequently, modelling of thermal bridging was omitted in the simulation of the stud temperature.
5.2. Temperature effects on loadbearing capacity
Gerlich (1995) investigated the reduction in yield strength and Modulus of Elasticity (Young’s modulus) of cold-formed steel with increasing temperature and how this would affect the loadbearing capacity of a steel-framed wall. The most significant finding was that cold-formed steel, as is used in lightweight steel studs, loses strength and stiffness more rapidly with elevated temperature than thicker section hot-rolled steel used for heavier structural loads. In the temperature range of concern, 400-600oC, the strength and stiffness are 20% lower for the cold-formed steel. The current design practice is to limit the steel temperature to 400oC. This ensures that the steel yield strength is not reduced to less than about 60% of the ambient values. This is conservative for most applications when comparing the ratio of design load to stud capacity. Limiting steel temperature does not take into account thermal deflections and resulting P- ∆ effects. Neither

19
does it consider temperature effects on the modulus of elasticity of steel, which is important to buckling analysis. Limiting temperature is believed to give conservative predictions but the margin of safety is unknown. The approach adopted in this study and incorporated in the model, was simply to determine that ‘Structural’ failure, based on a 50% load ratio had occurred when the average stud temperature exceeded 400oC as predicted by the lumped thermal analysis in Section 5.1.2. Gerlich (1995) was able to show that ‘Structural’ failure was consistently predicted at approximately 70 % of the fire resistance time of the tested specimen when failure actually occurred, giving a very conservative result. A more extensive approach was considered in this study, using the time-temperature history of the steel framing derived from the model predictions. Structural analysis would then be based on a combination of the axial load and bending, while exposed to elevated temperatures and in accordance with the AISI design manual (AISI, 1991) as modified for temperature effects by Gerlich (1995). This approach was not used, as finite difference analysis required would encounter the problems of instability outlined in Section 5.1.1.
6. EXTENSION OF MODEL TO FLOOR/CEILINGS
Extending the software to cater for a horizontal orientation of the linings as in floor/ceiling applications, as opposed to the vertical orientation for which the model was validated, required some minor changes in the treatment of the heat transfer. The only mode of heat transfer affected by orientation is convection as it is dependent on gravity and that applies only to the fluid spaces. It also follows that since the heat transfer is dominated by the radiation component at the higher temperatures then the difference that the orientation makes will be minimal but is included for completeness. Thomas (1997) used the coefficients in Table 3 for convection and radiation in floor/ceilings and applied them to the same heat transfer equations as in Section 2. Thomas also conducted a sensitivity analysis varying the value of β between the extremes of 0.5 and 3.5 and the value of the emissivity ε between 0.4 and 0.9. The variations in temperature on the ambient side of the void were less than 10oC and on the ambient side of the floor and within the joist by less than 5oC.
Table 3: Heat transfer coefficients – floor/ceilings
Position ε β γ
Fire side 0.8 1.0 1.33
Lining, fire side of cavity 0.6 1.5 1.33
Lining, ambient side of cavity 0.6 1.5 1.33
Wood stud side of cavity 0.6 1.5 1.33
Ambient side 0.6 2.2 1.33 So for the floor/ceiling exposure, the coefficients in Table 3 have been adopted for use in the FireBarrier software. There is no distinction between whether the fire attack is from above or below. In most cases, it would be expected to be from below and floor/ceiling systems are tested in that direction almost without exception.

20
The question is often asked about fire exposure from above and the research by Whiting (2003) has attempted to answer this. To model the fire exposure from above, the convection coefficients can be shown to be approximately 50% compared with the fire from below case due to the influence of buoyancy and gravity. On the basis of the sensitivity analysis performed by Thomas, temperature differences would be insignificant taking into account that radiation is the predominant heat transfer mode. This would indicate that heat transfer and temperature rises would be independent of the direction of fire attack for a symmetrical system. Since floor/ceiling systems are asymmetrical and may have a timber product on the upper surface, the performance may be significantly different. Also, in practice there may exist a cooler layer above the floor, even in a fully developed flashover fire, and this may add an element of conservatism to a result. Only limited test data is available (Whiting, 2003) for attack from above. The modelling of floor/ceiling systems has not undergone the same rigorous fire resistance testing and validation as has the similar modelling for wall and studs (Collier, 1991b). This option has been included but several cautions are in order, based on observations in fire resistance testing as described below.
6.1. Fire exposure from below
Modelling of the ‘Insulation’ failure criterion (when the temperature rise on the unexposed side exceeds 140oC) when fire attack is from below is more reliable, with some limited validation, compared with fire exposure from above. Charring of the joists is based on the same radiation model as that used for the wall studs for determining the remaining loadbearing capacity, and is validated with wall and stud data. The performance of the flooring membrane is more critical depending on whether it is a chipboard product, plywood or timber. In the case of chipboard it may swell and the glue deteriorate due to heating such that it can no longer support a point load from above, such as furniture legs, which may puncture the membrane leading to an ‘Integrity’ failure. This is not modelled and may occur some time before an ‘Insulation’ failure is predicted. No attempts have been made to model this, due to the variable nature of the product and it may not be possible to do so with any degree of reliability.
Figure 10: Fire exposure from below a floor/ceiling

21
6.2. Fire exposure from above
The testing of fire resistance of floor/ceiling systems with fire exposure from above is not required by test standards. Test standards generally state, for vertical specimens such as walls and partitions, that testing should be from both sides unless one side can be clearly identified as offering the least fire resistance. In the case of floor/ceilings testing standards only require fire exposure on the underside. In the event of fire exposure being from above the floor, thermal modelling of a timber based flooring membrane predicts the onset of char as applied to the joists. This also implies that once the floor has essentially charred through completely it can longer support a load from above, and is considered a ‘Structural’ failure, even if the joists still have a significant uncharred cross-section and loadbearing capacity. In addition, if debris were to fall onto the ceiling membrane, then it is likely that it too would also be penetrated indicating an ‘Integrity’ failure. Considering an ‘Insulation’ failure when fire attack is from above should ensure that an ‘Integrity’ failure has not occurred. The addition of non-combustible overlay on top of the flooring has been the subject of BRANZ research (Whiting, 2003) and has been shown to provide protection to the floor when there is a fire in the compartment. Although this procedure has not been specifically validated with experimental data trials with the FireBarrier software, the addition of plasterboard on top of the flooring membrane indicates a significant improvement in the fire performance when fire exposure is from above.
Figure 11: Fire Exposure from above a floor/ceiling

22
7. CONCLUSIONS
FireBarrier is a finite difference heat transfer, charring and structural model used to determine the fire resistance of vertical and horizontal barriers. The fire resistant barriers range from walls, and floor/ceilings constructed from a variety of materials ranging from timber or steel framing and various linings from gypsum plasterboard to timber products and solid core systems, which may also be lined on one or both surfaces. The operation of the FireBarrier software is based on several simplifying assumptions to allow an idealised and practical approach to some highly complex processes that occur as a fire barrier is destroyed by fire. Some of the assumptions contribute only minor sensitivity to the overall results and these involve well documented physical and heat transfer laws and physical and chemical properties. Other assumptions are required to account for the physical and chemical breakdown (ablation) of lining materials and timber. These somewhat crude assumptions have more influence on the fire resistance times calculated. FireBarrier has been subjected to a wide range of comparisons to experimental data from fire resistance tests predominantly on walls and, to lesser extent, floor/ceilings. In addition to standard fire (SA, 1997) conditions, some test specimens were exposed to more realistic fire conditions in the BRANZ furnaces and in some ventilated compartments with solid fuel fire loads. It is important that users be familiar with the underlying physics and assumptions on which this programme is based in order to be able to critically evaluate the results obtained. BRANZ takes no responsibility for any loss, or design resulting from the use of this programme, whether proper or not. All responsibility lies with the end user, who shall decide on the validity of any results obtained using FireBarrier and who shall exercise caution when applying the results to any particular situation.

23
REFERENCES
1. AISI. (1991). Load and Resistance Factor Design Specification for Cold-Formed Steel
Structural Members. American Iron and Steel Institute. Washington, USA.
2. Andersson, L. and Jansson, B. 1987. Analytical Fire Design with Gypsum – A Theoretical and Experimental Study. Institute of Fire Safety Design. Lund, Sweden.
3. British Standards Institution (BSI). (1987) Code of Practice for the Structural Use of Timber. Part 4 Fire Resistance of Timber Structures. Section 4.1 Method for Calculating Fire Resistance of Timber Members. BS 5268: Part 4: Section 4.1: 1987. London, UK.
4. Buchanan, A. H. (2001). Structural Design for Fire Safety, John Wiley and Sons, Chichester, UK.
5. Butler, C.P. (1971). Notes on Charring Rates in Wood. Fire Research Station, Note FR 896. Borehamwood, UK.
6. Collier, P. C. R. (1991a). Design of Loadbearing Light Timber Framed Walls for Fire Resistance: Part 1. Building Research Association of New Zealand, Study Report No. 36, Judgeford, Porirua City, Wellington.
7. Collier, P. C. R. (1991b). Design of Light Timber Framed Walls and Floors for Fire Resistance. Building Research Association of New Zealand Technical Recommendation No.9, Judgeford, Porirua City, Wellington.
8. Collier, P. C. R. (1992). Design of Loadbearing Light Timber Framed Walls for Fire Resistance: Part 2. Building Research Association of New Zealand, Study Report No. 42, Judgeford, Porirua City, Wellington.
9. Collier, P.C.R. (1996a). Software for the Design of Light Timber Frame Construction for Fire Resistance - a user’s guide version 1.0 Building Research Association of New Zealand, Judgeford, Porirua City, Wellington.
10. Collier, P. C. R. (1996b). A Model for Predicting the Fire Resisting Performance of Small-Scale Cavity Walls in Realistic Fires. Fire Technology, Vol. 32, No. 2, p. 120-136, 1996.
11. Collier, P. C. R. (2000). Software for the Design of Light Timber Frame Construction for Fire Resistance − a user’s guide, version 2.0. Building Research Association of New Zealand. Judgeford, Porirua City, Wellington.
12. Cooper, L. Y. (1997). The Thermal Response of Gypum-Panel/Steel-Stud Walls Systems Exposed To Fire Environments − A Simulation for Use in Zone Type Fire Models. National Institute of Standards and Technology, Gaithersburg, MD 20899.
13. Croft, D. R., and Lilley, D. G. (1977). Heat Transfer Calculations using Finite Difference Equations. Applied Sciences Publishers, Essex, UK.
14. Fuller, J. J., Leichti, R. J. and White, R. H. (1992). Temperature Distribution in a Nailed Gypsum-stud Joint Exposed to Fire. Fire and Materials, Vol 16, 95.
15. Gammon, B. W. (1987). Reliability Analysis of Wood Frame Wall Assemblies Exposed to Fire, Berkley, California: University Microfilms Dissertations Information Service, University of California, USA.

24
16. Gerlich, J. T. (1995a). Design of Loadbearing Light Steel Frame Walls for Fire Resistance. Fire engineering research report 95/3. University of Canterbury, Christchurch, New Zealand.
17. Gerlich, J. T., Collier, P. C. R. and Buchanan, A. H. (1995b). Design of Light Steel Framed Walls for Fire Resistance. Fire and Materials vol 20 No 2 p79-96. 1996.
18. Harmathy, T. Z. 1995. Properties of Build ing Materials. The SFPE Handbook of Fire Protection Engineering. Section 1 Chapter 10. Society of Fire Protection Engineers/National Fire Protection Association, Boston, USA.
19. Klippstein, K. H. (1978). Preliminary Study on the Column-Strength of Cold-Formed Steel Studs Exposed to Elevated Temperatures. American Iron and Steel Institute, Washington, USA.
20. Klippstein, K. H. (1980a). Behaviour of Cold-Formed Steel Studs in Fire Tests. American Iron and Steel Institute, Washington, USA.
21. Klippstein, K. H. (1980b). Strength of Cold-Formed Studs Exposed to Fire. American Iron and Steel Institute, Washington, USA.
22. Mehaffey, J. R., Cuerrier, P. and Carisse, G. (1994). A Model for Predicting Heat Transfer through Gypsum-Board/Wood Stud Walls Exposed to Fire. Fire and Materials. Volume 18. pp 297-305.
23. Mikkola, Esko. (1990). Charring of Wood. Espo 1990, Valtion teknillinen tutkimuskeskus, Tutkimuksia-Statens tekniska forskningscentral, Forskningsrapporter- Technical Research Centre of Finland, Research Report 689, 35p.
24. Perry, R. H. et al. (1997). Perry’s Chemical Engineers’ Handbook. McGraw-Hill, UK.
25. Rockett, J. A. and Milke, J. A. Conduction of Heat in Solids. The SFPE Handbook of Fire Protection Engineering. Section 1 Chapter 2. Society of Fire Protection Engineers/National Fire Protection Association, Boston, United States, 1995.
26. Rogers, G. F. C. and Mayhew, Y. R. (1972). ‘Engineering Thermodynamics Work and Heat Transfer.’ Department of Mechanical Engineering, University of Bristol, Longmans, London, UK.
27. Standards Australia (SA) 1997. Methods for Fire Tests on Building Materials, Components and Structures. Part 4: Fire Resistance Tests of Elements of Building Construction. AS 1530.4. North Sydney Australia.
28. Schneider, U. (1988). Concrete at High Temperatures - A General Review. Fire Safety Journal, Vol . 13, pp 55-68.
29. Sterner, E. and Wickstrom, U. (1990). TASEF – Temperature Analysis of Structures Exposed to Fire. Fire Technology SP Report 1990:05. Swedish National Testing Institute.
30. Sultan, M. A. (1996). A Model for Predicting Heat Transfer Through Noninsulated Unloaded Steel-Stud Gypsum Board Wall Assemblies Exposed to Fire. Fire Technology, Vol. 32, No. 3, p. 239.
31. Tien, C. L., Lee, K. Y. and Stretton, A. J (1995). Radiation Heat Transfer. The SFPE Handbook of Fire Protection Engineering. Section 1 Chapter 4. Society of Fire Protection Engineers/National Fire Protection Association, Boston, USA.

25
32. Thomas, G. C. (1997). Fire Resistance of Light Timber Framed Walls and Floors. Fire Engineering Research report 97/7. University of Canterbury, Christchurch, New Zealand.
33. Wade, C, A. (2002). BRANZFIRE Technical Reference Guide. BRANZ Study Report 92 (revised) Building Research Association of New Zealand, Judgeford, Porirua City, New Zealand.
34. Whiting, P. N. (2003). Behaviour of Light Timber Framed Floors Subjected to Fire Attack from Above. Building Research Association of New Zealand, Study Report SR 117. Judgeford, Porirua City, Wellington.