Embed Size (px)
Citation preview
STUDY ON THE THERMAL PERFORMANCE OF
A MULTI-LAYER STRUCTURAL GREEN ROOF PANEL
ABDULLAH-AL-MAMOON
DISSERTATION SUBMITTED IN FULFILLMENT OF
THE REQUIREMENTS FOR THE DEGREE OF MASTER
OF ENGINEERING SCIENCE
FACULTY OF ENGINEERING
UNIVERSITY OF MALAYA
KUALA LUMPUR
2017
ii
UNIVERSITY OF MALAYA
ORIGINAL LITERARY WORK DECLARATION
Name of Candidate: Abdullah-Al-Mamoon (Passport No:
Registration/Matric No: KGA120008
Name of Degree: Master of Engineering Science (M.Eng.Sc)
Title of Project Paper/Research Report/Dissertation/Thesis (“this Work”):
Study on the performance of a multi-layer structural green roof panel
Field of Study: Energy
I do solemnly and sincerely declare that:
(1) I am the sole author/writer of this Work;
(2) This Work is original;
(3) Any use of any work in which copyright exists was done by way of fair dealing
and for permitted purposes and any excerpt or extract from, or reference to or
reproduction of any copyright work has been disclosed expressly and sufficiently
and the title of the Work and its authorship have been acknowledged in this Work;
(4) I do not have any actual knowledge nor do I ought reasonably to know that the
making of this work constitutes an infringement of any copyright work;
(5) I hereby assign all and every rights in the copyright to this Work to the University
of Malaya (“UM”), who henceforth shall be owner of the copyright in this Work
and that any reproduction or use in any form or by any means whatsoever is
prohibited without the written consent of UM having been first had and obtained;
(6) I am fully aware that if in the course of making this Work I have infringed any
copyright whether intentionally or otherwise, I may be subject to legal action or
any other action as may be determined by UM.
Candidate’s Signature Date:
Subscribed and solemnly declared before,
Witness’s Signature Date:
Name:
Designation:
iii
ABSTRACT
The indoor condition of a building is one of the most important concerns for the occupants
which is affected by climatic conditions. During a typical summer day, solar radiation
heats up a building through the windows, walls, doors and especially the roof. To maintain
indoor comfort during the summer, the heat gained must be removed by a cooling system.
The energy is used for cooling purposes to make indoor comfort for the building’s
occupants. As a result, energy savings is a major focus in building design and requires
systematic investigations. It is suggested to make a proper roof design to ensure a
comfortable temperature inside a building. The main aim of this research is to
demonstrate the effectiveness of the design concept on the impact of air gaps driven by
forced ventilation effects to reduce the attic temperature. This temperature reduction
contributes to the enhancement of the comfort of the residents. In this study, eight
different indoor roof models were designed and experiments were carried out by using
solar simulator. Their performances were evaluated among the roof designs regarding the
attic temperature reduction. The main feature of the roof model is an Aluminum and PVC
tubes (which act as a moving-air path), placed on the underside of the roof. The roof
inclination angle was 30º to the horizontal. An insulation layer and ventilation fans were
integrated with the roof. These ventilation fans can help to remove the hot air to the
surroundings. The thermal performances of the roof models were evaluated by measuring
the reduction in attic temperature for each of the roof designs compared with a standard
Design-A as a baseline. Among all the designs, it was found that Design-H is 8.99 %
more efficient in attic temperature reduction than the standard roof Design-A due to metal
roof, insulation, MAP (moving-air path) and ventilation fan which contribute to the
decrease in the heat flow. The Design-H which consisted of an insulation layer, fans
(airflow in moving-air path, Vair = 1 – 1.9 m/s) and PVC tubes showed a significant
improvement in the reduction in attic temperature of 3.2 ºC compared with the
iv
conventional roof model (33.7 ºC in the attic). The theoretical calculation showed that the
annual energy savings can be as high as 37.35 kWh/m2 by using optimum conditions in
roof design. The annual cost saving of energy per unit of area is increased by up to US$
2.24/m2 by using roof Design-H. Furthermore, Adaptive Neuro Fuzzy Inference System
(ANFIS) is applied as a soft-computing method to determine the predominant variables
that affect the thermal comfort in the building. Five input parameters were used to
compute the output parameter which is the attic temperature. The outcome of this method
showed that the combination of mass flow rate and ambient temperature is the primary
factor and has the best predictor accuracy for thermal comfort in the building. All of these
significant findings indicate that the cooling system in the roof provides a new design
paradigm with greater temperature reduction and reduces the annual energy consumption.
v
ABSTRAK
Keadaan dalaman bangunan adalah salah satu perkara yang paling penting untuk
penghuni yang terjejas oleh keadaan cuaca. Sepanjang hari musim panas yang biasa,
sinaran suria memanaskan sebuah bangunan melalui tingkap, dinding, pintu dan terutama
bumbung. Untuk mengekalkan keselesaan yang tertutup pada musim panas, haba yang
diperolehi mesti dikeluarkan oleh sistem penyejukan. Tenaga digunakan untuk tujuan
penyejukan dan memberi keselesaan dalaman untuk penghuni bangunan. Hasilnya,
penjimatan tenaga adalah fokus utama dalam reka bentuk bangunan dan memerlukan
siasatan yang sistematik. Adalah dicadangkan untuk membuat reka bentuk bumbung yang
betul untuk memastikan suhu yang selesa di dalam bangunan. Tujuan utama kajian ini
adalah untuk menunjukkan keberkesanan konsep reka bentuk mengenai kesan jurang
udara didorong oleh kesan keapungan untuk mengurangkan suhu loteng. Pengurangan
suhu menyumbang kepada peningkatan dalam keselesaan penduduk. Dalam kajian ini,
lapan model bumbung yang berbeza dalaman telah direka dan eksperimen telah
dijalankan dengan menggunakan mentol lampu halogen. Persembahan mereka telah
dinilai antara reka bentuk bumbung mengenai pengurangan suhu loteng. Ciri-ciri utama
model bumbung adalah aluminium dan PVC tiub (yang bertindak sebagai jalan yang
bergerak-udara), diletakkan di bahagian bawah bumbung. Sudut kecondongan bumbung
adalah 30º kepada mendatar. Penebat lapisan dan pengudaraan peminat telah bersepadu
dengan bumbung. Peminat-peminat pengudaraan boleh membantu dalam penyingkiran
sistematik udara panas ke persekitaran. Persembahan haba model bumbung telah dinilai
dengan mengukur pengurangan suhu loteng bagi setiap reka bentuk bumbung berbanding
dengan reka bentuk A standard sebagai garis asas. Di antara semua reka bentuk, ia telah
mendapati bahawa Design-H adalah 8.99 % lebih cekap daripada Design bumbung
standard A kerana bumbung logam, penebat, MAP dan kipas pengudaraan yang
menyumbang kepada penurunan dalam aliran haba. Reka bentuk H yang terdiri daripada
vi
lapisan penebat, peminat (aliran udara di jalan bergerak udara, Vair = 1 - 1.9 m/s) dan tiub
PVC menunjukkan peningkatan yang ketara dalam pengurangan suhu loteng 3.2 ºC
berbanding model bumbung konvensional (33.7 °C di loteng). Pengiraan teori
menunjukkan bahawa penjimatan tenaga tahunan boleh menjadi setinggi 37,35 kWh/m2
dengan menggunakan keadaan optimum dalam reka bentuk bumbung. Dan penjimatan
kos tahunan tenaga per unit kawasan dikurangkan sehingga US$ 2.24/m2 dengan
menggunakan reka bentuk bumbung H. Tambahan pula, Adaptive Neuro Fuzzy Inference
System (ANFIS) digunakan sebagai kaedah lembut pengkomputeran untuk menentukan
pembolehubah utama yang mempengaruhi keselesaan terma di dalam bangunan. Lima
parameter input yang digunakan untuk mengira parameter output yang suhu loteng.
Kaedah ini keputusan menunjukkan bahawa gabungan kadar aliran jisim dan suhu ambien
adalah faktor utama dan peramal terbaik ketepatan untuk keselesaan haba di dalam
bangunan. Tambahan pula, Adaptive Neuro Fuzzy Inference System (ANFIS) digunakan
sebagai kaedah pengkomputeran untuk menentukan pembolehubah utama yang
mempengaruhi keselesaan terma di dalam bangunan. Terdapat lima parameter input
digunakan untuk mengira parameter output iaitu suhu loteng. Keputusan dari kaedah ini
menunjukkan bahawa gabungan kadar aliran jisim dan suhu persekitaran adalah faktor
utama dan peramal ketepatan terbaik untuk keselesaan haba di dalam bangunan. Semua
ini perkara-perkara penting menunjukkan bahawa sistem penyejukan di bumbung
menyediakan paradigma reka bentuk baru dengan pengurangan suhu yang lebih besar dan
mengurangkan penggunaan tenaga tahunan.

vii
ACKNOWLEDGEMENTS
In the name of Allah, The beneficant, The merciful, the author would like to express the
utmost gratitude and thanks to the almighty Allah (s.w.t) for the help and guidance that
He has given through all these years. My deepest appreciation is to the family for their
blessings and support.
Author would like to express the gratitude and profound respect to supervisors,
Associate Professor Dr. Chong Wen Tong and Mr. Poh Sin Chew for their brilliant
guidance, support and encouragement to carry out this research work. Author is deeply
indebted to them.
Finally, thanks to University of Malaya for the financial support, privileges and
opportunities to conduct this study. Author gratefully acknowledge to all the members of
the research group in helping and for suggestions, ideas, discussions and advice in
completing this research work. Author would also like to thank to Mr. Saroj, Saemul Seraj
and specially Juwel Chandra Mojumder for every kind of support and encouragement.
viii
TABLE OF CONTENTS
ABSTRACT .................................................................................................................... iii
ABSTRAK ....................................................................................................................... v
ACKNOWLEDGEMENTS .......................................................................................... vii
TABLE OF CONTENTS ............................................................................................. viii
LIST OF FIGURES ....................................................................................................... xi
LIST OF TABLES ....................................................................................................... xiii
LIST OF SYMBOLS AND ABBREVIATIONS ....................................................... xiv
CHAPTER 1: INTRODUCTION .................................................................................. 1
1.1 Background ............................................................................................................. 1
1.2 Problem statement ................................................................................................... 5
1.3 Research objective ................................................................................................... 5
1.4 Outline of dissertation ............................................................................................. 6
CHAPTER 2: LITERATURE REVIEW ...................................................................... 7
2.1 Literature review ..................................................................................................... 7
2.2 Ventilations and temperature reduction of attic .................................................... 13
2.3 Classification of Vent ............................................................................................ 14
2.3.1 Soffit vent ....................................................................................................... 15
2.3.2 Ridge vent ....................................................................................................... 15
2.3.3 Soffit vents and ridge vents ............................................................................ 16
2.3.4 Gable vent ....................................................................................................... 17
2.3.5 Goose-neck vents ............................................................................................ 17
2.3.6 Roof turbine .................................................................................................... 18
2.3.7 Attic fan .......................................................................................................... 19
2.4 Convective cooling ................................................................................................ 20
2.5 Thermal comfort .................................................................................................... 20
2.6 Indoor air quality ................................................................................................... 21
ix
2.7 Buildings and energy consumption ....................................................................... 24
2.8 Summary of roof thermal performance ................................................................. 28
CHAPTER 3: MATERIALS AND METHODOLOGY ............................................ 30
3.1 Introduction ........................................................................................................... 30
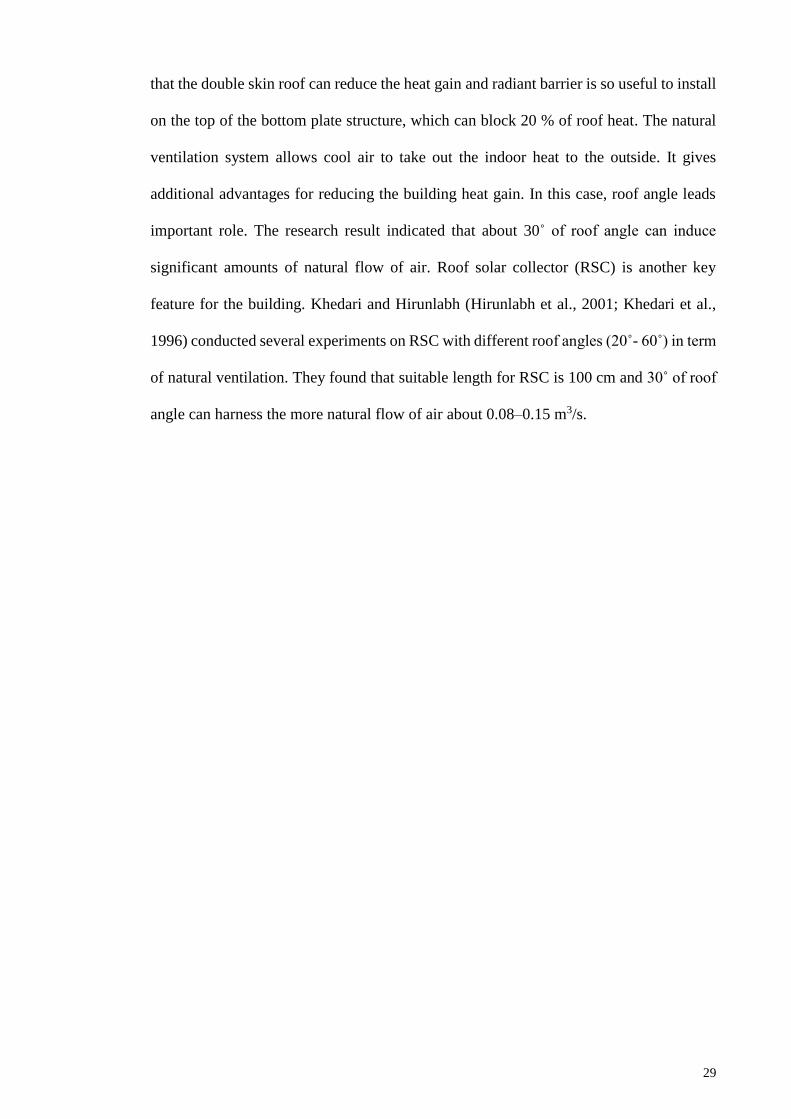
3.2 Experimental setup ................................................................................................ 30
3.3 Properties of materials of typical roof ................................................................... 33
3.4 Mathematical explanation of roof design .............................................................. 34
3.5 Effect of heat barriers ............................................................................................ 36
3.6 Forced ventilation .................................................................................................. 38
3.7 Thermal resistance model for the smart roof ......................................................... 39
3.8 Energy consumption .............................................................................................. 40
3.9 Experimental works ............................................................................................... 42
3.9.1 Roof Design-A (Metal Roof without Ventilation System) ............................. 42
3.9.2 Roof Design-B (Metal Roof with Insulation Material) .................................. 43
3.9.3 Roof Design-C (Metal Roof with Aluminum Tube) ...................................... 44
3.9.4 Roof Design-D (Metal Roof and PVC Tube) ................................................. 45
3.9.5 Roof Design-E (Metal Roof, Al Tube and Insulation Material) ..................... 46
3.9.6 Roof Design-F (Metal Roof, PVC Tube and Insulation Material) ................. 47
3.9.7 Roof Design-G (Metal Roof, Al Tube, Insulation Material and Fan) ............ 48
3.9.8 Roof Design-H (Metal Roof, PVC Tube, Insulation Material and Fan)......... 49
3.10 Adaptive Neuro-Fuzzy Inference System (ANFIS) ............................................ 51
3.11 Data training ........................................................................................................ 53
CHAPTER 4: RESULTS AND DISCUSSION .......................................................... 57
4.1 Comparison of attic temperatures .......................................................................... 57
4.2 Comparison of heat transfer mediums ................................................................... 62
4.3 Comparison of tube surface temperatures ............................................................. 63
4.4 Comparative study of the ventilation fan .............................................................. 65
4.5 Thermal performance of roof designs ................................................................... 67
x
4.6 Error analysis of experimental result ..................................................................... 70
4.7 Comparison among the existing roof models ........................................................ 71
4.8 Computational results from ANFIS prediction model .......................................... 73
CHAPTER 5: CONCLUSION AND RECOMMENDATION ................................. 78
5.1 Conclusion ............................................................................................................. 78
5.2 Recommendation for future work ......................................................................... 79
BIBLIOGRAPHY ......................................................................................................... 81
LIST OF PUBLICATIONS .......................................................................................... 89
APPENDIX A: CALCULATION ................................................................................ 90
xi
LIST OF FIGURES
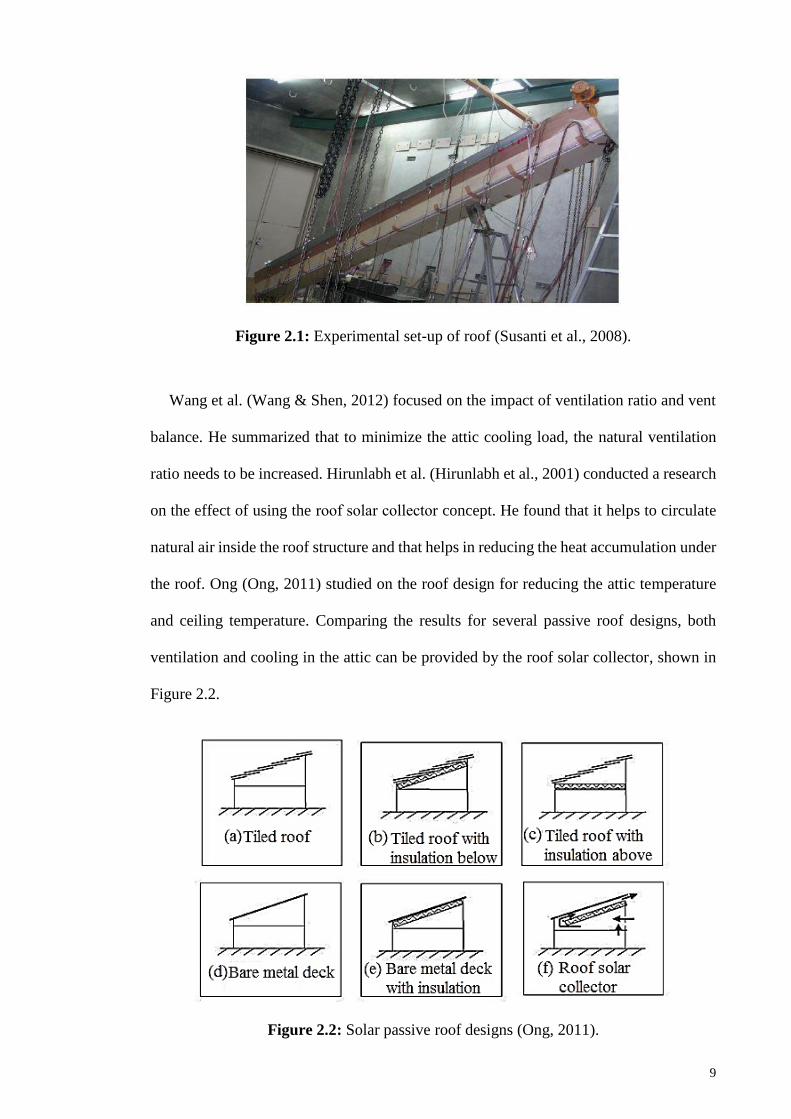
Figure 2.1: Experimental set-up of roof (Susanti et al., 2008). ......................................... 9
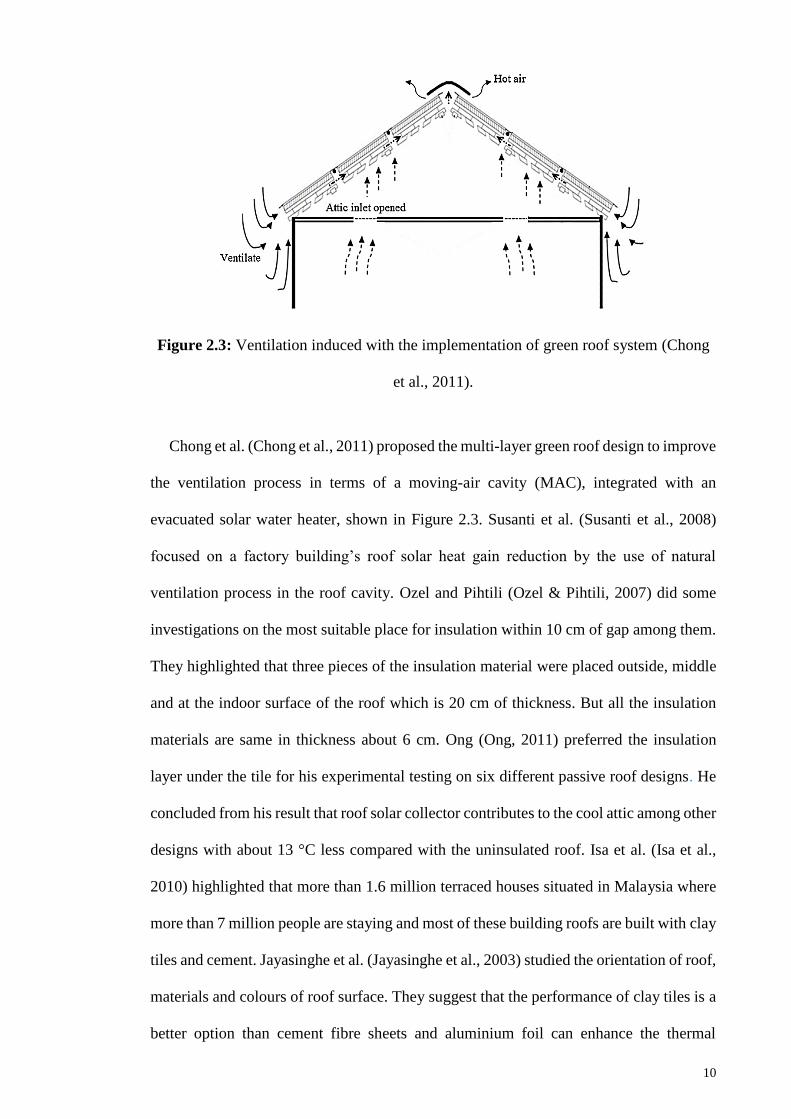
Figure 2.2: Solar passive roof designs (Ong, 2011). ......................................................... 9
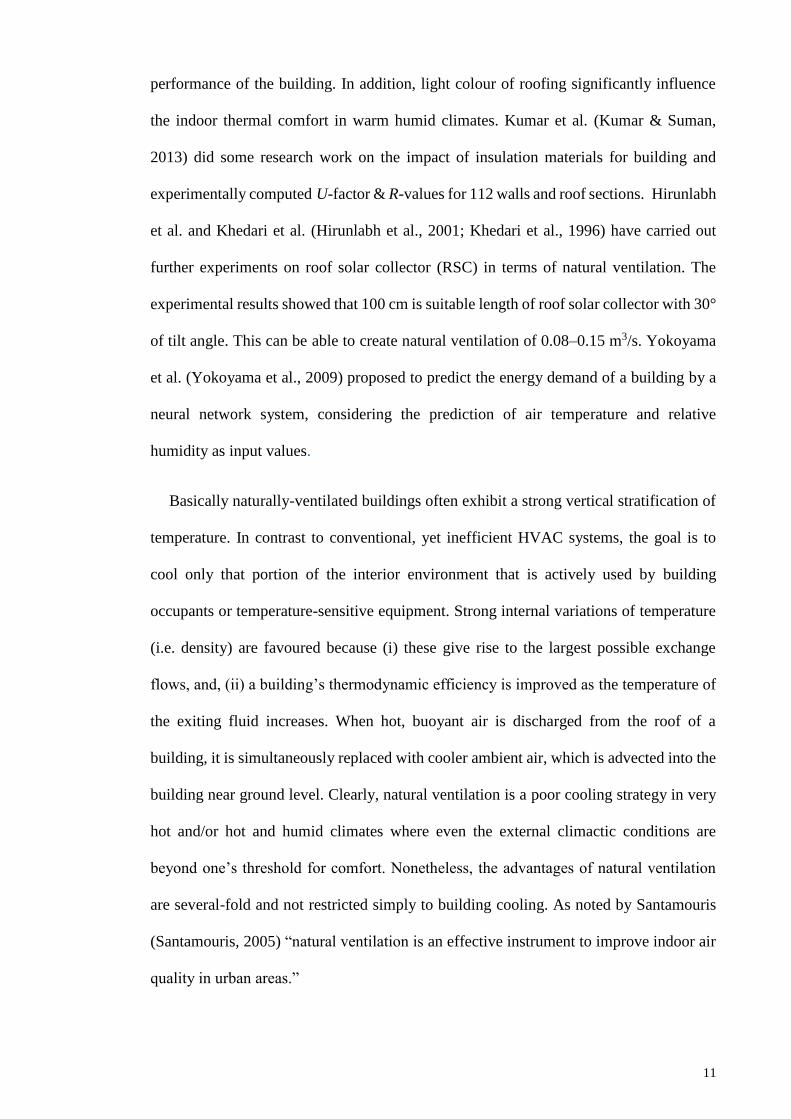
Figure 2.3: Ventilation induced with the implementation of green roof system
(Chong et al., 2011). ..................................................................................... 10
Figure 2.4: Soffit Vent (SoffitVent, 2015). ..................................................................... 15
Figure 2.5: Ridge vent (RidgeVent, 2015). ..................................................................... 16
Figure 2.6: Soffit and Ridge vent ("Proper Attic Ventilation," 2015). ........................... 16
Figure 2.7: Gable vent (Shepard k., 2016). ..................................................................... 17
Figure 2.8: Goose-neck vents (BulletProducts, 2013). ................................................... 18
Figure 2.9: Roof turbine (Millette, 2015)........................................................................ 19
Figure 2.10: Attic fan (Carter, 2016). ............................................................................. 19
Figure 2.11: Building energy consumption (Hameed, 2009). ......................................... 25
Figure 2.12: Electricity demand by sector (Mobil, 2016). .............................................. 25
Figure 2.13: Global energy consumption in residential sectors (Saidur et al., 2007) .... 27
Figure 3.1: (a) Dimensions of perspex model; (b) Position of tubes, sensors and
thermometer. ................................................................................................ 31
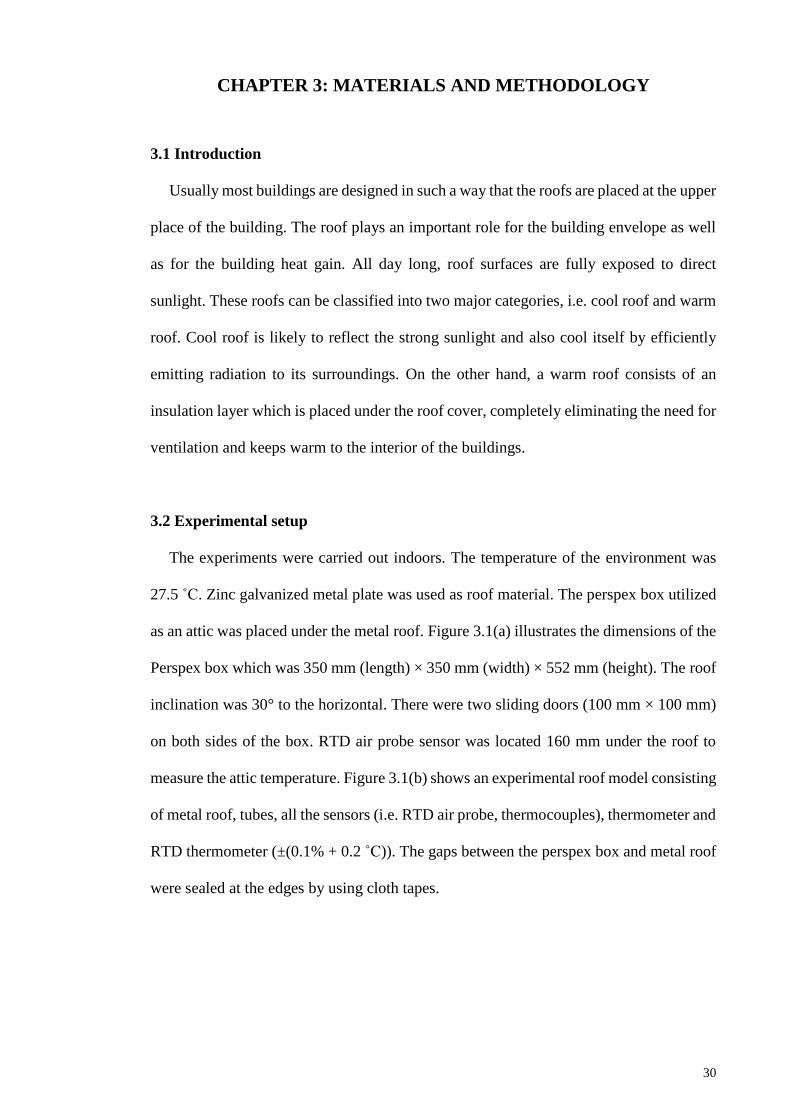
Figure 3.2: Overall view of indoor experimental setup. ................................................. 32
Figure 3.3: Schematic view of solar power meter position on roof surface. .................. 32
Figure 3.4: Schematic view of thermocouple position on roof top and bottom
surface. ......................................................................................................... 33
Figure 3.5: Sectional view of our integrated roof design. ............................................... 35
Figure 3.6: Hollow pipe heat flux. .................................................................................. 37
Figure 3.7: Roof Design-A: (a) Simple metal roof model; (b) Schematic view of
sensors and probe. ........................................................................................ 43
Figure 3.8: Roof Design-B: (a) Metal roof with insulation material; (b) Schematic
view of sensors and probe. ........................................................................... 44
xii
Figure 3.9: Roof Design-C: (a) Metal roof with Al tube; (b) Schematic view of
sensors and probe. ........................................................................................ 45
Figure 3.10: Roof Design-D: (a) Metal roof with PVC tube; (b) Schematic view of
sensors and probe. ...................................................................................... 46
Figure 3.11: Roof Design-E: (a) Metal roof, Al tube and insulation layer;
(b) Schematic view of sensors and probe. ................................................. 47
Figure 3.12: Roof Design-F: (a) Metal roof, Al tube and insulation layer;
(b) Schematic view of sensors and probe. ................................................. 47
Figure 3.13: Roof Design-G: (a) Metal roof, Al tube, insulation layer and
ventilation fan; (b) Schematic view of sensors and probe. ........................ 48
Figure 3.14: Roof Design-H: (a) Metal roof, PVC tube, insulation layer and
ventilation fan; (b) Schematic view of sensors and probe. ........................ 49
Figure 3.15: Schematic view of sensors and probes placement in different roof
designs. ...................................................................................................... 50
Figure 3.16: ANFIS model structure. .............................................................................. 53
Figure 4.1: Attic temperatures in different roof designs. ................................................ 58
Figure 4.2: Temperature difference with variation of air velocity in Design-G. ............ 60
Figure 4.3: Temperature difference with variation of air velocity in Design-H. ............ 60
Figure 4.4: Heat gained in attic under different mass flow rate of cooling air. .............. 62
Figure 4.5: Tube surface temperature profile for PVC and Al. ...................................... 64
Figure 4.6: Surface temperature profile at the bottom of the tube for Design-E and
Design-F (without fan). ................................................................................ 65
Figure 4.7: Surface temperature profile at the bottom of the tube for Design-G and
Design-H (with fan). .................................................................................... 66
Figure 4.8: Temperature of insulation in roof Design-G and Design-H. ........................ 67
Figure 4.9: Percentage of thermal performance. ............................................................. 68
Figure 4.10: Annual energy savings for different roof designs compared to Design-A. 69
Figure 4.11: Influence of input parameters on the attic temperature. ............................. 75
Figure 4.12: ANFIS predicted relationship between mass flow rate of cooling air
and ambient temperature on the attic temperature for Design-H. .............. 77
xiii
LIST OF TABLES
Table 3.1: List of materials properties and dimensions .................................................. 34
Table 3.2: Input parameter .............................................................................................. 41
Table 3.3: List of different roof designs.......................................................................... 51
Table 4.1: Temperature comparison of different roof designs. ....................................... 59
Table 4.2: Annual energy consumption of each of the design. ....................................... 69
Table 4.3: Relative standard deviation for Design (A-H). .............................................. 71
Table 4.4: Comparisons of different roof designs. .......................................................... 72
Table 4.5: Input parameters. ........................................................................................... 74
Table 4.6: Output parameter. .......................................................................................... 74
Table 4.7: Checking error of input parameters ............................................................... 75
Table 4.8: ANFIS root-mean square errors for attic temperature prediction. ................. 76
xiv
LIST OF SYMBOLS AND ABBREVIATIONS
Abbreviation
Al Aluminium tube
COP Coefficient of performance air condition
MAP Moving-air path
PVC PVC tube
RSME Root mean square error
TS Thermocouple sensors
Symbol
A Area of tube opening (m2)
Ar Roof area (m2)
ACLH Annual cooling load hours (Hours)
Cp Specific heat capacity of air at constant pressure (Jkg-1K-1)
Ce Tariff rate of electricity ($/kWh)
h Heat transfer coefficient (Wm-2k-1)
K Thermal conductivity (Wm-1k-1)
L length of the roof (m)
•
m Mass flow rate (kgs-1)
Qs Radiation heat supplied by halogen bulbs (W)
Qve Exhausted heat (W)
Q1(cond,in) Total conductive heat from roof surface to pipe (W)
Q1(conv,out) Convection heat from roof surface to atmosphere (W)
Q1(rad,out) Heat radiation to atmosphere from roof (W)
Q2(rad,in) Heat radiation to tube top to tube inner side (W)
QA Conduction heat from tube to attic (W)
Q2(conv,in) Inner tube convection heat (W)
xv
Q3(rad,in) Heat radiation from tube bottom surface to attic (W)
Q3(conv,in) Convection heat from tube bottom surface to attic (W)
Q Heat flux (Wm-2)
Rroof Thermal resistance of roof (m2KW-1)
Rins Thermal resistance of insulation material (m2KW-1)
Rs Thermal resistance of roof area (m2KW-1)
Rt,c Thermal contact resistance (m2KW-1)
Rt,cond Thermal resistance for radial conduction (m2KW-1)
re Roof outer surface thermal resistance (m2KW-1)
ri Roof inner surface thermal resistance (m2KW-1)
Re Reynolds number
ri Inner radius of tube (mm)
ro Outer radius of tube (mm)
To Outdoor temperature (K)
Tout Outlet air temperature (K)
Tin Inlet air temperature (K)
Ts Surface temperature (K)
Ta Ambient temperature (K)
Tattic Attic temperature (K)
Ttop Temperature of roof top surface (K)
Tbottom Temperature of roof bottom surface (K)
t Insulation thickness (mm)
Vair Air velocity (ms-1)
xc critical distance (mm)
z Dimensionless parameter for the thermal resistance
ε Thermal emissivity
Air density, kgm-3
1
CHAPTER 1: INTRODUCTION
1.1 Background
Weather condition is a key factor that affects the physical, habitual and living style of
mankind. Outdoor climate can vastly affect indoor conditions (De Waal, 1993). Adapting
a building to the climate can protect its inhabitants against the extreme outdoor
conditions, and also create suitable indoor conditions (Maneewan et al., 2005). As a result
of raised awareness on environment, energy saving has become a considerable issue and
several different designs and alternative ways were suggested worldwide (Maneewan et
al., 2005). At present, most of the developed and developing countries are trying to find
new ideas in order to maintain the indoor temperature within a comfortable limit.
Different modern technologies are being used to achieve the required thermal comfort,
but these are not economically feasible. The quality of the indoor environment has a direct
influence on occupants’ health because people spend more than 90 % of their time indoors
(Chen & Huang, 2012). Typically tropical countries have high annual temperatures,
therefore passive solar designs of buildings are necessary for improving indoor
environment quality (Hirunlabh et al., 2001). Estimates provided by the United Nations
Centre for Human Settlements suggest that 30 % of the world’s buildings are inadequately
ventilated. In part, this statistic is a reflection of external pollution, for example due to
automobile or industrial exhaust. It must be emphasized, however, that the built
environment introduces its own surfeit of noxious chemicals. In developing countries,
indoor pollution is more often associated with other sources. Enhanced ventilation
through natural processes may also serve an important health benefit, particularly for
those without reliable access to electricity or other power sources.
Most of the residential buildings do not have an air-conditioner installed in the building
in the coastal areas and mild climate zones. So, the cooling system of the building is fully
2
dependent on natural ventilation (Wang & Chen, 2014). The relative humidity and
ambient air temperature lie in the ranges of 60 – 90 % and 26 – 40 °C, respectively in
Malaysia which is a tropical country (Ong, 2011). This sort of climatic condition is so
uncomfortable for people to stay inside or outside of their residence. More specifically,
the low rise residential buildings in Malaysia are found where high intensity of heat is
transmitted through the building envelope. Furthermore, 70 % of building heat gain can
be passed through the roof (Yew et al., 2013). So, air ventilation would be the solution
to reduce the heat gain in terms of less electricity consumption.
The ventilation system based on mechanical parts, is one of the important features and
is of greatest interest for the design expertise (Susanti et al., 2011) because the benefit of
ventilation on the cooling load of a building results in lower electric power consumption.
By improving the ventilation system, indoor heat gain can be reduced remarkably and a
low energy building can be achieved. Therefore, cooling load would be reduced in the
occupied area and also to remove the moisture content. Moreover, attic ventilation is one
of the vital and conventional features for the building. Adequate natural ventilation helps
to exchange the inside air with sufficient volume of outside cool air. Thus, moisture is
easily evacuated from the indoor part to a certain extent. But natural ventilation is mostly
depending on wind flow. If there is insufficient wind flow, the alternative way is to
introduce buoyancy to drive the flow of ventilation. It is due to a difference of air density
between the inside and outside which results from moisture and temperature differences
(Hussain & Oosthuizen, 2012). Buoyancy of indoor hot air is considered when natural
ventilation is available to cool the attic. Normally during the summer, it is extremely
uncomfortable without proper ventilation system or even air conditioning system in the
building. Thus, it causes the highest rate of electricity consumption to cool the interior
part. It is very important to find a good way to minimise the building heat gain and
electricity consumption by improving energy efficient building designs.
3
Santamouris’(Santamouris, 2005) observed that “energy consumption defines the
quality of urban life”. Unfortunately, the energy demands of large urban areas pose a
significant strain on environmental resources, as the following statistics illustrate. Each
year, the world’s urban population increases by approximately 60 million residents.
However, for each 1% increase of population, urban energy consumption increases by
more than 2%. A major culprit in these alarming figures is the energy used by modern
buildings, which consume approximately 40% of the world’s energy and are responsible
for 50% of global anthropogenic CO2 emissions. In the United States, which is the world’s
largest producer of CO2, a significant fraction of the energy expended by buildings is
devoted to summer-time cooling by high-consumption HVAC systems. Indeed, it is
estimated that 3.5×10⁹ m2 of commercial space are actively cooled by traditional air
conditioners at an annual energy cost of approximately 250 TWh. Natural ventilation
seeks to reduce this energy demand by achieving adequate cooling through judicious use
of freely-available resources such as wind forcing, solar radiation and unavoidable
internal heat gains.
Energy demand associated with the energy transfer through the building envelope
should be controlled to reduce the energy consumption efficiently for indoor thermal
comfort (Domínguez et al., 2012). By changing the orientation and tilt, the surface
temperature of a building envelope can be increased up to 75–80 °C during the hot periods
of the year (Dimoudi et al., 2006). For the rooms under the exposed roof, the heat
transmission across the roof is about 50–70 % of the total heat entry. Thus, significant
efforts have been made to decrease the heat transmission across the roofs (Lai & Wang,
2011). The amount of energy to cool/heat an envelope-dominated structure depends on
the level of thermal consideration (Al-Homoud, 2005).
The major reason for the high amount of energy consumption begins while the sun
radiates the heat on the building roof surface. Heat passes through the roof and raises the
4
temperature of the attic. Thus, continuous accumulation of heat and radiation to the attic
floor causes the temperature to keep on increasing. In a hot day, without any attic
ventilation system for a house, the outside temperature is 32 ºC and the roof surface
temperature is as high as 77 ºC according to technical data from (Al-Obaidi et al., 2014).
In addition, attic floor temperature would be approximately 60 ºC. These temperatures
rise so high due to unventilated roof spaces, heavy installed insulation which can absorb
and influence to accumulate more heat. Moreover, there is less possibility to remove the
accumulated heat through the night and to reduce the cooling load. As a result, more
initiatives need to be taken for thermal comfort which would be costly. Even the situation
can be problematic if the heat accumulation keeps continuing in the attic till the night
which would make it more uncomfortable for the occupants. Thus, more energy is
required for thermal comfort and that is costly. So, the global position of each country is
the key factor in building thermal comfort because buildings are designed based on the
specific country’s location, weather and climatic conditions.
Malaysia is situated near the equator. The ambient temperatures and relative humidity
is too high. Furthermore, the low speed winds consisting of Northeast and Southwest
Monsoons are experienced in a year. A low and unsteady wind speed (for more than 90%
of total wind hours, free-stream wind speed, V∞ < 4 m/s) is common on most of the
mainland (Chong et al., 2012; Chong et al., 2013; Chong et al., 2010; Ong, 2011). This
climate will stimulate uncomfortable environment for human beings. In summer, without
air conditioning or proper ventilation system, it causes thermal discomfort for the
residents inside a building, resulting in high electricity demand for cooling the interior
part of the residence. Undoubtedly, it is very important to find a way for optimizing the
building’s energy consumption by implementing an effective energy saving design (Lai
& Wang, 2011). Air may be moved from indoor to outdoor or outdoor to indoor of the
building by ventilation to remove the indoor heat. Thus, the indoor can be cooled, even
5
when its temperature is higher than the outdoor. The interior condition is not changed by
the air circulation, however, it becomes more comfortable for the occupants (Hirunlabh
et al., 2001).
1.2 Problem statement
A building is a very important thing for people to stay safe and to lead a comfortable
life. Therefore, proper building design is essential to achieve these requirements. Owing
to this proper ventilation system of a building is one of the major things which cannot be
ignored. At present, modern buildings usually use air conditioning systems which
contribute to high electricity consumption. At the same time, there is an increase in world
population particularly in developing countries. Hence, it is highly desirable to build
houses having good indoor condition. The improvement of ventilation systems is one of
the feasible ways to minimize the consumption rate of electricity. Nowadays there is an
increased concern about the natural ventilation system of a building. Furthermore, energy
demand has been increasing rapidly throughout the world since the last decade. Thus,
more research and system developments are needed in order to utilize the renewable
energy sources for better implementation on ventilation systems.
1.3 Research objective
The aim of this work is to design and construct a cool roof system for reducing the
attic temperature. The main purpose of this research is to find a way to reduce the heat
accumulation under the roof structure and to induce proper ventilation. Eight specific
configurations of small scaled roof models were made for the indoor lab testing. It also
provides an experimentally based model which can be considered as a future roof design.
Hence three objectives are being selected to achieve the goal of this research work.
6
• To design and fabricate suitable roof models and conduct experimental work
indoors to analyze the cooling effects.
• To reduce the attic temperature by implementing a ventilation system, using
different mass flow rates.
• To maximize the energy saving for the residential building.
1.4 Outline of dissertation
This dissertation comprises five chapters. The chapters have been organized in the
following ways. In Chapter 1, a brief background of this study has been presented. In the
last part of this chapter problem statement and objectives of this study have also been
included. In Chapter 2, a literature survey comprising the previous studies on the roof
ventilation and the application of various ventilation systems to optimize the room
temperature is given. Some important topics like thermal comfort, indoor air quality
(IAQ) and energy consumption of building are also briefly discussed. Chapter 3 describes
the mechanism of the experiments and the materials configurations which are used in
experiment. It also contains mathematical explanation and estimation of energy
consumption of the building. There is an introduction to ANFIS as a soft-computing
method which is briefly discussed. In Chapter 4, the experimental results are presented.
Experimental data is fitted to the proposed models. Graphical presentation is given and
the heat transfer process is fully discussed. In addition, the ANFIS method is implemented
to the significant outcome of the experimental results. The last chapter, Chapter 5 wraps
up the dissertation with some concluding remarks. The recommendations of future works
are also described for the improvement of the system.
7
CHAPTER 2: LITERATURE REVIEW
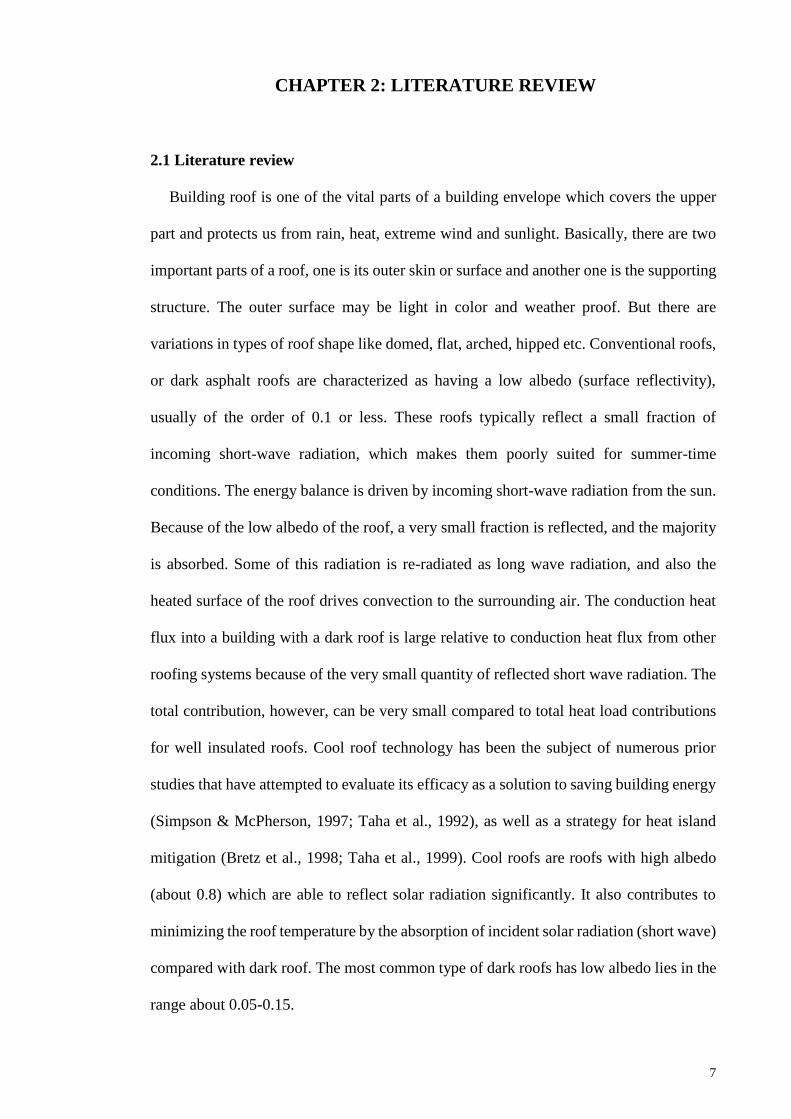
2.1 Literature review
Building roof is one of the vital parts of a building envelope which covers the upper
part and protects us from rain, heat, extreme wind and sunlight. Basically, there are two
important parts of a roof, one is its outer skin or surface and another one is the supporting
structure. The outer surface may be light in color and weather proof. But there are
variations in types of roof shape like domed, flat, arched, hipped etc. Conventional roofs,
or dark asphalt roofs are characterized as having a low albedo (surface reflectivity),
usually of the order of 0.1 or less. These roofs typically reflect a small fraction of
incoming short-wave radiation, which makes them poorly suited for summer-time
conditions. The energy balance is driven by incoming short-wave radiation from the sun.
Because of the low albedo of the roof, a very small fraction is reflected, and the majority
is absorbed. Some of this radiation is re-radiated as long wave radiation, and also the
heated surface of the roof drives convection to the surrounding air. The conduction heat
flux into a building with a dark roof is large relative to conduction heat flux from other
roofing systems because of the very small quantity of reflected short wave radiation. The
total contribution, however, can be very small compared to total heat load contributions
for well insulated roofs. Cool roof technology has been the subject of numerous prior
studies that have attempted to evaluate its efficacy as a solution to saving building energy
(Simpson & McPherson, 1997; Taha et al., 1992), as well as a strategy for heat island
mitigation (Bretz et al., 1998; Taha et al., 1999). Cool roofs are roofs with high albedo
(about 0.8) which are able to reflect solar radiation significantly. It also contributes to
minimizing the roof temperature by the absorption of incident solar radiation (short wave)
compared with dark roof. The most common type of dark roofs has low albedo lies in the
range about 0.05-0.15.
8
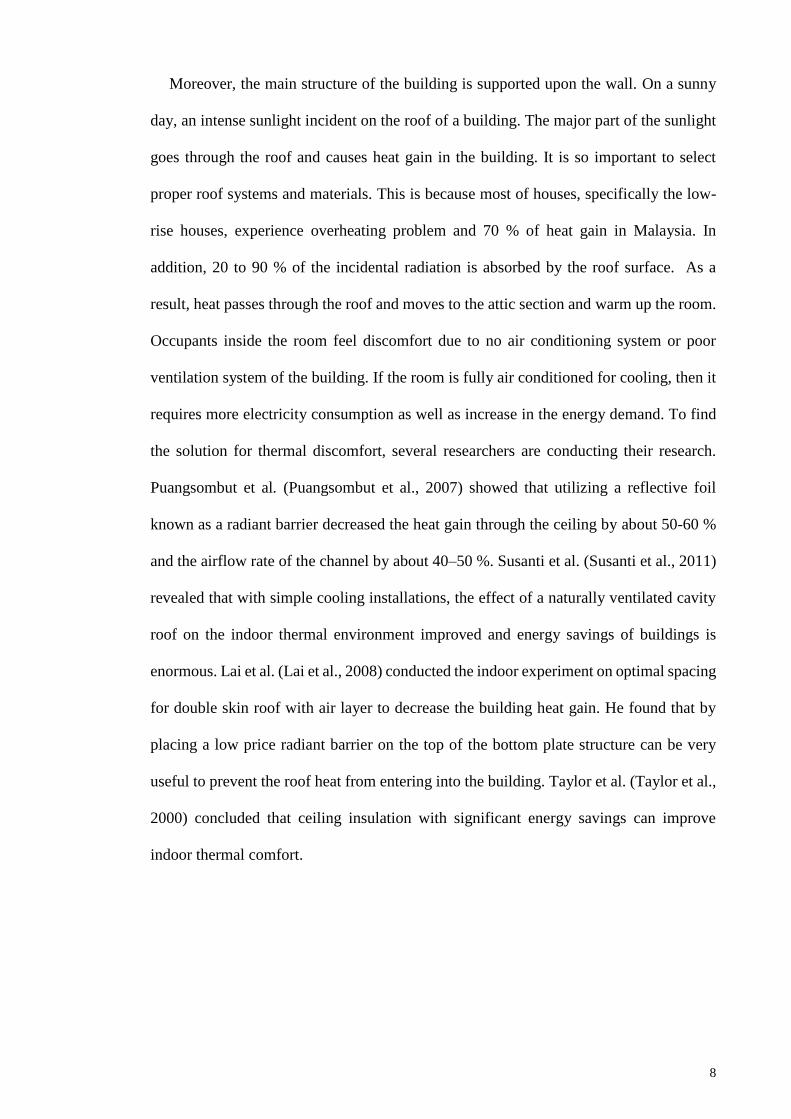
Moreover, the main structure of the building is supported upon the wall. On a sunny
day, an intense sunlight incident on the roof of a building. The major part of the sunlight
goes through the roof and causes heat gain in the building. It is so important to select
proper roof systems and materials. This is because most of houses, specifically the low-
rise houses, experience overheating problem and 70 % of heat gain in Malaysia. In
addition, 20 to 90 % of the incidental radiation is absorbed by the roof surface. As a
result, heat passes through the roof and moves to the attic section and warm up the room.
Occupants inside the room feel discomfort due to no air conditioning system or poor
ventilation system of the building. If the room is fully air conditioned for cooling, then it
requires more electricity consumption as well as increase in the energy demand. To find
the solution for thermal discomfort, several researchers are conducting their research.
Puangsombut et al. (Puangsombut et al., 2007) showed that utilizing a reflective foil
known as a radiant barrier decreased the heat gain through the ceiling by about 50-60 %
and the airflow rate of the channel by about 40–50 %. Susanti et al. (Susanti et al., 2011)
revealed that with simple cooling installations, the effect of a naturally ventilated cavity
roof on the indoor thermal environment improved and energy savings of buildings is
enormous. Lai et al. (Lai et al., 2008) conducted the indoor experiment on optimal spacing
for double skin roof with air layer to decrease the building heat gain. He found that by
placing a low price radiant barrier on the top of the bottom plate structure can be very
useful to prevent the roof heat from entering into the building. Taylor et al. (Taylor et al.,
2000) concluded that ceiling insulation with significant energy savings can improve
indoor thermal comfort.
9
Figure 2.1: Experimental set-up of roof (Susanti et al., 2008).
Wang et al. (Wang & Shen, 2012) focused on the impact of ventilation ratio and vent
balance. He summarized that to minimize the attic cooling load, the natural ventilation
ratio needs to be increased. Hirunlabh et al. (Hirunlabh et al., 2001) conducted a research
on the effect of using the roof solar collector concept. He found that it helps to circulate
natural air inside the roof structure and that helps in reducing the heat accumulation under
the roof. Ong (Ong, 2011) studied on the roof design for reducing the attic temperature
and ceiling temperature. Comparing the results for several passive roof designs, both
ventilation and cooling in the attic can be provided by the roof solar collector, shown in
Figure 2.2.
Figure 2.2: Solar passive roof designs (Ong, 2011).
10
Figure 2.3: Ventilation induced with the implementation of green roof system (Chong
et al., 2011).
Chong et al. (Chong et al., 2011) proposed the multi-layer green roof design to improve
the ventilation process in terms of a moving-air cavity (MAC), integrated with an
evacuated solar water heater, shown in Figure 2.3. Susanti et al. (Susanti et al., 2008)
focused on a factory building’s roof solar heat gain reduction by the use of natural
ventilation process in the roof cavity. Ozel and Pihtili (Ozel & Pihtili, 2007) did some
investigations on the most suitable place for insulation within 10 cm of gap among them.
They highlighted that three pieces of the insulation material were placed outside, middle
and at the indoor surface of the roof which is 20 cm of thickness. But all the insulation
materials are same in thickness about 6 cm. Ong (Ong, 2011) preferred the insulation
layer under the tile for his experimental testing on six different passive roof designs. He
concluded from his result that roof solar collector contributes to the cool attic among other
designs with about 13 °C less compared with the uninsulated roof. Isa et al. (Isa et al.,
2010) highlighted that more than 1.6 million terraced houses situated in Malaysia where
more than 7 million people are staying and most of these building roofs are built with clay
tiles and cement. Jayasinghe et al. (Jayasinghe et al., 2003) studied the orientation of roof,
materials and colours of roof surface. They suggest that the performance of clay tiles is a
better option than cement fibre sheets and aluminium foil can enhance the thermal
11
performance of the building. In addition, light colour of roofing significantly influence
the indoor thermal comfort in warm humid climates. Kumar et al. (Kumar & Suman,
2013) did some research work on the impact of insulation materials for building and
experimentally computed U-factor & R-values for 112 walls and roof sections. Hirunlabh
et al. and Khedari et al. (Hirunlabh et al., 2001; Khedari et al., 1996) have carried out
further experiments on roof solar collector (RSC) in terms of natural ventilation. The
experimental results showed that 100 cm is suitable length of roof solar collector with 30°
of tilt angle. This can be able to create natural ventilation of 0.08–0.15 m3/s. Yokoyama
et al. (Yokoyama et al., 2009) proposed to predict the energy demand of a building by a
neural network system, considering the prediction of air temperature and relative
humidity as input values.
Basically naturally-ventilated buildings often exhibit a strong vertical stratification of
temperature. In contrast to conventional, yet inefficient HVAC systems, the goal is to
cool only that portion of the interior environment that is actively used by building
occupants or temperature-sensitive equipment. Strong internal variations of temperature
(i.e. density) are favoured because (i) these give rise to the largest possible exchange
flows, and, (ii) a building’s thermodynamic efficiency is improved as the temperature of
the exiting fluid increases. When hot, buoyant air is discharged from the roof of a
building, it is simultaneously replaced with cooler ambient air, which is advected into the
building near ground level. Clearly, natural ventilation is a poor cooling strategy in very
hot and/or hot and humid climates where even the external climactic conditions are
beyond one’s threshold for comfort. Nonetheless, the advantages of natural ventilation
are several-fold and not restricted simply to building cooling. As noted by Santamouris
(Santamouris, 2005) “natural ventilation is an effective instrument to improve indoor air
quality in urban areas.”
12
Recently, artificial intelligent (AI) method adopts the real system in order to create an
intelligent system that understand, thinks, learns and behaves like human beings (Cohen
& Feigenbaum, 2014). Artificial intelligent has been widely used in solving engineering
problems as well as predicting the energy demand of a building and other applications
like wind turbines (Chong et al., 2016; Mojumder et al., 2016). Yokoyama et al.
(Yokoyama et al., 2009) applied the neural network method in order to predict the demand
of cooling for a building and the modal trimming method is adopted to find the parameters
of the model. Although additional input variables such as relative humidity and air
temperature could improve the accuracy of the identification process for the model
parameter in the neural network, it also affects on the building cooling demand’s
prediction. Ekici and Aksoy (Ekici & Aksoy, 2009) applied back propagation three
layered Artificial Neural Network (ANN) for the estimation of the heating energy
requirement of three different types of building with the same footprint but at different
building orientations varying from 0o to 80o. The results are compared with numerical
simulation and the accuracy is above 90 %. The design of the building ventilation system
is a complicated work which involved outdoor temperature, the amount of solar radiation,
wind speed, thermo-physical properties of materials, orientation, building form factor etc.
Hence, there is a necessity for a comprehensive understanding of the performance and
also other design considerations during the development of the building ventilation
system.
Here, the best experimental results are applied in the ANFIS to determine and resolve
the most influential parameter for the attic temperature (Tattic) of the building. Five input
parameters for the ANFIS system are mass flow rate of cooling air (�̇�), sol-air
temperature (Tsol-air), inlet air temperature (Tin), outlet air temperature (Tout) and ambient
temperature (Ta) of the building. Furthermore, ANFIS results are validated by the
13
observed data with the help of RSME (root mean square error). This study is useful to
provide a fundamental understanding of the heat transfer process in the smart roof system.
2.2 Ventilations and temperature reduction of attic
Solar radiation incident on the roof surface results in an increase in temperature in the
attic. In this case, ventilation system plays a vital role to reduce the effect of this heat
transfer to the attic. Basically, the roof is exposed to the sun and receives the maximum
heat compared with other parts of the building. If it is possible to reduce the attic space
temperature, then it would be effective for the ceiling part and the occupants’ area as well.
In order to make a suitable environment for the occupants, a proper roof design is required
to allow a continuous flow of natural cool air to take out the hot air before reaching the
attic floor. So far, climate condition is one of the vital factors for roof design, thus a well-
designed attic ventilation system varies based on the different locations in the world. For
the Malaysian climate, less research has been done in terms of the impact of thermal
performances in the attic. Based on the various literature review, vented attic is much
more important in building design. In the early stages of the research, the experiment was
conducted between the vented and unvented attic in USA since 1979 (Al-Obaidi et al.,
2014) which indicated that ventilation in attic can make a significant difference in attic
air temperature. Peavy (Peavy, 1979) has done some simulation work on the monitored
Houston house. He observed that about 31 % of ceiling heat load could be decreased by
using effective ventilation process compared with unventilated system. Even Fairey and
Swami (Fairey & Swami, 1988) also conducted research work on both the ventilated and
unventilated attic space. The result showed that about 37 % of ceiling heat flux was
reduced using insulation (R-19). Furthermore, some significant results have been
achieved by Beal and Chandra (Beal & Chandra, 1995) that the attic temperature can be
decreased to 32 % by using ventilation system with the features of ridge and soffit vent,
14
compared with unventilated attic. Rose also concluded that there are significant effects in
building design to apply vented features rather than unvented condition. Another research
had been done by Parker (Parker, 2005) who found that approximately 5% of cooling
load could be reduced by implementing an attic ventilation system.
2.3 Classification of Vent
In order to make a comfortable environment in a building, attic ventilation plays an
important role. The attic space could be ventilated either by a natural or mechanical way.
For decade, many researchers have been trying to find the best solution for adopting an
attic ventilation system. Due to climate conditions and different building designs there
are various types of vents used to minimize the building heat gain. Ventilation
components are classified into two basic types such as intake and exhaust vent. In each
of these types, there are various techniques such as fixed or static vent where external
power and moving parts are not required. Intake vents are fabricated in different designs.
It is necessary to select the appropriate vent for the specific system while considering the
structure of the building and the location where it will be installed. On the other hand,
effective and free escape of attic air is required to install the exhaust vent. First of all,
suitable ventilation system designs need the proper placement and aperture sizes for a
building to achieve equilibrium airflow. This equilibrium condition can be achieved by
stabilizing the capacity of air flow between the intake and exhaust vent. In addition, a free
area of intake venting is needed as equivalent or either bigger than the exhaust venting
area (Parker, 2005). Both the intake and exhaust vent should be placed where they create
a sufficient high-low balance. Effective ventilation area would be insufficient without
considering the balance. As a result, heat easily accumulates and spreads underneath the
roof surface. Thus, the efficiency of installed ventilation will be low and useless as well.
There are several vent systems briefly discussed below.
15
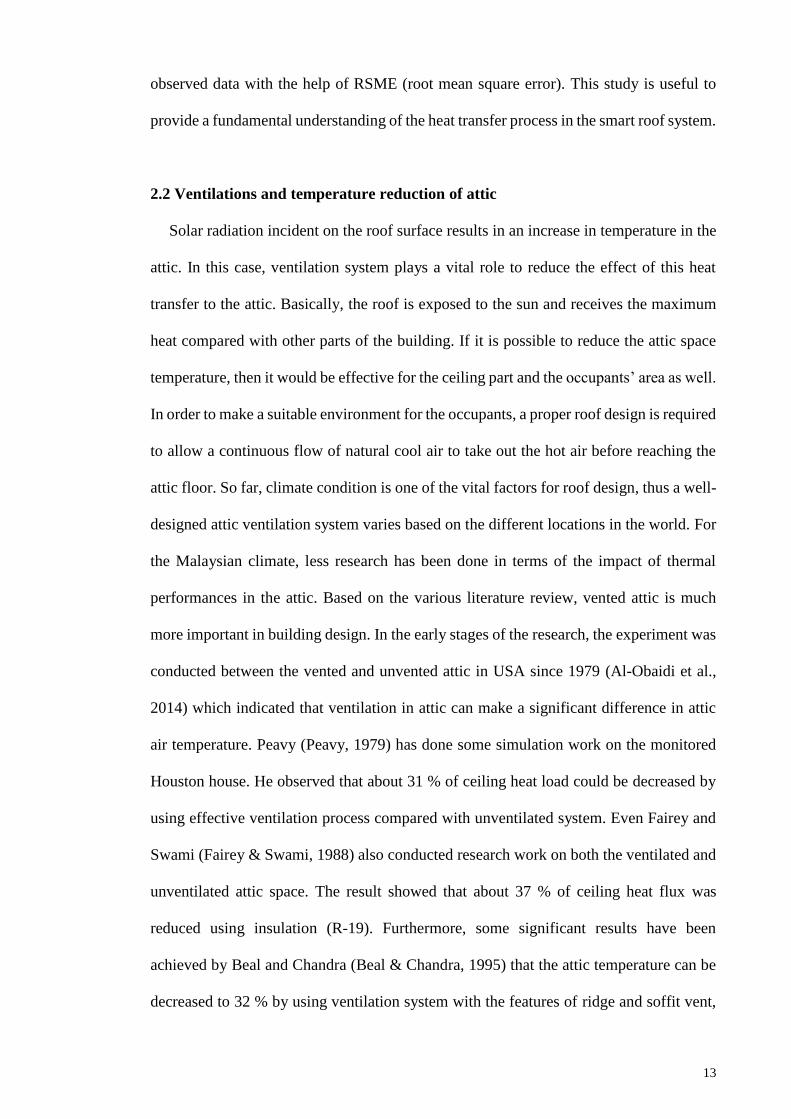
2.3.1 Soffit vent
Soffit vent is a vent which is normally located at the roof eaves. It is designed to cool
the attic area by allowing the flow of fresh air in order to remove the extra amount of heat
and moisture. It helps air to move radially through the roof area. It is illustrated in Figure
2.4 with specific indication of the vent component and wind direction.
Figure 2.4: Soffit Vent (SoffitVent, 2015).
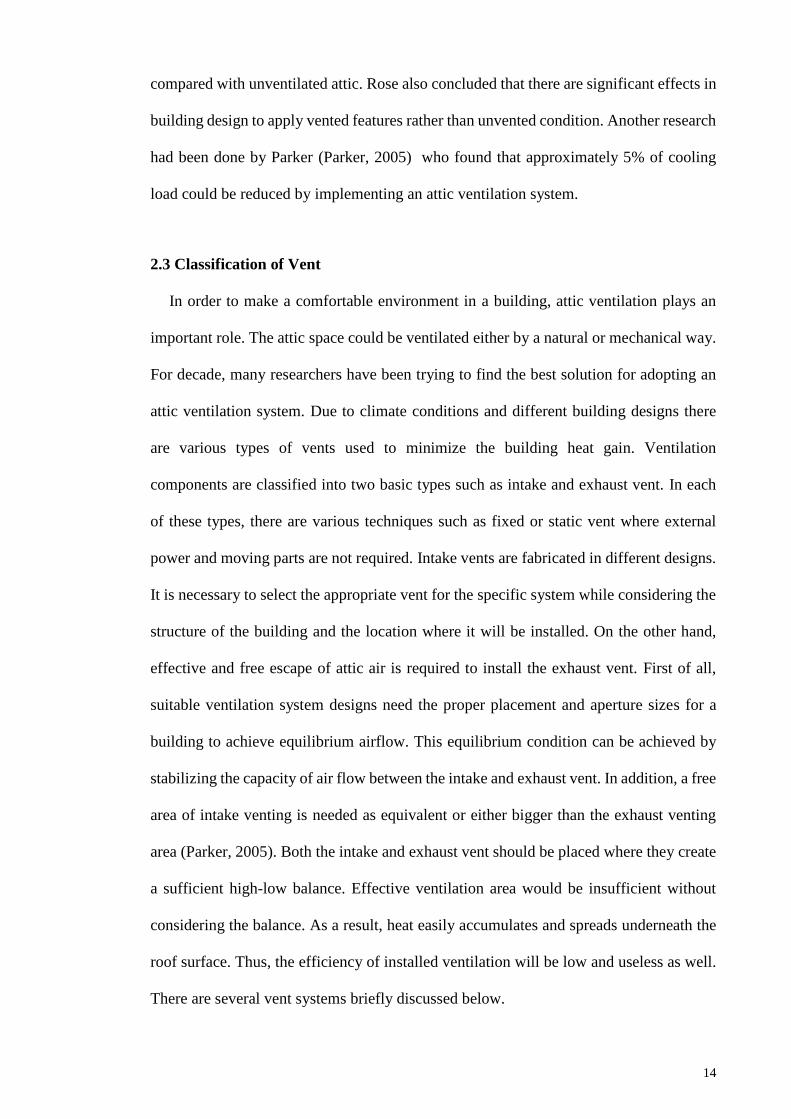
2.3.2 Ridge vent
As shown in Figure 2.5, ridge vent is used for the consistent air ventilation systems
which is installed to the overall length of the roof ridge. This type of vent system has
some advantages such as increasing the air movement into the space and enhancing the
ventilation all over the entire space. It is installed as an aperture of exhaust air for all
directions of wind.
16
Figure 2.5: Ridge vent (RidgeVent, 2015).
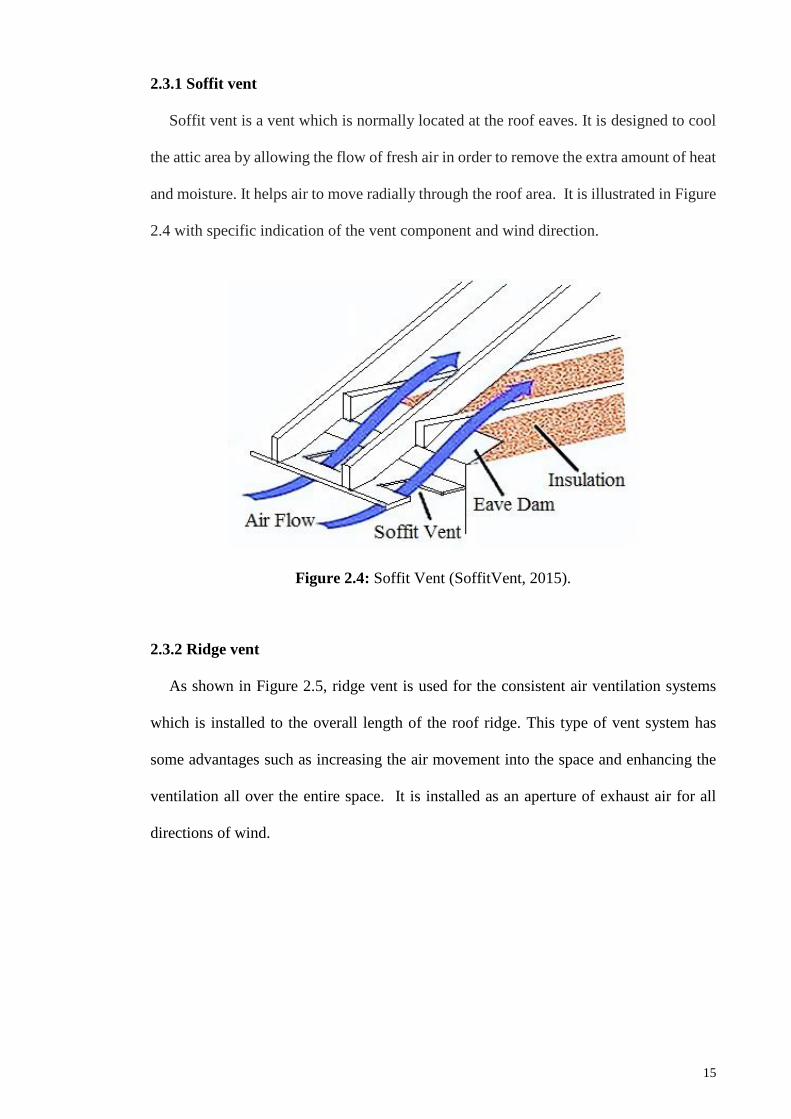
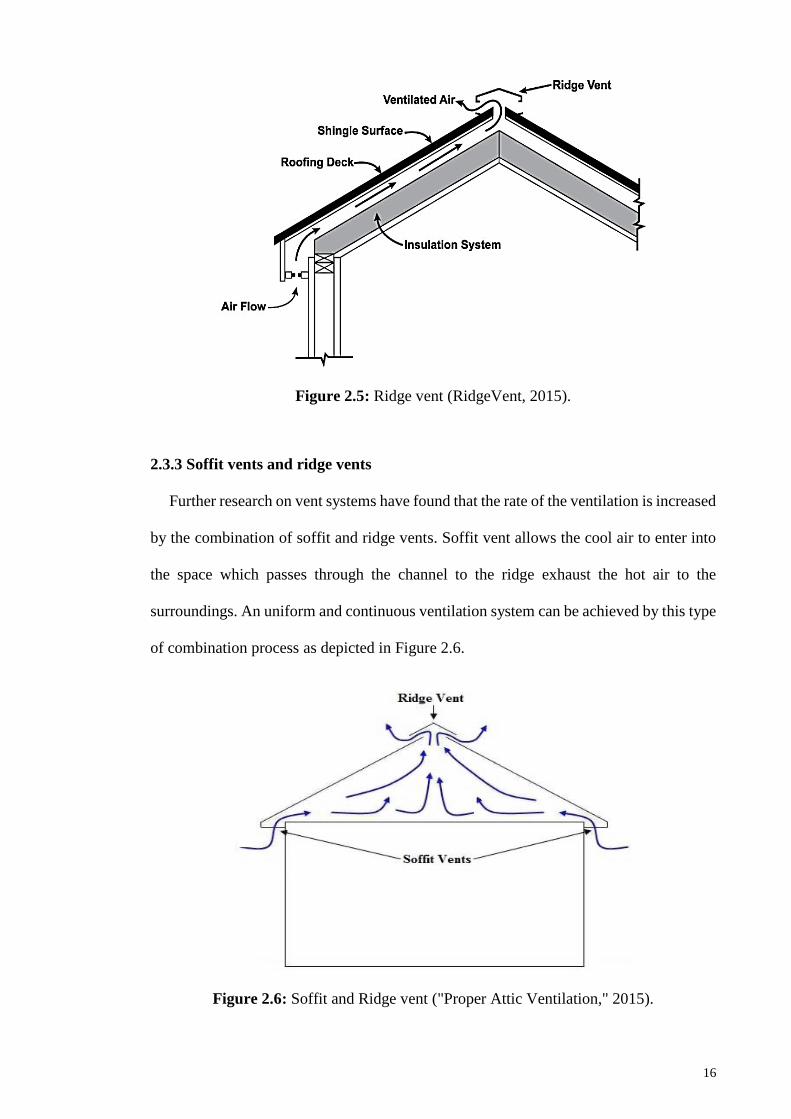
2.3.3 Soffit vents and ridge vents
Further research on vent systems have found that the rate of the ventilation is increased
by the combination of soffit and ridge vents. Soffit vent allows the cool air to enter into
the space which passes through the channel to the ridge exhaust the hot air to the
surroundings. An uniform and continuous ventilation system can be achieved by this type
of combination process as depicted in Figure 2.6.
Figure 2.6: Soffit and Ridge vent ("Proper Attic Ventilation," 2015).
17
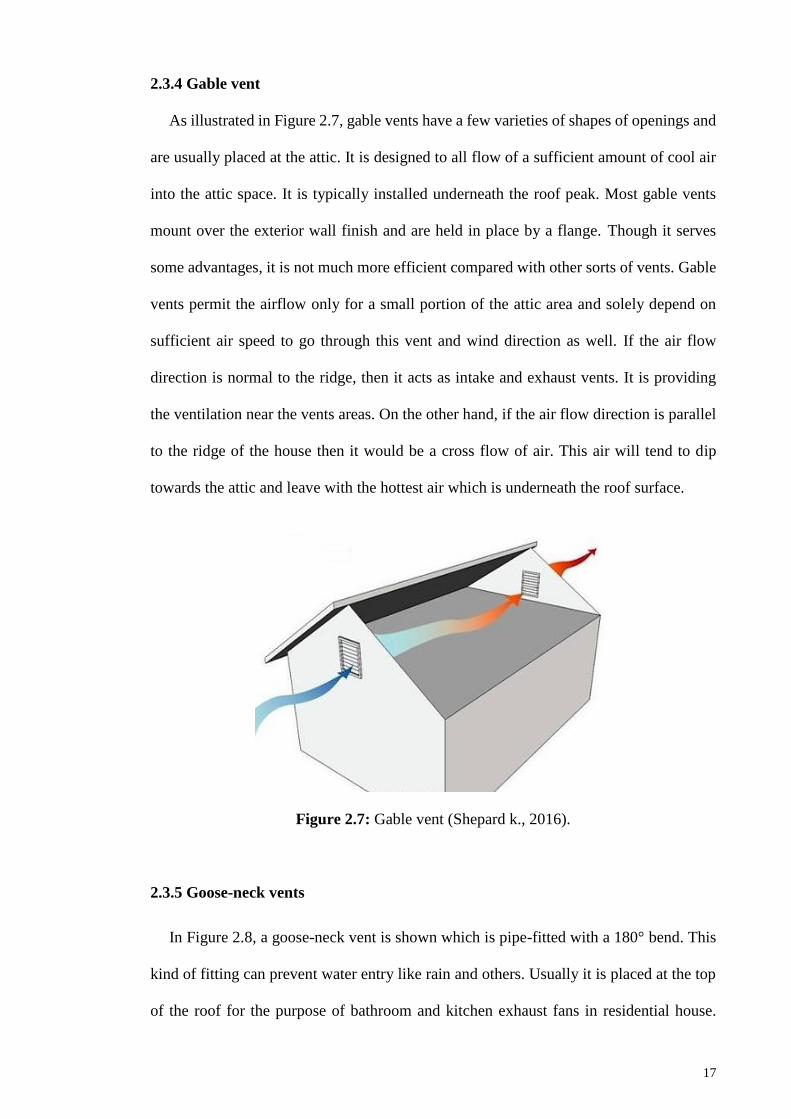
2.3.4 Gable vent
As illustrated in Figure 2.7, gable vents have a few varieties of shapes of openings and
are usually placed at the attic. It is designed to all flow of a sufficient amount of cool air
into the attic space. It is typically installed underneath the roof peak. Most gable vents
mount over the exterior wall finish and are held in place by a flange. Though it serves
some advantages, it is not much more efficient compared with other sorts of vents. Gable
vents permit the airflow only for a small portion of the attic area and solely depend on
sufficient air speed to go through this vent and wind direction as well. If the air flow
direction is normal to the ridge, then it acts as intake and exhaust vents. It is providing
the ventilation near the vents areas. On the other hand, if the air flow direction is parallel
to the ridge of the house then it would be a cross flow of air. This air will tend to dip
towards the attic and leave with the hottest air which is underneath the roof surface.
Figure 2.7: Gable vent (Shepard k., 2016).
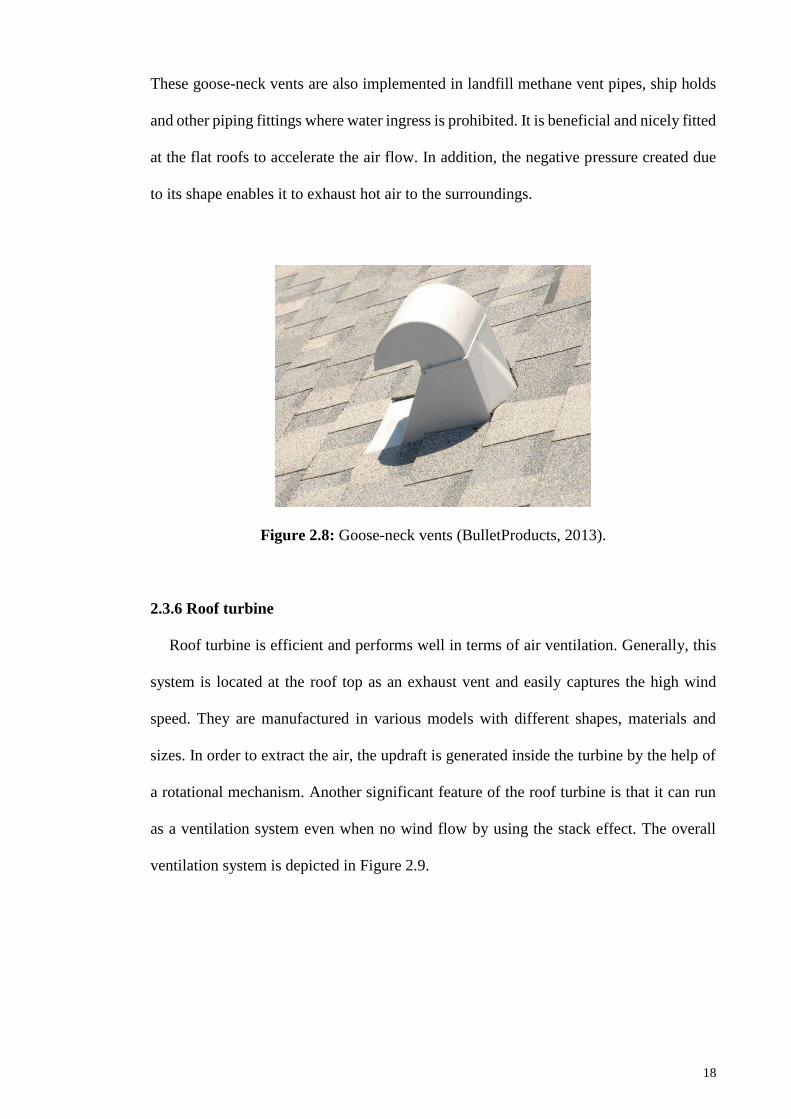
2.3.5 Goose-neck vents
In Figure 2.8, a goose-neck vent is shown which is pipe-fitted with a 180° bend. This
kind of fitting can prevent water entry like rain and others. Usually it is placed at the top
of the roof for the purpose of bathroom and kitchen exhaust fans in residential house.
18
These goose-neck vents are also implemented in landfill methane vent pipes, ship holds
and other piping fittings where water ingress is prohibited. It is beneficial and nicely fitted
at the flat roofs to accelerate the air flow. In addition, the negative pressure created due
to its shape enables it to exhaust hot air to the surroundings.
Figure 2.8: Goose-neck vents (BulletProducts, 2013).
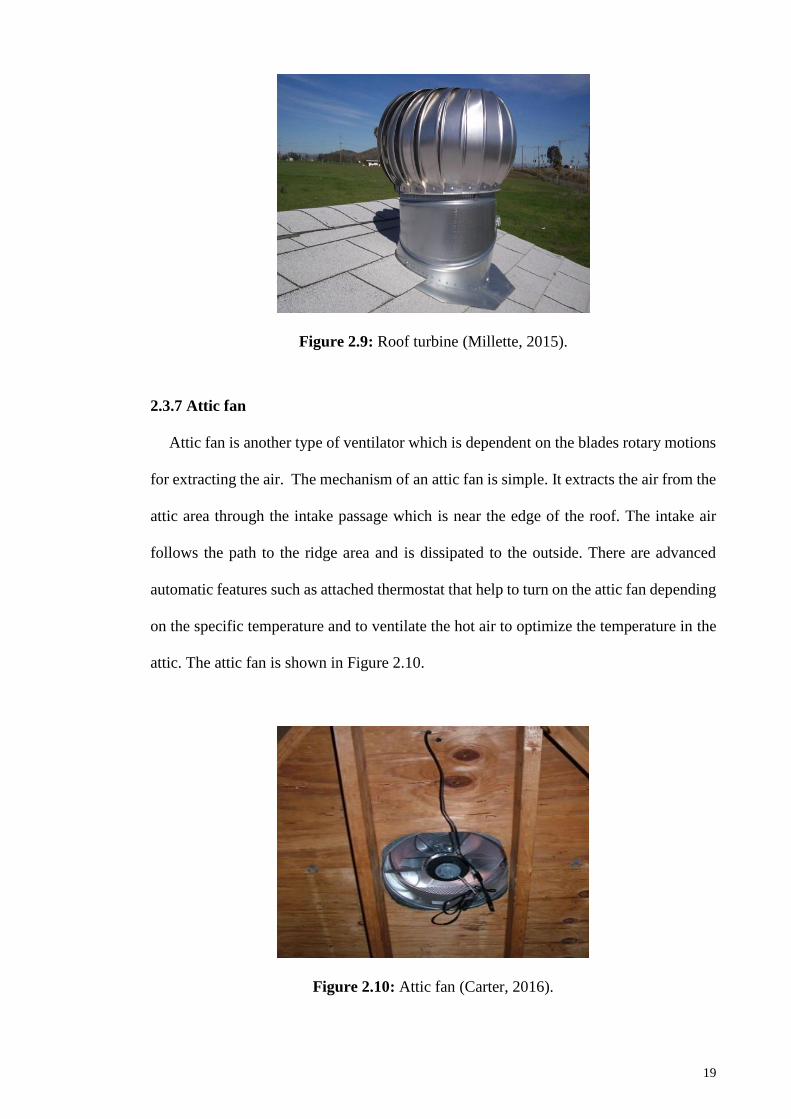
2.3.6 Roof turbine
Roof turbine is efficient and performs well in terms of air ventilation. Generally, this
system is located at the roof top as an exhaust vent and easily captures the high wind
speed. They are manufactured in various models with different shapes, materials and
sizes. In order to extract the air, the updraft is generated inside the turbine by the help of
a rotational mechanism. Another significant feature of the roof turbine is that it can run
as a ventilation system even when no wind flow by using the stack effect. The overall
ventilation system is depicted in Figure 2.9.
19
Figure 2.9: Roof turbine (Millette, 2015).
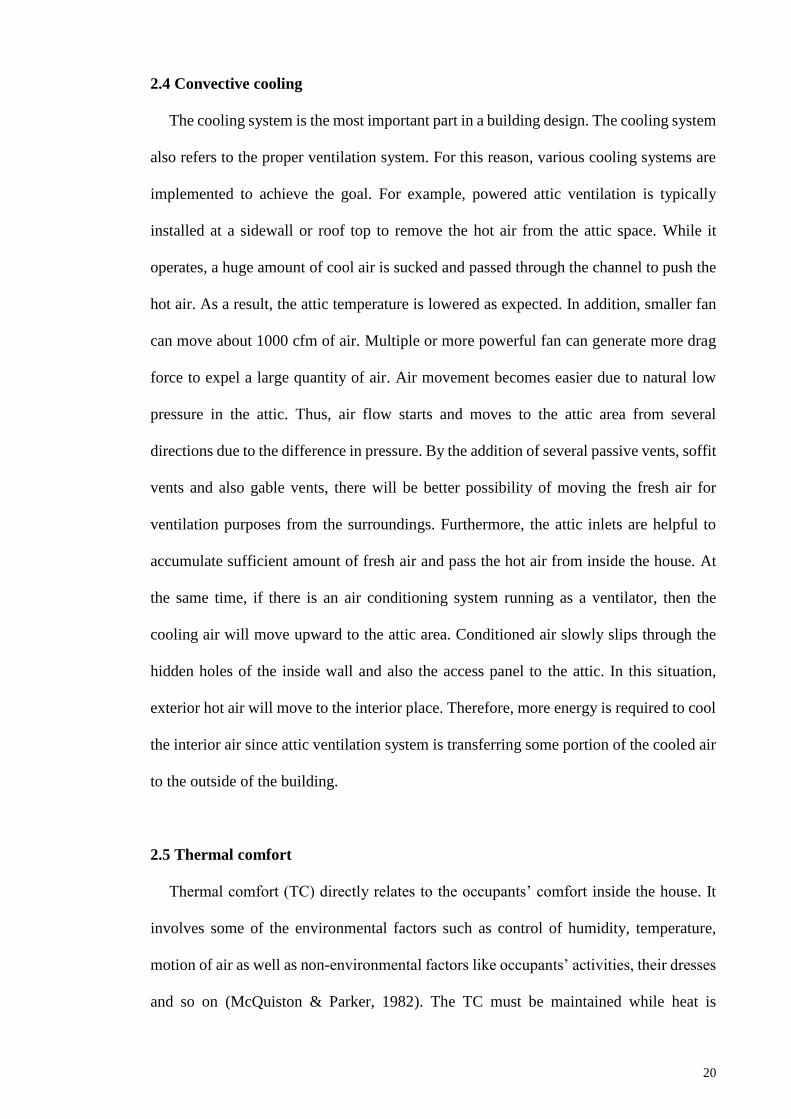
2.3.7 Attic fan
Attic fan is another type of ventilator which is dependent on the blades rotary motions
for extracting the air. The mechanism of an attic fan is simple. It extracts the air from the
attic area through the intake passage which is near the edge of the roof. The intake air
follows the path to the ridge area and is dissipated to the outside. There are advanced
automatic features such as attached thermostat that help to turn on the attic fan depending
on the specific temperature and to ventilate the hot air to optimize the temperature in the
attic. The attic fan is shown in Figure 2.10.
Figure 2.10: Attic fan (Carter, 2016).
20
2.4 Convective cooling
The cooling system is the most important part in a building design. The cooling system
also refers to the proper ventilation system. For this reason, various cooling systems are
implemented to achieve the goal. For example, powered attic ventilation is typically
installed at a sidewall or roof top to remove the hot air from the attic space. While it
operates, a huge amount of cool air is sucked and passed through the channel to push the
hot air. As a result, the attic temperature is lowered as expected. In addition, smaller fan
can move about 1000 cfm of air. Multiple or more powerful fan can generate more drag
force to expel a large quantity of air. Air movement becomes easier due to natural low
pressure in the attic. Thus, air flow starts and moves to the attic area from several
directions due to the difference in pressure. By the addition of several passive vents, soffit
vents and also gable vents, there will be better possibility of moving the fresh air for
ventilation purposes from the surroundings. Furthermore, the attic inlets are helpful to
accumulate sufficient amount of fresh air and pass the hot air from inside the house. At
the same time, if there is an air conditioning system running as a ventilator, then the
cooling air will move upward to the attic area. Conditioned air slowly slips through the
hidden holes of the inside wall and also the access panel to the attic. In this situation,
exterior hot air will move to the interior place. Therefore, more energy is required to cool
the interior air since attic ventilation system is transferring some portion of the cooled air
to the outside of the building.
2.5 Thermal comfort
Thermal comfort (TC) directly relates to the occupants’ comfort inside the house. It
involves some of the environmental factors such as control of humidity, temperature,
motion of air as well as non-environmental factors like occupants’ activities, their dresses
and so on (McQuiston & Parker, 1982). The TC must be maintained while heat is
21
produced by the human body, various electrical components which radiate the heat into
the interior area, causing thermal discomfort for the residents. There is an ideal standard
of thermal comfort which is defined by the operative temperature. Based on ASHRAE
Standard 55 (Standard, 2004), “Thermal Environmental Conditions for Human
Occupancy” indicates thermal conditions that if the occupants’ dress appropriately, then
the thermal condition would be acceptable up to 80 % or more building occupants’. The
acceptable humidity and operating temperatures during summer (light clothing, 0.5 clo)
are 30 % RH with 24-28 °C and 60 % RH with 23-25.5 °C and air speed is less than 0.25
m/s according to ASHRAE Standard 55 (Standard, 2004) . Moreover, it is noted that
below 50 % RH of humidity can enhance the spread of influenza virus thus causing tissue
weakness (Sookchaiya et al., 2010). Below that margin of humidity, mucous membrane
dries out which causes discomfort and also skin rashes as well. Usually humans feel
thermal comfort if the humidity is about 50 % RH. In addition, higher humidity causes
stuffiness to the occupants’. Not only that but it also increases the wetness of the human
body which causes thermal discomfort in the house. There is also rapid growth of bacteria
and fungi because of higher humidity in a sealed building.
2.6 Indoor air quality
Indoor air quality (IAQ) is one of the vital issues for building occupants in order to
live in a healthy indoor environment (Health, 2010). Thus the natural or forced ventilation
is important. The major purpose of ventilation systems is to remove the indoor hot air,
pollutants and make a good indoor air quality (IAQ) (Awbi, 2003; Dimitroulopoulou,
2012). Researchers are concerned about the indoor air quality which is such an important
and vital issue in our everyday life in residential buildings. Research has been going on
by the European Union Joint Research Centre (JCR) and they found out that pollutants in
indoor air are much dangerous than the pollutants in outdoor air. Thus, it draws
22
everyone’s attention to make a sufficient ventilation system in a house. In addition, most
people spend nearly 90 % of their time indoors (Höppe, 2002). So, air ventilation is
needed to circulate the fresh air and dilute the air pollutants in the house. The rate of
ventilation influences the given rate of emission and the pollutants steady concentration.
If the ventilation rate is increased, concentration of steady pollutants will be reduced
significantly. These all include the energy penalty. The most important thing is to identify
the dominant pollutant to minimize their steady state concentration. But the most effective
way to keep standard quality of air is by removing the source of the pollutants than the
dilution of pollutant concentrations. So, it is recommended to avoid and eliminate the
indoor sources by using low emitting materials (Organization, 1989).
However, CO2 (Carbon dioxide) is one of the perfect indicator in order to figure out
the IAQ level inside a building. It is a form of pollution made by people and inadequate
ventilation system. Therefore, ASHRAE standard for the CO2 level is less than 1000 ppm
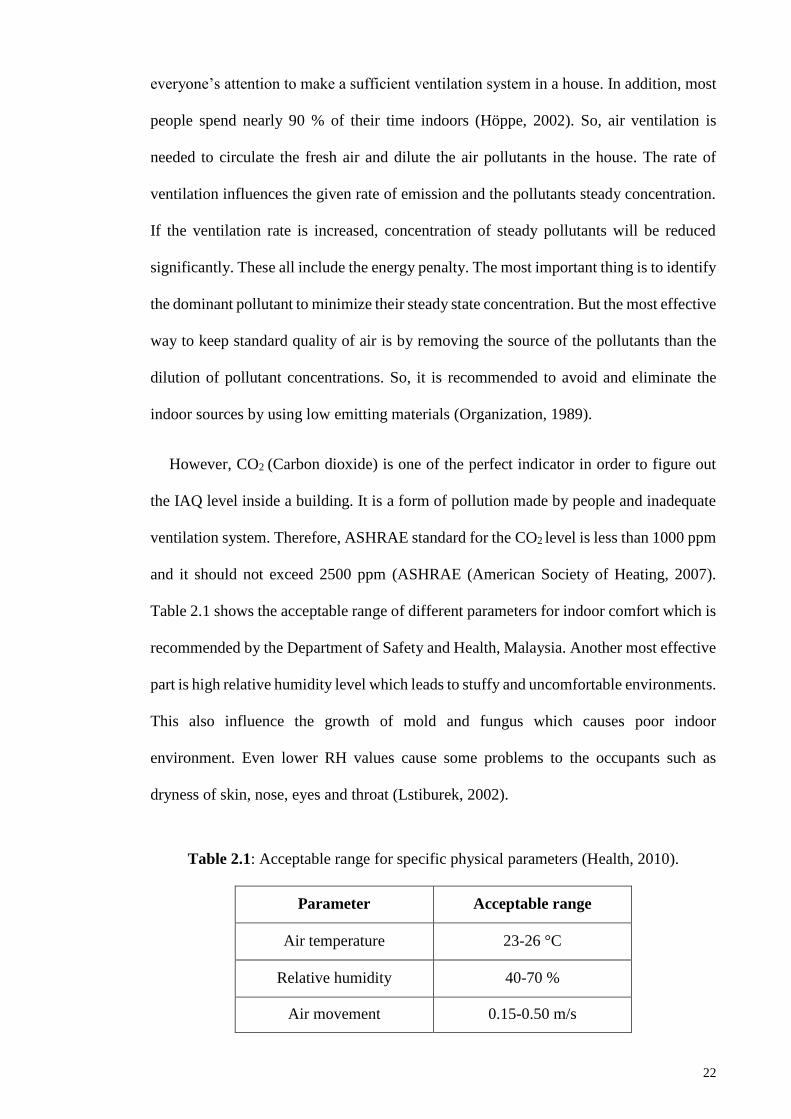
and it should not exceed 2500 ppm (ASHRAE (American Society of Heating, 2007).
Table 2.1 shows the acceptable range of different parameters for indoor comfort which is
recommended by the Department of Safety and Health, Malaysia. Another most effective
part is high relative humidity level which leads to stuffy and uncomfortable environments.
This also influence the growth of mold and fungus which causes poor indoor
environment. Even lower RH values cause some problems to the occupants such as
dryness of skin, nose, eyes and throat (Lstiburek, 2002).
Table 2.1: Acceptable range for specific physical parameters (Health, 2010).
Parameter Acceptable range
Air temperature 23-26 °C
Relative humidity 40-70 %
Air movement 0.15-0.50 m/s
23
A survey was performed among 473 occupants of 242 dwellings, having different
ventilation facilities, in the Helsinki Metropolitan area (Ruotsalainen et al., 1991). This
was conducted and monitored for 2-week periods to evaluate the occupants’ perception
and regarding indoor air quality. The main findings after the survey are summarized
below:
1. Stuffiness is the most common perception.
2. About 22 % of the occupants voted that bedroom ventilation rate was insufficient.
3. About 46 % of the occupants realized that air inside the bedroom was stuffy, usually
in the morning time.
4. Almost 40 % of the people felt that the air was too dry in the bedroom during the
winter season.
Almost every day during the 2-week survey periods,
a) It was reported that half of the occupants suffered from sneezing and nasal
congestion respectively by 51 % and 50 % during the survey periods.
b) Occupants experienced nasal dryness, nasal discharge, lethargy, weakness or
nausea dryness/ itching of skin and headache about 33 %, 34 %, 35 %, 36 % and 31
% respectively.
c) Nearly 25 % of the people suffered from cough, itchy eyes (19 %) and even
breathlessness (about 6 %).
Their research work indicated that the occupants of the house reported less perception
and symptoms of poor indoor air quality than the occupants in the apartments. Eight out
of ten most common complaints were reported by the people living in the naturally
ventilated houses than the balanced ventilated houses. Another research work was done
by Engvall et al. (Engvall et al., 2005) in multi-family houses to evaluate the influence of
sick building syndromes and quality of indoor environment. Their measurement indicated
24
that the relative humidity of air was increased by 1 - 3 % and 1- 5 % respectively in the
living room and bathroom if the ventilation rates are slightly increased. In addition, room
temperature also increased by about 0.1 – 0.3 C during the summer. However, the
outdoor air flow rate gets reduced and then the indoor air quality becomes poorer in the
bedroom and living spaces in the apartment. This causes the high increase of stuffy odor,
even in the bedroom as well.
Most importantly, clean and fresh air is so important for both indoor and outdoor
environments. So far, outdoor natural air moves indoors to cool the building and the air
should be clean and cool. The air quality tends to be high enough for the building
occupants. It is highly recommended to circulate clean air around the living places of the
house, but it is too difficult to clean the air which enters into the house. If it is not clean
enough, then most of the outdoor pollutants, germs, bugs, dust, airborne seeds and even
pollen may enter into the buildings. There are various air filtration systems available in
the market to get the best solution in this matter. Air filtration system can be used to get
some clean, less polluted and quality air for the people in the house. This can lead to a
healthy and hygienic environment indoor.
2.7 Buildings and energy consumption
Sustainable development is needed which is rapidly as well as dramatically rising up
throughout the world. It is happening mostly in hot and humid countries to meet the
challenges in energy consumptions. This sustainable development is defined as the
development which can meet the present needs without compromising the future
generation’s ability to meet their own needs (Yacouby et al., 2011). Moreover, energy
consumption in buildings is the major concern for sustainable development. The energy
demand is rising up, especially for residential building. The energy demand has increased
from 2,914 Mtoe to 5,257 Mtoe from 2005 to 2050 (Yacouby et al., 2011). Statistics show
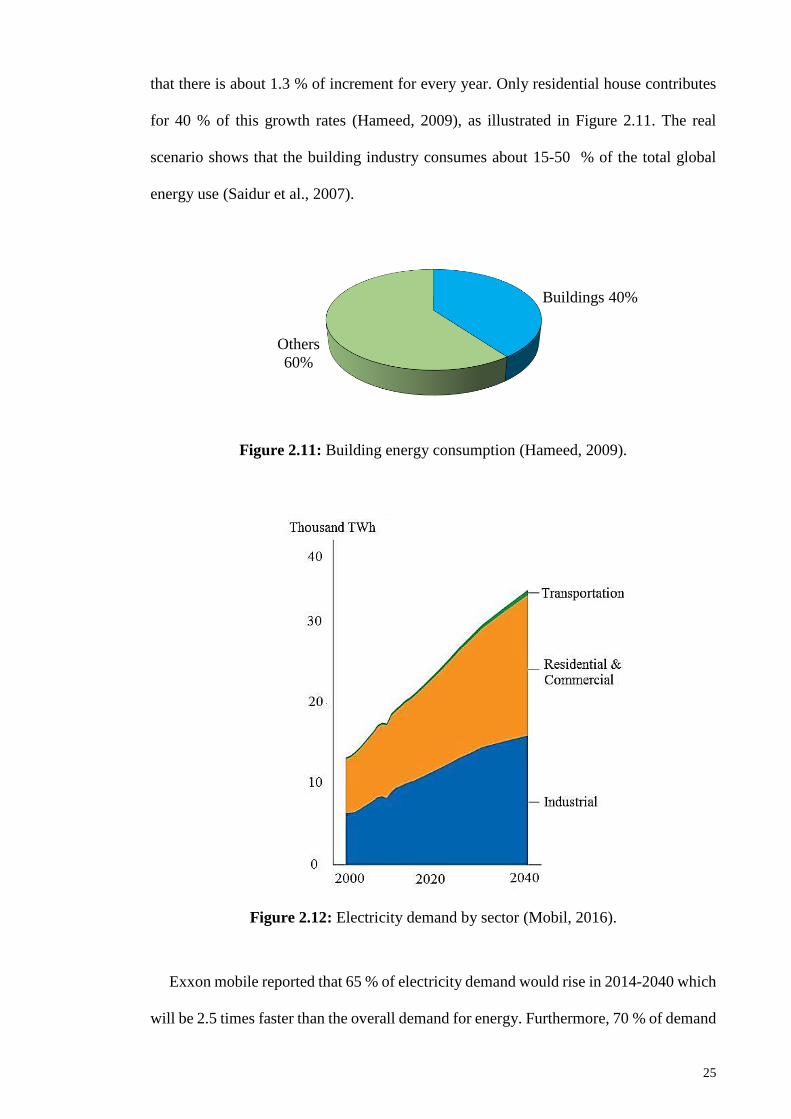
25
that there is about 1.3 % of increment for every year. Only residential house contributes
for 40 % of this growth rates (Hameed, 2009), as illustrated in Figure 2.11. The real
scenario shows that the building industry consumes about 15-50 % of the total global
energy use (Saidur et al., 2007).
Figure 2.11: Building energy consumption (Hameed, 2009).
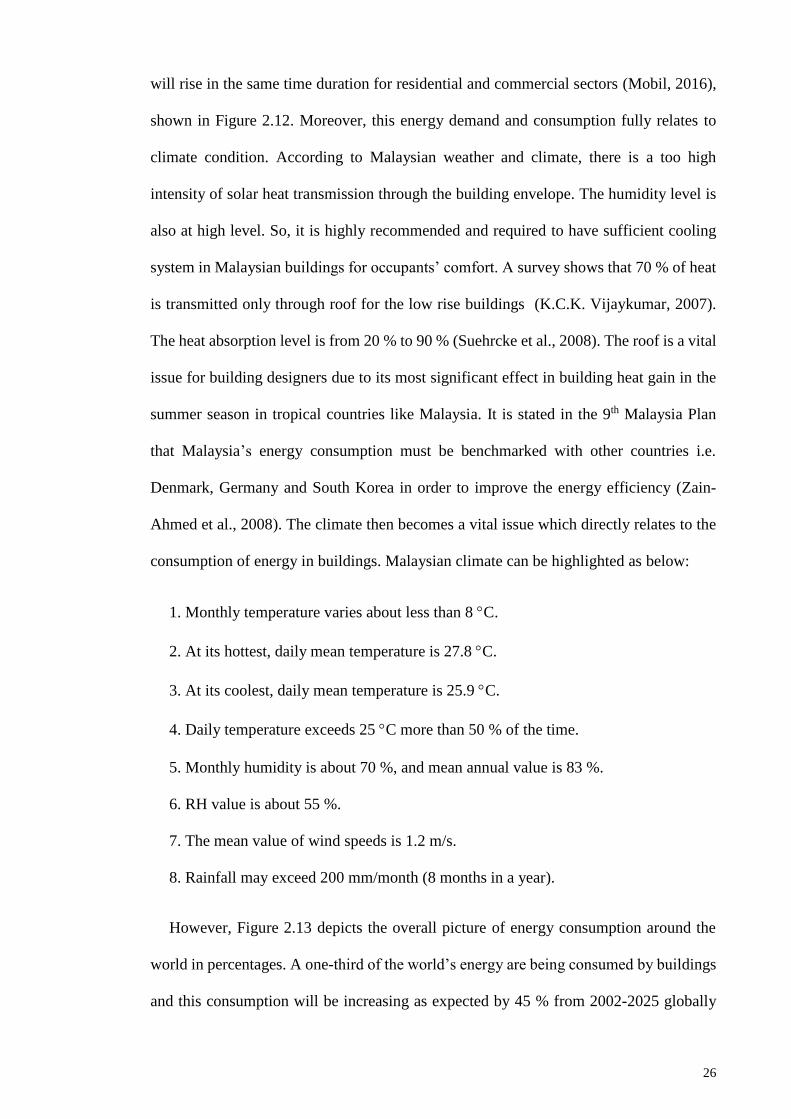
Figure 2.12: Electricity demand by sector (Mobil, 2016).
Exxon mobile reported that 65 % of electricity demand would rise in 2014-2040 which
will be 2.5 times faster than the overall demand for energy. Furthermore, 70 % of demand
Buildings 40%
Others
60%
26
will rise in the same time duration for residential and commercial sectors (Mobil, 2016),
shown in Figure 2.12. Moreover, this energy demand and consumption fully relates to
climate condition. According to Malaysian weather and climate, there is a too high
intensity of solar heat transmission through the building envelope. The humidity level is
also at high level. So, it is highly recommended and required to have sufficient cooling
system in Malaysian buildings for occupants’ comfort. A survey shows that 70 % of heat
is transmitted only through roof for the low rise buildings (K.C.K. Vijaykumar, 2007).
The heat absorption level is from 20 % to 90 % (Suehrcke et al., 2008). The roof is a vital
issue for building designers due to its most significant effect in building heat gain in the
summer season in tropical countries like Malaysia. It is stated in the 9th Malaysia Plan
that Malaysia’s energy consumption must be benchmarked with other countries i.e.
Denmark, Germany and South Korea in order to improve the energy efficiency (Zain-
Ahmed et al., 2008). The climate then becomes a vital issue which directly relates to the
consumption of energy in buildings. Malaysian climate can be highlighted as below:
1. Monthly temperature varies about less than 8 C.
2. At its hottest, daily mean temperature is 27.8 C.
3. At its coolest, daily mean temperature is 25.9 C.
4. Daily temperature exceeds 25 C more than 50 % of the time.
5. Monthly humidity is about 70 %, and mean annual value is 83 %.
6. RH value is about 55 %.
7. The mean value of wind speeds is 1.2 m/s.
8. Rainfall may exceed 200 mm/month (8 months in a year).
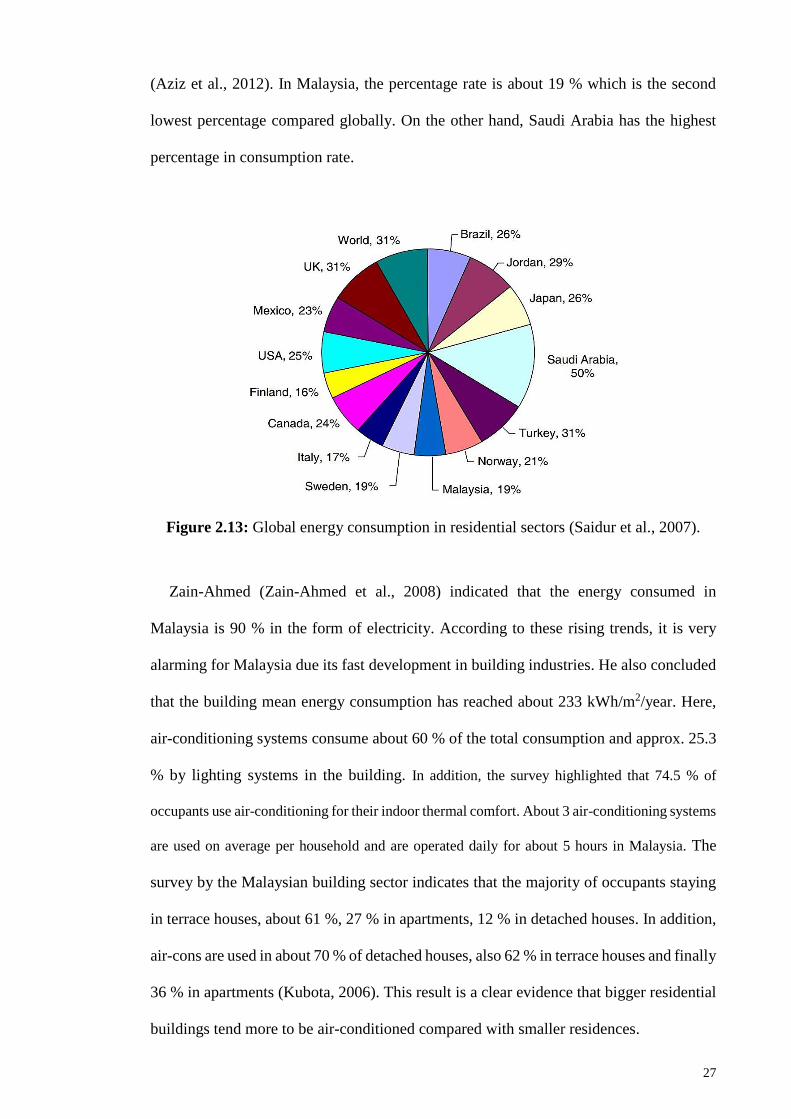
However, Figure 2.13 depicts the overall picture of energy consumption around the
world in percentages. A one-third of the world’s energy are being consumed by buildings
and this consumption will be increasing as expected by 45 % from 2002-2025 globally
27
(Aziz et al., 2012). In Malaysia, the percentage rate is about 19 % which is the second
lowest percentage compared globally. On the other hand, Saudi Arabia has the highest
percentage in consumption rate.
Figure 2.13: Global energy consumption in residential sectors (Saidur et al., 2007).
Zain-Ahmed (Zain-Ahmed et al., 2008) indicated that the energy consumed in
Malaysia is 90 % in the form of electricity. According to these rising trends, it is very
alarming for Malaysia due its fast development in building industries. He also concluded
that the building mean energy consumption has reached about 233 kWh/m2/year. Here,
air-conditioning systems consume about 60 % of the total consumption and approx. 25.3
% by lighting systems in the building. In addition, the survey highlighted that 74.5 % of
occupants use air-conditioning for their indoor thermal comfort. About 3 air-conditioning systems
are used on average per household and are operated daily for about 5 hours in Malaysia. The
survey by the Malaysian building sector indicates that the majority of occupants staying
in terrace houses, about 61 %, 27 % in apartments, 12 % in detached houses. In addition,
air-cons are used in about 70 % of detached houses, also 62 % in terrace houses and finally
36 % in apartments (Kubota, 2006). This result is a clear evidence that bigger residential
buildings tend more to be air-conditioned compared with smaller residences.
28
2.8 Summary of roof thermal performance
In the hot climate, strong sunlight incident on the roof. Solar heat passes through the
roof and reaches to the attic and room. It leads to the maximum amount of heat gain by
the building roof. 20 to 90 % of solar radiation is absorbed by the roof surface. Most
low-rise small buildings are facing this kind of problems. As a result, occupants feel
discomfort inside the house. Several types of researches have been going on for the
required comfort inside the building. Here, roof plays the most vital role in heat gain.
Most commonly it absorbs heat. It’s a common practice to use the light color to reflect
most of the sun's radiation and less gain of heat. There is another term which is called
cool roof. This type of roof has high albedo about 0.8, which can reflect a significant
amount of heat than the conventional roof. Therefore, the indoor temperature gets reduced
remarkably. There is another innovative idea for the cool roof system where thermal
insulation coating is used on the roof surface. This coating is made of titanium dioxide
pigment with chicken eggshell. This application can contribute to decrease the heat and
attic temperature as well. The reflective foil which also known as the radiant barrier has
a good use in building insulations. It can decrease the heat gain about 60 %. Therefore,
less heat passes through the attic and inside the room. Taylor (Taylor et al., 2000) gave
interest on the insulations. He found that 81% of people prefer insulation to get indoor
thermal comfort and only 21 % of people satisfy indoor comfort without insulation. It
means three times more people prefer insulation to utilize. Ozel and Pihtili (Ozel & Pihtili,
2007) also did some test on the insulation effects. They preferred three pieces of insulation
materials with a thickness of 6 cm, which placed outside, middle and at the indoor surface
of the roof. In addition, the gap between insulations is 10 cm. Ong (Ong, 2011) also
investigate on the insulation in six different roof design and his results show that there is
about 13 ˚C attic temperature difference between insulated and uninsulated roof. Double
skin roof with air layer is another innovative idea by Lia (Lai et al., 2008). He concluded
29
that the double skin roof can reduce the heat gain and radiant barrier is so useful to install
on the top of the bottom plate structure, which can block 20 % of roof heat. The natural
ventilation system allows cool air to take out the indoor heat to the outside. It gives
additional advantages for reducing the building heat gain. In this case, roof angle leads
important role. The research result indicated that about 30˚ of roof angle can induce
significant amounts of natural flow of air. Roof solar collector (RSC) is another key
feature for the building. Khedari and Hirunlabh (Hirunlabh et al., 2001; Khedari et al.,
1996) conducted several experiments on RSC with different roof angles (20˚- 60˚) in term
of natural ventilation. They found that suitable length for RSC is 100 cm and 30˚ of roof
angle can harness the more natural flow of air about 0.08–0.15 m3/s.
30
CHAPTER 3: MATERIALS AND METHODOLOGY
3.1 Introduction
Usually most buildings are designed in such a way that the roofs are placed at the upper
place of the building. The roof plays an important role for the building envelope as well
as for the building heat gain. All day long, roof surfaces are fully exposed to direct
sunlight. These roofs can be classified into two major categories, i.e. cool roof and warm
roof. Cool roof is likely to reflect the strong sunlight and also cool itself by efficiently
emitting radiation to its surroundings. On the other hand, a warm roof consists of an
insulation layer which is placed under the roof cover, completely eliminating the need for
ventilation and keeps warm to the interior of the buildings.
3.2 Experimental setup
The experiments were carried out indoors. The temperature of the environment was
27.5 ˚C. Zinc galvanized metal plate was used as roof material. The perspex box utilized
as an attic was placed under the metal roof. Figure 3.1(a) illustrates the dimensions of the
Perspex box which was 350 mm (length) × 350 mm (width) × 552 mm (height). The roof
inclination was 30° to the horizontal. There were two sliding doors (100 mm × 100 mm)
on both sides of the box. RTD air probe sensor was located 160 mm under the roof to
measure the attic temperature. Figure 3.1(b) shows an experimental roof model consisting
of metal roof, tubes, all the sensors (i.e. RTD air probe, thermocouples), thermometer and
RTD thermometer (±(0.1% + 0.2 ˚C)). The gaps between the perspex box and metal roof
were sealed at the edges by using cloth tapes.
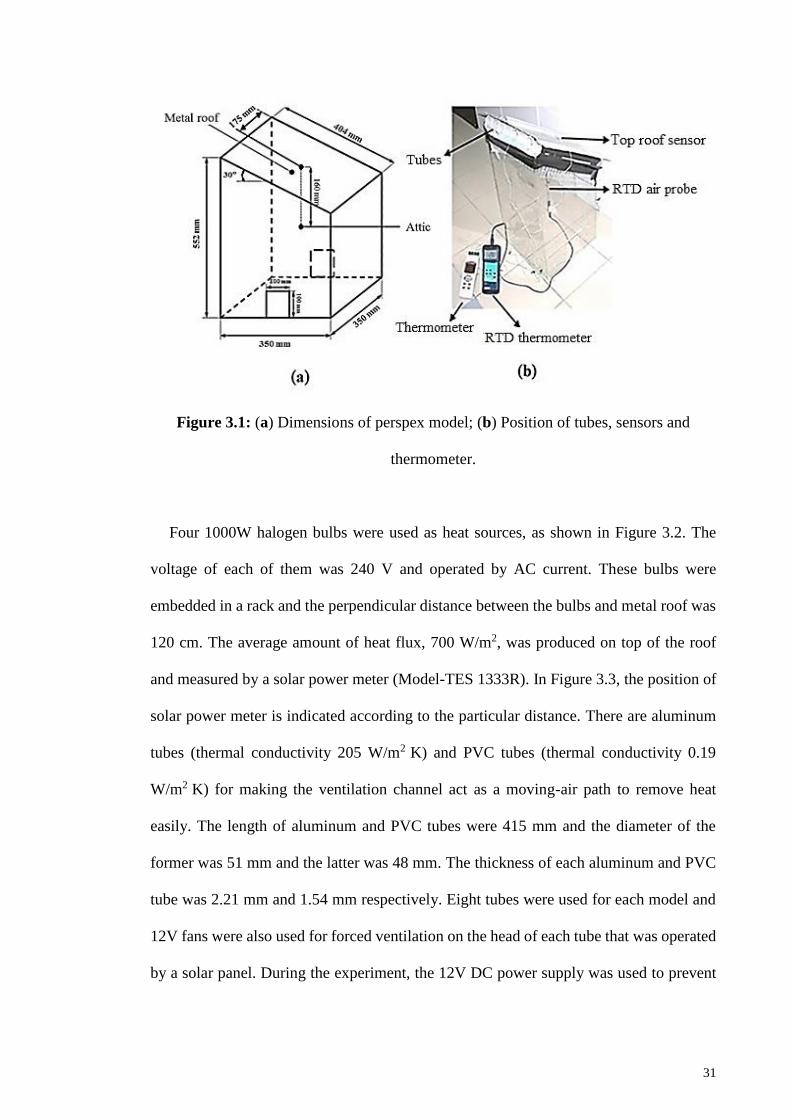
31
Figure 3.1: (a) Dimensions of perspex model; (b) Position of tubes, sensors and
thermometer.
Four 1000W halogen bulbs were used as heat sources, as shown in Figure 3.2. The
voltage of each of them was 240 V and operated by AC current. These bulbs were
embedded in a rack and the perpendicular distance between the bulbs and metal roof was
120 cm. The average amount of heat flux, 700 W/m2, was produced on top of the roof
and measured by a solar power meter (Model-TES 1333R). In Figure 3.3, the position of
solar power meter is indicated according to the particular distance. There are aluminum
tubes (thermal conductivity 205 W/m2 K) and PVC tubes (thermal conductivity 0.19
W/m2 K) for making the ventilation channel act as a moving-air path to remove heat
easily. The length of aluminum and PVC tubes were 415 mm and the diameter of the
former was 51 mm and the latter was 48 mm. The thickness of each aluminum and PVC
tube was 2.21 mm and 1.54 mm respectively. Eight tubes were used for each model and
12V fans were also used for forced ventilation on the head of each tube that was operated
by a solar panel. During the experiment, the 12V DC power supply was used to prevent
32
current fluctuation. There is an aluminum foil bubble insulation layer which acts as a heat
barrier placed under the metal roof.
Figure 3.2: Overall view of indoor experimental setup.
Figure 3.3: Schematic view of solar power meter position on roof surface.
Halogen bulb
Ventilation fan
RTD air probe
RTD thermometer
Supporting structure
DC power supply
Thermometer
Tubes
Metal roof
Rack
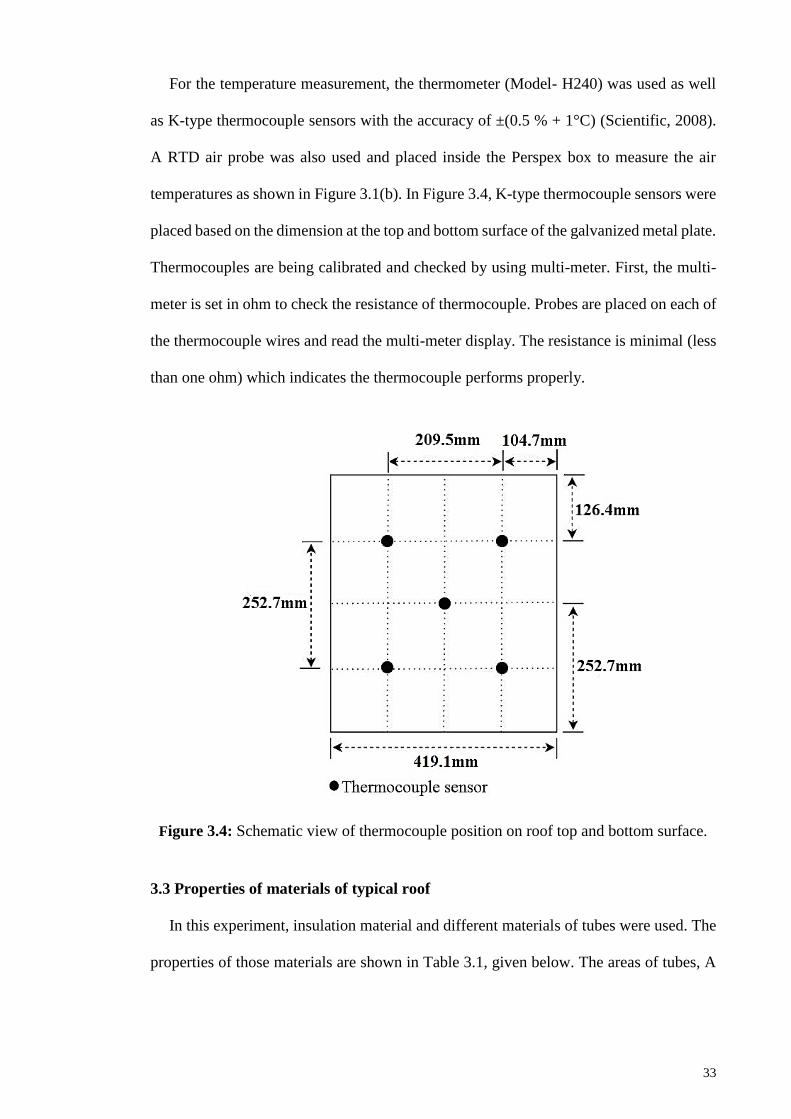
33
For the temperature measurement, the thermometer (Model- H240) was used as well
as K-type thermocouple sensors with the accuracy of ±(0.5 % + 1°C) (Scientific, 2008).
A RTD air probe was also used and placed inside the Perspex box to measure the air
temperatures as shown in Figure 3.1(b). In Figure 3.4, K-type thermocouple sensors were
placed based on the dimension at the top and bottom surface of the galvanized metal plate.
Thermocouples are being calibrated and checked by using multi-meter. First, the multi-
meter is set in ohm to check the resistance of thermocouple. Probes are placed on each of
the thermocouple wires and read the multi-meter display. The resistance is minimal (less
than one ohm) which indicates the thermocouple performs properly.
Figure 3.4: Schematic view of thermocouple position on roof top and bottom surface.
3.3 Properties of materials of typical roof
In this experiment, insulation material and different materials of tubes were used. The
properties of those materials are shown in Table 3.1, given below. The areas of tubes, A
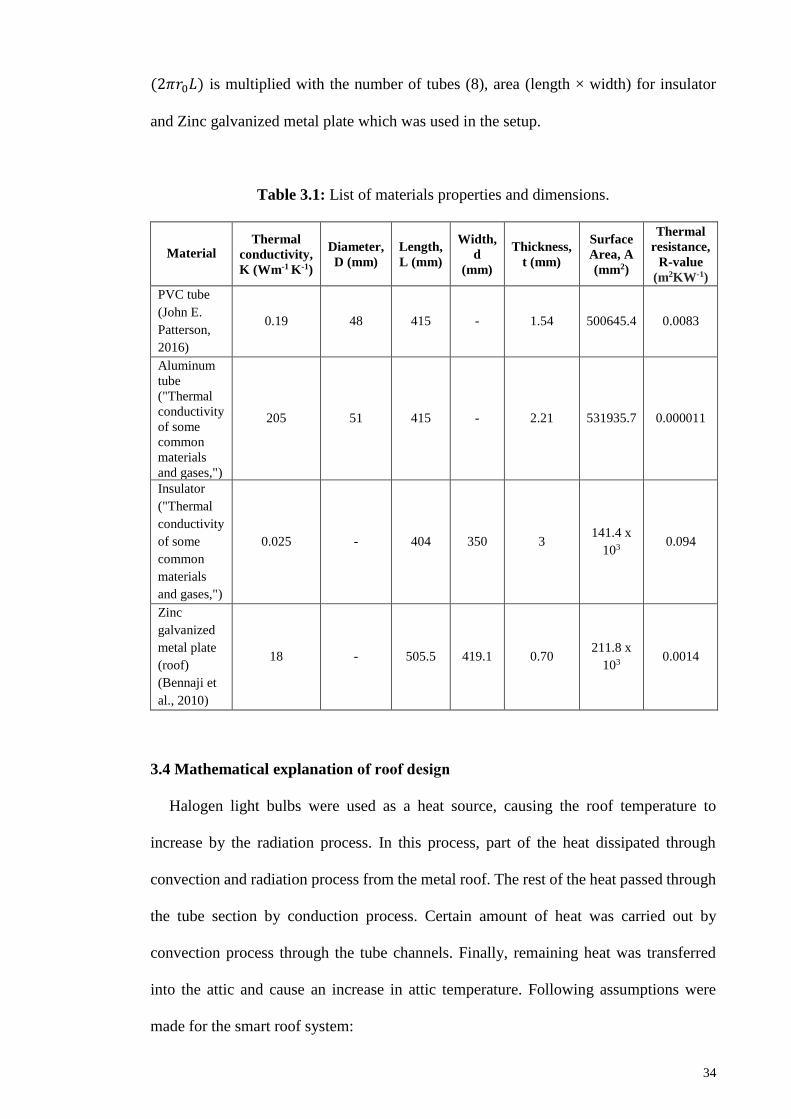
34
(2𝜋𝑟0𝐿) is multiplied with the number of tubes (8), area (length × width) for insulator
and Zinc galvanized metal plate which was used in the setup.
Table 3.1: List of materials properties and dimensions.
Material Thermal
conductivity,
K (Wm-1 K-1)
Diameter,
D (mm)
Length,
L (mm)
Width,
d
(mm)
Thickness,
t (mm)
Surface
Area, A
(mm2)
Thermal
resistance,
R-value
(m2KW-1)
PVC tube
(John E.
Patterson,
2016)
0.19 48 415 - 1.54 500645.4 0.0083
Aluminum
tube
("Thermal
conductivity
of some
common
materials
and gases,")
205 51 415 - 2.21 531935.7 0.000011
Insulator
("Thermal
conductivity
of some
common
materials
and gases,")
0.025 - 404 350 3 141.4 x
103 0.094
Zinc
galvanized
metal plate
(roof)
(Bennaji et
al., 2010)
18 - 505.5 419.1 0.70 211.8 x
103 0.0014
3.4 Mathematical explanation of roof design
Halogen light bulbs were used as a heat source, causing the roof temperature to
increase by the radiation process. In this process, part of the heat dissipated through
convection and radiation process from the metal roof. The rest of the heat passed through
the tube section by conduction process. Certain amount of heat was carried out by
convection process through the tube channels. Finally, remaining heat was transferred
into the attic and cause an increase in attic temperature. Following assumptions were
made for the smart roof system:
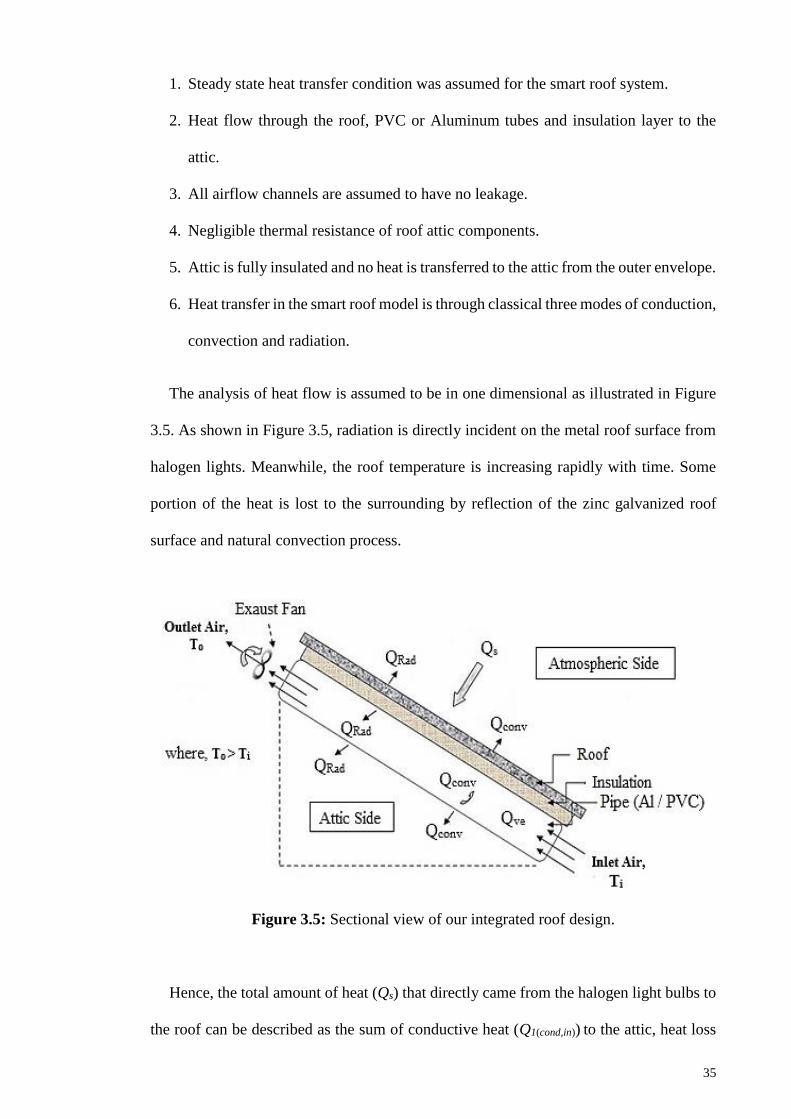
35
1. Steady state heat transfer condition was assumed for the smart roof system.
2. Heat flow through the roof, PVC or Aluminum tubes and insulation layer to the
attic.
3. All airflow channels are assumed to have no leakage.
4. Negligible thermal resistance of roof attic components.
5. Attic is fully insulated and no heat is transferred to the attic from the outer envelope.
6. Heat transfer in the smart roof model is through classical three modes of conduction,
convection and radiation.
The analysis of heat flow is assumed to be in one dimensional as illustrated in Figure
3.5. As shown in Figure 3.5, radiation is directly incident on the metal roof surface from
halogen lights. Meanwhile, the roof temperature is increasing rapidly with time. Some
portion of the heat is lost to the surrounding by reflection of the zinc galvanized roof
surface and natural convection process.
Figure 3.5: Sectional view of our integrated roof design.
Hence, the total amount of heat (Qs) that directly came from the halogen light bulbs to
the roof can be described as the sum of conductive heat (Q1(cond,in)) to the attic, heat loss
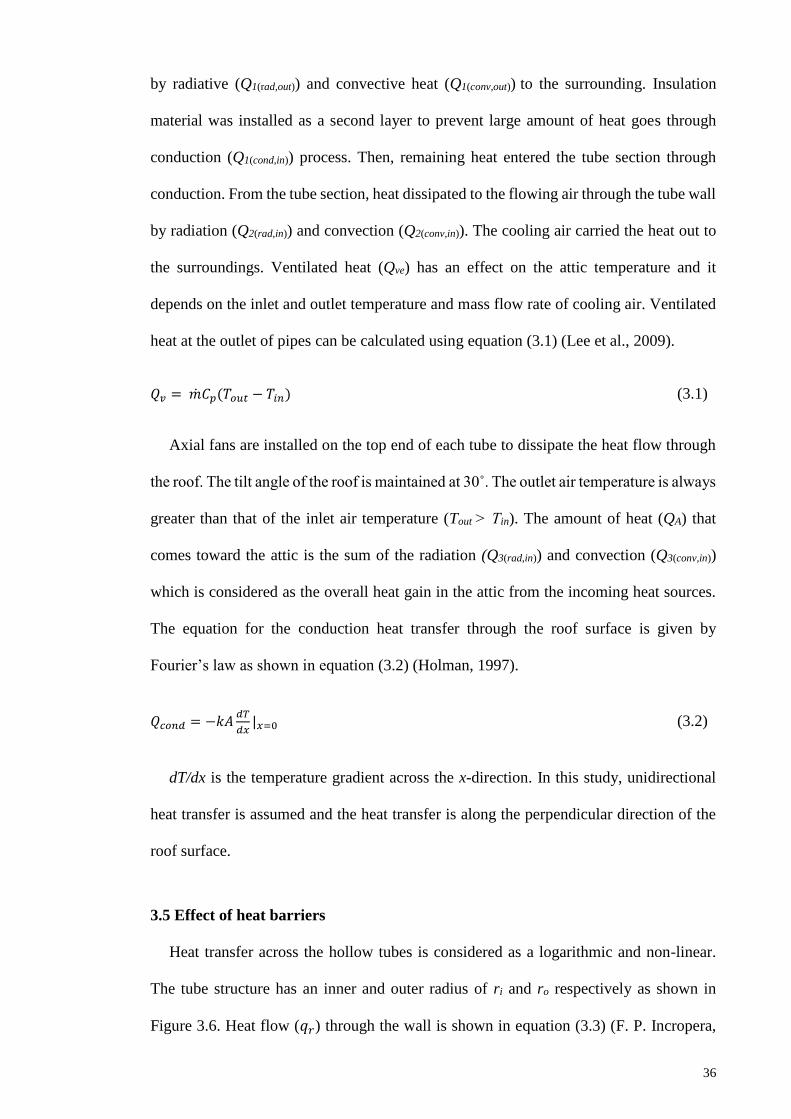
36
by radiative (Q1(rad,out)) and convective heat (Q1(conv,out)) to the surrounding. Insulation
material was installed as a second layer to prevent large amount of heat goes through
conduction (Q1(cond,in)) process. Then, remaining heat entered the tube section through
conduction. From the tube section, heat dissipated to the flowing air through the tube wall
by radiation (Q2(rad,in)) and convection (Q2(conv,in)). The cooling air carried the heat out to
the surroundings. Ventilated heat (Qve) has an effect on the attic temperature and it
depends on the inlet and outlet temperature and mass flow rate of cooling air. Ventilated
heat at the outlet of pipes can be calculated using equation (3.1) (Lee et al., 2009).
𝑄𝑣 = �̇�𝐶𝑝(𝑇𝑜𝑢𝑡 − 𝑇𝑖𝑛) (3.1)
Axial fans are installed on the top end of each tube to dissipate the heat flow through
the roof. The tilt angle of the roof is maintained at 30˚. The outlet air temperature is always
greater than that of the inlet air temperature (Tout ˃ Tin). The amount of heat (QA) that
comes toward the attic is the sum of the radiation (Q3(rad,in)) and convection (Q3(conv,in))
which is considered as the overall heat gain in the attic from the incoming heat sources.
The equation for the conduction heat transfer through the roof surface is given by
Fourier’s law as shown in equation (3.2) (Holman, 1997).
𝑄𝑐𝑜𝑛𝑑 = −𝑘𝐴𝑑𝑇
𝑑𝑥|𝑥=0 (3.2)
dT/dx is the temperature gradient across the x-direction. In this study, unidirectional
heat transfer is assumed and the heat transfer is along the perpendicular direction of the
roof surface.
3.5 Effect of heat barriers
Heat transfer across the hollow tubes is considered as a logarithmic and non-linear.
The tube structure has an inner and outer radius of ri and ro respectively as shown in
Figure 3.6. Heat flow (𝑞𝑟) through the wall is shown in equation (3.3) (F. P. Incropera,
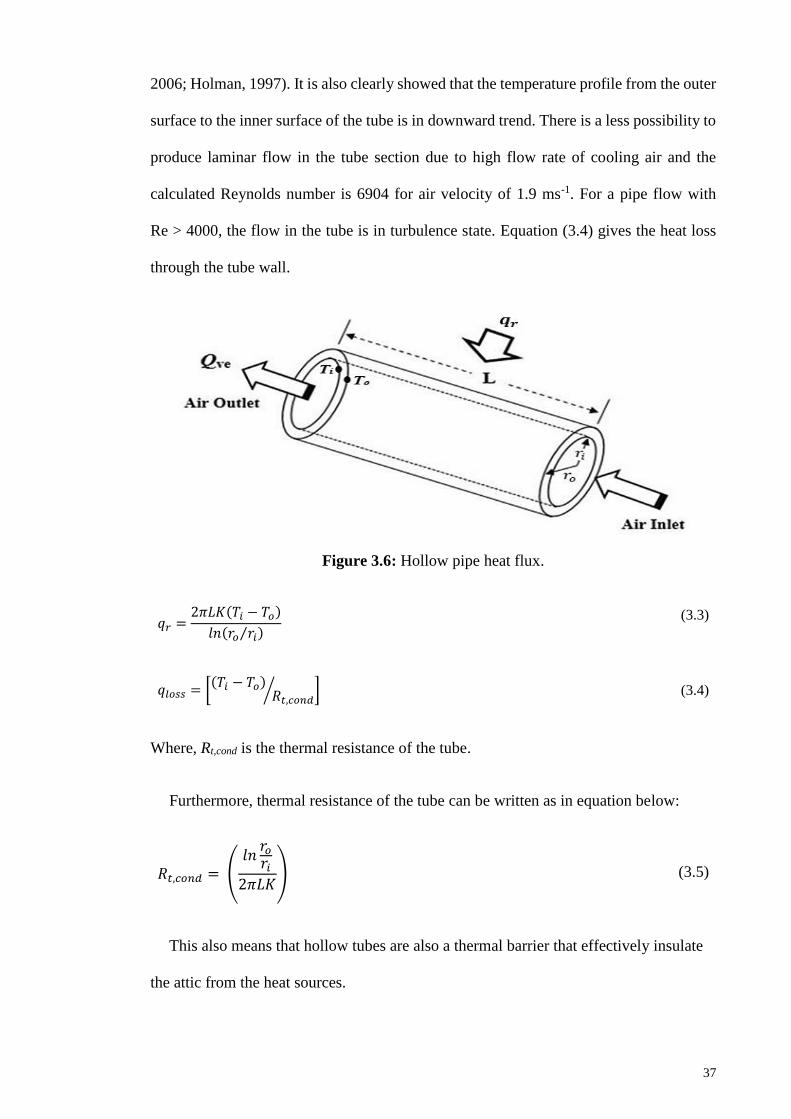
37
2006; Holman, 1997). It is also clearly showed that the temperature profile from the outer
surface to the inner surface of the tube is in downward trend. There is a less possibility to
produce laminar flow in the tube section due to high flow rate of cooling air and the
calculated Reynolds number is 6904 for air velocity of 1.9 ms-1. For a pipe flow with
Re > 4000, the flow in the tube is in turbulence state. Equation (3.4) gives the heat loss
through the tube wall.
Figure 3.6: Hollow pipe heat flux.
𝑞𝑟 =2𝜋𝐿𝐾(𝑇𝑖 − 𝑇𝑜)
𝑙𝑛(𝑟𝑜 𝑟𝑖⁄ )
(3.3)
𝑞𝑙𝑜𝑠𝑠 = [(𝑇𝑖 − 𝑇𝑜)
𝑅𝑡,𝑐𝑜𝑛𝑑⁄ ] (3.4)
Where, Rt,cond is the thermal resistance of the tube.
Furthermore, thermal resistance of the tube can be written as in equation below:
𝑅𝑡,𝑐𝑜𝑛𝑑 = (𝑙𝑛
𝑟𝑜
𝑟𝑖
2𝜋𝐿𝐾) (3.5)
This also means that hollow tubes are also a thermal barrier that effectively insulate
the attic from the heat sources.
38
3.6 Forced ventilation
In natural convection, air motion is caused by the buoyancy effect and this is the
primary heat transfer mechanism for the passive MAP system. In forced convection,
cooling air is supplied by ventilation fans to dissipate the heat generated and this is the
primary heat transfer mechanism for the active MAP system. For an active MAP system,
the cooling air velocity is in the range between 1 to 1.9 ms-1 and the mass flow rate of the
cooling air is calculated by using equation (3.6) (F. P. Incropera, 2006).
4
V 2Dm air
•
(3.6)
is the air density (kgm-3), D is the tube diameter (m) and Vair is the velocity of
cooling air (ms-1).
Moreover, the attic temperature effect is evaluated on different mass flow rates of
cooling air. Heat transfer rate to the attic is the sum of radiation and convection heat gain.
The heat gain in the attic can be calculated using conservation of energy equation as in
Eq. (3.7) (F. P. Incropera, 2006) by with an assumption no heat transfer in and out of the
Perspex box.
�̇�𝐶𝑝
𝑑𝑇𝑎𝑡𝑡𝑖𝑐
𝑑𝑡= 𝑄𝑎𝑡𝑡𝑖𝑐
(3.7)
From Eq. (3.7) the attic temperature can be obtained as follows:
𝑇𝑎𝑡𝑡𝑖𝑐 = �̇�𝐶𝑝𝑇𝑎,𝑖 + ℎ𝐴𝑇𝑏∆𝑡
�̇�𝐶𝑝 + ℎ𝐴∆𝑡
(3.8)
Ta,i is the initial temperature of attic (°C), Cp is specific heat at constant pressure (1005
Jkg-1K-1), Tt is the tube bottom surface temperature (°C), A is attic area (0.1414m2), Δt is
time difference (s), h is convective heat transfer coefficient (0.42W/m2k).
39
3.7 Thermal resistance model for the smart roof
In this study, thermal resistance was used to characterize the smart roof design. The
R-value of a material is used to evaluate the performance of different roof designs to
indicate the effectiveness of the insulation. The thermal resistances of the materials used
in the smart roof design is listed in Table 3.1.
The individual R-values of the metal roof, insulator and pipes are presented in
equation (3.9-3.10).
𝑅𝑠 = 𝑅𝑟𝑜𝑜𝑓 + 𝑟𝑒 (3.9)
𝑅𝑡 = 𝑅𝑟𝑜𝑜𝑓 + 𝑅𝑖𝑛𝑠 + 𝑟𝑒 + 𝑟𝑖 + 𝑅𝑛 (3.10)
Rs is the thermal resistance of the roof.
Rt is the total thermal resistance from the roof surface to the attic.
Reference values for re and ri are taken from EN ISO 6946 (EN ISO 6946, 1996).
Sol-air temperature is a fictitious temperature which is equivalent to outdoor air
temperature in the absence of radiation. The sol-air temperature, Tsol-air can be written as
follows (Ciampi et al., 2005):
𝑇𝑆𝑜𝑙−𝑎𝑖𝑟 = 𝑇𝑜 + 𝑎𝑟𝑒𝐺 (3.11)
To is the outdoor temperature, oC
a is the radiation absorptivity (assumed to be 0.65)
G is the average solar radiation intensity.
The specific heat capacity rate can be written as follows (Ciampi et al., 2005):
40
rp AcmC /•
(3.12)
cp is the specific heat at constant pressure (1005 Jkg-1K-1).
Ar is the area of the roof (Ar = dL).
The equation below is used to characterize the heat flow from the roof to the attic
(Ciampi et al., 2005).
))(( inout
t
atticairsol TTznCR
TTQ
Where,
𝑧 = (𝑅𝑠
𝑅𝑡)
(3.13)
(3.14)
z is the dimensionless parameter for the thermal resistance.
Tout is average outlet air temperature of the tubes, oC.
Tin is average inlet temperature of the tubes, oC.
n is the number of tubes.
The last part of equation (3.13) is vital, which can rule out the heat flux eliminated
by passive and active MAP system. The terms ))(( inout TTznC indicates the role of the
heat flux removed from the room by the ventilation process. This equation also shows
that the heat flux is dependent on the mass flow rate of the cooling air.
3.8 Energy consumption
In order to calculate the energy consumption of an air-conditioning system in a
residential room, using different roof designs (A-H), it is needed to consider the annual
cooling load hours. Based on the previous study, average operating hours of air
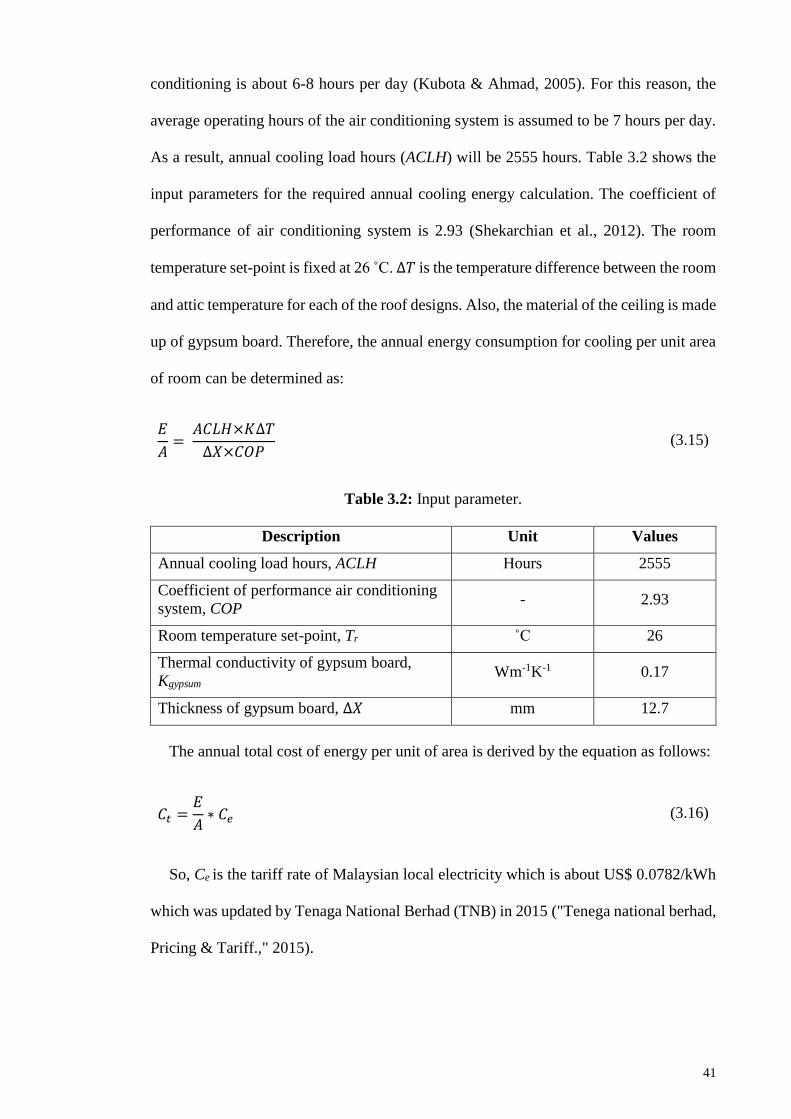
41
conditioning is about 6-8 hours per day (Kubota & Ahmad, 2005). For this reason, the
average operating hours of the air conditioning system is assumed to be 7 hours per day.
As a result, annual cooling load hours (ACLH) will be 2555 hours. Table 3.2 shows the
input parameters for the required annual cooling energy calculation. The coefficient of
performance of air conditioning system is 2.93 (Shekarchian et al., 2012). The room
temperature set-point is fixed at 26 ̊ C. ∆𝑇 is the temperature difference between the room
and attic temperature for each of the roof designs. Also, the material of the ceiling is made
up of gypsum board. Therefore, the annual energy consumption for cooling per unit area
of room can be determined as:
𝐸
𝐴=
𝐴𝐶𝐿𝐻×𝐾∆𝑇
∆𝑋×𝐶𝑂𝑃 (3.15)
Table 3.2: Input parameter.
Description Unit Values
Annual cooling load hours, ACLH Hours 2555
Coefficient of performance air conditioning
system, COP - 2.93
Room temperature set-point, Tr ˚C 26
Thermal conductivity of gypsum board,
Kgypsum Wm-1K-1 0.17
Thickness of gypsum board, ∆𝑋 mm 12.7
The annual total cost of energy per unit of area is derived by the equation as follows:
𝐶𝑡 =𝐸
𝐴∗ 𝐶𝑒 (3.16)
So, Ce is the tariff rate of Malaysian local electricity which is about US$ 0.0782/kWh
which was updated by Tenaga National Berhad (TNB) in 2015 ("Tenega national berhad,
Pricing & Tariff.," 2015).
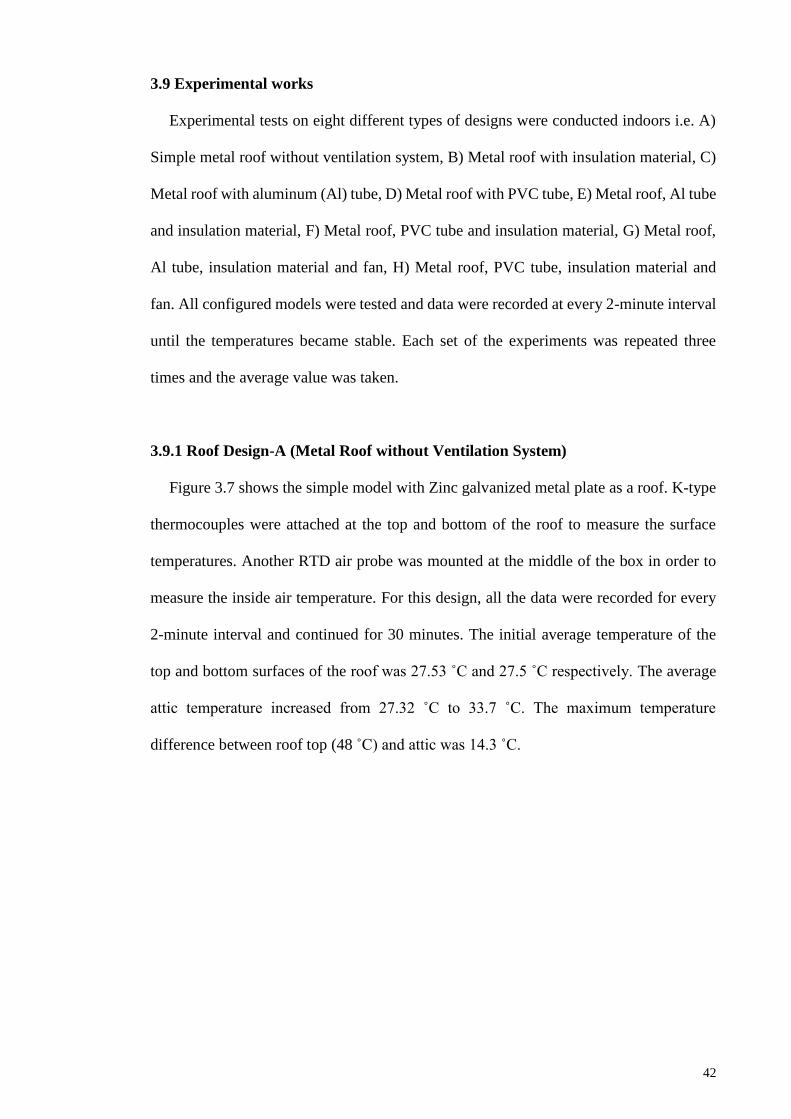
42
3.9 Experimental works
Experimental tests on eight different types of designs were conducted indoors i.e. A)
Simple metal roof without ventilation system, B) Metal roof with insulation material, C)
Metal roof with aluminum (Al) tube, D) Metal roof with PVC tube, E) Metal roof, Al tube
and insulation material, F) Metal roof, PVC tube and insulation material, G) Metal roof,
Al tube, insulation material and fan, H) Metal roof, PVC tube, insulation material and
fan. All configured models were tested and data were recorded at every 2-minute interval
until the temperatures became stable. Each set of the experiments was repeated three
times and the average value was taken.
3.9.1 Roof Design-A (Metal Roof without Ventilation System)
Figure 3.7 shows the simple model with Zinc galvanized metal plate as a roof. K-type
thermocouples were attached at the top and bottom of the roof to measure the surface
temperatures. Another RTD air probe was mounted at the middle of the box in order to
measure the inside air temperature. For this design, all the data were recorded for every
2-minute interval and continued for 30 minutes. The initial average temperature of the
top and bottom surfaces of the roof was 27.53 ˚C and 27.5 ˚C respectively. The average
attic temperature increased from 27.32 ˚C to 33.7 ˚C. The maximum temperature
difference between roof top (48 ˚C) and attic was 14.3 ˚C.
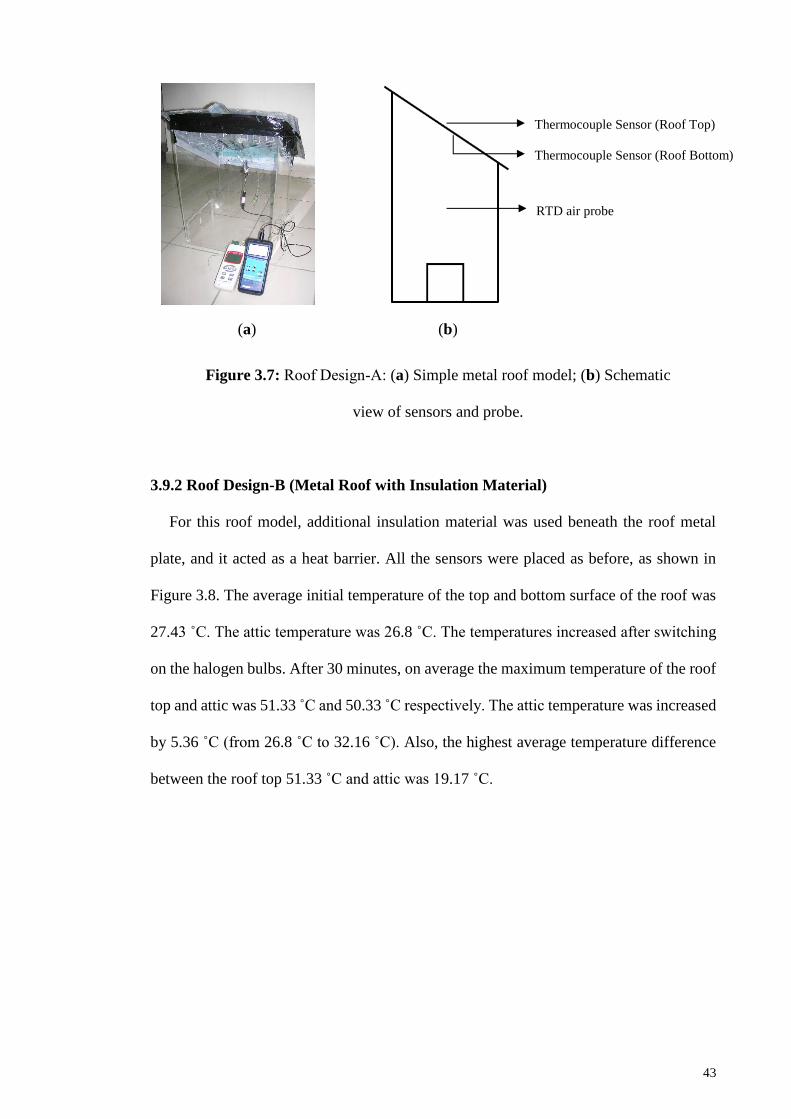
43
Figure 3.7: Roof Design-A: (a) Simple metal roof model; (b) Schematic
view of sensors and probe.
3.9.2 Roof Design-B (Metal Roof with Insulation Material)
For this roof model, additional insulation material was used beneath the roof metal
plate, and it acted as a heat barrier. All the sensors were placed as before, as shown in
Figure 3.8. The average initial temperature of the top and bottom surface of the roof was
27.43 ˚C. The attic temperature was 26.8 ˚C. The temperatures increased after switching
on the halogen bulbs. After 30 minutes, on average the maximum temperature of the roof
top and attic was 51.33 ˚C and 50.33 ˚C respectively. The attic temperature was increased
by 5.36 ˚C (from 26.8 ˚C to 32.16 ˚C). Also, the highest average temperature difference
between the roof top 51.33 ˚C and attic was 19.17 ˚C.
Thermocouple Sensor (Roof Bottom)
Thermocouple Sensor (Roof Top)
RTD air probe
(a) (b)
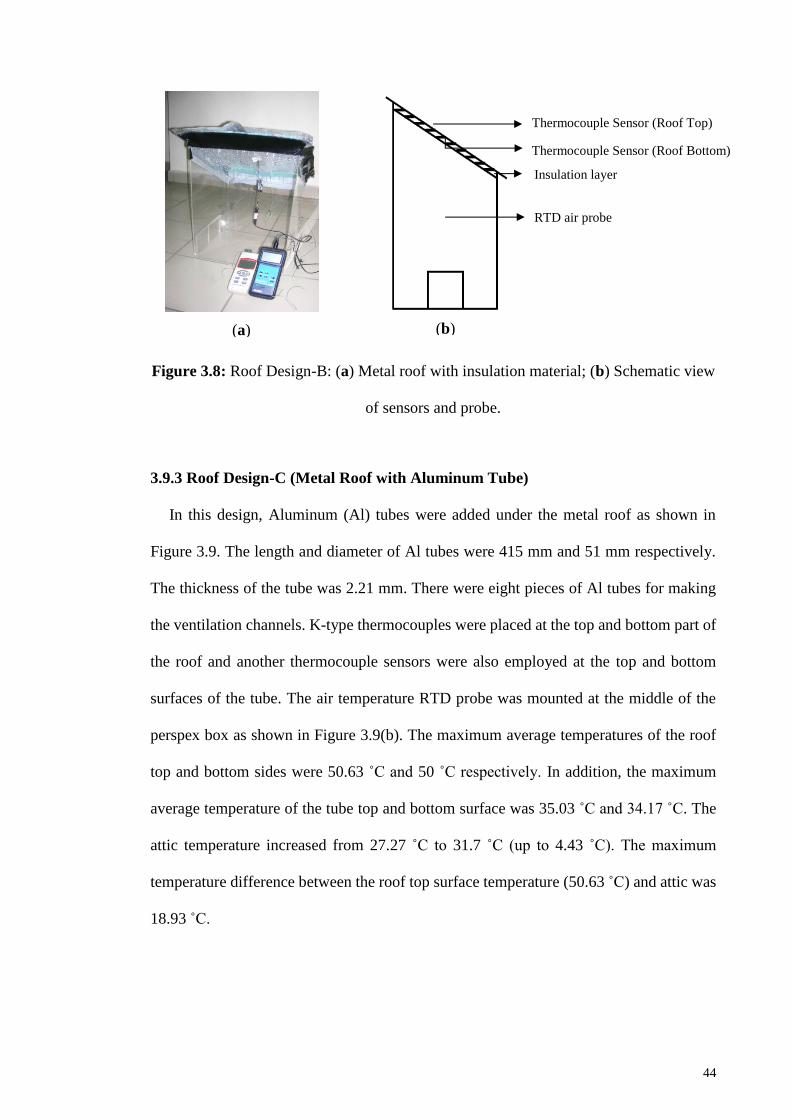
44
Figure 3.8: Roof Design-B: (a) Metal roof with insulation material; (b) Schematic view
of sensors and probe.
3.9.3 Roof Design-C (Metal Roof with Aluminum Tube)
In this design, Aluminum (Al) tubes were added under the metal roof as shown in
Figure 3.9. The length and diameter of Al tubes were 415 mm and 51 mm respectively.
The thickness of the tube was 2.21 mm. There were eight pieces of Al tubes for making
the ventilation channels. K-type thermocouples were placed at the top and bottom part of
the roof and another thermocouple sensors were also employed at the top and bottom
surfaces of the tube. The air temperature RTD probe was mounted at the middle of the
perspex box as shown in Figure 3.9(b). The maximum average temperatures of the roof
top and bottom sides were 50.63 ˚C and 50 ˚C respectively. In addition, the maximum
average temperature of the tube top and bottom surface was 35.03 ˚C and 34.17 ˚C. The
attic temperature increased from 27.27 ˚C to 31.7 ˚C (up to 4.43 ˚C). The maximum
temperature difference between the roof top surface temperature (50.63 ˚C) and attic was
18.93 ˚C.
(b) (a)
Thermocouple Sensor (Roof Top)
Insulation layer
RTD air probe
Thermocouple Sensor (Roof Bottom)
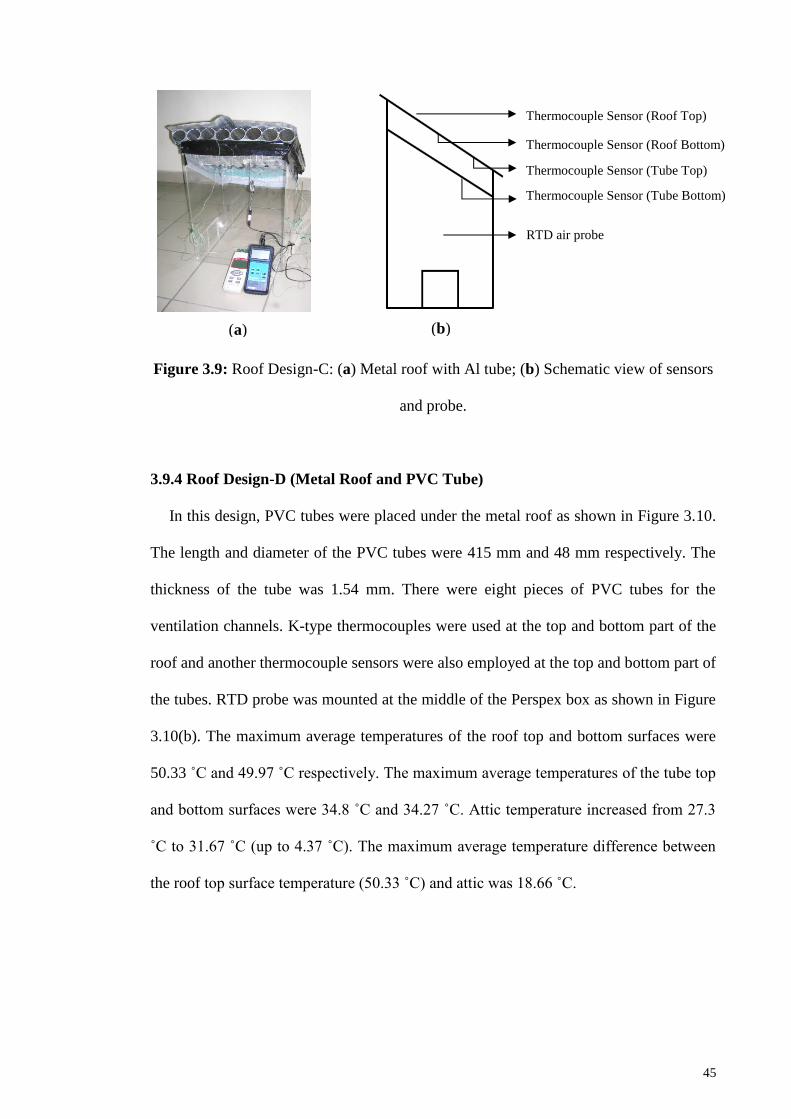
45
Figure 3.9: Roof Design-C: (a) Metal roof with Al tube; (b) Schematic view of sensors
and probe.
3.9.4 Roof Design-D (Metal Roof and PVC Tube)
In this design, PVC tubes were placed under the metal roof as shown in Figure 3.10.
The length and diameter of the PVC tubes were 415 mm and 48 mm respectively. The
thickness of the tube was 1.54 mm. There were eight pieces of PVC tubes for the
ventilation channels. K-type thermocouples were used at the top and bottom part of the
roof and another thermocouple sensors were also employed at the top and bottom part of
the tubes. RTD probe was mounted at the middle of the Perspex box as shown in Figure
3.10(b). The maximum average temperatures of the roof top and bottom surfaces were
50.33 ˚C and 49.97 ˚C respectively. The maximum average temperatures of the tube top
and bottom surfaces were 34.8 ˚C and 34.27 ˚C. Attic temperature increased from 27.3
˚C to 31.67 ˚C (up to 4.37 ˚C). The maximum average temperature difference between
the roof top surface temperature (50.33 ˚C) and attic was 18.66 ˚C.
Thermocouple Sensor (Roof Top)
Thermocouple Sensor (Roof Bottom)
Thermocouple Sensor (Tube Top)
RTD air probe
Thermocouple Sensor (Tube Bottom)
(a) (b)
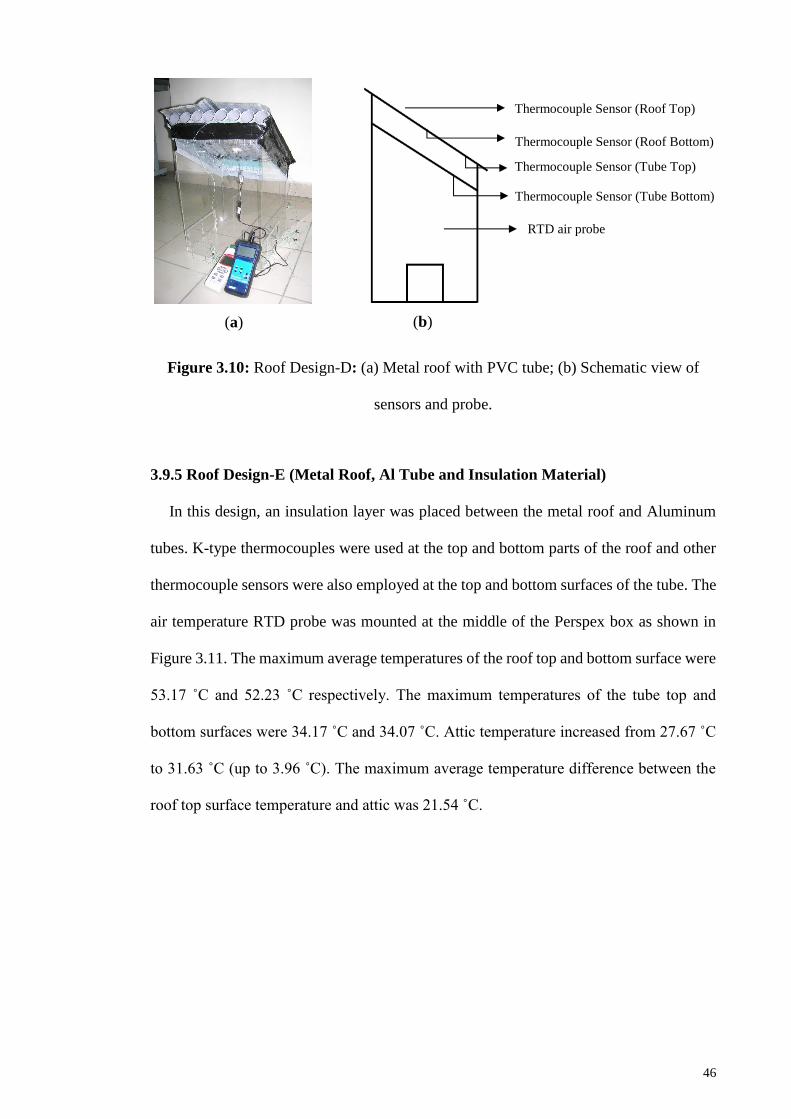
46
Figure 3.10: Roof Design-D: (a) Metal roof with PVC tube; (b) Schematic view of
sensors and probe.
3.9.5 Roof Design-E (Metal Roof, Al Tube and Insulation Material)
In this design, an insulation layer was placed between the metal roof and Aluminum
tubes. K-type thermocouples were used at the top and bottom parts of the roof and other
thermocouple sensors were also employed at the top and bottom surfaces of the tube. The
air temperature RTD probe was mounted at the middle of the Perspex box as shown in
Figure 3.11. The maximum average temperatures of the roof top and bottom surface were
53.17 ˚C and 52.23 ˚C respectively. The maximum temperatures of the tube top and
bottom surfaces were 34.17 ˚C and 34.07 ˚C. Attic temperature increased from 27.67 ˚C
to 31.63 ˚C (up to 3.96 ˚C). The maximum average temperature difference between the
roof top surface temperature and attic was 21.54 ˚C.
Thermocouple Sensor (Tube Bottom)
Thermocouple Sensor (Roof Top)
Thermocouple Sensor (Roof Bottom)
Thermocouple Sensor (Tube Top)
RTD air probe
(a)
(a)
(b)
(a)
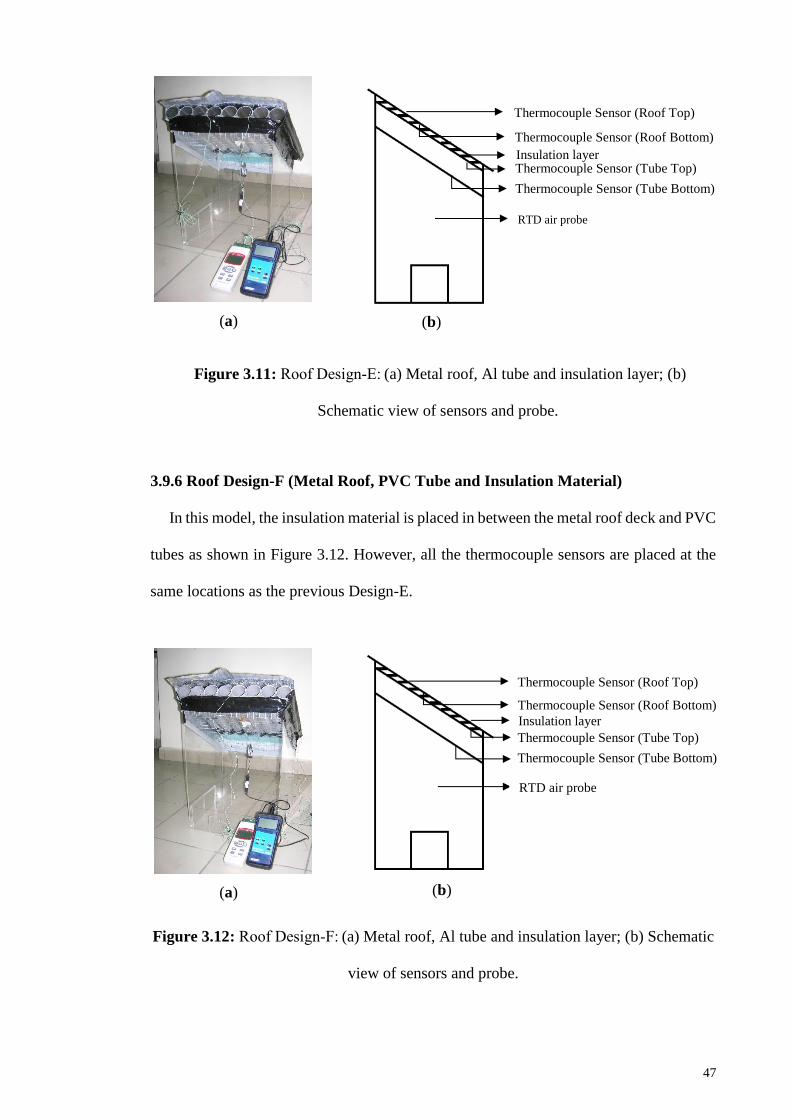
47
Figure 3.11: Roof Design-E: (a) Metal roof, Al tube and insulation layer; (b)
Schematic view of sensors and probe.
3.9.6 Roof Design-F (Metal Roof, PVC Tube and Insulation Material)
In this model, the insulation material is placed in between the metal roof deck and PVC
tubes as shown in Figure 3.12. However, all the thermocouple sensors are placed at the
same locations as the previous Design-E.
Figure 3.12: Roof Design-F: (a) Metal roof, Al tube and insulation layer; (b) Schematic
view of sensors and probe.
Thermocouple Sensor (Tube Top)
Thermocouple Sensor (Roof Top)
Thermocouple Sensor (Roof Bottom)
RTD air probe
Thermocouple Sensor (Tube Bottom)
Insulation layer
(a) (b)
Thermocouple Sensor (Tube Top)
Thermocouple Sensor (Roof Top)
Thermocouple Sensor (Roof Bottom)
RTD air probe
Thermocouple Sensor (Tube Bottom)
Insulation layer
(a) (b)
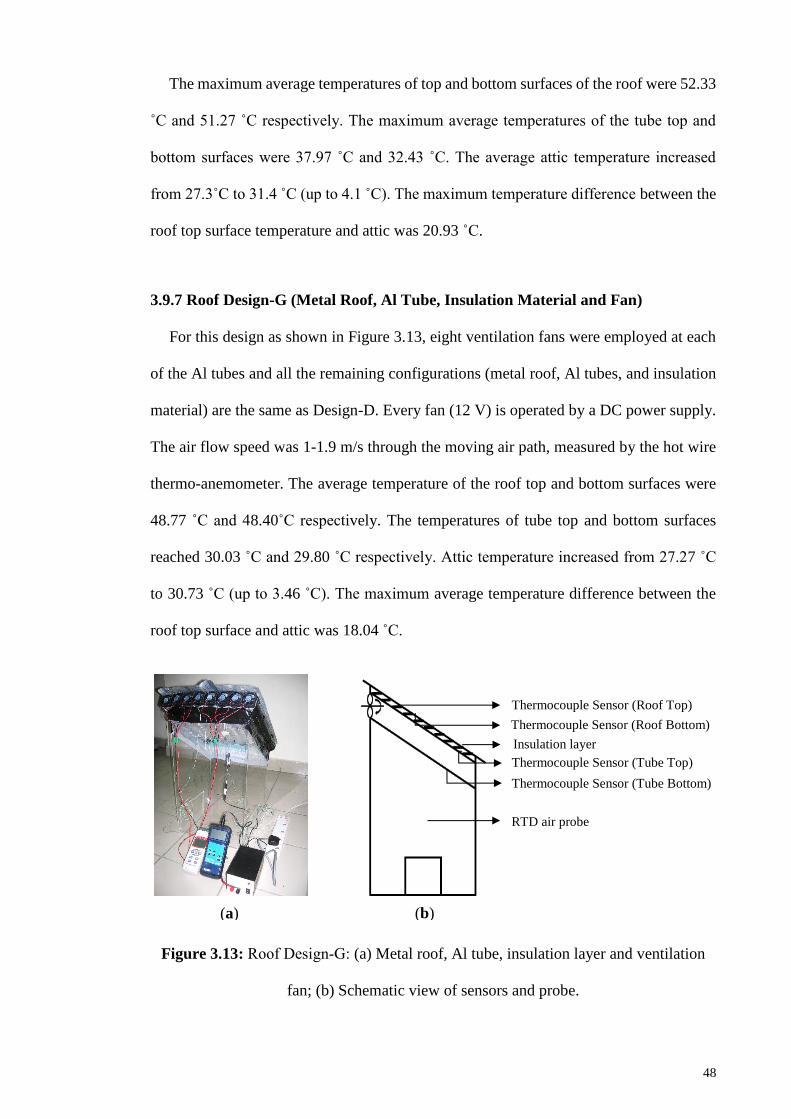
48
The maximum average temperatures of top and bottom surfaces of the roof were 52.33
˚C and 51.27 ˚C respectively. The maximum average temperatures of the tube top and
bottom surfaces were 37.97 ˚C and 32.43 ˚C. The average attic temperature increased
from 27.3˚C to 31.4 ˚C (up to 4.1 ˚C). The maximum temperature difference between the
roof top surface temperature and attic was 20.93 ˚C.
3.9.7 Roof Design-G (Metal Roof, Al Tube, Insulation Material and Fan)
For this design as shown in Figure 3.13, eight ventilation fans were employed at each
of the Al tubes and all the remaining configurations (metal roof, Al tubes, and insulation
material) are the same as Design-D. Every fan (12 V) is operated by a DC power supply.
The air flow speed was 1-1.9 m/s through the moving air path, measured by the hot wire
thermo-anemometer. The average temperature of the roof top and bottom surfaces were
48.77 ˚C and 48.40˚C respectively. The temperatures of tube top and bottom surfaces
reached 30.03 ˚C and 29.80 ˚C respectively. Attic temperature increased from 27.27 ˚C
to 30.73 ˚C (up to 3.46 ˚C). The maximum average temperature difference between the
roof top surface and attic was 18.04 ˚C.
Figure 3.13: Roof Design-G: (a) Metal roof, Al tube, insulation layer and ventilation
fan; (b) Schematic view of sensors and probe.
(a) (b)
Thermocouple Sensor (Tube Top)
Thermocouple Sensor (Roof Top) Thermocouple Sensor (Roof Bottom)
RTD air probe
Insulation layer
Thermocouple Sensor (Tube Bottom)
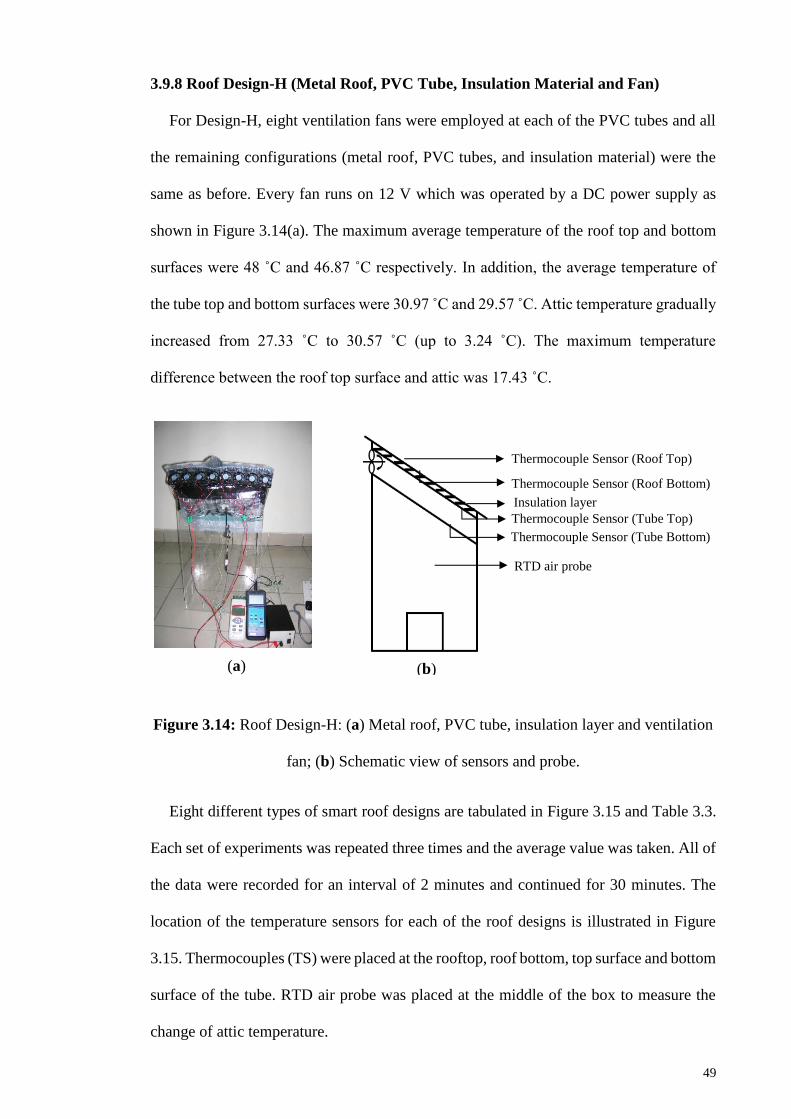
49
3.9.8 Roof Design-H (Metal Roof, PVC Tube, Insulation Material and Fan)
For Design-H, eight ventilation fans were employed at each of the PVC tubes and all
the remaining configurations (metal roof, PVC tubes, and insulation material) were the
same as before. Every fan runs on 12 V which was operated by a DC power supply as
shown in Figure 3.14(a). The maximum average temperature of the roof top and bottom
surfaces were 48 ˚C and 46.87 ˚C respectively. In addition, the average temperature of
the tube top and bottom surfaces were 30.97 ̊ C and 29.57 ̊ C. Attic temperature gradually
increased from 27.33 ˚C to 30.57 ˚C (up to 3.24 ˚C). The maximum temperature
difference between the roof top surface and attic was 17.43 ˚C.
Figure 3.14: Roof Design-H: (a) Metal roof, PVC tube, insulation layer and ventilation
fan; (b) Schematic view of sensors and probe.
Eight different types of smart roof designs are tabulated in Figure 3.15 and Table 3.3.
Each set of experiments was repeated three times and the average value was taken. All of
the data were recorded for an interval of 2 minutes and continued for 30 minutes. The
location of the temperature sensors for each of the roof designs is illustrated in Figure
3.15. Thermocouples (TS) were placed at the rooftop, roof bottom, top surface and bottom
surface of the tube. RTD air probe was placed at the middle of the box to measure the
change of attic temperature.
(b) (a)
Thermocouple Sensor (Tube Bottom) Thermocouple Sensor (Tube Top)
Thermocouple Sensor (Roof Top)
Thermocouple Sensor (Roof Bottom)
RTD air probe
Insulation layer
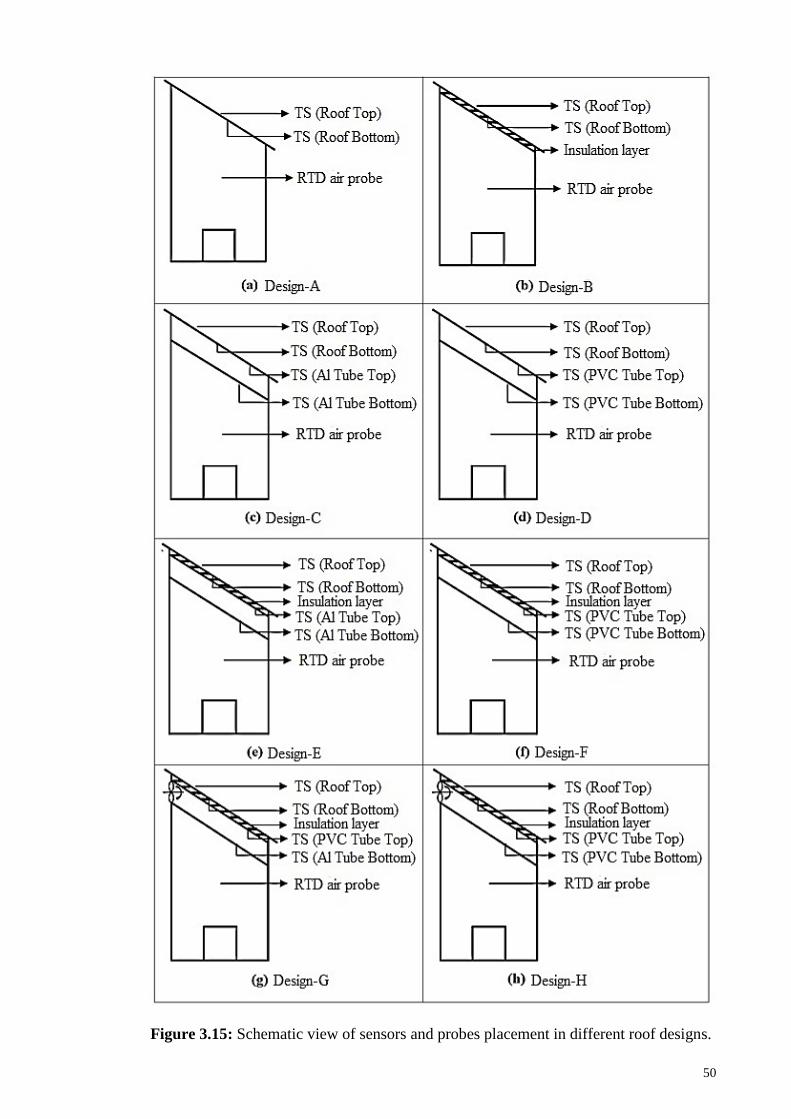
50
Figure 3.15: Schematic view of sensors and probes placement in different roof designs.
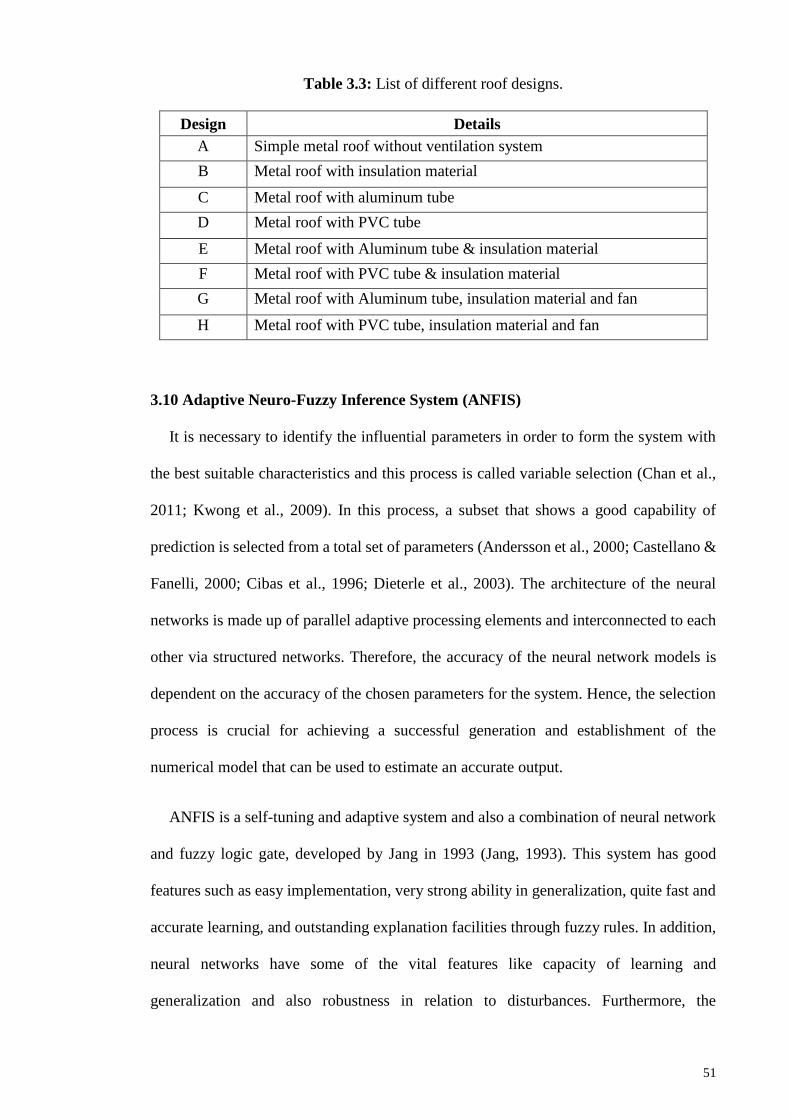
51
Table 3.3: List of different roof designs.
Design Details
A Simple metal roof without ventilation system
B Metal roof with insulation material
C Metal roof with aluminum tube
D Metal roof with PVC tube
E Metal roof with Aluminum tube & insulation material
F Metal roof with PVC tube & insulation material
G Metal roof with Aluminum tube, insulation material and fan
H Metal roof with PVC tube, insulation material and fan
3.10 Adaptive Neuro-Fuzzy Inference System (ANFIS)
It is necessary to identify the influential parameters in order to form the system with
the best suitable characteristics and this process is called variable selection (Chan et al.,
2011; Kwong et al., 2009). In this process, a subset that shows a good capability of
prediction is selected from a total set of parameters (Andersson et al., 2000; Castellano &
Fanelli, 2000; Cibas et al., 1996; Dieterle et al., 2003). The architecture of the neural
networks is made up of parallel adaptive processing elements and interconnected to each
other via structured networks. Therefore, the accuracy of the neural network models is
dependent on the accuracy of the chosen parameters for the system. Hence, the selection
process is crucial for achieving a successful generation and establishment of the
numerical model that can be used to estimate an accurate output.
ANFIS is a self-tuning and adaptive system and also a combination of neural network
and fuzzy logic gate, developed by Jang in 1993 (Jang, 1993). This system has good
features such as easy implementation, very strong ability in generalization, quite fast and
accurate learning, and outstanding explanation facilities through fuzzy rules. In addition,
neural networks have some of the vital features like capacity of learning and
generalization and also robustness in relation to disturbances. Furthermore, the
52
combination of both the neural networks and fuzzy systems enhance their advantages
while overcoming their individual drawbacks. The architecture of ANFIS is a hybrid
intelligent system through integration of fuzzy logic and neural network system to
improve the identification and prediction capability. This method uses fuzzy inference
system (FIS) for identifying the data of input and output and compute the membership
function (MF) parameters automatically. The FIS comprised rule base, database and the
mechanism of reasoning. In addition, the rule base consists of a set of fuzzy rules. The
database assigns the MFs which are applied in the fuzzy rules. The reasoning mechanism
then executes the inference procedure based on the fuzzy rules to produce a reasonable
output. Membership function parameters are dynamically adjusted through least squares
estimation and back propagation algorithm to map the given input to the corresponding
output based on the training data (Grigorie & Botez, 2009; Manoj, 2011). This process is
similar to a neural network system. This kind of system is solely dependent on expertise
of the human knowledge with fuzzy reasoning and the trend of input and output to achieve
a successful input-output mapping (Akcayol, 2004). ANFIS is widely used in solving
engineering problems such as modelling (Al-Ghandoor & Samhouri, 2009; Petković &
Ćojbašić, 2012; Petković, Issa, Pavlović, Pavlović, et al., 2012; Singh et al., 2012),
prediction (Hosoz et al., 2011; Khajeh et al., 2009; Sivakumar & Balu, 2010) and control
(Areed et al., 2010; Kurnaz et al., 2010; Petković, Issa, Pavlović, Zentner, et al., 2012;
Ravi et al., 2011; Tian & Collins, 2005). Furthermore, ANFIS can be used to model the
nonlinear system and predict the behaviour of time-dependent system (Ali Akcayol,
2004). This neuro-adaptive learning methodology allows the fuzzy modelling process to
obtain information regarding the data collected (Aldair & Wang, 2011). It’s a
fundamental concept underlying all neuro-adaptive learning methodologies.
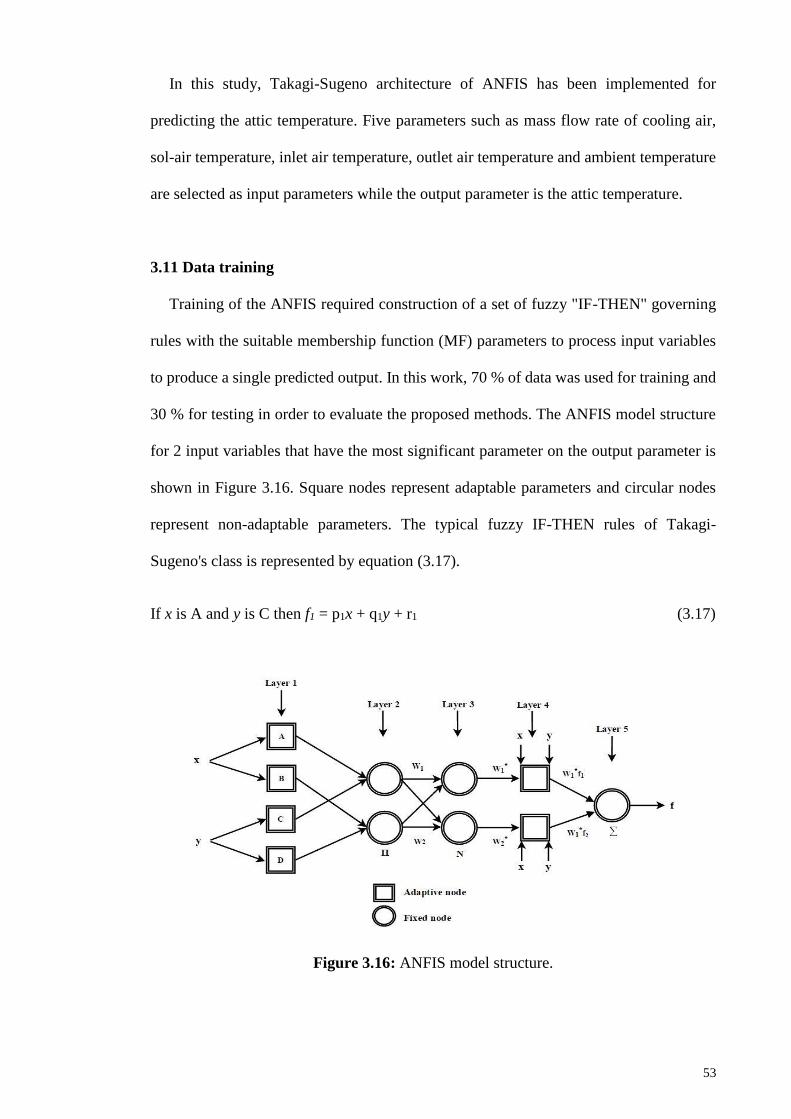
53
In this study, Takagi-Sugeno architecture of ANFIS has been implemented for
predicting the attic temperature. Five parameters such as mass flow rate of cooling air,
sol-air temperature, inlet air temperature, outlet air temperature and ambient temperature
are selected as input parameters while the output parameter is the attic temperature.
3.11 Data training
Training of the ANFIS required construction of a set of fuzzy "IF-THEN" governing
rules with the suitable membership function (MF) parameters to process input variables
to produce a single predicted output. In this work, 70 % of data was used for training and
30 % for testing in order to evaluate the proposed methods. The ANFIS model structure
for 2 input variables that have the most significant parameter on the output parameter is
shown in Figure 3.16. Square nodes represent adaptable parameters and circular nodes
represent non-adaptable parameters. The typical fuzzy IF-THEN rules of Takagi-
Sugeno's class is represented by equation (3.17).
If x is A and y is C then f1 = p1x + q1y + r1 (3.17)
Figure 3.16: ANFIS model structure.
54
Layer 1
All input parameters belong to the first layer and fetches the values to the next layer.
Every node in this layer is a square node and input of the nodes are represented by x and
y. A1, A2, B1 and B2 are the linguistic label to divide the MFs. The membership
relationship between the input and output function are shown in equation (3.18) and
equation (3.19) respectively (Roy, 2005).
𝑂1,𝑖 = 𝜇𝐴𝑖(𝑥); i = 1, 2 (3.18)
𝑂1,𝑗 = 𝜇𝐵𝑗(𝑦); j = 1, 2 (3.19)
Where, O1,i and O1,j are output functions and μAi(x) and μAi(y) are membership
functions.
Bell-shaped membership function with a maximum value of (1.0) and minimum value
of (0.0) is selected for this study (Petković, Issa, Pavlović, Zentner, et al., 2012).
𝜇𝐴𝑖(𝑥) = 1
1+ [(𝑥− 𝑐𝑖
𝑎𝑖)
2
]
𝑏𝑖 (3.20)
Where ai, bi and ci are the MF parameters. Premise parameters are well known in this
layer’s parameters and will be adjusted during the training process.
Layer 2
In this layer, all the nodes are circular nodes and highlighted as Π. The node multiplied
the incoming signals for computing the firing strength of individual rule (Roy, 2005).
𝑂2,𝑖 = 𝑤𝑖 = 𝜇𝐴𝑖 (𝑥)𝜇𝐵𝑗(𝑦); i = 1, 2 (3.21)
55
Layer 3
All the nodes in this layer are circular nodes and labelled as N. This layer is known as
the rule layer. The normalized weights are computed by every node. Furthermore, the
value of the rule’s firing strength over the sum of all rules’ firing strengths are computed
by each of the nodes as shown in equation (3.22). The outcomes are referred to as the
normalized firing strengths (Roy, 2005).
𝑂3,𝑖 = 𝑤𝑖̅̅ ̅ = 𝑤𝑖
𝑤1+ 𝑤2 ; i = 1, 2 (3.22)
Layer 4
All the nodes in this layer are square nodes with linear function. This layer is
responsible for providing the output values as a result of the inference of rules. This layer
is also known as the defuzzification layer. The output in this layer can be written as in
equation (3.23) (Roy, 2005).
𝑂4,𝑖 = 𝑤𝑖̅̅ ̅𝑓𝑖 = 𝑤𝑖̅̅ ̅(𝑝𝑖𝑥 + 𝑞𝑖𝑦 + 𝑟𝑖); i = 1, 2 (3.23)
Where pi, qi and ri are named as a linear parameter or consequent parameter. The
consequent parameters will be adjusted in the training process.
Layer 5
The final layer is also called the output layer. It converts the fuzzy classification
outcomes into a binary. The single node in this layer is a circular node and labelled as ∑.
A node in this layer is considered as a non-adaptive node. This node calculates the total
output as the whole sum of all receiving signals as given in equation (3.24) (Roy, 2005).
𝑂5,𝑖 = ∑ 𝑤𝑖̅̅ ̅𝑓𝑖𝑖 =∑ 𝑤𝑖̅̅̅̅ 𝑓𝑖𝑖
∑ 𝑤𝑖̅̅̅̅𝑖 ; i = 1, 2 (3.24)

56
In the learning process, modifiable parameters are adjusted to match the output to the
training data. The hybrid learning algorithm is the ANFIS architecture for variable
identification that was applied to adapt the consequent parameters and modify the premise
parameters to match the fuzzy set in the input domain. Furthermore, consequent variables
are calculated via least squares estimation. Standard back propagation algorithm is
utilized to adapt the output error to the premise parameters.
57
CHAPTER 4: RESULTS AND DISCUSSION
4.1 Comparison of attic temperatures
One of the main objectives is to reduce the attic temperature in this experimental work.
Therefore, several roof designs were tested at indoors and evaluated their thermal
performances. Based on the experimental evaluation, it would be easy to find the best
suitable roof model. From Table 4.1, the maximum temperatures are shown for
comparison between the different roof designs. For the simple metal roof Design-A, the
average of the highest temperature of the roof and attic was 49.83 ˚C and 33.77 ˚C
respectively. On average, the attic temperature is increased by 4.4 ˚C/min for the first 4
minutes in the absence of insulation effect. In Design-B, the average attic temperature
was reduced to 32.16 ˚C. It is slightly decreased by 1.16 ˚C in comparison with the attic
temperature of Design-A. Placing the insulation layer under the roof metal which acted
as a radiant barrier resulted in lower heat transfer into the attic space in Design-B. For
Design-C and Design-D, the average maximum attic temperatures were reduced to 31.7
˚C and 31.67 ˚C (up to 2.1 ˚C) respectively, as illustrated in Figure 4.1. Heat transfer to
the attic is depended on the temperature difference, thermal conductivity of the material
and ventilated heat as explained in equation (3.13). Therefore, heat transfer is positively
correlated to the temperature difference and inverse proportional to the thermal resistance
of materials. However, PVC tube has the lowest thermal conductivity compared to
Aluminum tube as shown in Table 3.1. This thermal property also affects the heat gain in
the attic and caused a lower attic temperature recorded for Design-D.
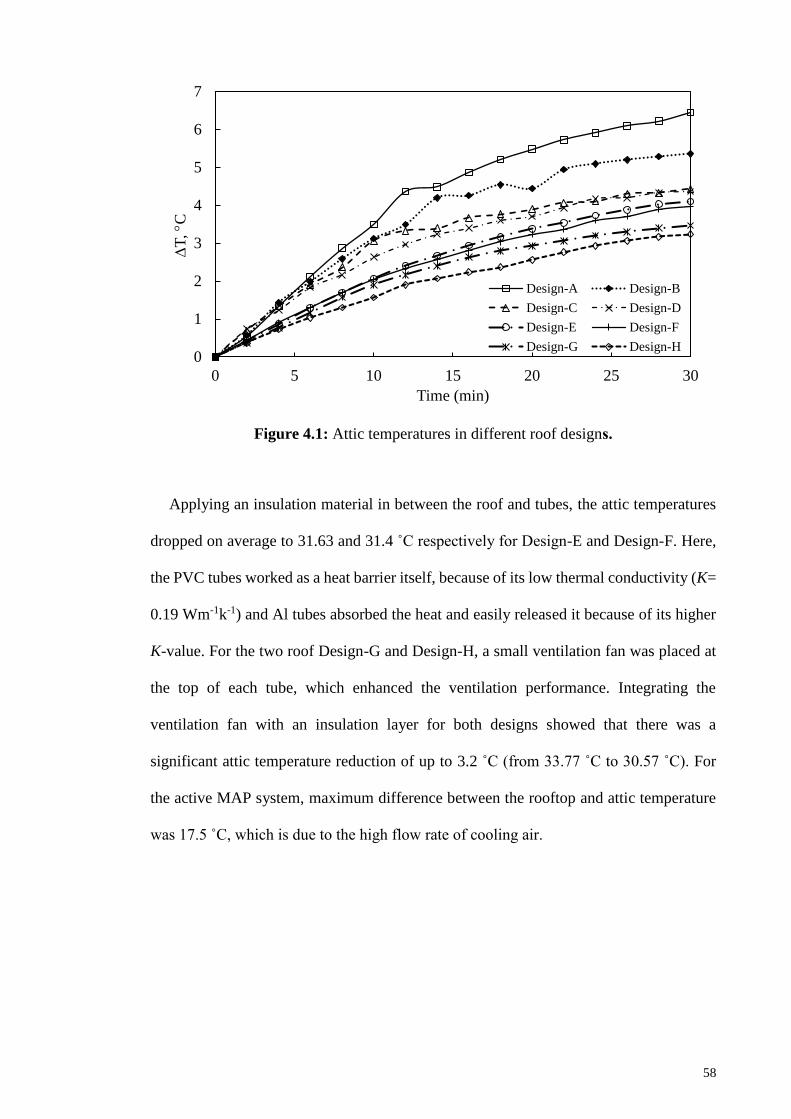
58
Figure 4.1: Attic temperatures in different roof designs.
Applying an insulation material in between the roof and tubes, the attic temperatures
dropped on average to 31.63 and 31.4 ˚C respectively for Design-E and Design-F. Here,
the PVC tubes worked as a heat barrier itself, because of its low thermal conductivity (K=
0.19 Wm-1k-1) and Al tubes absorbed the heat and easily released it because of its higher
K-value. For the two roof Design-G and Design-H, a small ventilation fan was placed at
the top of each tube, which enhanced the ventilation performance. Integrating the
ventilation fan with an insulation layer for both designs showed that there was a
significant attic temperature reduction of up to 3.2 ˚C (from 33.77 ˚C to 30.57 ˚C). For
the active MAP system, maximum difference between the rooftop and attic temperature
was 17.5 ˚C, which is due to the high flow rate of cooling air.
0
1
2
3
4
5
6
7
0 5 10 15 20 25 30
T
, C
Time (min)
Design-A Design-B
Design-C Design-D
Design-E Design-F
Design-G Design-H
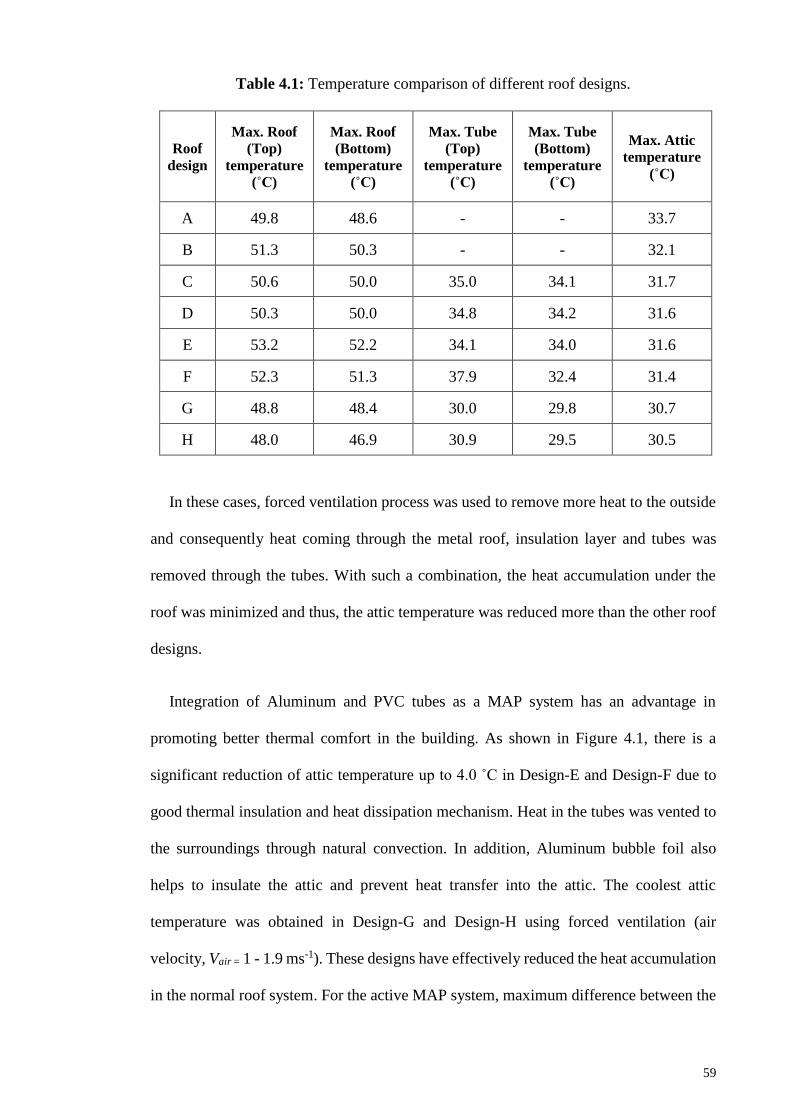
59
Table 4.1: Temperature comparison of different roof designs.
Roof
design
Max. Roof
(Top)
temperature
(˚C)
Max. Roof
(Bottom)
temperature
(˚C)
Max. Tube
(Top)
temperature
(˚C)
Max. Tube
(Bottom)
temperature
(˚C)
Max. Attic
temperature
(˚C)
A 49.8 48.6 - - 33.7
B 51.3 50.3 - - 32.1
C 50.6 50.0 35.0 34.1 31.7
D 50.3 50.0 34.8 34.2 31.6
E 53.2 52.2 34.1 34.0 31.6
F 52.3 51.3 37.9 32.4 31.4
G 48.8 48.4 30.0 29.8 30.7
H 48.0 46.9 30.9 29.5 30.5
In these cases, forced ventilation process was used to remove more heat to the outside
and consequently heat coming through the metal roof, insulation layer and tubes was
removed through the tubes. With such a combination, the heat accumulation under the
roof was minimized and thus, the attic temperature was reduced more than the other roof
designs.
Integration of Aluminum and PVC tubes as a MAP system has an advantage in
promoting better thermal comfort in the building. As shown in Figure 4.1, there is a
significant reduction of attic temperature up to 4.0 ˚C in Design-E and Design-F due to
good thermal insulation and heat dissipation mechanism. Heat in the tubes was vented to
the surroundings through natural convection. In addition, Aluminum bubble foil also
helps to insulate the attic and prevent heat transfer into the attic. The coolest attic
temperature was obtained in Design-G and Design-H using forced ventilation (air
velocity, Vair = 1 - 1.9 ms-1). These designs have effectively reduced the heat accumulation
in the normal roof system. For the active MAP system, maximum difference between the
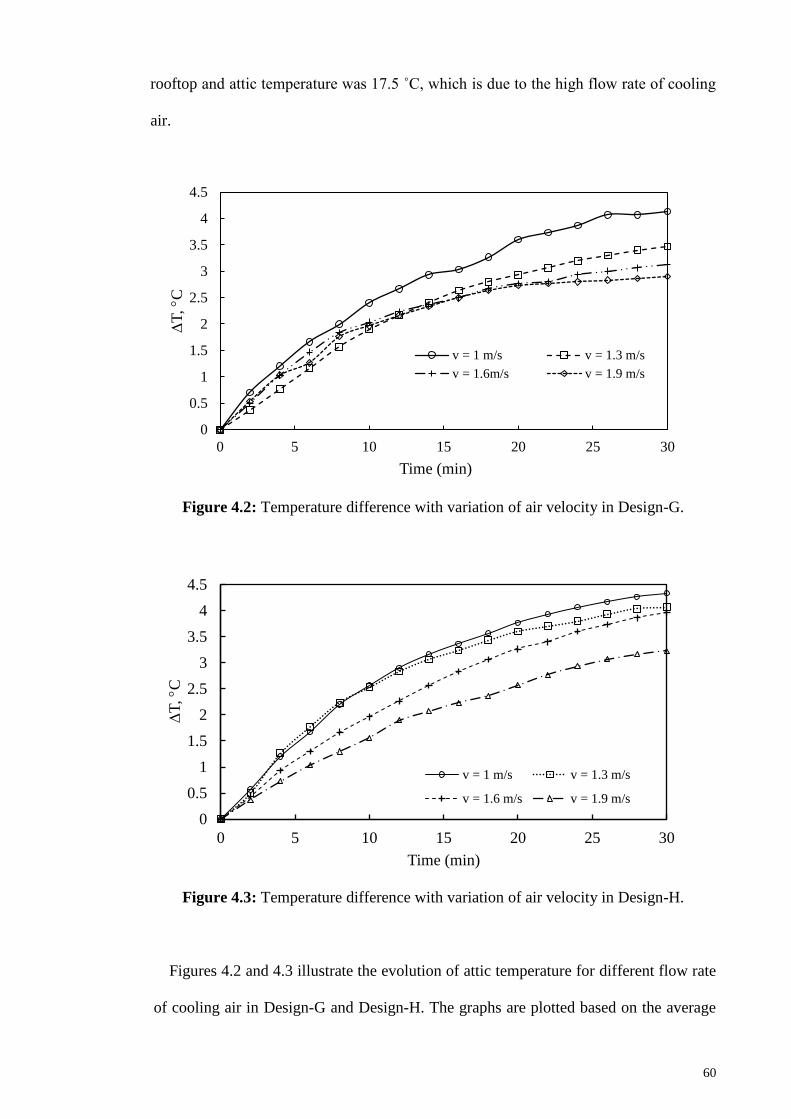
60
rooftop and attic temperature was 17.5 ˚C, which is due to the high flow rate of cooling
air.
Figure 4.2: Temperature difference with variation of air velocity in Design-G.
Figure 4.3: Temperature difference with variation of air velocity in Design-H.
Figures 4.2 and 4.3 illustrate the evolution of attic temperature for different flow rate
of cooling air in Design-G and Design-H. The graphs are plotted based on the average
0
0.5
1
1.5
2
2.5
3
3.5
4
4.5
0 5 10 15 20 25 30
T
, C
Time (min)
v = 1 m/s v = 1.3 m/s
v = 1.6m/s v = 1.9 m/s
0
0.5
1
1.5
2
2.5
3
3.5
4
4.5
0 5 10 15 20 25 30
T
, C
Time (min)
v = 1 m/s v = 1.3 m/s
v = 1.6 m/s v = 1.9 m/s
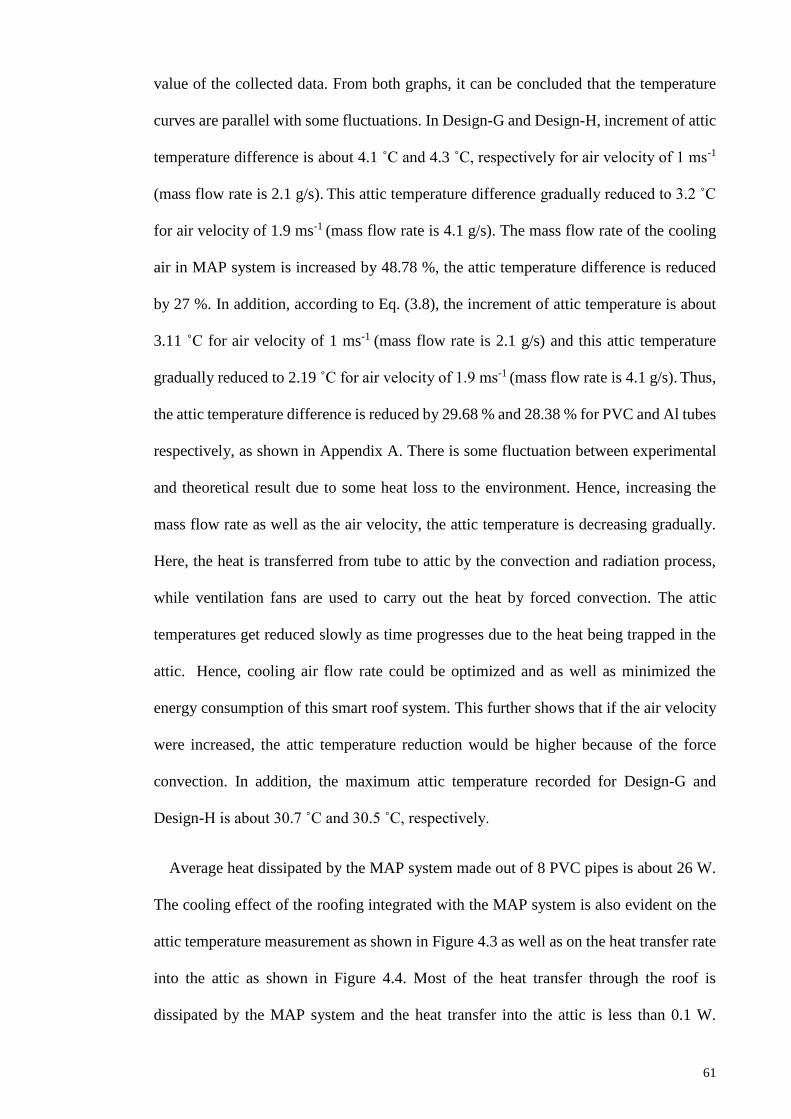
61
value of the collected data. From both graphs, it can be concluded that the temperature
curves are parallel with some fluctuations. In Design-G and Design-H, increment of attic
temperature difference is about 4.1 ˚C and 4.3 ˚C, respectively for air velocity of 1 ms-1
(mass flow rate is 2.1 g/s). This attic temperature difference gradually reduced to 3.2 ˚C
for air velocity of 1.9 ms-1 (mass flow rate is 4.1 g/s). The mass flow rate of the cooling
air in MAP system is increased by 48.78 %, the attic temperature difference is reduced
by 27 %. In addition, according to Eq. (3.8), the increment of attic temperature is about
3.11 ˚C for air velocity of 1 ms-1 (mass flow rate is 2.1 g/s) and this attic temperature
gradually reduced to 2.19 ˚C for air velocity of 1.9 ms-1 (mass flow rate is 4.1 g/s). Thus,
the attic temperature difference is reduced by 29.68 % and 28.38 % for PVC and Al tubes
respectively, as shown in Appendix A. There is some fluctuation between experimental
and theoretical result due to some heat loss to the environment. Hence, increasing the
mass flow rate as well as the air velocity, the attic temperature is decreasing gradually.
Here, the heat is transferred from tube to attic by the convection and radiation process,
while ventilation fans are used to carry out the heat by forced convection. The attic
temperatures get reduced slowly as time progresses due to the heat being trapped in the
attic. Hence, cooling air flow rate could be optimized and as well as minimized the
energy consumption of this smart roof system. This further shows that if the air velocity
were increased, the attic temperature reduction would be higher because of the force
convection. In addition, the maximum attic temperature recorded for Design-G and
Design-H is about 30.7 ˚C and 30.5 ˚C, respectively.
Average heat dissipated by the MAP system made out of 8 PVC pipes is about 26 W.
The cooling effect of the roofing integrated with the MAP system is also evident on the
attic temperature measurement as shown in Figure 4.3 as well as on the heat transfer rate
into the attic as shown in Figure 4.4. Most of the heat transfer through the roof is
dissipated by the MAP system and the heat transfer into the attic is less than 0.1 W.
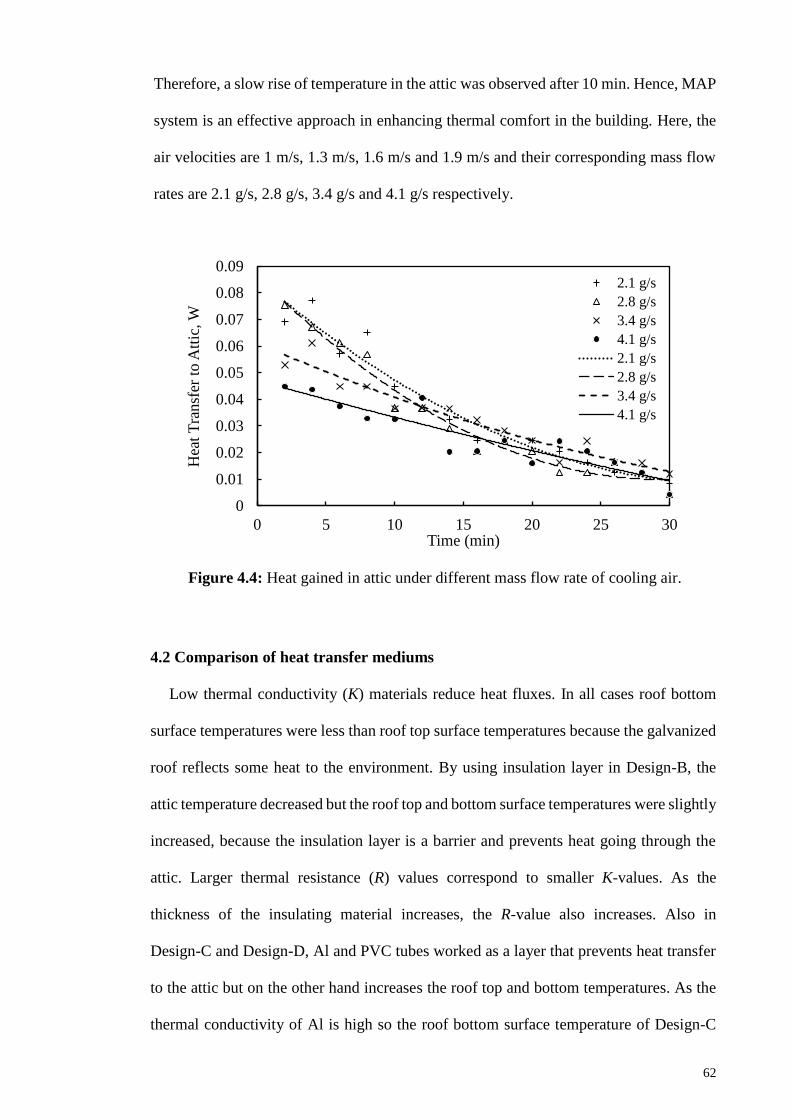
62
Therefore, a slow rise of temperature in the attic was observed after 10 min. Hence, MAP
system is an effective approach in enhancing thermal comfort in the building. Here, the
air velocities are 1 m/s, 1.3 m/s, 1.6 m/s and 1.9 m/s and their corresponding mass flow
rates are 2.1 g/s, 2.8 g/s, 3.4 g/s and 4.1 g/s respectively.
Figure 4.4: Heat gained in attic under different mass flow rate of cooling air.
4.2 Comparison of heat transfer mediums
Low thermal conductivity (K) materials reduce heat fluxes. In all cases roof bottom
surface temperatures were less than roof top surface temperatures because the galvanized
roof reflects some heat to the environment. By using insulation layer in Design-B, the
attic temperature decreased but the roof top and bottom surface temperatures were slightly
increased, because the insulation layer is a barrier and prevents heat going through the
attic. Larger thermal resistance (R) values correspond to smaller K-values. As the
thickness of the insulating material increases, the R-value also increases. Also in
Design-C and Design-D, Al and PVC tubes worked as a layer that prevents heat transfer
to the attic but on the other hand increases the roof top and bottom temperatures. As the
thermal conductivity of Al is high so the roof bottom surface temperature of Design-C
0
0.01
0.02
0.03
0.04
0.05
0.06
0.07
0.08
0.09
0 5 10 15 20 25 30
Hea
t T
ransf
er t
o A
ttic
, W
Time (min)
2.1 g/s
2.8 g/s
3.4 g/s
4.1 g/s
2.1 g/s
2.8 g/s
3.4 g/s
4.1 g/s
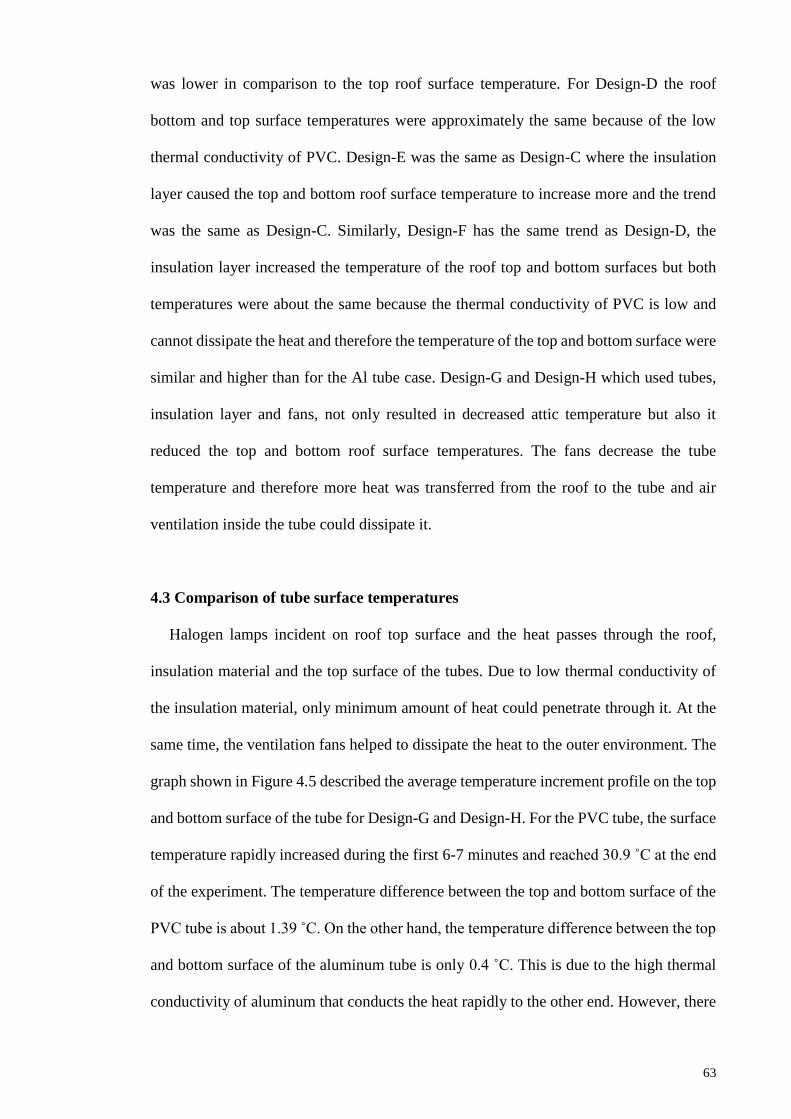
63
was lower in comparison to the top roof surface temperature. For Design-D the roof
bottom and top surface temperatures were approximately the same because of the low
thermal conductivity of PVC. Design-E was the same as Design-C where the insulation
layer caused the top and bottom roof surface temperature to increase more and the trend
was the same as Design-C. Similarly, Design-F has the same trend as Design-D, the
insulation layer increased the temperature of the roof top and bottom surfaces but both
temperatures were about the same because the thermal conductivity of PVC is low and
cannot dissipate the heat and therefore the temperature of the top and bottom surface were
similar and higher than for the Al tube case. Design-G and Design-H which used tubes,
insulation layer and fans, not only resulted in decreased attic temperature but also it
reduced the top and bottom roof surface temperatures. The fans decrease the tube
temperature and therefore more heat was transferred from the roof to the tube and air
ventilation inside the tube could dissipate it.
4.3 Comparison of tube surface temperatures
Halogen lamps incident on roof top surface and the heat passes through the roof,
insulation material and the top surface of the tubes. Due to low thermal conductivity of
the insulation material, only minimum amount of heat could penetrate through it. At the
same time, the ventilation fans helped to dissipate the heat to the outer environment. The
graph shown in Figure 4.5 described the average temperature increment profile on the top
and bottom surface of the tube for Design-G and Design-H. For the PVC tube, the surface
temperature rapidly increased during the first 6-7 minutes and reached 30.9 ˚C at the end
of the experiment. The temperature difference between the top and bottom surface of the
PVC tube is about 1.39 ˚C. On the other hand, the temperature difference between the top
and bottom surface of the aluminum tube is only 0.4 ˚C. This is due to the high thermal
conductivity of aluminum that conducts the heat rapidly to the other end. However, there
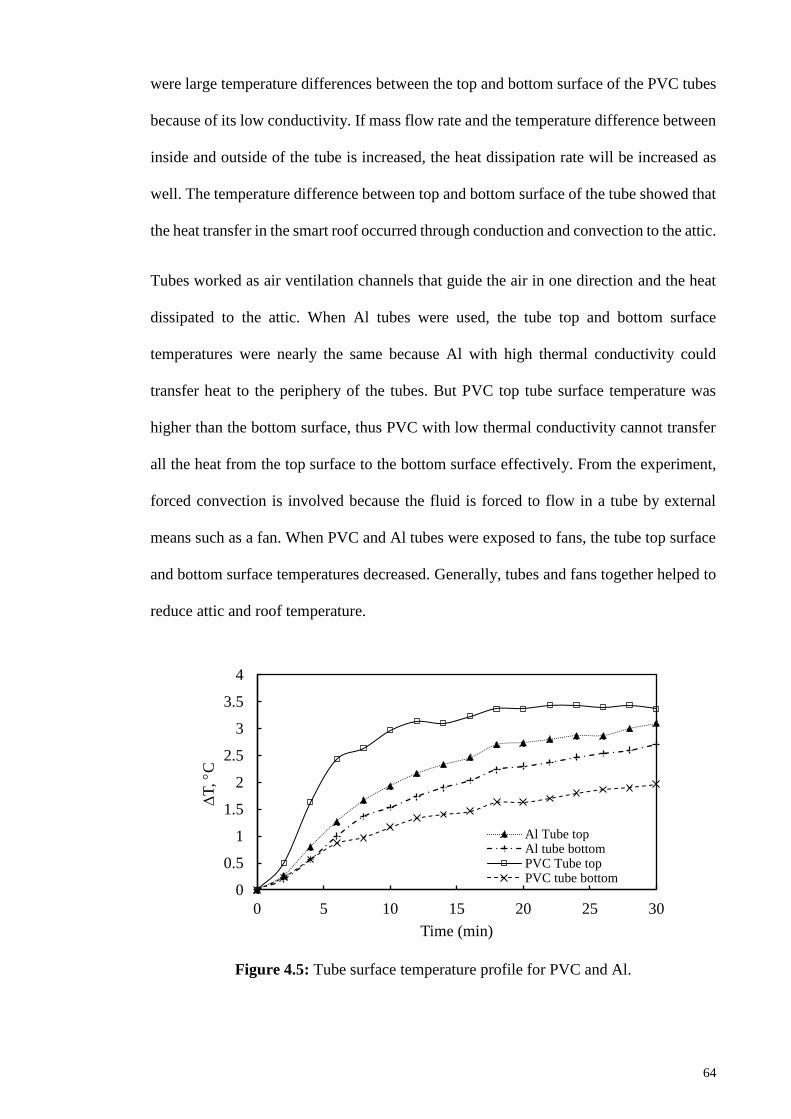
64
were large temperature differences between the top and bottom surface of the PVC tubes
because of its low conductivity. If mass flow rate and the temperature difference between
inside and outside of the tube is increased, the heat dissipation rate will be increased as
well. The temperature difference between top and bottom surface of the tube showed that
the heat transfer in the smart roof occurred through conduction and convection to the attic.
Tubes worked as air ventilation channels that guide the air in one direction and the heat
dissipated to the attic. When Al tubes were used, the tube top and bottom surface
temperatures were nearly the same because Al with high thermal conductivity could
transfer heat to the periphery of the tubes. But PVC top tube surface temperature was
higher than the bottom surface, thus PVC with low thermal conductivity cannot transfer
all the heat from the top surface to the bottom surface effectively. From the experiment,
forced convection is involved because the fluid is forced to flow in a tube by external
means such as a fan. When PVC and Al tubes were exposed to fans, the tube top surface
and bottom surface temperatures decreased. Generally, tubes and fans together helped to
reduce attic and roof temperature.
Figure 4.5: Tube surface temperature profile for PVC and Al.
0
0.5
1
1.5
2
2.5
3
3.5
4
0 5 10 15 20 25 30
T
, C
Time (min)
Al Tube topAl tube bottomPVC Tube topPVC tube bottom
65
4.4 Comparative study of the ventilation fan
Figure 4.6 shows the temperature variation at the bottom part of the tubes for Design-
E and F. Equation (3.6) indicates that convection heat transfer coefficient depends on
flow direction. For natural convection, the bulk fluid (air) motion is caused by buoyancy
effect. There is an assumption of negligible radiation which decreases towards the attic
according to the number of layers beneath the roof. Initially the temperature is around 27-
28 ˚C. For Al, its temperature increases smoothly against time. Heat can move through
the different parts and comes to the bottom part where it releases the heat to the outside
and the attic. But for the PVC material, its temperature increases at 33˚C. The tube bottom
surface temperature is increased only by 0.6 ˚C at the last 12 minutes of the experiment.
This is because there is no fan for air ventilation to remove extra heat to the surrounding
and also the PVC material cannot release much heat.
Figure 4.6: Surface temperature profile at the bottom of the tube for Design-E and
Design-F (without fan).
0
1
2
3
4
5
6
7
0 5 10 15 20 25 30
ΔT
, ◦C
Time (min)
Al tube
PVC tube
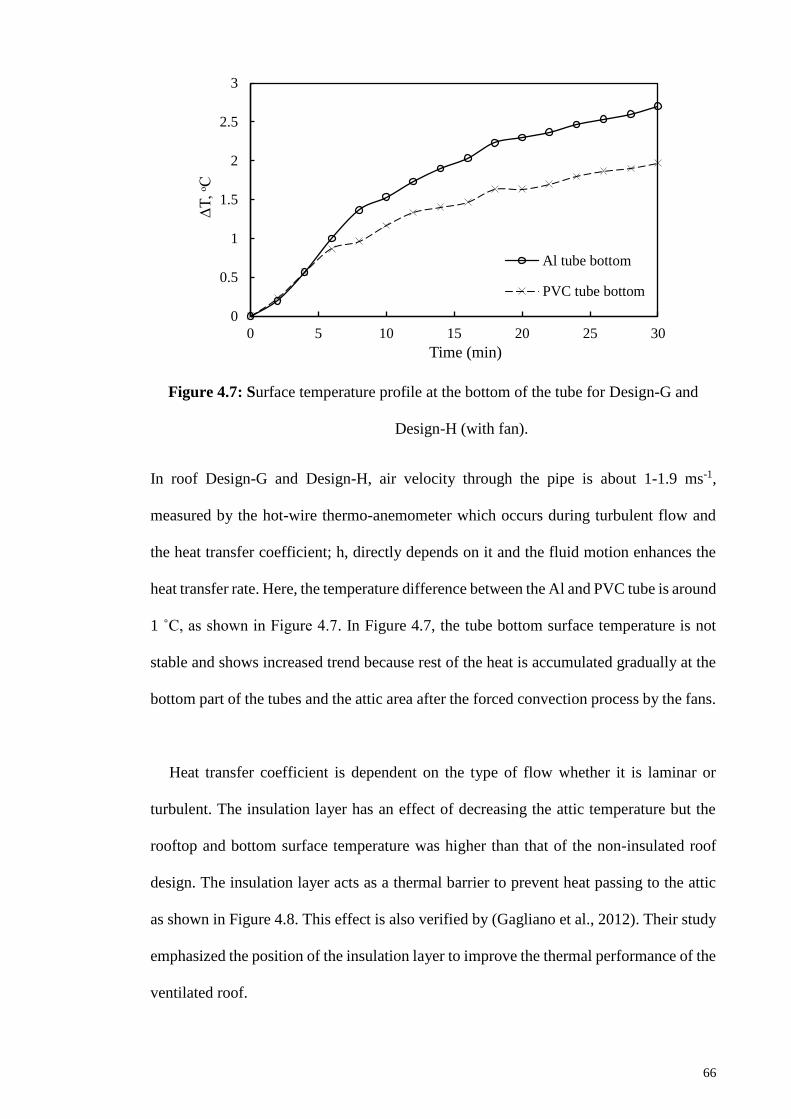
66
Figure 4.7: Surface temperature profile at the bottom of the tube for Design-G and
Design-H (with fan).
In roof Design-G and Design-H, air velocity through the pipe is about 1-1.9 ms-1,
measured by the hot-wire thermo-anemometer which occurs during turbulent flow and
the heat transfer coefficient; h, directly depends on it and the fluid motion enhances the
heat transfer rate. Here, the temperature difference between the Al and PVC tube is around
1 ˚C, as shown in Figure 4.7. In Figure 4.7, the tube bottom surface temperature is not
stable and shows increased trend because rest of the heat is accumulated gradually at the
bottom part of the tubes and the attic area after the forced convection process by the fans.
Heat transfer coefficient is dependent on the type of flow whether it is laminar or
turbulent. The insulation layer has an effect of decreasing the attic temperature but the
rooftop and bottom surface temperature was higher than that of the non-insulated roof
design. The insulation layer acts as a thermal barrier to prevent heat passing to the attic
as shown in Figure 4.8. This effect is also verified by (Gagliano et al., 2012). Their study
emphasized the position of the insulation layer to improve the thermal performance of the
ventilated roof.
0
0.5
1
1.5
2
2.5
3
0 5 10 15 20 25 30
∆T
, ᵒC
Time (min)
Al tube bottom
PVC tube bottom
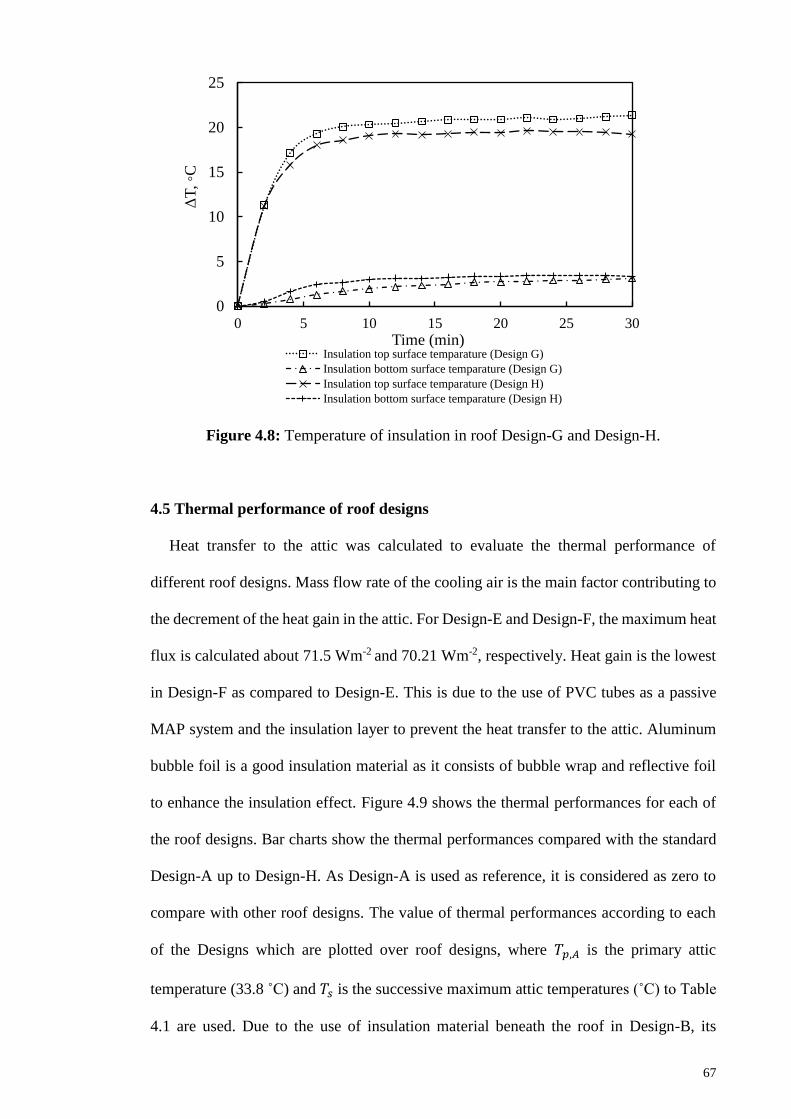
67
Figure 4.8: Temperature of insulation in roof Design-G and Design-H.
4.5 Thermal performance of roof designs
Heat transfer to the attic was calculated to evaluate the thermal performance of
different roof designs. Mass flow rate of the cooling air is the main factor contributing to
the decrement of the heat gain in the attic. For Design-E and Design-F, the maximum heat
flux is calculated about 71.5 Wm-2 and 70.21 Wm-2, respectively. Heat gain is the lowest
in Design-F as compared to Design-E. This is due to the use of PVC tubes as a passive
MAP system and the insulation layer to prevent the heat transfer to the attic. Aluminum
bubble foil is a good insulation material as it consists of bubble wrap and reflective foil
to enhance the insulation effect. Figure 4.9 shows the thermal performances for each of
the roof designs. Bar charts show the thermal performances compared with the standard
Design-A up to Design-H. As Design-A is used as reference, it is considered as zero to
compare with other roof designs. The value of thermal performances according to each
of the Designs which are plotted over roof designs, where 𝑇𝑝,𝐴 is the primary attic
temperature (33.8 ˚C) and 𝑇𝑠 is the successive maximum attic temperatures (˚C) to Table
4.1 are used. Due to the use of insulation material beneath the roof in Design-B, its
0
5
10
15
20
25
0 5 10 15 20 25 30
ΔT
, ◦C
Time (min)Insulation top surface temparature (Design G)
Insulation bottom surface temparature (Design G)
Insulation top surface temparature (Design H)
Insulation bottom surface temparature (Design H)
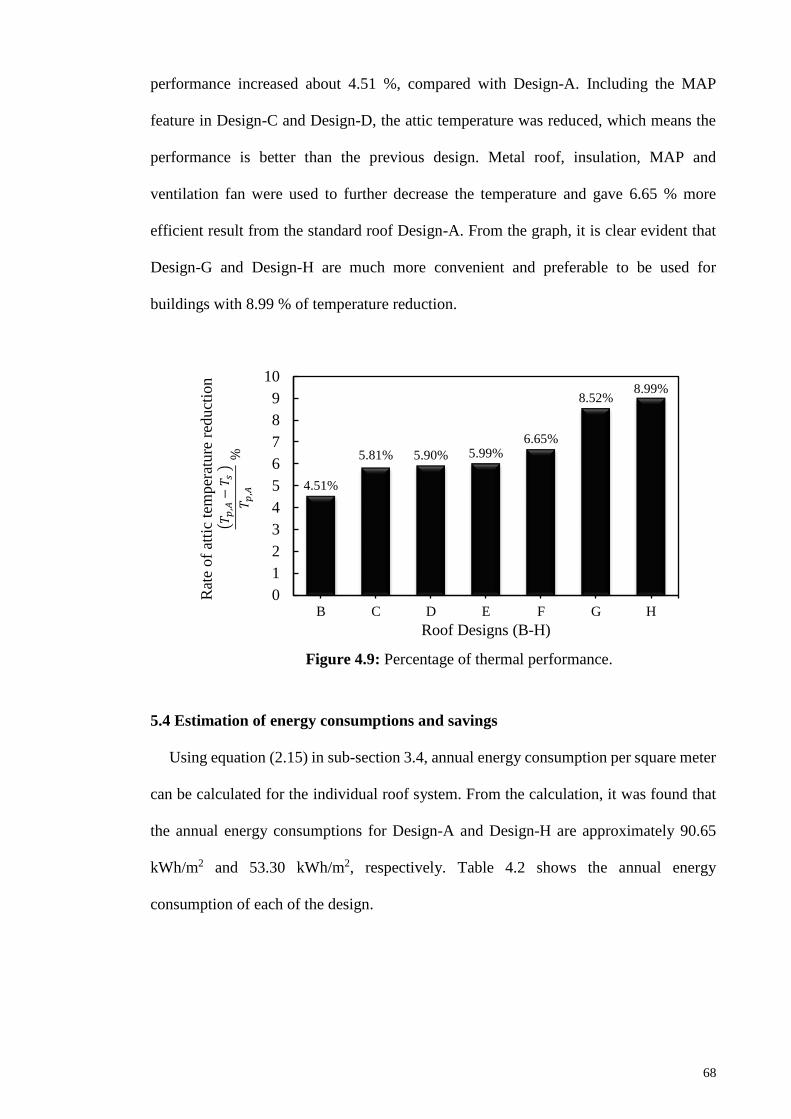
68
performance increased about 4.51 %, compared with Design-A. Including the MAP
feature in Design-C and Design-D, the attic temperature was reduced, which means the
performance is better than the previous design. Metal roof, insulation, MAP and
ventilation fan were used to further decrease the temperature and gave 6.65 % more
efficient result from the standard roof Design-A. From the graph, it is clear evident that
Design-G and Design-H are much more convenient and preferable to be used for
buildings with 8.99 % of temperature reduction.
Figure 4.9: Percentage of thermal performance.
5.4 Estimation of energy consumptions and savings
Using equation (2.15) in sub-section 3.4, annual energy consumption per square meter
can be calculated for the individual roof system. From the calculation, it was found that
the annual energy consumptions for Design-A and Design-H are approximately 90.65
kWh/m2 and 53.30 kWh/m2, respectively. Table 4.2 shows the annual energy
consumption of each of the design.
4.51%
5.81% 5.90% 5.99%6.65%
8.52%8.99%
0
1
2
3
4
5
6
7
8
9
10
B C D E F G H
Roof Designs (B-H)
Rat
e of
atti
cte
mper
ature
red
uct
ion
𝑇 𝑝,𝐴
−𝑇 𝑠
𝑇 𝑝,𝐴
%
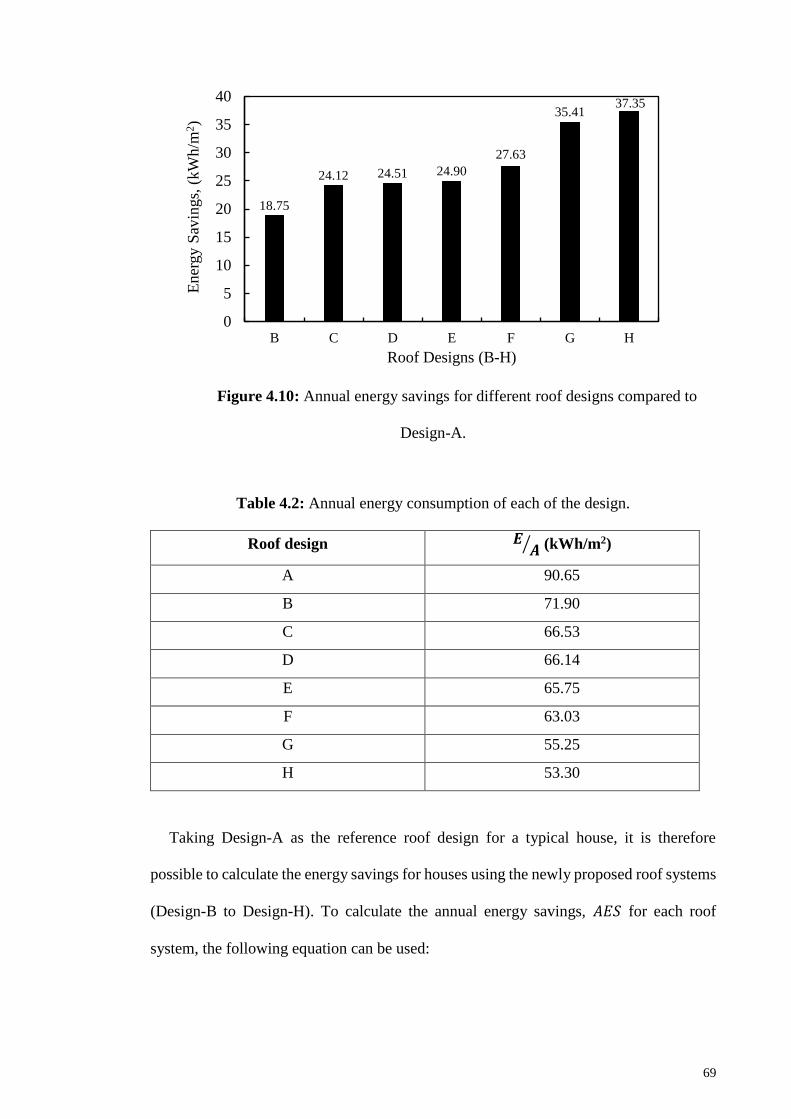
69
Figure 4.10: Annual energy savings for different roof designs compared to
Design-A.
Table 4.2: Annual energy consumption of each of the design.
Roof design 𝑬𝑨⁄ (kWh/m2)
A 90.65
B 71.90
C 66.53
D 66.14
E 65.75
F 63.03
G 55.25
H 53.30
Taking Design-A as the reference roof design for a typical house, it is therefore
possible to calculate the energy savings for houses using the newly proposed roof systems
(Design-B to Design-H). To calculate the annual energy savings, 𝐴𝐸𝑆 for each roof
system, the following equation can be used:
18.75
24.12 24.51 24.90
27.63
35.4137.35
0
5
10
15
20
25
30
35
40
B C D E F G H
Ener
gy S
avin
gs,
(kW
h/m
2)
Roof Designs (B-H)
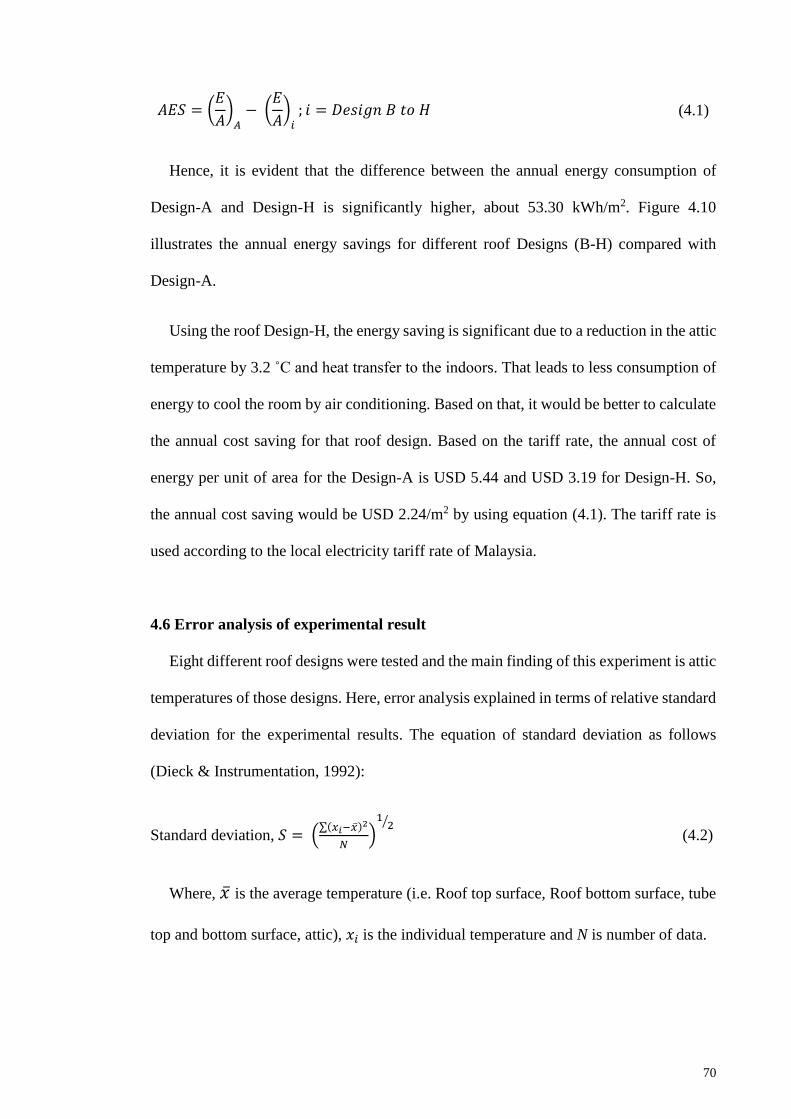
70
𝐴𝐸𝑆 = (𝐸
𝐴)
𝐴− (
𝐸
𝐴)
𝑖; 𝑖 = 𝐷𝑒𝑠𝑖𝑔𝑛 𝐵 𝑡𝑜 𝐻 (4.1)
Hence, it is evident that the difference between the annual energy consumption of
Design-A and Design-H is significantly higher, about 53.30 kWh/m2. Figure 4.10
illustrates the annual energy savings for different roof Designs (B-H) compared with
Design-A.
Using the roof Design-H, the energy saving is significant due to a reduction in the attic
temperature by 3.2 ˚C and heat transfer to the indoors. That leads to less consumption of
energy to cool the room by air conditioning. Based on that, it would be better to calculate
the annual cost saving for that roof design. Based on the tariff rate, the annual cost of
energy per unit of area for the Design-A is USD 5.44 and USD 3.19 for Design-H. So,
the annual cost saving would be USD 2.24/m2 by using equation (4.1). The tariff rate is
used according to the local electricity tariff rate of Malaysia.
4.6 Error analysis of experimental result
Eight different roof designs were tested and the main finding of this experiment is attic
temperatures of those designs. Here, error analysis explained in terms of relative standard
deviation for the experimental results. The equation of standard deviation as follows
(Dieck & Instrumentation, 1992):
Standard deviation, 𝑆 = (∑(𝑥𝑖−�̅�)2
𝑁)
12⁄
(4.2)
Where, �̅� is the average temperature (i.e. Roof top surface, Roof bottom surface, tube
top and bottom surface, attic), 𝑥𝑖 is the individual temperature and N is number of data.
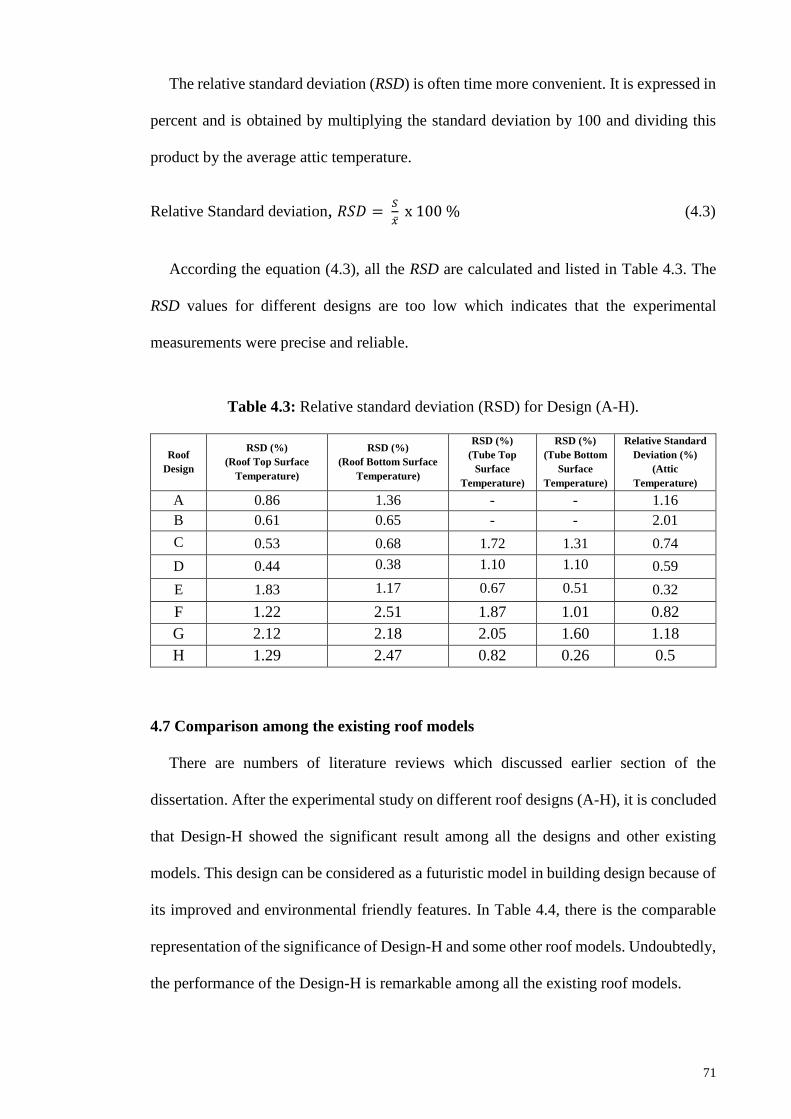
71
The relative standard deviation (RSD) is often time more convenient. It is expressed in
percent and is obtained by multiplying the standard deviation by 100 and dividing this
product by the average attic temperature.
Relative Standard deviation, 𝑅𝑆𝐷 = 𝑆
�̅� x 100 % (4.3)
According the equation (4.3), all the RSD are calculated and listed in Table 4.3. The
RSD values for different designs are too low which indicates that the experimental
measurements were precise and reliable.
Table 4.3: Relative standard deviation (RSD) for Design (A-H).
Roof
Design
RSD (%)
(Roof Top Surface
Temperature)
RSD (%)
(Roof Bottom Surface
Temperature)
RSD (%)
(Tube Top
Surface
Temperature)
RSD (%)
(Tube Bottom
Surface
Temperature)
Relative Standard
Deviation (%)
(Attic
Temperature)
A 0.86 1.36 - - 1.16
B 0.61 0.65 - - 2.01
C 0.53 0.68 1.72 1.31 0.74
D 0.44 0.38 1.10 1.10 0.59
E 1.83 1.17 0.67 0.51 0.32
F 1.22 2.51 1.87 1.01 0.82
G 2.12 2.18 2.05 1.60 1.18
H 1.29 2.47 0.82 0.26 0.5
4.7 Comparison among the existing roof models
There are numbers of literature reviews which discussed earlier section of the
dissertation. After the experimental study on different roof designs (A-H), it is concluded
that Design-H showed the significant result among all the designs and other existing
models. This design can be considered as a futuristic model in building design because of
its improved and environmental friendly features. In Table 4.4, there is the comparable
representation of the significance of Design-H and some other roof models. Undoubtedly,
the performance of the Design-H is remarkable among all the existing roof models.
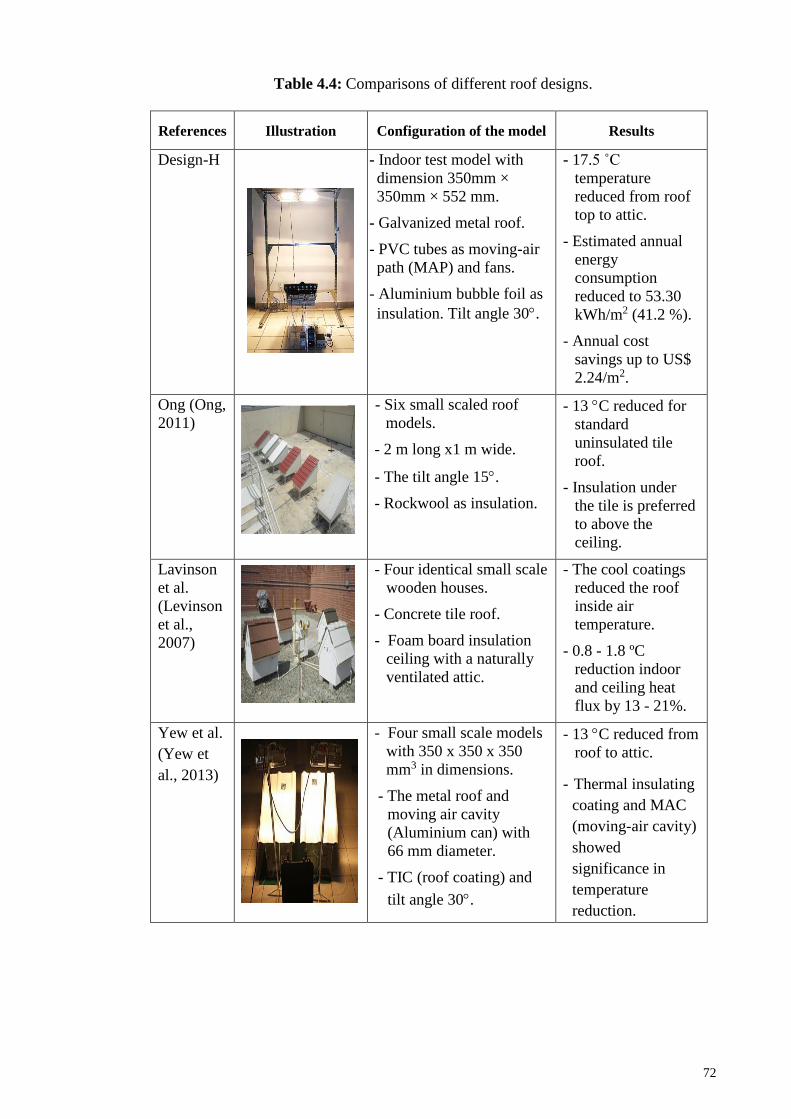
72
Table 4.4: Comparisons of different roof designs.
References Illustration Configuration of the model Results
Design-H
- Indoor test model with
dimension 350mm ×
350mm × 552 mm.
- Galvanized metal roof.
- PVC tubes as moving-air
path (MAP) and fans.
- Aluminium bubble foil as
insulation. Tilt angle 30.
- 17.5 ˚C
temperature
reduced from roof
top to attic.
- Estimated annual
energy
consumption
reduced to 53.30
kWh/m2 (41.2 %).
- Annual cost
savings up to US$
2.24/m2.
Ong (Ong,
2011)
- Six small scaled roof
models.
- 2 m long x1 m wide.
- The tilt angle 15.
- Rockwool as insulation.
- 13 C reduced for
standard
uninsulated tile
roof.
- Insulation under
the tile is preferred
to above the
ceiling.
Lavinson
et al.
(Levinson
et al.,
2007)
- Four identical small scale
wooden houses.
- Concrete tile roof.
- Foam board insulation
ceiling with a naturally
ventilated attic.
- The cool coatings
reduced the roof
inside air
temperature.
- 0.8 - 1.8 ºC
reduction indoor
and ceiling heat
flux by 13 - 21%.
Yew et al.
(Yew et
al., 2013)
- Four small scale models
with 350 x 350 x 350
mm3 in dimensions.
- The metal roof and
moving air cavity
(Aluminium can) with
66 mm diameter.
- TIC (roof coating) and
tilt angle 30.
- 13 C reduced from
roof to attic.
- Thermal insulating
coating and MAC
(moving-air cavity)
showed
significance in
temperature
reduction.
73
Lee et al.
(Lee et al.,
2009)
- The chamber dimensions
with 2m x 1.4m x 0.4m.
- Roof slope range 0-90
by hydraulic control.
- Urethane foam for
insulation.
- 11 C reduction in
cavity surface by
using ventilated
cavity.
- The steeper the
slope of the roof,
the lower the
cavity temperature,
when other
parameters are the
same.
4.8 Computational results from ANFIS prediction model
Table 4.3 and Table 4.4 show the details of the input and output parameters used for
the study. Table 4.3 shows the input parameters selected for the numerical analysis. The
parameters are mass flow rate of cooling air, sol-air temperature, inlet air temperature,
outlet air temperature and ambient temperature. The maximum and minimum value of
each parameter was considered that could potentially influence the change of the attic
temperature. The maximum and minimum value of the cooling air mass flow rate is
determined by the calculation of different air velocity which varies from 1 to 1.9 ms-1.
Ambient temperature, inlet and outlet air temperature were recorded. The ambient
temperature showed the maximum and minimum value of 37.3 oC and 27.1 oC,
respectively. Minimum and maximum temperature of sol-air temperature were 45.6 oC
and 55.5 oC respectively. In the case of the inlet and outlet temperature, the minimum
value recorded was similar which is 27.1 oC. The difference between the maximum value
of the inlet and outlet temperature was about 0.7 oC. Table 4.4 delivers the maximum and
minimum value of the attic temperature recorded in the experiments. The maximum and
minimum temperatures of the attic temperature were 31.5 oC and 27.1 oC.
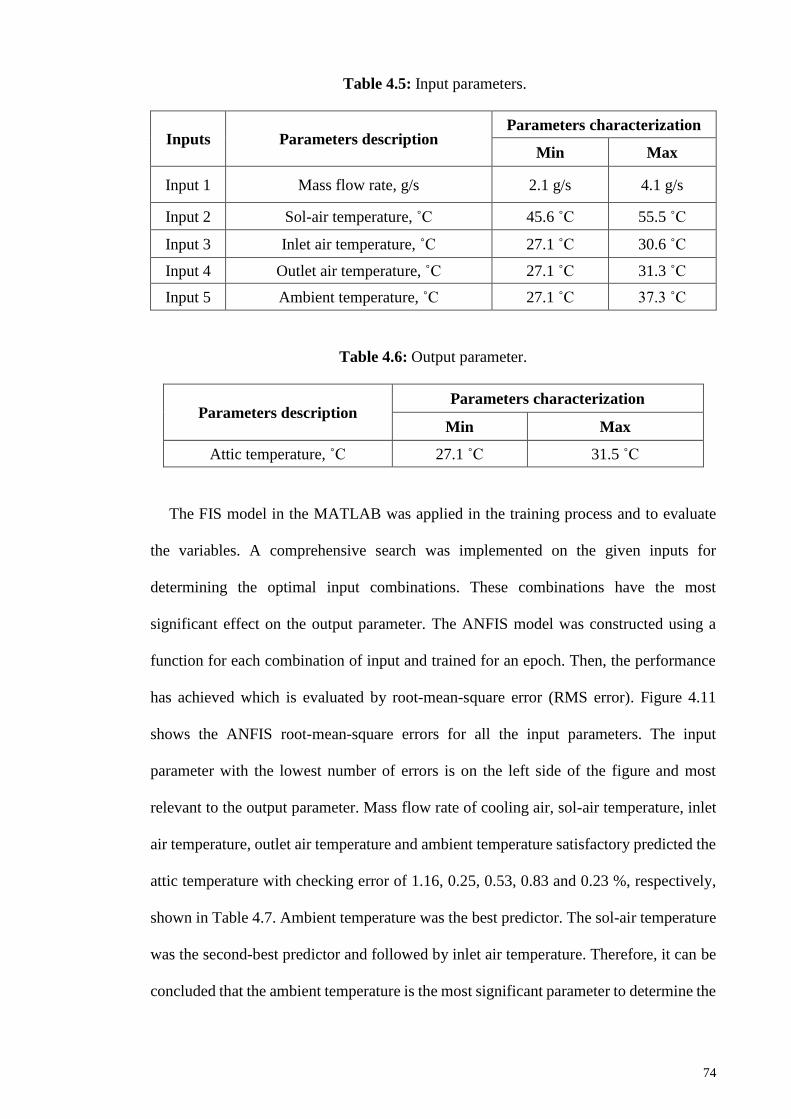
74
Table 4.5: Input parameters.
Inputs Parameters description Parameters characterization
Min Max
Input 1 Mass flow rate, g/s 2.1 g/s 4.1 g/s
Input 2 Sol-air temperature, ˚C 45.6 ˚C 55.5 ˚C
Input 3 Inlet air temperature, ˚C 27.1 ˚C 30.6 ˚C
Input 4 Outlet air temperature, ˚C 27.1 ˚C 31.3 ˚C
Input 5 Ambient temperature, ˚C 27.1 ˚C 37.3 ˚C
Table 4.6: Output parameter.
Parameters description Parameters characterization
Min Max
Attic temperature, ˚C 27.1 ˚C 31.5 ˚C
The FIS model in the MATLAB was applied in the training process and to evaluate
the variables. A comprehensive search was implemented on the given inputs for
determining the optimal input combinations. These combinations have the most
significant effect on the output parameter. The ANFIS model was constructed using a
function for each combination of input and trained for an epoch. Then, the performance
has achieved which is evaluated by root-mean-square error (RMS error). Figure 4.11
shows the ANFIS root-mean-square errors for all the input parameters. The input
parameter with the lowest number of errors is on the left side of the figure and most
relevant to the output parameter. Mass flow rate of cooling air, sol-air temperature, inlet
air temperature, outlet air temperature and ambient temperature satisfactory predicted the
attic temperature with checking error of 1.16, 0.25, 0.53, 0.83 and 0.23 %, respectively,
shown in Table 4.7. Ambient temperature was the best predictor. The sol-air temperature
was the second-best predictor and followed by inlet air temperature. Therefore, it can be
concluded that the ambient temperature is the most significant parameter to determine the
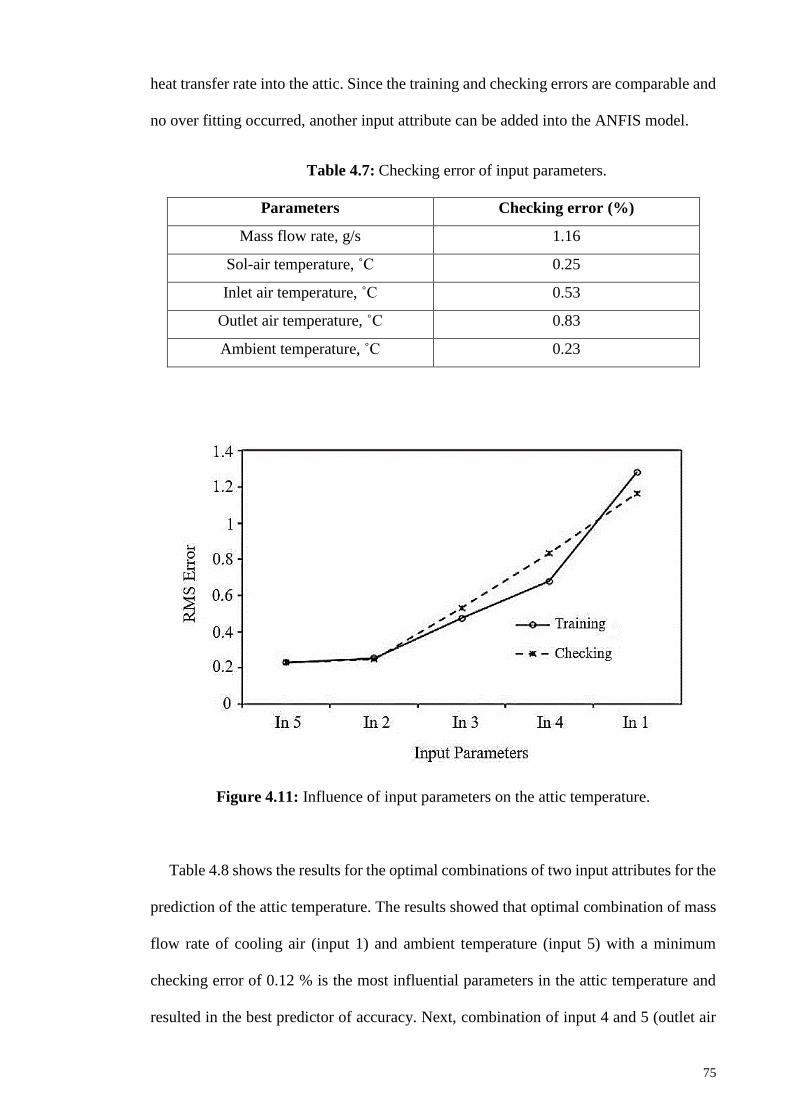
75
heat transfer rate into the attic. Since the training and checking errors are comparable and
no over fitting occurred, another input attribute can be added into the ANFIS model.
Table 4.7: Checking error of input parameters.
Parameters Checking error (%)
Mass flow rate, g/s 1.16
Sol-air temperature, ˚C 0.25
Inlet air temperature, ˚C 0.53
Outlet air temperature, ˚C 0.83
Ambient temperature, ˚C 0.23
Figure 4.11: Influence of input parameters on the attic temperature.
Table 4.8 shows the results for the optimal combinations of two input attributes for the
prediction of the attic temperature. The results showed that optimal combination of mass
flow rate of cooling air (input 1) and ambient temperature (input 5) with a minimum
checking error of 0.12 % is the most influential parameters in the attic temperature and
resulted in the best predictor of accuracy. Next, combination of input 4 and 5 (outlet air
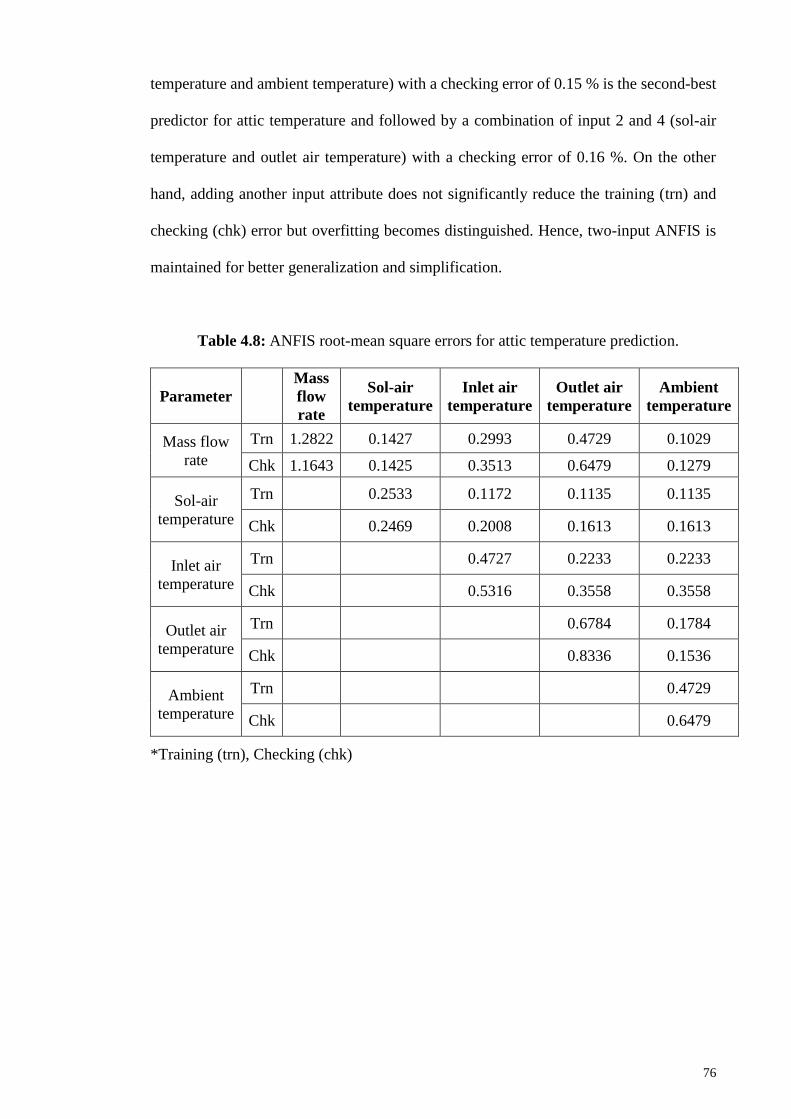
76
temperature and ambient temperature) with a checking error of 0.15 % is the second-best
predictor for attic temperature and followed by a combination of input 2 and 4 (sol-air
temperature and outlet air temperature) with a checking error of 0.16 %. On the other
hand, adding another input attribute does not significantly reduce the training (trn) and
checking (chk) error but overfitting becomes distinguished. Hence, two-input ANFIS is
maintained for better generalization and simplification.
Table 4.8: ANFIS root-mean square errors for attic temperature prediction.
Parameter
Mass
flow
rate
Sol-air
temperature
Inlet air
temperature
Outlet air
temperature
Ambient
temperature
Mass flow
rate
Trn 1.2822 0.1427 0.2993 0.4729 0.1029
Chk 1.1643 0.1425 0.3513 0.6479 0.1279
Sol-air
temperature
Trn 0.2533 0.1172 0.1135 0.1135
Chk 0.2469 0.2008 0.1613 0.1613
Inlet air
temperature
Trn 0.4727 0.2233 0.2233
Chk 0.5316 0.3558 0.3558
Outlet air
temperature
Trn 0.6784 0.1784
Chk 0.8336 0.1536
Ambient
temperature
Trn 0.4729
Chk 0.6479
*Training (trn), Checking (chk)
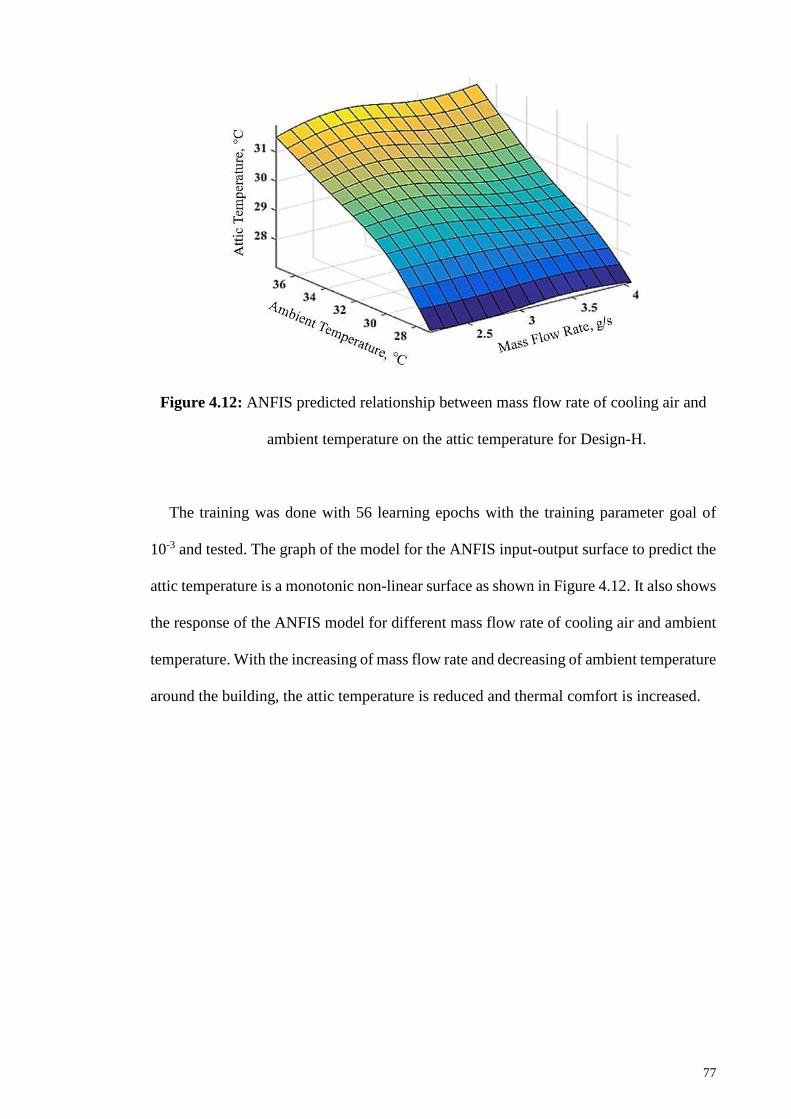
77
Figure 4.12: ANFIS predicted relationship between mass flow rate of cooling air and
ambient temperature on the attic temperature for Design-H.
The training was done with 56 learning epochs with the training parameter goal of
10-3 and tested. The graph of the model for the ANFIS input-output surface to predict the
attic temperature is a monotonic non-linear surface as shown in Figure 4.12. It also shows
the response of the ANFIS model for different mass flow rate of cooling air and ambient
temperature. With the increasing of mass flow rate and decreasing of ambient temperature
around the building, the attic temperature is reduced and thermal comfort is increased.
78
CHAPTER 5: CONCLUSION AND RECOMMENDATION
5.1 Conclusion
In this work, eight different types of roof models were tested sequentially. The
objective of this study is to reduce the heat gain in the attic by introducing smart roof
design. In all the models, the inclination angle of the roof was fixed at 30˚. Each of them
was subjected to radiation from four halogen bulb lamps for 30 minutes until they reached
a stable temperature. Eight different types of roof models were proposed and tested
sequentially to evaluate their thermal performance. Some novel points of this study are
highlighted as follows. PVC and Aluminum tubes were used as a MAP and this is the key
feature for the smart roof ventilation system. Among all the roof designs, Design-H with
the active MAP system showed the best thermal performance and reduced the attic
temperature by 3.2 ˚C compared with other designs. The temperature reduction is about
8.99 % as compared to Design-A. Furthermore, the maximum temperature difference
between roof top and attic is about 17.5 ˚C (48 ˚C-30.5 ˚C) for Design-H. This design
achieved the highest temperature reduction than any other roof models in recent years.
Annual energy consumption for Design-H is about 53.30 kWh/m2, while annual energy
consumption for Design-A is about 90.65 kWh/m2. So, the estimation of annual energy
consumption is reduced by 41.2 %. In addition, the annual cost of energy savings per unit
area is increased to US$ 2.24/m2 by incorporating Design-H into a conventional roof
design. So, this holistic green roof can reduce the energy consumption of air-conditioning
system. Therefore, the green roof design is a simple way to save costs in electricity bills.
Furthermore, a systematic approach-ANFIS was implemented on the best experimental
results achieved by the roof Design-H, to determine the most dominant input parameters
that affect the attic temperature. This process has various ways for discovering a subset
of the total set of recorded parameters and it shows better predictive capabilities. The
79
ANFIS method in the MATLAB was used for variable search and determined how five
parameters (mass flow rate, sol-air temperature, inlet temperature, outlet air temperature
and ambient temperature) affect the heat gain in the attic space. The results indicated that
the combination of mass flow rate and the ambient temperature is the most influential on
the attic temperature and the best predictor of accuracy. Hence, the overall results have
proven that an active MAP system of the green roof could enhance the level of thermal
comfort in a building. Therefore, reduction in attic temperatures by integrating an
insulation layer and moving air path makes the room environment more comfortable.
Moreover, this roof design is eco-friendly comparing with existing conventional roof
design. Meanwhile, it promises a cleaner environment and also promotes the
implementations of green technology in future architectural design. The overall design of
green roof system is aligned with the aim for sustainable energy to reduce the dependence
on dwindling fossil fuels.
5.2 Recommendation for future work
In this study, the experiment was conducted for eight different roof designs (A-H) with
Aluminum and PVC pipes as moving-air path in the lab, using halogen lamps to simulate
the solar radiation. The zinc galvanized roof was oriented with an angle of 30 from
horizontal. The following works can be done in the future concerning this research study:
• Outdoor experiments can be conducted under the sun under different conditions.
• Different roof angles can be used to find the most suitable design for tropical
climates.
• Roof color is another vital aspect for the reflection of incident light and reducing
the entrance of heat. Therefore, different roof colors can be considered to get the
suitable one which can contribute to thermal comfort indoors.
80
• Indoor air quality (IAQ) is another important issue for indoor thermal comfort
which can be checked both through indoor and outdoor experiments. This approach
will indicate the acceptability of the building design which can allow a sufficient
amount of air flow and to keep the indoor environment fresh and clean. In this case,
it is recommended to follow standard test procedures and precise measurement of
every influential parameter to get a significant result for the IAQ.
• CFD simulation can be useful and further study on integrated optimization in terms
of critical flow parameters and roof structure would be more meaningful.
81
BIBLIOGRAPHY
Akcayol, M. A. (2004). Application of adaptive neuro-fuzzy controller for SRM.
Advances in Engineering Software, 35(3), 129-137.
Al-Ghandoor, A., & Samhouri, M. (2009). Electricity consumption in the industrial sector
of Jordan: application of multivariate linear regression and adaptive neuro-fuzzy
techniques. JJMIE, 3(1).
Al-Homoud, M. S. (2005). Performance characteristics and practical applications of
common building thermal insulation materials. Building and environment, 40(3),
353-366.
Al-Obaidi, K. M., Ismail, M., & Rahman, A. M. A. (2014). A review of the potential of
attic ventilation by passive and active turbine ventilators in tropical Malaysia.
Sustainable Cities and Society, 10, 232-240.
Aldair, A. A., & Wang, W. J. (2011). Design an intelligent controller for full vehicle
nonlinear active suspension systems. International journal on smart sensing and
intelligent systems, 4(2), 224-243.
Ali Akcayol, M. (2004). Application of adaptive neuro-fuzzy controller for SRM.
Advances in Engineering Software, 35(3–4), 129-137. doi:
http://dx.doi.org/10.1016/j.advengsoft.2004.03.005
Andersson, F. O., Åberg, M., & Jacobsson, S. P. (2000). Algorithmic approaches for
studies of variable influence, contribution and selection in neural networks.
Chemometrics and Intelligent Laboratory Systems, 51(1), 61-72.
Areed, F. G., Haikal, A. Y., & Mohammed, R. H. (2010). Adaptive neuro-fuzzy control
of an induction motor. Ain Shams Engineering Journal, 1(1), 71-78.
ASHRAE (American Society of Heating, R. a. A. C. E. (2007). Ventilation for Acceptable
Indoor Air Quality. Atlanta GA: American Society of Heating, Refrigerating and
Air Conditioning Engineers
Awbi, H. B. (2003). Ventilation of buildings: Taylor & Francis.
Aziz, M. B. A., Zain, Z. M., Baki, S. R. M. S., & Hadi, R. A. (2012, 16-17 July 2012).
Air-conditioning energy consumption of an education building and it's building
energy index: A case study in engineering complex, UiTM Shah Alam, Selangor.
Paper presented at the Control and System Graduate Research Colloquium
(ICSGRC), 2012 IEEE.
Beal, D., & Chandra, S. (1995). The measured summer performance of tile roof systems
and attic ventilation strategies in hot humid climates. Paper presented at the
Thermal Performance of the Exterior Envelopes of Buildings VI.
Bennaji, N., Mellouki, I., & Yacoubi, N. (2010). Thermal properties of metals alloy by
electrical pyroelectric method (EPE). Paper presented at the Journal of Physics:
Conference Series.
82
Bretz, S., Akbari, H., & Rosenfeld, A. (1998). Practical issues for using solar-reflective
materials to mitigate urban heat islands. Atmospheric environment, 32(1), 95-101.
BulletProducts, L. (2013). The bullet gooseneck vent, December 2015, from
http://www.bulletproducts.com/products/bullet-vent/
Carter, T. (2016). Attic Fan Retrieved January 2016, from
http://www.askthebuilder.com/attic-fan/
Castellano, G., & Fanelli, A. M. (2000). Variable selection using neural-network models.
Neurocomputing, 31(1), 1-13.
Chan, K. Y., Ling, S.-H., Dillon, T. S., & Nguyen, H. T. (2011). Diagnosis of
hypoglycemic episodes using a neural network based rule discovery system.
Expert Systems with Applications, 38(8), 9799-9808.
Chen, S.-Y., & Huang, J.-T. (2012). A smart green building: An environmental health
control design. Energies, 5(5), 1648-1663.
Chong, W.T., Fazlizan, A., Poh, S.C., Pan, K., & Ping, H. (2012). Early development of
an innovative building integrated wind, solar and rain water harvester for urban
high rise application. Energy and Buildings, 47, 201-207.
Chong, W.T., Gwani, M., Shamshirband, S., Muzammil, W., Tan, C., Fazlizan, A., Wong,
K. (2016). Application of adaptive neuro-fuzzy methodology for performance
investigation of a power-augmented vertical axis wind turbine. Energy, 102, 630-
636.
Chong, W.T, Poh, S.C., Fazlizan, A., Yip, S., Chang, C., & Hew, W. (2013). Early
development of an energy recovery wind turbine generator for exhaust air system.
Applied Energy, 112, 568-575.
Chong, W.T, Tiah, C.C, Poh, S.C, & Mahlia, T. (2011). Development of a multi-layer
green roof for integration with an evacuated glass solar water heater. Paper
presented at the Proceedings World Renewable Energy Congress, Indonesia.
Chong, W. T., Zainon, M., Poh, S. C., Kui, S. C., Keong, W. S., Chen, P. K., Sheriff, J.
(2010). Innovative power-augmentation-guide-vane design of wind-solar hybrid
renewable energy harvester for urban high rise application. Paper presented at
the AIP Conference Proceedings.
Ciampi, M., Leccese, F., & Tuoni, G. (2005). Energy analysis of ventilated and
microventilated roofs. Solar Energy, 79(2), 183-192.
Cibas, T., Soulié, F. F., Gallinari, P., & Raudys, S. (1996). Variable selection with neural
networks. Neurocomputing, 12(2), 223-248.
Cohen, P. R., & Feigenbaum, E. A. (2014). The handbook of artificial intelligence (Vol.
3): Butterworth-Heinemann.
De Waal, H. (1993). New recommendations for building in tropical climates. Building
and environment, 28(3), 271-285.
83
Dieck, R. H., & Instrumentation, S. (1992). Measurement uncertainty: methods and
applications: Instrument Society of America Research Triangle Park, NC.
Dieterle, F., Busche, S., & Gauglitz, G. (2003). Growing neural networks for a
multivariate calibration and variable selection of time-resolved measurements.
Analytica chimica acta, 490(1), 71-83.
Dimitroulopoulou, C. (2012). Ventilation in European dwellings: A review. Building and
environment, 47, 109-125.
Dimoudi, A., Androutsopoulos, A., & Lykoudis, S. (2006). Summer performance of a
ventilated roof component. Energy and Buildings, 38(6), 610-617.
Domínguez, S., Sendra, J. J., León, A. L., & Esquivias, P. M. (2012). Towards energy
demand reduction in social housing buildings: envelope system optimization
strategies. Energies, 5(7), 2263-2287.
Ekici, B. B., & Aksoy, U. T. (2009). Prediction of building energy consumption by using
artificial neural networks. Advances in Engineering Software, 40(5), 356-362.
EN ISO 6946. (1996). Building components and building elements-Thermal resistance
and tharmal transmitance-Calculation method. Milano, Italy.
Engvall, K., Wickman, P., & Norbäck, D. (2005). Sick building syndrome and perceived
indoor environment in relation to energy saving by reduced ventilation flow
during heating season: a 1 year intervention study in dwellings. Indoor Air, 15(2),
120-126.
Incropera F. P., Dewitt D. P. (2006). Fundamentals of Heat and Mass Transfer (6th ed.):
John Wiley & Sons.
Fairey, P., & Swami, M. (1988). Analysis of attic radiant barrier systems using
mathematical models. Paper presented at the Proc. Fifth Annual Symp. Improving
Building Energy Efficiency in Hot and Humid Climates, Texas A&M University,
Atlanta, GA.
Gagliano, A., Patania, F., Nocera, F., Ferlito, A., & Galesi, A. (2012). Thermal
performance of ventilated roofs during summer period. Energy and Buildings, 49,
611-618.
Grigorie, T., & Botez, R. (2009). Adaptive neuro-fuzzy inference system-based
controllers for smart material actuator modelling. Proceedings of the Institution
of Mechanical Engineers, Part G: Journal of Aerospace Engineering, 223(6),
655-668.
Hameed, N. (2009). World Energy Scenarios to 2050 Issues and Options. Metropolitan
State University, Minneapolis, MN.
Health, D. O. S. A. (2010). Code of Practice on Indoor Air Quality. (983-2014-51-4,
JKKP: GP (1) 05/2005). from Ministry of Human Resources Malaysia
Hirunlabh, J., Wachirapuwadon, S., Pratinthong, N., & Khedari, J. (2001). New
configurations of a roof solar collector maximizing natural ventilation. Building
and environment, 36(3), 383-391.
84
Holman, J. P. (1997). Heat Transfer (5th ed.). New york, USa: Mc-Graw Hill.
Höppe, P. (2002). Different aspects of assessing indoor and outdoor thermal comfort.
Energy and Buildings, 34(6), 661-665. doi: http://dx.doi.org/10.1016/S0378-
7788(02)00017-8
Hosoz, M., Ertunc, H. M., & Bulgurcu, H. (2011). An adaptive neuro-fuzzy inference
system model for predicting the performance of a refrigeration system with a
cooling tower. Expert Systems with Applications, 38(11), 14148-14155.
Hussain, S., & Oosthuizen, P. H. (2012). Numerical study of buoyancy-driven natural
ventilation in a simple three-storey atrium building. International Journal of
Sustainable Built Environment, 1(2), 141-157.
Isa, M. H. M., Zhao, X., & Yoshino, H. (2010). Preliminary study of passive cooling
strategy using a combination of PCM and copper foam to increase thermal heat
storage in building facade. Sustainability, 2(8), 2365-2381.
Jang, J.-S. R. (1993). ANFIS: adaptive-network-based fuzzy inference system. Systems,
Man and Cybernetics, IEEE Transactions on, 23(3), 665-685.
Jayasinghe, M., Attalage, R., & Jayawardena, A. (2003). Roof orientation, roofing
materials and roof surface colour: their influence on indoor thermal comfort in
warm humid climates. Energy for Sustainable Development, 7(1), 16-27.
Patterson J. E., & Miers R. J. (2016). The thermal conductivity of common tubing
materials applied in a solar water heater collector.
Vijaykumar K.C.K., Srinivasan P.S.S., Dhandapani S. (2007). A performance of hollow
tiles clay (HTC) laid reinforced cement concrete (RCC) roof for tropical summer
climates. Energy and Buildings, 39, 886-892.
Khajeh, A., Modarress, H., & Rezaee, B. (2009). Application of adaptive neuro-fuzzy
inference system for solubility prediction of carbon dioxide in polymers. Expert
Systems with Applications, 36(3), 5728-5732.
Khedari, J., Hirunlabh, J., & Bunnag, T. (1996). Expertmental study of a Roof Solar
Collector towards the natural ventilation of new habitations. Renewable energy,
8(1), 335-338.
Kubota, T. (2006). Usage of air-conditioners and windows in residential areas in Johor
Bahru city: planning methods of coastal residential areas in consideration of wind
flow. Paper presented at the The 7th International Seminar on Sustainable
Environment & Architecture.
Kubota, T., & Ahmad, S. (2005). Energy efficient city in Malaysia: wind flow in
neighborhood areas. Paper presented at the Proceedings of 6 th International
Seminar on Sustainable Environment and Architecture (SENVER), Institut
Teknologi Bangung, Indonesia.
Kumar, A., & Suman, B. (2013). Experimental evaluation of insulation materials for walls
and roofs and their impact on indoor thermal comfort under composite climate.
Building and environment, 59, 635-643.
85
Kurnaz, S., Cetin, O., & Kaynak, O. (2010). Adaptive neuro-fuzzy inference system based
autonomous flight control of unmanned air vehicles. Expert Systems with
Applications, 37(2), 1229-1234.
Kwong, C., Wong, T., & Chan, K. Y. (2009). A methodology of generating customer
satisfaction models for new product development using a neuro-fuzzy approach.
Expert Systems with Applications, 36(8), 11262-11270.
Lai, C.-m., Huang, J., & Chiou, J.-S. (2008). Optimal spacing for double-skin roofs.
Building and environment, 43(10), 1749-1754.
Lai, C.-M., & Wang, Y.-H. (2011). Energy-saving potential of building envelope designs
in residential houses in Taiwan. Energies, 4(11), 2061-2076.
Lee, S., Park, S. H., Yeo, M. S., & Kim, K. W. (2009). An experimental study on airflow
in the cavity of a ventilated roof. Building and environment, 44(7), 1431-1439.
Levinson, R., Akbari, H., & Reilly, J. C. (2007). Cooler tile-roofed buildings with near-
infrared-reflective non-white coatings. Building and environment, 42(7), 2591-
2605. doi: http://dx.doi.org/10.1016/j.buildenv.2006.06.005
Lstiburek, J. (2002). Relative humidity. Presented at Healthy Indoor Environments
(Austin TX).
Maneewan, S., Hirunlabh, J., Khedari, J., Zeghmati, B., & Teekasap, S. (2005). Heat gain
reduction by means of thermoelectric roof solar collector. Solar Energy, 78(4),
495-503.
Manoj, S. B. A. (2011). Identification and control of nonlinear systems using soft
computing techniques. International Journal of Modeling and Optimization, 1(1),
24.
McQuiston, F. C., & Parker, J. D. (1982). Heating, ventilating, and air conditioning:
analysis and design.
Millette, M. E. (2015). Turbine and roof vents Retrieved December 2015, from
http://www.homeinsulators.com/turbines-and-vents/
Mobil, E. (2016). The Outlook for Energy: A View to 2040 (pp. 1-80).
Mojumder, J. C., Ong, H. C., Chong, W. T., & Shamshirband, S. (2016). Application of
support vector machine for prediction of electrical and thermal performance in
PV/T system. Energy and Buildings, 111, 267-277.
Ong, K. S. (2011). Temperature reduction in attic and ceiling via insulation of several
passive roof designs. Energy Conversion and Management, 52(6), 2405-2411.
Organization, W. H. (1989). Indoor air quality: organic pollutants.
Ozel, M., & Pihtili, K. (2007). Investigation of the most suitable location of insulation
applying on building roof from maximum load levelling point of view. Building
and environment, 42(6), 2360-2368.
86
Parker, D. S. (2005). Literature review of the impact and need for attic ventilation in
Florida homes. Florida Solar Energy Center Report FSEC-CR-1496-05.
Peavy, B. (1979). A model for predicting the thermal performance of ventilated attics.
Summer Attic and Whole-House Ventilation, 548, 119-149.
Petković, D., & Ćojbašić, Ž. (2012). Adaptive neuro-fuzzy estimation of autonomic
nervous system parameters effect on heart rate variability. Neural Computing and
Applications, 21(8), 2065-2070.
Petković, D., Issa, M., Pavlović, N. D., Pavlović, N. T., & Zentner, L. (2012). Adaptive
neuro-fuzzy estimation of conductive silicone rubber mechanical properties.
Expert Systems with Applications, 39(10), 9477-9482.
Petković, D., Issa, M., Pavlović, N. D., Zentner, L., & Ćojbašić, Ž. (2012). Adaptive
neuro fuzzy controller for adaptive compliant robotic gripper. Expert Systems with
Applications, 39(18), 13295-13304.
Proper Attic Ventilation. (2015) Retrieved December 2015, from http://www.renovation-
headquarters.com/attic-ventilation.html
Puangsombut, W., Hirunlabh, J., Khedari, J., Zeghmati, B., & Win, M. (2007).
Enhancement of natural ventilation rate and attic heat gain reduction of roof solar
collector using radiant barrier. Building and environment, 42(6), 2218-2226.
Ravi, S., Sudha, M., & Balakrishnan, P. (2011). Design of intelligent self-tuning GA
ANFIS temperature controller for plastic extrusion system. Modelling and
Simulation in Engineering, 2011, 12.
RidgeVent. (2015). Resuscitating the roof: Providing adequate roof ventilation Retrieved
December 2015, from http://diy.blogoverflow.com/2011/12/resuscitating-the-
roof-providing-adequate-roof-ventilation/
Roy, S. S. (2005). Design of adaptive neuro-fuzzy inference system for predicting surface
roughness in turning operation. Journal of Scientific and Industrial Research,
64(9), 653.
Ruotsalainen, R., Jaakkola, J. J., Rönnberg, R., Majanen, A., & Seppänen, O. (1991).
Symptoms and perceived indoor air quality among occupants of houses and
apartments with different ventilation systems. Indoor Air, 1(4), 428-438.
Saidur, R., Masjuki, H. H., & Jamaluddin, M. Y. (2007). An application of energy and
exergy analysis in residential sector of Malaysia. Energy Policy, 35(2), 1050-
1063. doi: http://dx.doi.org/10.1016/j.enpol.2006.02.006
Santamouris, M. (2005). Energy in the urban built environment: The role of natural
ventilation. Natural ventilation in the urban environment: assessment and design,
1-19.
Scientific, A. 2008. Instruction Manual (Model H240). U.S.A.
87
Shekarchian, M., Moghavvemi, M., Rismanchi, B., Mahlia, T. M. I., & Olofsson, T.
(2012). The cost benefit analysis and potential emission reduction evaluation of
applying wall insulation for buildings in Malaysia. Renewable and Sustainable
Energy Reviews, 16(7), 4708-4718. doi:
http://dx.doi.org/10.1016/j.rser.2012.04.045
Shepard K., & Gromicko N. (2016). Mastering Roof Inspections: Attic Ventilation
Systems, Part 2 Retrieved February 2016, from https://www.nachi.org/attic-
ventilation-systems-part2-26.htm
Simpson, J., & McPherson, E. (1997). The effects of roof albedo modification on cooling
loads of scale model residences in Tucson, Arizona. Energy and Buildings, 25(2),
127-137.
Singh, R., Kainthola, A., & Singh, T. (2012). Estimation of elastic constant of rocks using
an ANFIS approach. Applied Soft Computing, 12(1), 40-45.
Sivakumar, R., & Balu, K. (2010). ANFIS based distillation column control. International
Jurnal of Computer Applications Special issue on Evolutionary Computation, 2,
67-73.
SoffitVent. (2015). Ventilation Retrieved December 2015, from
http://www.thehayesco.com/ventilation.cfm
Sookchaiya, T., Monyakul, V., & Thepa, S. (2010). Assessment of the thermal
environment effects on human comfort and health for the development of novel
air conditioning system in tropical regions. Energy and Buildings, 42(10), 1692-
1702.
Standard, A. (2004). Standard 55-2004. Thermal environmental conditions for human
occupancy.
Suehrcke, H., Peterson, E. L., & Selby, N. (2008). Effect of roof solar reflectance on the
building heat gain in a hot climate. Energy and Buildings, 40(12), 2224-2235. doi:
http://dx.doi.org/10.1016/j.enbuild.2008.06.015
Susanti, L., Homma, H., & Matsumoto, H. (2011). A naturally ventilated cavity roof as
potential benefits for improving thermal environment and cooling load of a factory
building. Energy and Buildings, 43(1), 211-218.
Susanti, L., Homma, H., Matsumoto, H., Suzuki, Y., & Shimizu, M. (2008). A laboratory
experiment on natural ventilation through a roof cavity for reduction of solar heat
gain. Energy and Buildings, 40(12), 2196-2206.
Taha, H., Konopacki, S., & Gabersek, S. (1999). Impacts of large-scale surface
modifications on meteorological conditions and energy use: a 10-region modeling
study. Theoretical and Applied Climatology, 62(3-4), 175-185.
Taha, H., Sailor, D., & Akbari, H. (1992). High-albedo materials for reducing building
cooling energy use: Lawrence Berkeley Lab., CA (United States).
Taylor, P., Mathews, E., Kleingeld, M., & Taljaard, G. (2000). The effect of ceiling
insulation on indoor comfort. Building and environment, 35(4), 339-346.
88
Tenega national berhad, Pricing & Tariff. (2015), from
http://www.tnb.com.my/residential/pricing-and-tariff.html
Thermal conductivity of some common materials and gases. Retrieved September, 2015,
from http://www.engineeringtoolbox.com/thermal-conductivity-d_429.html
Tian, L., & Collins, C. (2005). Adaptive neuro-fuzzy control of a flexible manipulator.
Mechatronics, 15(10), 1305-1320.
Wang, H., & Chen, Q. (2014). Impact of climate change heating and cooling energy use
in buildings in the United States. Energy and Buildings, 82, 428-436.
Wang, S., & Shen, Z. (2012). Impacts of ventilation ratio and vent balance on cooling
load and air flow of naturally ventilated attics. Energies, 5(9), 3218-3232.
Yacouby, A., Khamidi, M. F., Nuruddin, M. F., Farhan, S. A., & Razali, A. E. (2011).
Study on roof tile's colors in Malaysia for development of new anti-warming roof
tiles with higher Solar Reflectance Index (SRI). Paper presented at the National
Postgraduate Conference (NPC), 2011.
Yew, M., Sulong, N. R., Chong, W., Poh, S., Ang, B., & Tan, K. (2013). Integration of
thermal insulation coating and moving-air-cavity in a cool roof system for attic
temperature reduction. Energy Conversion and Management, 75, 241-248.
Yokoyama, R., Wakui, T., & Satake, R. (2009). Prediction of energy demands using
neural network with model identification by global optimization. Energy
Conversion and Management, 50(2), 319-327.
Zain-Ahmed, A., Sopian, K., Abidin, Z., & Othman, M. (2008). Renewable energy,
buildings and the fuel crisis. Paper presented at the Proceedings of International
Conference on Construction and Building Technology.
89
LIST OF PUBLICATIONS
Journal Articles
1. W.T. Chong, A. Al-Mamoon, S.C. Poh, L.H. Saw, S. Shamshirband and J.C. Mojumder,
“Sensitivity analysis of heat transfer rate for smart roof design by adaptive neuro-fuzzy
technique”, Energy and Buildings 2016, vol. 124, pp. 112-119.
Conferences proceedings
1. Chong, W. T., Al-Mamoon, A., & Poh, S. C, “Experimental investigation on the
moving-air path in roof models with thermal performances evaluation”,
International Conference on Green Building Technology and Materials (GBTM),
2013.
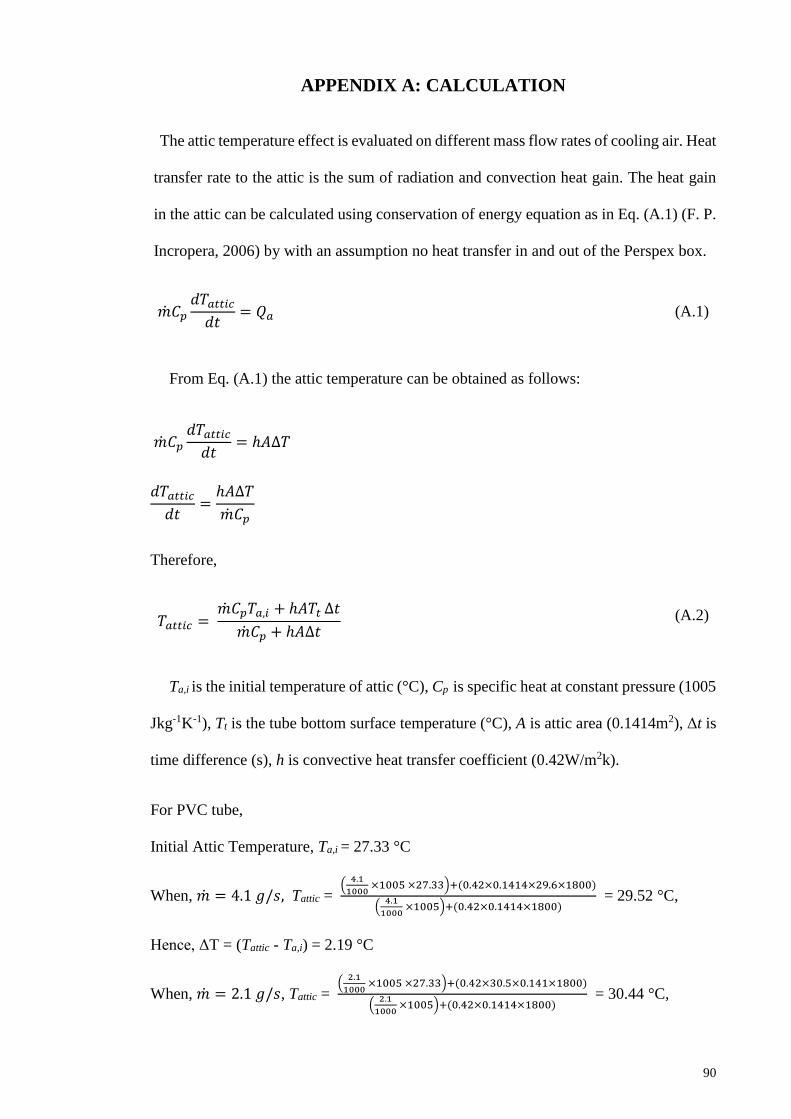
90
APPENDIX A: CALCULATION
The attic temperature effect is evaluated on different mass flow rates of cooling air. Heat
transfer rate to the attic is the sum of radiation and convection heat gain. The heat gain
in the attic can be calculated using conservation of energy equation as in Eq. (A.1) (F. P.
Incropera, 2006) by with an assumption no heat transfer in and out of the Perspex box.
�̇�𝐶𝑝
𝑑𝑇𝑎𝑡𝑡𝑖𝑐
𝑑𝑡= 𝑄𝑎 (A.1)
From Eq. (A.1) the attic temperature can be obtained as follows:
�̇�𝐶𝑝
𝑑𝑇𝑎𝑡𝑡𝑖𝑐
𝑑𝑡= ℎ𝐴∆𝑇
𝑑𝑇𝑎𝑡𝑡𝑖𝑐
𝑑𝑡=
ℎ𝐴∆𝑇
�̇�𝐶𝑝
Therefore,
𝑇𝑎𝑡𝑡𝑖𝑐 = �̇�𝐶𝑝𝑇𝑎,𝑖 + ℎ𝐴𝑇𝑡 ∆𝑡
�̇�𝐶𝑝 + ℎ𝐴∆𝑡 (A.2)
Ta,i is the initial temperature of attic (°C), Cp is specific heat at constant pressure (1005
Jkg-1K-1), Tt is the tube bottom surface temperature (°C), A is attic area (0.1414m2), Δt is
time difference (s), h is convective heat transfer coefficient (0.42W/m2k).
For PVC tube,
Initial Attic Temperature, Ta,i = 27.33 °C
When, �̇� = 4.1 𝑔/𝑠, Tattic = (
4.1
1000 ×1005 ×27.33)+(0.42×0.1414×29.6×1800)
(4.1
1000 ×1005)+(0.42×0.1414×1800)
= 29.52 °C,
Hence, ΔT = (Tattic - Ta,i) = 2.19 °C
When, �̇� = 2.1 𝑔/𝑠, Tattic = (
2.1
1000 ×1005 ×27.33)+(0.42×30.5×0.141×1800)
(2.1
1000 ×1005)+(0.42×0.1414×1800)
= 30.44 °C,
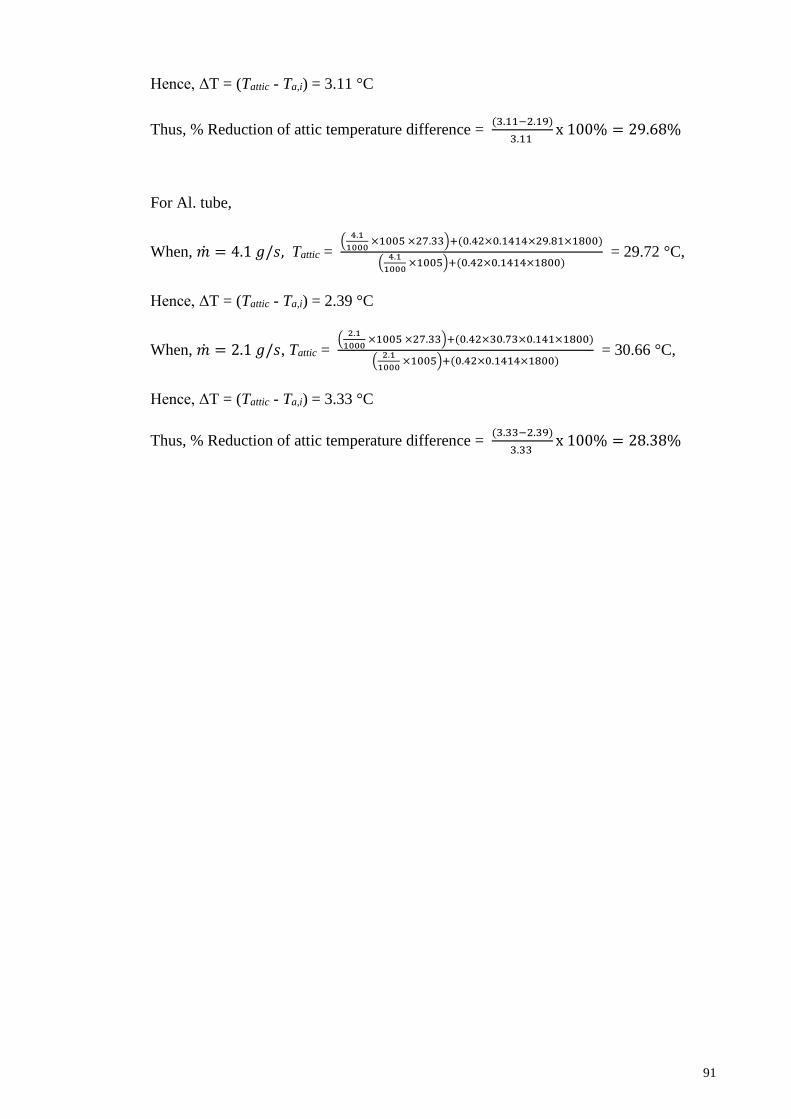
91
Hence, ΔT = (Tattic - Ta,i) = 3.11 °C
Thus, % Reduction of attic temperature difference = (3.11−2.19)
3.11 x 100% = 29.68%
For Al. tube,
When, �̇� = 4.1 𝑔/𝑠, Tattic = (
4.1
1000 ×1005 ×27.33)+(0.42×0.1414×29.81×1800)
(4.1
1000 ×1005)+(0.42×0.1414×1800)
= 29.72 °C,
Hence, ΔT = (Tattic - Ta,i) = 2.39 °C
When, �̇� = 2.1 𝑔/𝑠, Tattic = (
2.1
1000 ×1005 ×27.33)+(0.42×30.73×0.141×1800)
(2.1
1000 ×1005)+(0.42×0.1414×1800)
= 30.66 °C,
Hence, ΔT = (Tattic - Ta,i) = 3.33 °C
Thus, % Reduction of attic temperature difference = (3.33−2.39)
3.33 x 100% = 28.38%