Embed Size (px)
Citation preview
CREG – Nijverheidsstraat 26-38, 1040 Brussel, België T +32 2 289 76 11 – F + 32 2 289 76 09 – [email protected] – www.creg.be
(F)1958 5 September 2019
Study on the functioning and price evolution of the Belgian wholesale electricity market – monitoring report 2018
drawn up pursuant to article 23, § 2, second paragraph, 2° and 19°, of the law of 29 April 1999 on the organisation of the electricity market.
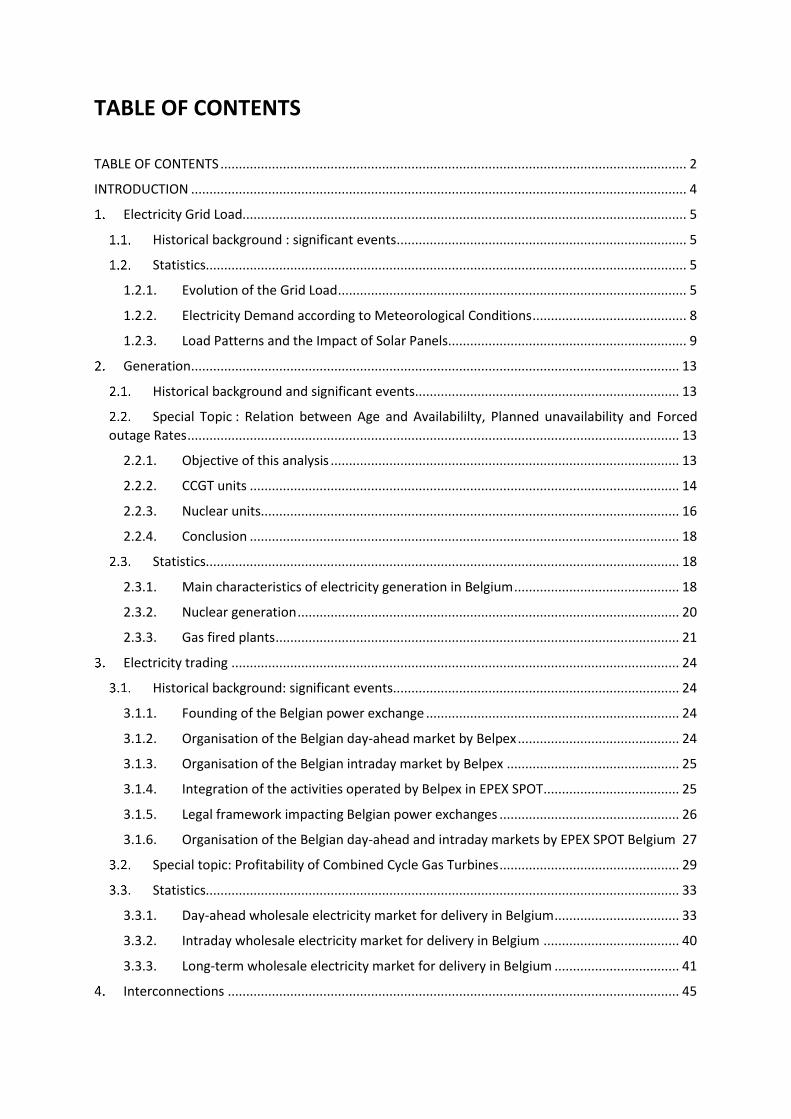
TABLE OF CONTENTS
TABLE OF CONTENTS ............................................................................................................................... 2
INTRODUCTION ....................................................................................................................................... 4
Electricity Grid Load......................................................................................................................... 5
Historical background : significant events ............................................................................... 5
Statistics................................................................................................................................... 5
1.2.1. Evolution of the Grid Load ............................................................................................... 5
1.2.2. Electricity Demand according to Meteorological Conditions .......................................... 8
1.2.3. Load Patterns and the Impact of Solar Panels................................................................. 9
Generation ..................................................................................................................................... 13
Historical background and significant events ........................................................................ 13
Special Topic : Relation between Age and Availabililty, Planned unavailability and Forced
outage Rates ...................................................................................................................................... 13
2.2.1. Objective of this analysis ............................................................................................... 13
2.2.2. CCGT units ..................................................................................................................... 14
2.2.3. Nuclear units.................................................................................................................. 16
2.2.4. Conclusion ..................................................................................................................... 18
Statistics................................................................................................................................. 18
2.3.1. Main characteristics of electricity generation in Belgium ............................................. 18
2.3.2. Nuclear generation ........................................................................................................ 20
2.3.3. Gas fired plants .............................................................................................................. 21
Electricity trading .......................................................................................................................... 24
Historical background: significant events.............................................................................. 24
3.1.1. Founding of the Belgian power exchange ..................................................................... 24
3.1.2. Organisation of the Belgian day-ahead market by Belpex ............................................ 24
3.1.3. Organisation of the Belgian intraday market by Belpex ............................................... 25
3.1.4. Integration of the activities operated by Belpex in EPEX SPOT ..................................... 25
3.1.5. Legal framework impacting Belgian power exchanges ................................................. 26
3.1.6. Organisation of the Belgian day-ahead and intraday markets by EPEX SPOT Belgium 27
Special topic: Profitability of Combined Cycle Gas Turbines ................................................. 29
Statistics................................................................................................................................. 33
3.3.1. Day-ahead wholesale electricity market for delivery in Belgium .................................. 33
3.3.2. Intraday wholesale electricity market for delivery in Belgium ..................................... 40
3.3.3. Long-term wholesale electricity market for delivery in Belgium .................................. 41
Interconnections ........................................................................................................................... 45

3/112
Historical background : significant events ............................................................................. 45
Special topics: Impact of significant events and structural improvements of CWE FBMC in
2018 48
Statistics................................................................................................................................. 53
4.3.1. Long-term transmission capacity auctions .................................................................... 53
4.3.2. Day-ahead cross-zonal exchange .................................................................................. 57
4.3.3. Intraday cross-zonal exchange ...................................................................................... 59
4.3.4. Overview of cross-zonal exchanges............................................................................... 61
4.3.5. Transit flows .................................................................................................................. 62
4.3.6. Loop flows ..................................................................................................................... 64
4.3.7. Physical flows ................................................................................................................ 67
4.3.8. Evaluation of CWE day-ahead Flow Based Market Coupling ........................................ 68
4.3.9. Evaluation of CWE day-ahead market coupling results ................................................ 71
4.3.10. Evaluation of network constraints ................................................................................ 73
4.3.11. Congestion rents............................................................................................................ 81
Balancing ....................................................................................................................................... 82
Historical background: significant events.............................................................................. 82
Special topic: Procurement of balancing capacity ................................................................ 83
Statistics................................................................................................................................. 86
5.3.1. Contracted capacity ....................................................................................................... 86
5.3.2. Activated reserves ......................................................................................................... 88
Security of supply .......................................................................................................................... 92
6.1.1. Introduction ................................................................................................................... 92
6.1.2. Special days ................................................................................................................... 93
6.1.3. Conclusion ..................................................................................................................... 96
Conclusions .................................................................................................................................... 97
ANNEXES ........................................................................................................................................ 99
GLOSSARY .............................................................................................................................. 99
LIST OF ABBREVIATIONS ...................................................................................................... 102
LIST OF FIGURES .................................................................................................................. 106
LIST OF TABLES .................................................................................................................... 111

4/112
INTRODUCTION
In this study, the COMMISSION FOR ELECTRICITY AND GAS REGULATION (CREG) examines the functioning and price evolution of the Belgian wholesale electricity market over the period 1 January to 31 December 2018. The CREG has carried out a similar study every year since 2007.
The aim of these studies is to inform all stakeholders about important aspects of the Belgian electricity market, in particular electricity consumption, generation, electricity trading on electricity exchanges, interconnections with foreign countries, and balancing.
To the extent possible, the historical background of the last 11 years (2007-2017) is provided. 2007 is included in this study since it pre-dates the economic and financial crises of the period studied. As such, the reader will be able to understand the evolution of the wholesale electricity market more easily.
This study includes 6 chapters :
1. the 1st chapter examines electricity consumption;
2. the 2nd chapter specifically focuses on electricity generation;
3. the 3rd chapter covers electricity trading on markets;
4. the 4th chapter analyses the interconnections between Belgium and its neighbouring countries;
5. the 5th chapter covers balancing;
6. the 6th and final chapter covers security of supply with an assessment of the capacity margin at the end of 2018 when nuclear availability was historically low.
Several conclusions will also be made at the end of the study. At the end of the document, the reader will find a glossary, the main abbreviations used in the study, a list of the works quoted, and a list of the figures and tables used throughout the study.
The Executive Committee of the CREG approved the present study at its meeting of 5 September 2019.

5/112
ELECTRICITY GRID LOAD
HISTORICAL BACKGROUND : SIGNIFICANT EVENTS
2008
o eruption of the financial crisis
2012
o February 2012 cold spell in France and Belgium
STATISTICS
1.2.1. Evolution of the Grid Load
At the European level
Figure 1 illustrates the total electricity demand as published by Entso-E from 2011 to 2018 for
Belgium and its neighbouring countries France, the Netherlands, Germany and the United Kingdom.
Total electricity demand for this region amounted to 1492 TWh in 2018; this is more or less constant
in the observed period, with 1459 TWh the lowest and 1495 TWh the highest total demand. Belgium
represents 6% of this total demand. If the UK is excluded, the Belgian share rises to 7.5%.
Figure 1: Evolution of the total electricity demand as published by ENTSO-E (TWh) from 2011 to 2017 for Belgium and its neighbouring countries
Sources: CREG, ENTSO-E1
1 Some definitions and parameters of grid load between countries may differ slightly but the general trend per country is valid.

6/112
At the Belgian level
This section analyses the evolution of the Elia grid load2, based on data provided by the TSO.
Since this grid load does not take into account a significant part of the distributed generation, it is not
equal to the total Belgian electricity consumption. However, this selected approach gives a good idea
of how the wholesale electricity market is evolving.
The Elia grid load3 amounted to 76.7 TWh in 2018, at a level slightly lower than the previous 4
years. Figure 2 shows the total Elia grid load over the last 12 years. Compared to 2007, the Elia grid
load decreased by 12 TWh, or about -13%. The figure also shows the baseload part of the Elia grid load.
This decreased from 56 TWh to 47 TWh, a decrease of about -16%. As such, the baseload part of the
total grid load was more or less constant over the last 11 years, varying around 64%. This is remarkable,
because one would expect that intermittent renewables would not only decrease the grid load, but
also the baseload part of this load. The most obvious explanation for the constant baseload share is
the increase of demand response to lower the peak.
Figure 2: Total Elia Grid load and Baseload Elia Grid load during 2007 to 2018 Sources: Elia, CREG
2 The Elia-grid load is a calculation based on injections of electrical energy into the Elia grid. It incorporates the measured net
generation of the (local) power stations that inject power into the grid at a voltage of at least 30 kV and the balance of imports and exports. Generation facilities that are connected at a voltage of less than 30 kV in the distribution networks are only included if a net injection into the Elia grid is being measured. The energy needed to pump water into the storage tanks of the pump-storage power stations connected to the Elia grid is deducted from the total. Decentralised generation that injects power at a voltage less than 30 kV into the distribution networks is not entirely included in the Elia grid load. The significance of this last segment has steadily increased in recent years. As such, Elia decided to complete its publication with a forecast of the total Belgian electrical load. The Elia grid comprises networks of at least 30 kV in Belgium plus the Sotel/Twinerg grid in the south of Luxembourg. (Source: http://www.elia.be/en/grid-data/Load-and-Load-Forecasts/Elia-grid-load). 3 The variations observed between the estimates of consumption of electricity of Synergrid and Elia are primarily due to the
fact that (most of) the generation connected to the distribution grids and the losses of networks of the DSOs are not taken into account in the statement of electricity forwarding only by the Elia network.
88,6 87,881,6
86,5 83,3 81,7 80,577,2 77,2 77,3 77,4 76,7
56,6 55,551,6
55,0 54,651,2 51,9 51,6 48,4 47,6 49,4 47,0
0
10
20
30
40
50
60
70
80
90
100
2007 2008 2009 2010 2011 2012 2013 2014 2015 2016 2017 2018
Total (TWh) Baseload (TWh)
7/112
The table below gives the detailed data on the total Elia grid load and its baseload part in 2007-
2018. It also shows the average, maximum and minimum load per year for this period. The average
Elia grid load in 2018 was 8,750 MW. The baseload Elia grid load was 5,365 MW, while the maximum
amounted to 12,440 MW in 2018. This maximum Elia grid load was significantly lower than all the
previous years.
2007 2008 2009 2010 2011 2012 2013 2014 2015 2016 2017 2018
Total (TWh) 88,6 87,8 81,6 86,5 83,3 81,7 80,5 77,2 77,2 77,3 77,4 76,7
Max (MW) 14.033 13.431 13.513 13.845 13.201 13.369 13.385 12.736 12.634 12.734 12.867 12.440
Average (MW) 10.116 9.991 9.312 9.875 9.515 9.303 9.193 8.808 8.811 8.799 8.837 8.750
Min (MW) 6.462 6.330 5.895 6.278 6.232 5.845 5.922 5.889 5.529 5.438 5.638 5.365
Baseload (TWh) 56,6 55,5 51,6 55,0 54,6 51,2 51,9 51,6 48,4 47,6 49,4 47,0
%baseload 64% 63% 63% 64% 66% 63% 64% 67% 63% 62% 64% 61%
Table 1: Elia grid load (TWh) and power demand (MW) between 2007 and 2018 Sources: Elia, CREG
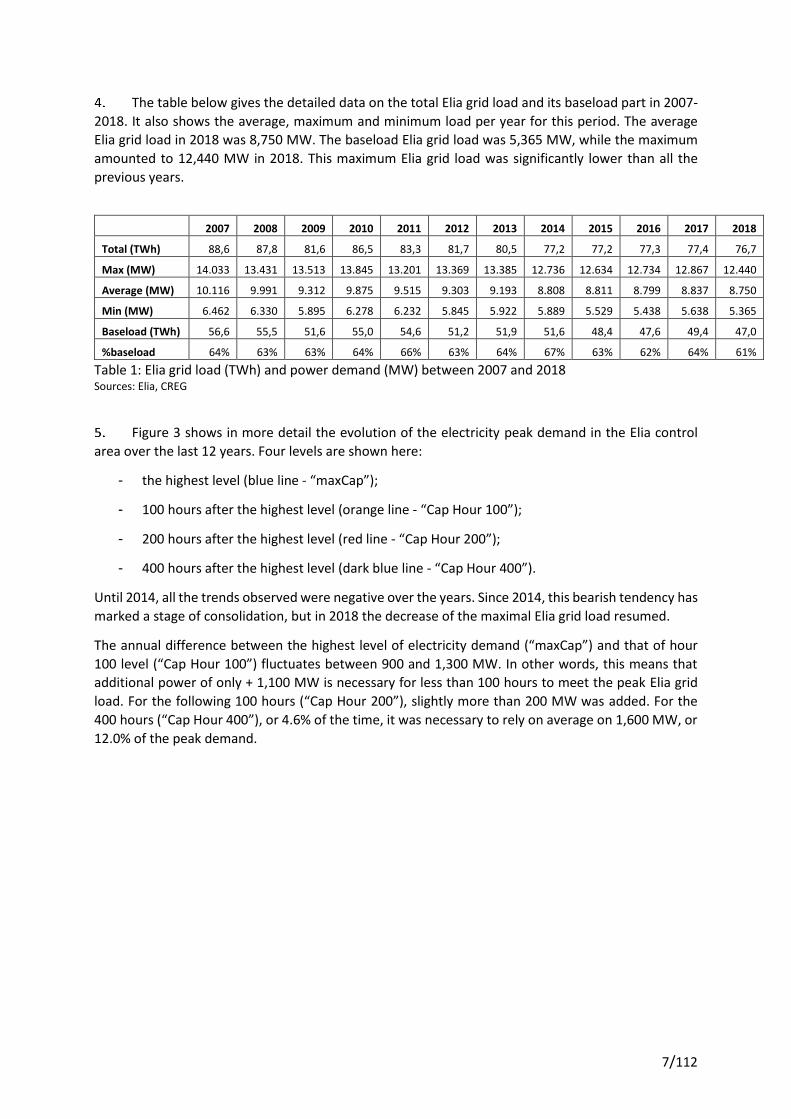
Figure 3 shows in more detail the evolution of the electricity peak demand in the Elia control
area over the last 12 years. Four levels are shown here:
- the highest level (blue line - “maxCap”);
- 100 hours after the highest level (orange line - “Cap Hour 100”);
- 200 hours after the highest level (red line - “Cap Hour 200”);
- 400 hours after the highest level (dark blue line - “Cap Hour 400”).
Until 2014, all the trends observed were negative over the years. Since 2014, this bearish tendency has
marked a stage of consolidation, but in 2018 the decrease of the maximal Elia grid load resumed.
The annual difference between the highest level of electricity demand (“maxCap”) and that of hour
100 level (“Cap Hour 100”) fluctuates between 900 and 1,300 MW. In other words, this means that
additional power of only + 1,100 MW is necessary for less than 100 hours to meet the peak Elia grid
load. For the following 100 hours (“Cap Hour 200”), slightly more than 200 MW was added. For the
400 hours (“Cap Hour 400”), or 4.6% of the time, it was necessary to rely on average on 1,600 MW, or
12.0% of the peak demand.
8/112
Figure 3: Evolution of the demand levels classified within the Elia control area (MW) for 2007-2018 (for the higher ¼ hour,
hour 100, hour 200 and hour 400), like their trend curve - Sources: Elia and CREG
1.2.2. Electricity Demand according to Meteorological Conditions
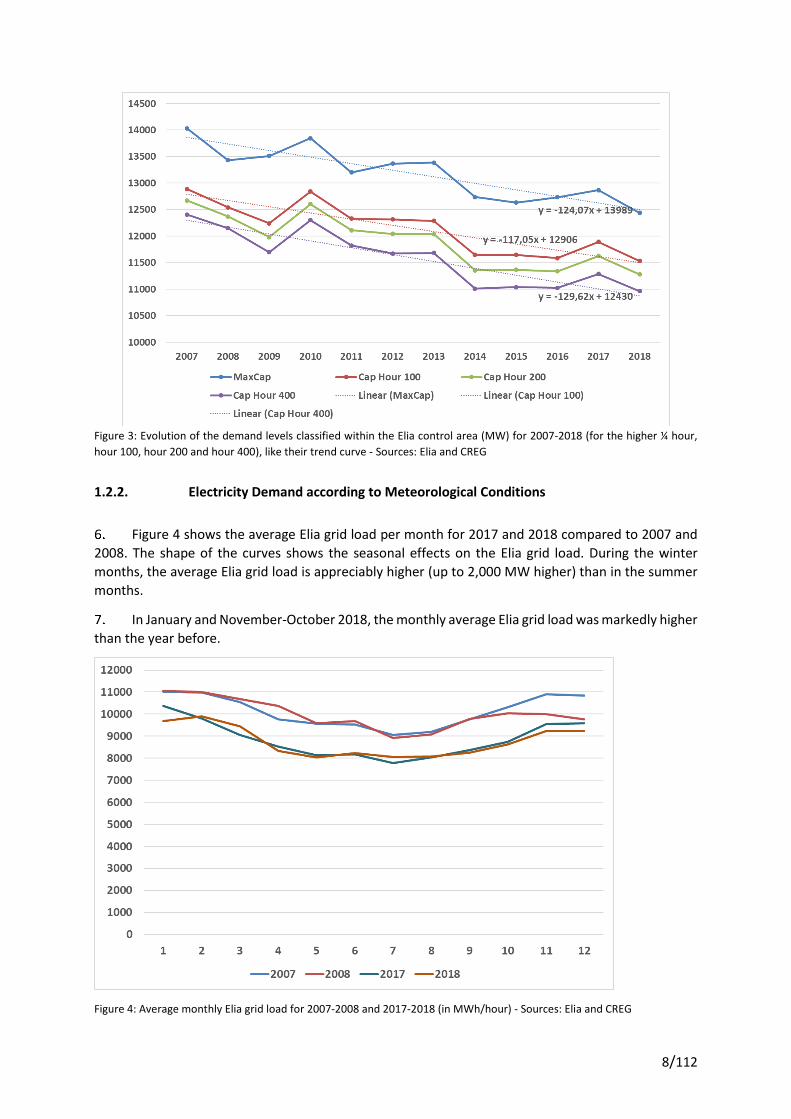
Figure 4 shows the average Elia grid load per month for 2017 and 2018 compared to 2007 and
2008. The shape of the curves shows the seasonal effects on the Elia grid load. During the winter
months, the average Elia grid load is appreciably higher (up to 2,000 MW higher) than in the summer
months.
In January and November-October 2018, the monthly average Elia grid load was markedly higher
than the year before.
Figure 4: Average monthly Elia grid load for 2007-2008 and 2017-2018 (in MWh/hour) - Sources: Elia and CREG

9/112
1.2.3. Load Patterns and the Impact of Solar Panels
Figure 5 shows the evolution of the daily pattern of the average Elia grid load for the years 2007-
2008 and 2017-2018. The peak just before midday in 2007 and 2008 has disappeared due to generation
from solar panels. During the night and morning, the average Elia grid load in 2018 did not change
compared to 2017. During the day, the average Elia grid load in 2018 was lower than in 2017.
Figure 5: Average Elia grid load per quarter of an hour for 2007-2008 and 2017-2018 (MW) - Sources: Elia and CREG
These observations are confirmed by Figure 6 which shows the variability of the average Elia grid
load during the day measured using standard deviation (“AV D-Stdev” - blue line) as well as the
standard deviation of the difference in Elia grid load between two consecutive days (“StdDev of D-D-
1” - red line). Figure 6 also illustrates on the right-hand axis the standard deviation of the difference
between two consecutive quarters of an hour (“Stdev of QtoQ - right axis” - green line).
Figure 6: Annual variability of the average electricity demand during one day (“AV D-Stdev” - blue line), the difference between two consecutive days (“StdDev of D-D-1” - red line) and, on the right-hand axis, the difference between two consecutive fifteen minute intervals (“Stdev of QtoQ” - green line) (MW). - Sources: Elia, CREG
10/112
The constant lower levels of variability in 2018 and the years before compared to 2013 and
earlier is an indication that the need for flexibility to meet the demand has decreased. This is confirmed
in chapter six on balancing. Since 2013, a decrease in the resources required to maintain the power
balance has been observed.
Impact of solar generation
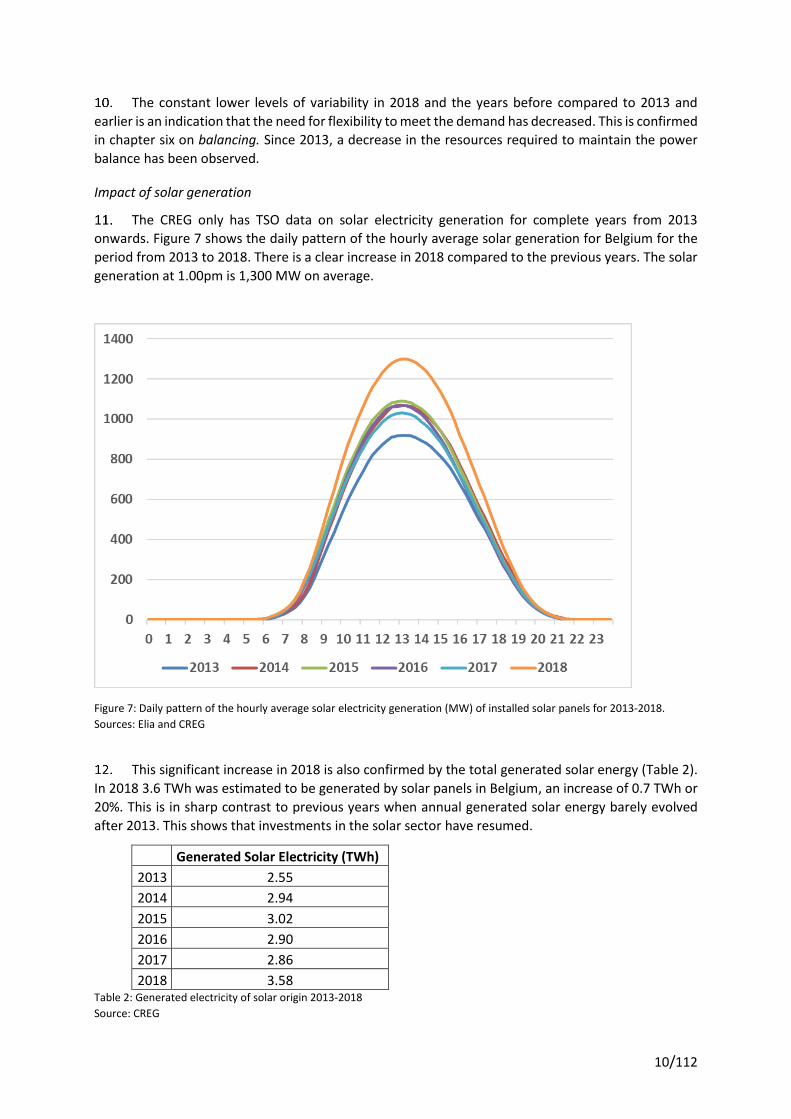
The CREG only has TSO data on solar electricity generation for complete years from 2013
onwards. Figure 7 shows the daily pattern of the hourly average solar generation for Belgium for the
period from 2013 to 2018. There is a clear increase in 2018 compared to the previous years. The solar
generation at 1.00pm is 1,300 MW on average.
Figure 7: Daily pattern of the hourly average solar electricity generation (MW) of installed solar panels for 2013-2018.
Sources: Elia and CREG
This significant increase in 2018 is also confirmed by the total generated solar energy (Table 2).
In 2018 3.6 TWh was estimated to be generated by solar panels in Belgium, an increase of 0.7 TWh or
20%. This is in sharp contrast to previous years when annual generated solar energy barely evolved
after 2013. This shows that investments in the solar sector have resumed.
Generated Solar Electricity (TWh)
2013 2.55
2014 2.94
2015 3.02
2016 2.90
2017 2.86
2018 3.58 Table 2: Generated electricity of solar origin 2013-2018
Source: CREG

11/112
Figure 8 shows the evolution of the maximum, average and minimum monthly generation at
hour 13 of the day. The hours with the highest generation are observed in May and June. The estimated
maximum generation rose to 2,668 MW in June 2018, compared to 2,277 MW in May 2017, an increase
of almost 400 MW.
Figure 8: Evolution of the maximum, average and minimum monthly generation at the 13th hour of the day (midday) Sources: Elia, CREG
From the figure above it is clear that solar electricity generation varies significantly. This
variability could be perceptible in the event of higher variability of the Elia grid load in the middle of
the day, since the solar generation connected at the distribution grid is seen as negative consumption
by the Elia grid load.
12/112
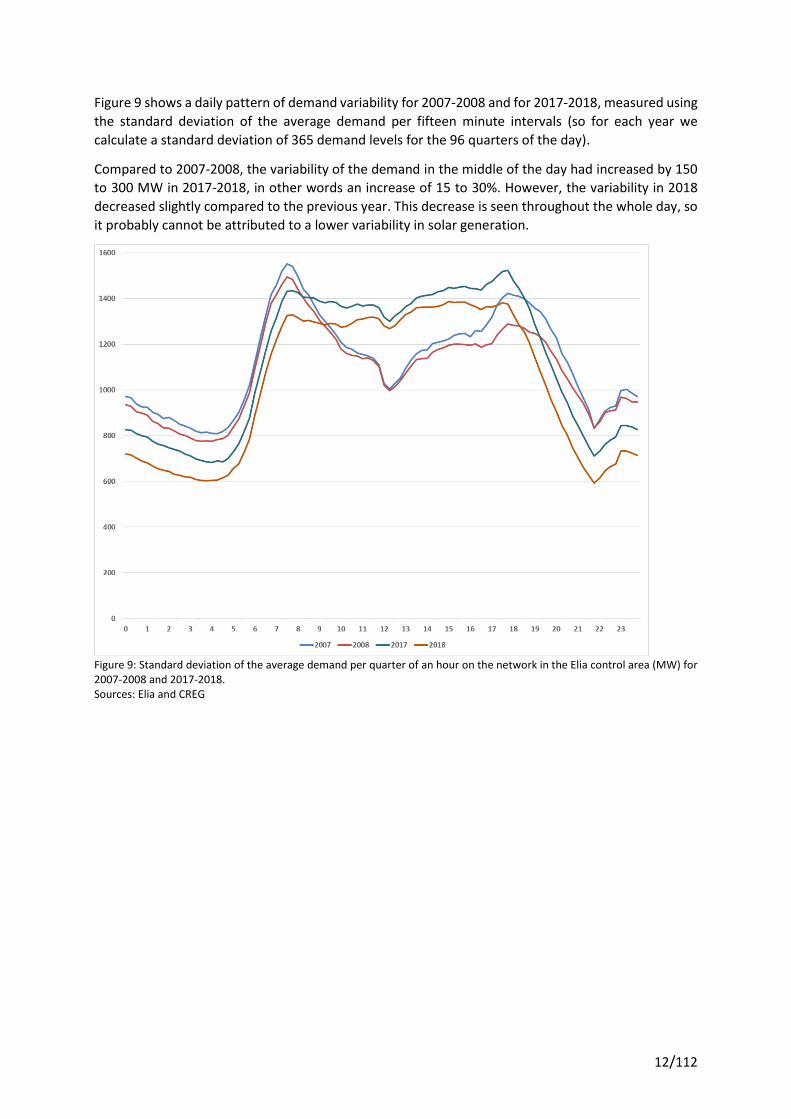
Figure 9 shows a daily pattern of demand variability for 2007-2008 and for 2017-2018, measured using
the standard deviation of the average demand per fifteen minute intervals (so for each year we
calculate a standard deviation of 365 demand levels for the 96 quarters of the day).
Compared to 2007-2008, the variability of the demand in the middle of the day had increased by 150
to 300 MW in 2017-2018, in other words an increase of 15 to 30%. However, the variability in 2018
decreased slightly compared to the previous year. This decrease is seen throughout the whole day, so
it probably cannot be attributed to a lower variability in solar generation.
Figure 9: Standard deviation of the average demand per quarter of an hour on the network in the Elia control area (MW) for 2007-2008 and 2017-2018. Sources: Elia and CREG
13/112
GENERATION
HISTORICAL BACKGROUND AND SIGNIFICANT EVENTS
Over the last decade, electricity generation in Belgium has been subject to various major changes. Investments in new conventional generation facilities fell significantly after the financial crisis of 2009, which also coincided with the start of a continuous fall in electricity demand. On the other hand, the installed capacity of investments in generation units using renewable energy sources is still increasing. This renewable capacity is characterised by relatively small marginal costs which affect the wholesale market price.
Conventional generation units have suffered from a fall in revenues due to declining running hours
combined with lower market prices. The decline in running hours was primarily caused by lower
electricity demand, increased renewable generation which precedes conventional units in the merit
order and the low carbon value which led to a coal-before-gas scenario.
The elements described above led to a number of announcements of the temporary closure
(mothballing) and definitive decommissioning of older, less profitable units. In addition to the
decommissioning of some smaller, older units (turbojets, old co-generation), the closure of some
CCGTs was also announced.
Since 2012, an increase in the unplanned unavailability of nuclear generation facilities has been
observed.
The combination of several announcements regarding the mothballing and decommissioning of
generation facilities, and this increase in the unavailability of nuclear plants, has led to concern about
the security of electricity supply in Belgium. While in our neighboring countries, a reflection was carried
out on the need to introduce a capacity remuneration mechanism, Belgium was confronted with a
short-term security of supply issue. In 2014 and 2015 various measures were taken to cope with this
issue: postponing the nuclear phase-out and setting up a mechanism of strategic reserves. Since winter
2014-2015, the mechanism of strategic reserves has been operational, although it has not been
necessary to make use of this reserve.
In 2017, the profitability of CCGT plants further increased and several notifications of decommissioning
of power plants were further postponed until 2019-2021.
Finally, in September 2018, Belgium was confronted with an unexpected additional unavailability of
several nuclear plants, leaving only one nuclear unit available at certain times. Several measures were
taken by market players and authorities to address this situation. A more detailed analysis is given in
the CREG study (F)1950.
SPECIAL TOPIC : RELATION BETWEEN AGE AND AVAILABILILTY, PLANNED UNAVAILABILITY AND FORCED OUTAGE RATES
2.2.1. Objective of this analysis
In this chapter, the eventual effect of age on different parameters related to the availability of the major generation units, CCGT and nuclear, will be analysed. The effect on the following parameters will be analysed:

14/112
- Average availability rate (calculated as the number of days when the units were available over
365 (or 366) days);
- Planned unavailability rate;
- Forced outage rate.
This analysis will be based on data available (source: Elia) for the period 2007-2018. Ideally the analysis
should be made over the total lifetime of the units, which is not feasible due to limited available data.
With the nuclear phase-out which is planned between 2022 and 2025, discussions are ongoing on how
generation adequacy can be maintained. One of the questions raised is whether the existing units (this
discussion primarily relates to CCGT-units) which are getting older, can be technically maintained in
the system with a sufficient degree of availability. This special topic addresses this issue in a first high
level analysis.
2.2.2. CCGT units
For the analysis of the effect of age on CCGT-units, Seraing and Vilvoorde will not be considered, as these units have been contracted since 2014 in the strategic reserve (out of the market) which was never activated. Hence, no forced outage rates have been available for these units since November 2014.
In 2018, the ages of the CCGT units analysed in this chapter ranges from 6 years for the most recent build to 24 years for the oldest CCGT still in operation.
The Figure below shows the availability of CCGTs according to their age. For the unit at Drogenbos, we see a deterioration of the availability over the last 3 years. Below we will analyse whether this is due to planned unavailability (for a major maintenance) or to forced outage. Based on these results, it can be noted that, except for the first years -sometimes with start-up problems-, no clear structural decrease of the availability of CCGTs can be observed.
Figure 10: availability of CCGT according to age

15/112
The figure below shows the average forced outage rate for CCGTs according to their age. Clearly, no
structural increase of the forced outage rates can be observed for older CCGT units.
Figure 11: average forced outage rate of CCGTs
The figure below shows the planned unavailability rate for CCGTs. It explains that the lower unavailability of Drogenbos was caused by planned unavailability rather than due to forced outages.
Figure 12: Planned unavailability of CCGTs

16/112
2.2.3. Nuclear units
The Figure below shows the availability of nuclear units according to their age. The decreasing availability of the nuclear units in recent years can be observed in this graph. It is questionable whether these unavailabilities need to be considered as “structural”, as for example the concrete degradation should no longer be a cause of nuclear unavailability once repaired.
Figure 13: availability of nuclear plants
The two Figures below show that the limited nuclear unavailability in the recent years was mainly due to planned unavailabilities rather than due to forced outages.

17/112
Figure 14: forced outage rate of nuclear plants
Figure 15: planned unavailability of nuclear plants

18/112
2.2.4. Conclusion
For CCGT units, decreased availability can be observed for older units, mainly linked to planned unavailibilities. No increased forced outage rate can clearly be detected for CCGTs.
For nuclear plants, recent years have been quite exceptional in terms of availability due to a number of non-structural events. As for CCGTs, no clearly increased forced outage rate can be detected for older nuclear units.
STATISTICS
2.3.1. Main characteristics of electricity generation in Belgium
At the end of 2018, the installed generation capacity (excluding mothballed capacity and capacity in strategic reserve) connected to the Elia grid amounted to 15.4 GW, compared to 14.1 GW in 2017. This significant increase in installed capacity is partially due to the commissioning of the Rentel offshore windfarm (309 MW) and the return to market of generation units which were contracted in strategic reserves in previous years (750 MW), complemented by different measures taken after the announcement of the additional nuclear unavailability for the winter period 2018-2019. Total electricity generated in 2018 by units connected to the Elia grid amounted to 57.8 TWh, compared to 70.2 TWh in 2017. Figure 16 shows the distribution of the installed capacity at the end of 2018 and the electricity generated in 2018 per fuel source.
Figure 16: Installed capacity and electricity generation in 2018 by fuel source. Sources: Elia, CREG
An estimate of the evolution of the installed capacity per fuel type connected to the Elia grid is shown in Table 3, considering the situation at the end of December. The share of the 7 nuclear power plants decreases to the level of 2013, due to the return to market of gas fired units which were contracted in the strategic reserve as from winter 2014-2015. The generation capacity shown is the capacity in the market: it does not include the installed generation capacity which is temporarily decommissioned and which might be contracted in the strategic reserve.

19/112
Table 3: Evolution of generation capacity by fuel type (GW and %)
Source: Elia, CREG
An estimate of the evolution of the generated electricity per fuel type connected to the Elia grid for the last decade is shown in Table 4. The level of electricity generation in Belgium in 2018 is close to the level in 2013. The low values in the years 2014 and 2015 were mainly caused by the unavailability of several nuclear power plants.
Table 4: Evolution of electricity generated by fuel type (TWh and %)
Source: Elia, CREG
Table 5 shows the evolution of the market shares of generation capacity connected to the Elia grid for different Access Responsible Parties (ARP) in the last decade. The table is based on end-of-year data.
The Herfindahl-Hirschman Index (HHI), which is an indication of market concentration, remains
between 4000 and 6000. A market is considered to be highly concentrated when HHI-values are above
2000. There is still a long way to go to achieve a competitive market for generation in Belgium.
Table 5: Evolution of generation capacity by ARP (GW and %) Source: Elia, CREG
The energy generated by units connected to the Elia grid by ARP is shown in Table 6. The share of generated electricity in 2018 decreased for Electrabel due to the high unavailability rate of nuclear plants, which are to a large extent owned by Electrabel.
Table 6: Evolution of generated electricity by ARP (TWh and %) Source: Elia, CREG
Type of fuel 2009 2010 2011 2012 2013 2014 2015 2016 2017 2018 2009 2010 2011 2012 2013 2014 2015 2016 2017 2018
Nuclear 5.8 5.9 5.9 5.9 5.9 5.9 5.9 5.9 5.9 5.9 36% 38% 38% 37% 39% 41% 41% 42% 42% 38%
Natural gas 5.6 5.8 5.9 6.3 5.6 4.7 4.6 4.6 4.5 5.4 35% 37% 37% 39% 37% 32% 32% 33% 32% 35%
Coal 1.4 0.9 0.8 0.7 0.5 0.5 0.5 0.0 0.0 0.0 9% 6% 5% 4% 3% 3% 3% 0% 0% 0%
Wind 0.1 0.3 0.3 0.5 0.7 0.9 0.9 0.9 1.1 1.4 1% 2% 2% 3% 5% 6% 6% 6% 8% 9%
Other renewable sources 0.2 0.4 0.6 0.4 0.4 0.4 0.4 0.4 0.4 0.5 1% 3% 4% 3% 3% 3% 3% 3% 3% 3%
Pumped storage 1.4 1.4 1.3 1.3 1.3 1.3 1.3 1.3 1.3 1.3 9% 9% 8% 8% 9% 9% 9% 9% 9% 8%
Other 1.4 1.0 1.0 0.9 0.8 0.9 0.9 0.8 0.8 0.9 9% 6% 6% 6% 6% 6% 6% 6% 6% 6%
Total 16.0 15.8 15.8 16.0 15.3 14.6 14.5 14.0 14.1 15.4 100% 100% 100% 100% 100% 100% 100% 100% 100% 100%
2009 2010 2011 2012 2013 2014 2015 2016 2017 2018 2009 2010 2011 2012 2013 2014 2015 2016 2017 2018
Nuclear 45.0 45.7 45.9 38.5 40.6 32.1 24.8 41.4 40.2 27.3 53% 53% 57% 54% 57% 54% 44% 59% 57% 47%
Natural Gas 29.4 30.2 24.1 21.9 18.1 16.8 18.5 18.0 18.8 19.3 34% 35% 30% 31% 26% 28% 33% 26% 27% 33%
Coal 6.3 4.9 3.7 3.3 3.0 2.2 2.2 0.4 0.0 0.0 7% 6% 5% 5% 4% 4% 4% 1% 0% 0%
Wind 0.2 0.4 1.0 1.1 1.8 2.5 2.9 2.7 3.2 3.9 0% 0% 1% 2% 3% 4% 5% 4% 5% 7%
Other Renewable 0.7 0.8 1.4 2.4 1.9 1.3 2.0 2.2 2.3 2.1 1% 1% 2% 3% 3% 2% 4% 3% 3% 4%
Pumped Storage 1.4 1.4 1.2 1.3 1.3 1.2 1.1 1.1 1.1 1.0 2% 2% 2% 2% 2% 2% 2% 2% 2% 2%
Other 2.6 3.3 3.2 3.3 3.9 3.9 4.2 4.1 4.5 4.3 3% 4% 4% 5% 5% 6% 7% 6% 6% 7%
Total 85.5 86.6 80.5 71.9 70.7 59.9 55.8 69.9 70.2 57.8 100% 100% 100% 100% 100% 100% 100% 100% 100% 100%
ARP 2009 2010 2011 2012 2013 2014 2015 2016 2017 2018 2009 2010 2011 2012 2013 2014 2015 2016 2017 2018
Electrabel 12.1 11.4 11.0 10.7 9.9 9.9 10.2 10.2 10.1 10.6 76% 72% 70% 66% 65% 68% 71% 73% 72% 69%
EDF-Luminus 2.2 2.4 2.4 2.3 2.2 1.8 1.7 1.9 2.0 2.6 14% 15% 15% 14% 15% 12% 12% 14% 14% 17%
E.ON 1.2 1.5 1.5 1.5 1.5 1.1 0.6 0.0 0.0 0.0 8% 9% 9% 9% 10% 7% 4% 0% 0% 0%
T-Power 0.0 0.0 0.4 0.4 0.4 0.4 0.4 0.4 0.4 0.4 0% 0% 3% 3% 3% 3% 3% 3% 3% 3%
Others (<3%) 0.5 0.6 0.5 1.2 1.3 1.5 1.6 1.5 1.5 1.8 3% 3% 3% 7% 9% 10% 11% 11% 11% 12%
Total 16.0 15.8 15.8 16.0 15.3 14.6 14.5 14.0 14.1 15.4 100% 100% 100% 100% 100% 100% 100% 100% 100% 100%
HHI 5970 5540 5170 4720 4460 4760 5160 5510 5420 5040
ARP 2009 2010 2011 2012 2013 2014 2015 2016 2017 2018 2009 2010 2011 2012 2013 2014 2015 2016 2017 2018
Electrabel 70.3 62.7 58.9 50.7 49.9 40.7 36.6 54.3 53.7 40.0 82% 72% 73% 71% 71% 68% 66% 78% 76% 69%
EDF-Luminus 12.2 12.2 9.3 8.5 8.6 7.6 7.3 7.2 8.5 9.7 14% 14% 12% 12% 12% 13% 13% 10% 12% 17%
E.ON 0.5 8.8 8.5 7.8 6.9 6.3 4.6 0.9 0.0 0.0 1% 10% 11% 11% 10% 11% 8% 1% 0% 0%
T-Power 0.0 0.0 1.0 0.5 0.4 1.4 2.2 2.6 2.5 2.4 0% 0% 1% 1% 1% 2% 4% 4% 4% 4%
Autres (<3%) 2.6 3.0 2.8 4.4 4.9 4.0 5.1 4.9 5.5 5.7 3% 3% 4% 6% 7% 7% 9% 7% 8% 10%
Total 85.5 86.6 80.5 71.9 70.7 59.9 55.8 69.9 70.2 57.8 100% 100% 100% 100% 100% 100% 100% 100% 100% 100%
HHI 6868 5439 5599 5242 5223 4893 4559 6167 6011 5103

20/112
2.3.2. Nuclear generation
As previously mentioned, nuclear generation represents a major share of electricity generation in Belgium. Nuclear plants are geographically situated in two locations: Doel and Tihange. Table 7 provides an overview of the capacity and the ownership of the 7 nuclear plants.
Table 7: Ownership of nuclear plants Source: Elia, CREG
Although several nuclear plants are jointly owned by Electrabel and EDF-Luminus, Electrabel manages
daily operations and is the only Access Responsible Party for all units. Until the end of December 2015,
E.ON had drawing rights on a part of the Electrabel share.
Electricity generation by nuclear plants has been extremely volatile in recent years due to the unplanned unavailability of several nuclear units. Figure 17 shows the monthly nominations for all nuclear power plants in Belgium. Nuclear generation in the last quarter of 2018 reached the lowest levels of annual generation of the past decade. On a year-to-year basis, nuclear generation was 13 TWh lower than in 2017. Over the past decade, nuclear generation was only lower in 2015 (25 TWh in 2015 compared to 27 TWh in 2018).
Figure 17: Monthly nominations for generation by nuclear power plants per year Sources: Elia, CREG
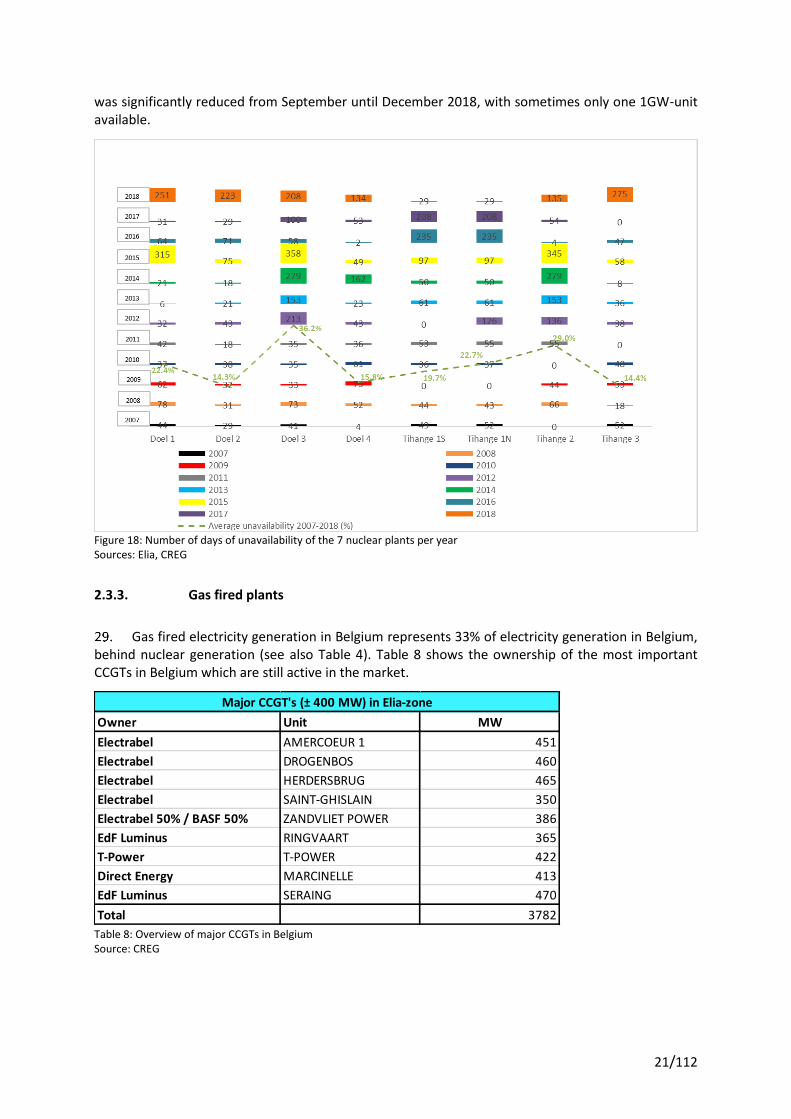
The following figure shows for each year of the last decade the number of days of unavailability for each nuclear plant. The high unavailability of Doel 1, Doel 3 and Tihange 2 in 2014 and 2015 can be observed. On 7 September 2016, Tihange 1 was shut down because one building had been damaged during civil construction works. It remained unavailable until May 2017. In 2018, nuclear availability
Nuclear Plants Doel 1 Doel 2 Doel 3 Doel 4 Tihange 1 Tihange 2 Tihange 3
433 MW 433 MW 1006 MW 1039 MW 962 MW 1008 MW 1038 MW 5919 MW 100.0%
Electrabel 100.0% 100.0% 89.8% 89.8% 50.0% 89.8% 89.8% 5021 MW 84.8%
EDF 10.2% 10.2% 50.0% 10.2% 10.2% 898 MW 15.2%
Total
Ownership
Installed capacity
21/112
was significantly reduced from September until December 2018, with sometimes only one 1GW-unit available.
Figure 18: Number of days of unavailability of the 7 nuclear plants per year Sources: Elia, CREG
2.3.3. Gas fired plants
Gas fired electricity generation in Belgium represents 33% of electricity generation in Belgium, behind nuclear generation (see also Table 4). Table 8 shows the ownership of the most important CCGTs in Belgium which are still active in the market.
Table 8: Overview of major CCGTs in Belgium Source: CREG
Owner Unit MW
Electrabel AMERCOEUR 1 451
Electrabel DROGENBOS 460
Electrabel HERDERSBRUG 465
Electrabel SAINT-GHISLAIN 350
Electrabel 50% / BASF 50% ZANDVLIET POWER 386
EdF Luminus RINGVAART 365
T-Power T-POWER 422
Direct Energy MARCINELLE 413
EdF Luminus SERAING 470
Total 3782
Major CCGT's (± 400 MW) in Elia-zone
22/112
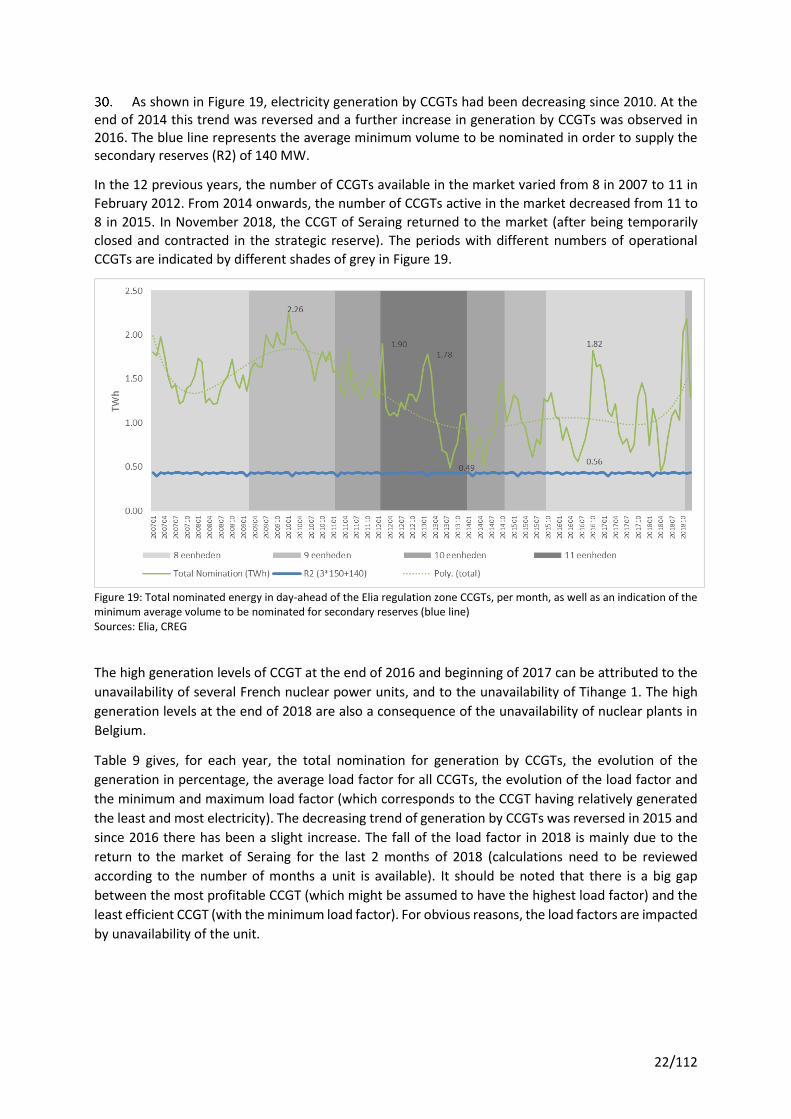
As shown in Figure 19, electricity generation by CCGTs had been decreasing since 2010. At the end of 2014 this trend was reversed and a further increase in generation by CCGTs was observed in 2016. The blue line represents the average minimum volume to be nominated in order to supply the secondary reserves (R2) of 140 MW.
In the 12 previous years, the number of CCGTs available in the market varied from 8 in 2007 to 11 in
February 2012. From 2014 onwards, the number of CCGTs active in the market decreased from 11 to
8 in 2015. In November 2018, the CCGT of Seraing returned to the market (after being temporarily
closed and contracted in the strategic reserve). The periods with different numbers of operational
CCGTs are indicated by different shades of grey in Figure 19.
Figure 19: Total nominated energy in day-ahead of the Elia regulation zone CCGTs, per month, as well as an indication of the minimum average volume to be nominated for secondary reserves (blue line) Sources: Elia, CREG
The high generation levels of CCGT at the end of 2016 and beginning of 2017 can be attributed to the
unavailability of several French nuclear power units, and to the unavailability of Tihange 1. The high
generation levels at the end of 2018 are also a consequence of the unavailability of nuclear plants in
Belgium.
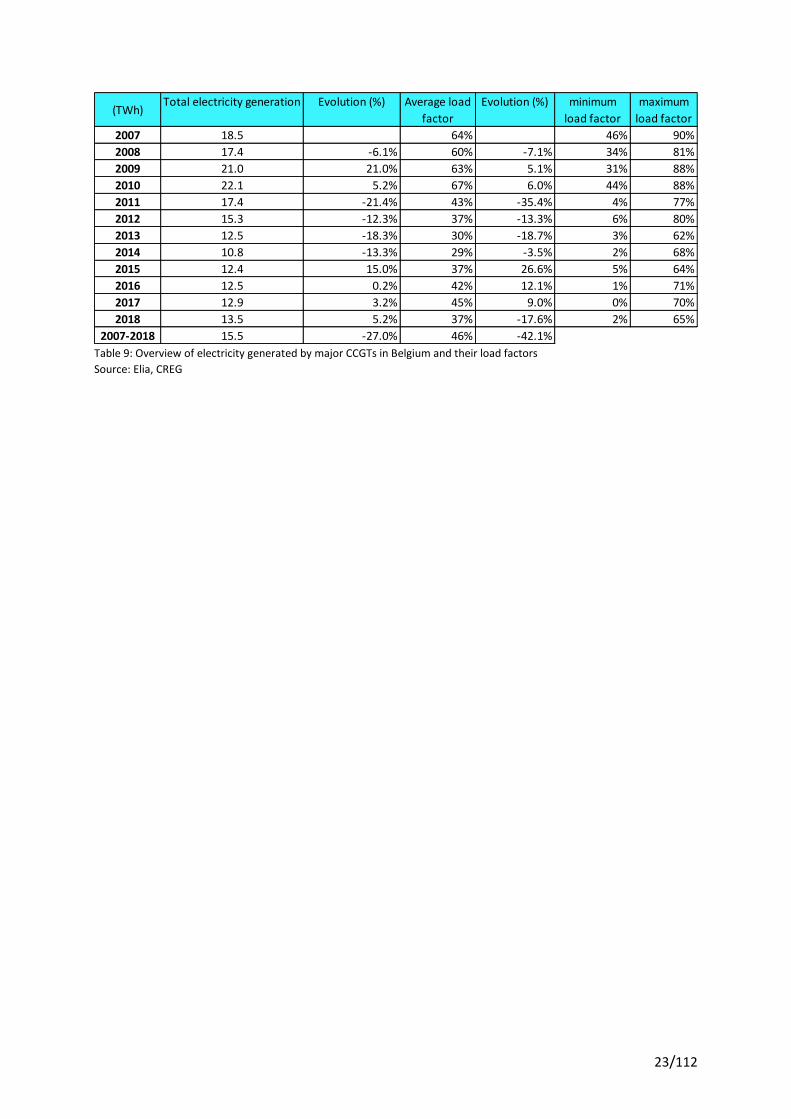
Table 9 gives, for each year, the total nomination for generation by CCGTs, the evolution of the
generation in percentage, the average load factor for all CCGTs, the evolution of the load factor and
the minimum and maximum load factor (which corresponds to the CCGT having relatively generated
the least and most electricity). The decreasing trend of generation by CCGTs was reversed in 2015 and
since 2016 there has been a slight increase. The fall of the load factor in 2018 is mainly due to the
return to the market of Seraing for the last 2 months of 2018 (calculations need to be reviewed
according to the number of months a unit is available). It should be noted that there is a big gap
between the most profitable CCGT (which might be assumed to have the highest load factor) and the
least efficient CCGT (with the minimum load factor). For obvious reasons, the load factors are impacted
by unavailability of the unit.
23/112
Table 9: Overview of electricity generated by major CCGTs in Belgium and their load factors
Source: Elia, CREG
(TWh)Total electricity generation Evolution (%) Average load
factor
Evolution (%) minimum
load factor
maximum
load factor
2007 18.5 64% 46% 90%
2008 17.4 -6.1% 60% -7.1% 34% 81%
2009 21.0 21.0% 63% 5.1% 31% 88%
2010 22.1 5.2% 67% 6.0% 44% 88%
2011 17.4 -21.4% 43% -35.4% 4% 77%
2012 15.3 -12.3% 37% -13.3% 6% 80%
2013 12.5 -18.3% 30% -18.7% 3% 62%
2014 10.8 -13.3% 29% -3.5% 2% 68%
2015 12.4 15.0% 37% 26.6% 5% 64%
2016 12.5 0.2% 42% 12.1% 1% 71%
2017 12.9 3.2% 45% 9.0% 0% 70%
2018 13.5 5.2% 37% -17.6% 2% 65%
2007-2018 15.5 -27.0% 46% -42.1%

24/112
ELECTRICITY TRADING
HISTORICAL BACKGROUND: SIGNIFICANT EVENTS
3.1.1. Founding of the Belgian power exchange
2005 The Belgian power exchange Belpex (now EPEX SPOT SE) was founded in July 2005 following
the liberalisation of the European electricity market and the transposition into national law on 29 April
1999. The Royal Decree of 20 October 2005 established the rules concerning the creation, access and
operation of the market for the exchange of energy blocks.
2006 On 11 January 2006, Belpex was designated as market operator responsible for organising the
Belgian short term electricity market. Belpex became operational on 21 November 2006. The Belgian
Transmission System Operator (TSO) Elia held a stake of 70%, the Dutch (APX) and the French
(Powernext/EPEX Spot) power exchanges each held a stake of 10%, as did the Dutch TSO TenneT. The
French TSO RTE also subsequently participated by taking over a 10% stake from Elia.
3.1.2. Organisation of the Belgian day-ahead market by Belpex
2006 Since its inception, the Belgian day-ahead market has been coupled with APX and Powernext.
The trilateral market coupling (TLC) algorithm imposed a floor price of 0.01 €/MWh and a ceiling price
of 3,000 €/MWh.
2010 On 9 November 2010, the market coupling was expanded to Germany and Luxembourg,
thereby creating the Central West-European (CWE) price coupled region and revising the floor price of
the algorithm to -3,000 €/MWh, while maintaining the ceiling price at its level. The CWE-region was
also coupled by volumes with the Scandinavian power market consisting of Norway, Sweden,
Denmark, Finland, and Estonia.
2011 On 1 April 2011, the BritNed-cable linked the Dutch power market with the power market in
United Kingdom, thereby coupling the latter to the CWE-region (CWE+UK).
2014 The coupling of the CWE-region with the Scandinavian power market was revised from volume
coupling to price coupling on 4 February 2014 to create the North Western European (NWE) market
coupling. Besides the countries already mentioned above, Austria, Poland, Lithuania, and Latvia were
also included in the NWE-region. The NWE-region was the first region that used the algorithm
Euphemia, developed as part of the Price Coupling of Regions (PCR) project, to optimise the social
welfare in day-ahead by determining the commercial flows between bidding zones and by fixing
market prices in each bidding zone. The floor price was revised to -500 €/MWh while the ceiling price
was maintained at 3,000 €/MWh.
On 13 May 2014 the South Western European (SWE) region consisting of Spain and Portugal was
coupled with the NWE-region to form the Multi-Regional market coupling (MRC). Later that year, on
19 November 2014, Romania, the Czech Republic, Slovakia, and Hungary were coupled with each other
(4M market coupling). During these developments, the CWE-region prepared to substitute the
coupling method by means of Available Transfer Capacities (ATCs) with the flow-based market coupling
method. While the former optimises social welfare in the coupled region by exchanging electricity
between adjacent bidding zones as long as the ATC permits, the latter at once calculates and allocates
25/112
electricity exchanges between all bidding zones in the coupled region based on the order books of all
coupled bidding zones and the technical limitations of the underlying electricity grid.
2015 The flow-based market coupling method was applied on 20 May 2015 (delivery 21 May).
3.1.3. Organisation of the Belgian intraday market by Belpex
2008 Belpex started organizing the continuous intraday market on 13 March 2008. The new CIM
segment allowed market participants to act on the market until 5 minutes before delivery time to
adjust their commercial position to changes in expected supply or demand in day-ahead.
2010 On 13 December 2010, the German TSOs Amprion and EnBW, together with the French TSO
RTE, organized the implicit allocation of cross-border intraday capacity between the French and
German bidding zone.
2011 The implicit intraday market coupling on the Belgian-Dutch border followed on 17 February
2011. On 14 March 2011 the implicit intraday market coupling was expanded to include Denmark,
Norway, Sweden, Finland, Estonia and Germany.
2012 On 16 October 2012 the Austrian intraday market was created and immediately coupled with
the French and German intraday markets.
Since 2012 it had been envisaged to create a pan-European intraday electricity market platform in the
NWE-region. In June 2018, the first go-live of the single intraday coupling (SIDC) included 14 countries
(Austria, Belgium, Denmark, Estonia, Finland, France, Germany, Latvia, Lithuania, Norway, The
Netherlands, Portugal, Spain and Sweden). A second go-live with 7 further countries – Bulgaria,
Croatia, Czech Republic, Hungary, Poland, Romania and Slovenia – was planned for 2019.
2013 In the meantime, the Swiss intraday market was coupled by an explicit mechanism on 26 June
2013.
2014 Until 30 November 2014, SPE (now EDF-Luminus) provided liquidity on the intraday market by
offering 25 MW of electricity during 80% of the trading window at a price within a certain pre-
determined price interval. No other company has engaged in market making activities since.
2018 In June 2018, the first go-live of the single intraday coupling (SIDC) included 14 countries
(Austria, Belgium, Denmark, Estonia, Finland, France, Germany, Latvia, Lithuania, Norway, The
Netherlands, Portugal, Spain and Sweden). A second go-live with 7 further countries – Bulgaria,
Croatia, Czech Republic, Hungary, Poland, Romania and Slovenia – was planned for 2019.
3.1.4. Integration of the activities operated by Belpex in EPEX SPOT
2015 On 17 April 2015 Belpex, APX and EPEX SPOT announced the planned integration of their
services with the aim of reducing barriers in power trading in the CWE region, including the United
Kingdom. Market participants should therefore benefit from harmonized trading systems, one single
set of rules and one admission process for the entire region, thereby reducing trading costs and
lowering barriers to entry for new participants. Moreover, they should gain access to a wider range of
products and benefit from best-of-both standards and reliable customer support. Overall, the
integration would lead to more effective governance and further facilitate the creation of a single
European power market fully in line with the objectives of the European electricity regulatory
26/112
framework. EPEX SPOT would then encompass Belgium, the Netherlands, France, Germany, Austria,
Luxembourg and Switzerland. On 1 October 2015, APX and Belpex integrated their staff into the
governance structure of EPEX SPOT. The operational integration occurred in multiple steps.
2016 On 31 December 2016, Belpex changed its corporate name to EPEX SPOT Belgium. The trading
platform was migrated from Eurolight – as used by Belpex for day-ahead and intraday4 trade – to the
M7 platform (intraday trade) on October 4 2016 and the EPEX Trading System (day-ahead trade, ETS)
on 24 January 2017. The migration of the intraday trading platform resulted in the Belgian intraday
market being coupled with those of Germany, France, Austria, and Switzerland on October 5.
Before Belpex was fully integrated operationally, EPEX SPOT requested a modification of the market
rules of Belpex. On 7 January 20165, 19 July 20166 and 22 September 20167 the CREG gave opinions on
the requested modifications of the Belpex market rules. In these opinions, the CREG recommended
any obligations or restrictions applicable to the market participant to be included in the market rules
in accordance with the Royal Decree of 20 October 2005. The CREG specified in its opinions the impact
of the ECC Clearing Conditions on the ability for a small market participant to access the market which
led to the design and launch of the ECC Direct Clearing Participant model (DCPM) for participants in
Belgium and the Netherlands on 1 September 2016, later expanded to France, Germany and the United
Kingdom. In its opinions, the CREG also drew attention to the possible unintended consequences of
imposing transaction limits, by third parties, on market participants. The CREG also recommended
including objective criteria to assess a Manifest Error. The Minister of Energy approved the proposed
modifications.
2017 After completing tests on 24 January, the migration of the Belgian and Dutch day-ahead
markets from Euphemia to the Emission Trading System was completed. At the same time, EPEX SPOT
substituted the free, daily communication of market results to market participants regarding the
Belgian market to a paid service via its SFTP server8.
2018 On 31 December 2018, EPEX SPOT Belgium merged with EPEX SPOT SE. The merger finalises
the integration of EPEX SPOT and former APX Group companies. All rights and obligations of EPEX SPOT
Belgium SA have been transferred to EPEX SPOT SE and any reference to EPEX SPOT Belgium SA or old
APX is to be understood in conjunction with these changes.
3.1.5. Legal framework impacting Belgian power exchanges
2015 On 14 August 2015, Regulation (EU) No. 2015/1222 of 24 July 2015 establishing a guideline on
capacity allocation and congestion management (CACM) entered into force, requiring the Minister of
Energy to nominate one or more Electricity Market Operators (NEMO) in Belgium before 14 December
2015.
On 7 October 2015, Regulation (EU) No 1227/2011 of the European Parliament and of the Council of
25 October 2011 on wholesale energy market integrity and transparency (REMIT) came into force.
4 Until September 8 2016 the Elbas trading system was used 5 http://www.creg.be/nl/publicaties/advies-a160107-cdc-1502 (available in Dutch and French). 6 http://www.creg.be/nl/publicaties/advies-a160719-cdc-1549 (available in Dutch and French). 7 http://www.creg.be/nl/publicaties/advies-a160922-cdc-1567 (available in Dutch and French). 8 Market prices can still be freely consulted on the Transparency Platform of ENTSO-E, under the tab ‘Transmission’:
https://transparency.entsoe.eu/

27/112
2016 In relation to CACM, on 14 January 2016 the CREG gave two opinions, one for the nomination
of Belpex9 as NEMO and one of the nomination of Nord Pool10 as NEMO, following requests by the
Minister of Energy received on 7 December 2015. Both power exchanges have been successfully
nominated as NEMO.
In relation to REMIT, the CREG received 3 formal notifications. In total, 7 cases were analysed during
the year and 1 was closed or transferred to another authority.
2017 In relation to CACM, on 29 June 2017 the CREG published its decision on the application of
EPEX SPOT Belgium and Nord Pool SA and all designated electricity market operators for the revised
plan concerning the joint performance of MCO functions.
In relation to market monitoring activities, on 24 May and on 17 July, following enquiries from market
participants, the CREG published two reviews explaining the day-ahead market results on 6 April, 10
April, and 1 May.
In relation to REMIT, the CREG received 7 formal notifications. In total, 13 cases were open for analysis
during the year and 6 were closed or transferred to another authority.
3.1.6. Organisation of the Belgian day-ahead and intraday markets by EPEX SPOT Belgium
2016 On 14 January 2016 the CREG gave two opinions, one for the nomination of Belpex11 as NEMO
and one of the nomination of Nord Pool12 as NEMO, following requests by the Minister of Energy
received on 7 December 2015. Both power exchanges have been successfully nominated as NEMO.
In 2016, on 5 days, including 4 in November, a second auction was triggered, the majority due to high
prices in hour 17 and/or 19. Second auctions are triggered if the market clearing price in a bidding zone
exceeds 500 €/MWh. The impacted markets were Belgium and the United Kingdom. The risk of partial
decoupling existed on 7 days. Besides the 4 days in November, 2 days in September and 1 in May were
impacted. The market coupling results were delayed on 10 days, suggesting that it took the market
clearing algorithm more than 10 minutes to calculate a feasible market clearing price, of which 7 are
related to the causes described above. On 19 October 2016, version 9.5 of Euphemia was released.
2017 From 11 January onwards, the upper threshold to trigger a second auction was raised from
€500/MWh (£500/MWh in the UK) to €1,500/MWh (£1.500/MWh in the UK). The lower threshold
remains at €-150/MWh (£-150/MWh). No second auctions were triggered in 2017 and on 1 day the
publication of market results was delayed, suggesting that it took the market clearing algorithm more
than 10 minutes to calculate a feasible market clearing price.
Intraday trading was restricted on several occasions. On 9 January, from 2:20 to 3:11, on 10 January
from 15:55 to 19:00, and on 24 January from 15:55 to 19:00 (advanced to 18:05) cross-border trading
with the Netherlands was restricted. On 30 January from 19:40 until 31 January at 00:15, all local
intraday trade was suspended.
On 14 November 2017 version 6.0 of the M7 trading system was deployed between 16:30 and 23:25.
9 http://www.creg.be/nl/publicaties/advies-a160114-cdc-1501 (available in Dutch and French). 10 http://www.creg.be/nl/publicaties/advies-a160114-cdc-1503 (available in Dutch and French). 11 http://www.creg.be/nl/publicaties/advies-a160114-cdc-1501 (available in Dutch and French). 12 http://www.creg.be/nl/publicaties/advies-a160114-cdc-1503 (available in Dutch and French).

28/112
Finally, on 17 July Nord Pool spot was appointed market operator for the exchange of energy blocks
by Ministerial Decree, after having filed a request on 16 May.
2018 The cross-border intraday initiative XBID was successfully implemented on the European
intraday markets on 12 June with first deliveries on 13 June.
From July 2018, 15-minute continuous intraday trading was introduced on the Belgian and Dutch local
power spot markets. The first day of trading was 10 July 2018.
29/112
SPECIAL TOPIC: PROFITABILITY OF COMBINED CYCLE GAS TURBINES
Combined Cycle Gas Turbines (CCGT) plants are relied on in Belgium to provide peak supply. Since 2014 concerns have arisen in the electricity sector on the profitability of CCGT plants and subsequently questions have been raised regarding the role CCGT plants can have in the future system with energy-only remuneration. This special topic looks at the historic profitability of CCGT plants, explains the background of the above-mentioned concerns and describes how the fundamentals have changed for the profitability of CCGT plants since 2014.
A CCGT plant is valorised by turning gas into electricity. The electricity is sold on the electricity market while the gas needed to generate the electricity is procured from international gas markets. By transforming energy from gas molecules to electrons, CO2 is emitted in the air. Since 2005, following the launch of the Emission Trading System (ETS) in the European Union, emitted CO2 needs to be offset by CCGT plant owners by purchasing sufficient certificates. A CCGT plant can generate electricity at a profit if the price for electricity is larger than the cost for procuring the equivalent volume of gas and the equivalent number of certificates to offset CO2 emissions. The difference between the electricity price and the equivalent cost components is referred to as the Clean Spark Spread (CSS): if positive, the CCGT plant can make a profit.
The CCGT plant is thus valorised by selling electricity on the electricity markets and buying a volume of gas and a number of CO2 certificates to generate the sold volume of electricity when the CSS is positive. When the CSS is negative, the CCGT plant can also be valorised by buying electricity on the electricity markets and selling an equivalent volume of gas and a number of CO2 certificates. By selling electricity the commercial position of the CCGT plant is increased to deliver electricity during the time period for which the electricity is sold. Purchasing electricity decreases the commercial position of the CCGT plant. Depending on the sign of the CSS, the CCGT plant can be continuously valorised, either by selling electricity when the CSS is positive or by purchasing electricity when the CSS is negative.
Electricity, gas and CO2 markets are all open for trade 3 years ahead of delivery so that theoretically every day up to real time the CCGT plant can be valorised. In practise, the commercial position is not frequently altered as the delivery by the CCGT plant of the final commercial position needs to be technically feasible and as various risks exist when trading, including forecast, commercial and financial risks. For these reasons, this special topic assumes two valorisation steps. On each of the three year-ahead markets, electricity is assumed to be sold (not purchased) as a first step. The second step assumes either selling or buying electricity on the day-ahead market, whichever is more profitable given the sign of the CSS.
The profitability of the first step (selling electricity and buying an equivalent volume of gas and number of CO2 certificates) each year is indicated by the average positive CSS during the year and the number of days with a positive CSS (Figure 20). Note that the figure indicates the year of delivery, not the year of transaction. The higher both metrics, the higher the profitability of the first step.
Until 2011, for each year-ahead product, both the average positive CSS and the number of days during which the CSS is positive are high, indicating a high valorisation of the CCGT plant. In 2012, the 1-year-ahead product becomes unprofitable, joined by the 2-year-ahead product in 2013 and the 3-year-ahead product in 2014. Starting from 2015, the number of days during which the 1-year-ahead product is profitable increases gradually, reaching pre-2012 levels for delivery in 2019. The 2-year-ahead product shows signs of improvement as well, reaching almost 150 days of positive CSS in 2019.
The average positive CSS remains subdued compared to pre-2012 levels. In 2018, a 1-year-ahead CSS of €4/MWh is attained while the CSS exceeded €14/MWh in 2008 to 2010. No trend is visible for the other two year-ahead products.

30/112
Figure 20 – Average positive Clean Spark Spread (lines, left axis) and number of days with positive Clean Spark Spread (bars, right axis), per year, for the three year-ahead wholesale electricity products with delivery in Belgium Source: CREG based on data received from EPEX SPOT, EEX
Based on the first step, the majority of the capacity of the CCGT plant is sold on forward markets in the years 2009 to 2012. During 2014 and 2015 almost no capacity is sold on forward markets. An intermediate amount is sold in the remaining years. This means that in the years 2012 to 2018, a CCGT plant could be further valorised on the spot market by selling electricity while during the years 2009 to 2012 and 2016 to 2018 a CCGT plant could be further valorised by purchasing electricity.
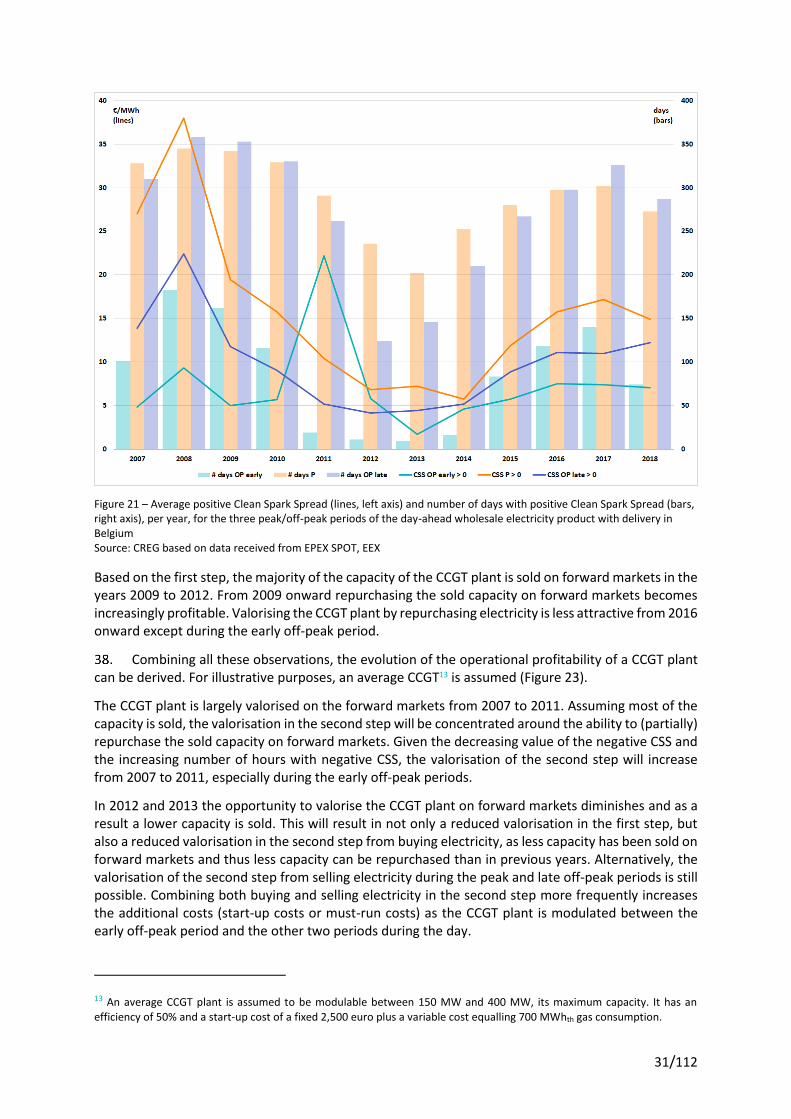
The profitability of selling electricity in the second step each year is indicated by the average positive CSS during the year and the number of hours with a positive CSS (Figure 21). The figure distinguishes between an early off-peak period (hour 1 to hour 8 each day), a peak period (hour 9 to 20 each day) and a late off-peak period (hour 21 to 24 each day). The higher both metrics, the higher the profitability of selling electricity in the second step.
Since 2011, the number of hours with positive CSS have declined. The decline is stronger during each of the off-peak periods compared with the peak period. Starting from 2014, the average number of hours with positive CSS increases. A pullback is visible in 2018. The average positive CSS shows a similar curve with the exception for 2018, where the average positive CSS for the late off-peak period continued to rise while the average positive CSS for the other two periods fell.
Consequently, from 2015 onward, the unsold capacity of the CCGT plant on forward markets can increasingly be valorised on the day-ahead market. In 2018 however, the number of hours with positive CSS during the early off-peak period falls sharply.
The profitability of buying electricity in the second step each year is indicated by the average negative CSS during the year and the number of hours with a negative CSS (Figure 22). The figure distinguishes between an early off-peak period (hour 1 to hour 8 each day), a peak period (hour 9 to 20 each day) and a late off-peak period (hour 21 to 24 each day). The higher both metrics in absolute value, the higher the profitability of purchasing electricity in the second step.
31/112
Figure 21 – Average positive Clean Spark Spread (lines, left axis) and number of days with positive Clean Spark Spread (bars, right axis), per year, for the three peak/off-peak periods of the day-ahead wholesale electricity product with delivery in Belgium Source: CREG based on data received from EPEX SPOT, EEX
Based on the first step, the majority of the capacity of the CCGT plant is sold on forward markets in the years 2009 to 2012. From 2009 onward repurchasing the sold capacity on forward markets becomes increasingly profitable. Valorising the CCGT plant by repurchasing electricity is less attractive from 2016 onward except during the early off-peak period.
Combining all these observations, the evolution of the operational profitability of a CCGT plant can be derived. For illustrative purposes, an average CCGT13 is assumed (Figure 23).
The CCGT plant is largely valorised on the forward markets from 2007 to 2011. Assuming most of the capacity is sold, the valorisation in the second step will be concentrated around the ability to (partially) repurchase the sold capacity on forward markets. Given the decreasing value of the negative CSS and the increasing number of hours with negative CSS, the valorisation of the second step will increase from 2007 to 2011, especially during the early off-peak periods.
In 2012 and 2013 the opportunity to valorise the CCGT plant on forward markets diminishes and as a result a lower capacity is sold. This will result in not only a reduced valorisation in the first step, but also a reduced valorisation in the second step from buying electricity, as less capacity has been sold on forward markets and thus less capacity can be repurchased than in previous years. Alternatively, the valorisation of the second step from selling electricity during the peak and late off-peak periods is still possible. Combining both buying and selling electricity in the second step more frequently increases the additional costs (start-up costs or must-run costs) as the CCGT plant is modulated between the early off-peak period and the other two periods during the day.
13 An average CCGT plant is assumed to be modulable between 150 MW and 400 MW, its maximum capacity. It has an efficiency of 50% and a start-up cost of a fixed 2,500 euro plus a variable cost equalling 700 MWhth gas consumption.

32/112
In 2014 and 2015, there was almost no opportunity to sell electricity on forward markets. Consequently, the capacity of the CCGT plant is mainly valorised by selling electricity in the second step. Since few early off-peak periods are profitable, the CCGT plant is also frequently modulated causing the additional costs to increase. As the average positive CSS is low, these additional costs offset a significant part of the gain. In 2014, for example, the average gain was 69 euro/MW during each peak period. The CCGT plant of 400 MW would gain on average 27.550 euro by starting up each peak period with positive CSS. The start-up costs of the plant however lies around 17.000 euro, thereby netting only 39% of its gain as an operational profit before including O&M costs or other fixed costs.
Starting from 2016, the opportunity to sell electricity on forward markets returns gradually: in 2016 the 1-year-ahead product is profitable, adding a profitable 2-year-ahead product in 2017 and again the 3-year-ahead product in 2018. As a result, the capacity sold will increase, reducing the valorisation potential of the CCGT plant by selling electricity but increasing its potential for repurchasing the electricity. As in 2017 the average positive CSS is largest and given the high number of hours with positive CSS over all three periods, the CCGT plant would see its highest gain and lowest offset caused by additional costs in 2017.
In 2018, the gain by selling electricity in the second step is reduced because most capacity has been sold in forward markets (and less capacity is additionally sold in the second step). The CCGT is further valorised by repurchasing electricity during the early off-peak period in the second step. Given the mainly positive CSS during the peak period and late off-peak period, the CCGT plant needs to be modulated frequently, thereby incurring additional costs and dampening the operational profitability of the CCGT plant with respect to 2017.
While the profitability of the 3-year-ahead product disappears in 2019, the other two year-ahead products increase significantly in profitability.
Figure 22 – Average negative Clean Spark Spread (lines, left axis) and number of hours with negative Clean Spark Spread (bars, right axis), per year, for the three peak/off-peak periods of the day-ahead wholesale electricity product with delivery in Belgium Source: CREG based on data received from EPEX SPOT, EEX

33/112
Figure 23 – Operational profitability of an average CCGT plant with indicated fixed and variable costs, from 2007 to 2019. Source: CREG
STATISTICS
3.3.1. Day-ahead wholesale electricity market for delivery in Belgium
The yearly averaged day-ahead wholesale electricity price in Belgium increased by 24% to 55.3 €/MWh (Figure 24). A year-on-year increase in prices was also observed in the other bidding zones in the CWE region and signals that, on average in 2018, the whole region – not only Belgium – relied on more expensive supply to meet demand. Yearly averaged prices in the Netherlands and Germany increased more than 30% year-on-year compared with 12% in France. The Austrian bidding zone, split from the German bidding zone since the first of October 2018 (delivery date), had an average price of 59,9 €/MWh during this period.
The monthly averaged day-ahead prices in Belgium are significantly elevated during the fourth quarter of each year (Figure 25). In both 2017 and 2018, an increase of 40% is observed between the fourth quarter and the other quarters of the same year. Increases are also observed for the other bidding zones in the CWE region, although with different magnitudes: 20% for the Netherlands and 37% for the France. The price increases fluctuate every year for Germany, with a 28% increase in 2018. These observations indicate a structural shift of the supply-demand equilibrium throughout the year, ranging from sufficient regional supply and cross-border capacity to cover all demand in the CWE region during spring and summer, to a situation where local supply and cross-border capacity are scarcer to meet demand.
Besides increasing demand in the CWE region during the winter period, the shift of the supply-demand equilibrium was driven by lower nuclear power plant availability in Belgium. A lower amount of baseload capacity increases prices during summertime, when the marginal cost of baseload power

34/112
plants set the price. It also increases prices during wintertime because peak units are more frequently called upon to meet demand.
Figure 24: Yearly average hourly day-ahead wholesale electricity prices, per bidding zone in the CWE region, increased in 2018. The Belgian bidding zone together with the Dutch zone have the highest averaged prices. The Austrian bidding zone, separated from the German bidding zone since the first of October, is not presented as no full year of data is available. Sources: CREG based on data received from EPEX SPOT SE
Figure 25 – Evolution of the monthly averaged day-ahead prices in the CWE region. Source: CREG based on data received from EPEX SPOT
44,58
55,27
39,31
52,53
44,9650,20
34,20
44,66
0
10
20
30
40
50
60
70
80
2007 2008 2009 2010 2011 2012 2013 2014 2015 2016 2017 2018
BE NL FR DE
€/MWh
66,60
77,75
65,14
78,00
38,22
52,37
40,37
57,19
0
0,1
0,2
0,3
0,4
0,5
0,6
0,7
0,8
0,9
1
0
10
20
30
40
50
60
70
80
90
20
12
/01
20
12
/03
20
12
/05
20
12
/07
20
12
/09
20
12
/11
20
13
/01
20
13
/03
20
13
/05
20
13
/07
20
13
/09
20
13
/11
20
14
/01
20
14
/03
20
14
/05
20
14
/07
20
14
/09
20
14
/11
20
15
/01
20
15
/03
20
15
/05
20
15
/07
20
15
/09
20
15
/11
20
16
/01
20
16
/03
20
16
/05
20
16
/07
20
16
/09
20
16
/11
20
17
/01
20
17
/03
20
17
/05
20
17
/07
20
17
/09
20
17
/11
20
18
/01
20
18
/03
20
18
/05
20
18
/07
20
18
/09
20
18
/11
BE NL FR DE
€/MWh
35/112
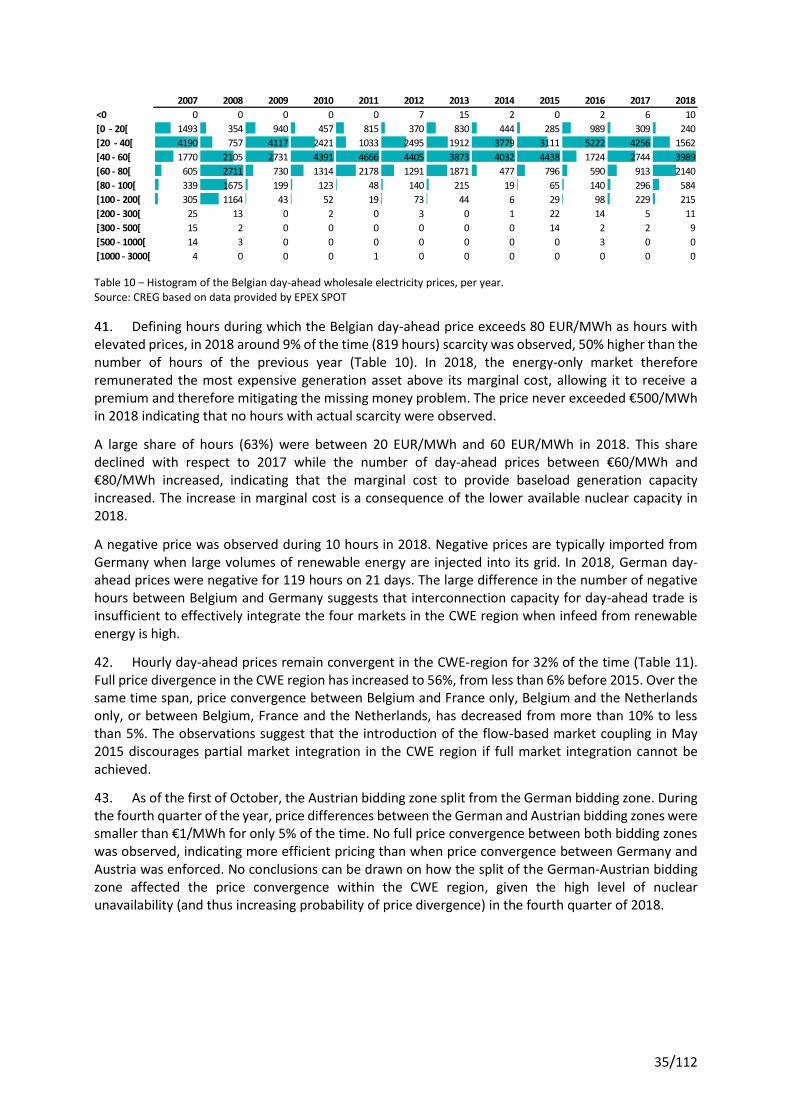
Table 10 – Histogram of the Belgian day-ahead wholesale electricity prices, per year. Source: CREG based on data provided by EPEX SPOT
Defining hours during which the Belgian day-ahead price exceeds 80 EUR/MWh as hours with elevated prices, in 2018 around 9% of the time (819 hours) scarcity was observed, 50% higher than the number of hours of the previous year (Table 10). In 2018, the energy-only market therefore remunerated the most expensive generation asset above its marginal cost, allowing it to receive a premium and therefore mitigating the missing money problem. The price never exceeded €500/MWh in 2018 indicating that no hours with actual scarcity were observed.
A large share of hours (63%) were between 20 EUR/MWh and 60 EUR/MWh in 2018. This share declined with respect to 2017 while the number of day-ahead prices between €60/MWh and €80/MWh increased, indicating that the marginal cost to provide baseload generation capacity increased. The increase in marginal cost is a consequence of the lower available nuclear capacity in 2018.
A negative price was observed during 10 hours in 2018. Negative prices are typically imported from Germany when large volumes of renewable energy are injected into its grid. In 2018, German day-ahead prices were negative for 119 hours on 21 days. The large difference in the number of negative hours between Belgium and Germany suggests that interconnection capacity for day-ahead trade is insufficient to effectively integrate the four markets in the CWE region when infeed from renewable energy is high.
Hourly day-ahead prices remain convergent in the CWE-region for 32% of the time (Table 11). Full price divergence in the CWE region has increased to 56%, from less than 6% before 2015. Over the same time span, price convergence between Belgium and France only, Belgium and the Netherlands only, or between Belgium, France and the Netherlands, has decreased from more than 10% to less than 5%. The observations suggest that the introduction of the flow-based market coupling in May 2015 discourages partial market integration in the CWE region if full market integration cannot be achieved.
As of the first of October, the Austrian bidding zone split from the German bidding zone. During the fourth quarter of the year, price differences between the German and Austrian bidding zones were smaller than €1/MWh for only 5% of the time. No full price convergence between both bidding zones was observed, indicating more efficient pricing than when price convergence between Germany and Austria was enforced. No conclusions can be drawn on how the split of the German-Austrian bidding zone affected the price convergence within the CWE region, given the high level of nuclear unavailability (and thus increasing probability of price divergence) in the fourth quarter of 2018.
2007 2008 2009 2010 2011 2012 2013 2014 2015 2016 2017 2018
<0 0 0 0 0 0 7 15 2 0 2 6 10
[0 - 20[ 1493 354 940 457 815 370 830 444 285 989 309 240
[20 - 40[ 4190 757 4117 2421 1033 2495 1912 3779 3111 5222 4256 1562
[40 - 60[ 1770 2105 2731 4391 4666 4405 3873 4032 4438 1724 2744 3989
[60 - 80[ 605 2711 730 1314 2178 1291 1871 477 796 590 913 2140
[80 - 100[ 339 1675 199 123 48 140 215 19 65 140 296 584
[100 - 200[ 305 1164 43 52 19 73 44 6 29 98 229 215
[200 - 300[ 25 13 0 2 0 3 0 1 22 14 5 11
[300 - 500[ 15 2 0 0 0 0 0 0 14 2 2 9
[500 - 1000[ 14 3 0 0 0 0 0 0 0 3 0 0
[1000 - 3000[ 4 0 0 0 1 0 0 0 0 0 0 0

36/112
Table 11 – Full hourly price convergence (≤ 0,01 EUR/MWh) between Belgian day-ahead prices and the day-ahead prices in the other bidding zones in the CWE region, per year and for each month of 2018 Sources: CREG based on data provided by EPEX SPOT
Price volatility in 2018 did not change much compared with the situation in 2017 (Figure 26).
Figure 26 – Volatility of the Belgian day-ahead price, described by three statistics, per year Source: CREG based on data provided by EPEX SPOT
BE = DE BE ≠ DE BE = DE BE ≠ DE BE = DE BE ≠ DE BE = DE BE ≠ DE
2007 0,29% 62,26% 0,11% 26,27% 0,06% 9,45% 0,00% 1,56%
2008 0,11% 69,13% 0,06% 15,21% 0,02% 14,74% 0,00% 0,73%
2009 0,11% 56,69% 0,01% 13,22% 0,06% 28,32% 0,00% 1,59%
2010 8,08% 52,35% 0,07% 26,26% 0,21% 11,79% 0,01% 1,23%
2011 65,82% 5,16% 1,52% 26,69% 0,10% 0,25% 0,00% 0,46%
2012 46,61% 12,85% 11,01% 14,97% 1,90% 11,24% 0,00% 1,42%
2013 14,76% 19,01% 17,28% 20,50% 0,68% 25,05% 0,01% 2,71%
2014 18,66% 10,99% 4,97% 11,89% 5,83% 42,29% 0,00% 5,35%
2015 18,95% 10,16% 0,67% 13,78% 0,27% 14,28% 0,06% 41,83%
2016 34,53% 1,80% 0,42% 7,90% 1,66% 3,72% 0,13% 49,84%
2017 34,19% 3,61% 0,71% 6,31% 1,39% 5,00% 0,14% 48,65%
2018 32,57% 4,43% 1,27% 1,87% 0,00% 3,49% 0,00% 56,37%
JAN 34,41% 8,87% 0,54% 6,18% 0,00% 6,32% 0,00% 43,68%
FEB 30,06% 18,60% 0,00% 2,38% 0,00% 2,83% 0,00% 46,13%
MAR 29,03% 14,78% 0,00% 3,76% 0,00% 6,72% 0,00% 45,70%
APR 37,78% 3,75% 5,00% 0,42% 0,00% 5,14% 0,00% 47,92%
MAY 12,23% 0,00% 5,24% 0,94% 0,00% 6,05% 0,00% 75,54%
JUN 16,39% 0,00% 2,92% 0,00% 0,00% 3,19% 0,00% 77,50%
JUL 63,71% 0,13% 1,48% 0,00% 0,00% 2,02% 0,00% 32,66%
AUG 61,02% 2,55% 0,00% 0,00% 0,00% 0,81% 0,00% 35,62%
SEP 36,53% 0,28% 0,00% 1,94% 0,00% 1,11% 0,00% 60,14%
OCT 20,56% 2,96% 0,00% 4,17% 0,00% 1,61% 0,00% 70,70%
NOV 21,94% 0,14% 0,00% 0,14% 0,00% 1,67% 0,00% 76,11%
DEC 26,34% 2,02% 0,00% 2,42% 0,00% 4,30% 0,00% 64,92%
BE = FR BE ≠ FR
BE = NL BE ≠ NL BE = NL BE ≠ NL
10,5
12,2
17,5
18,0
13,8
13,6
0
5
10
15
20
25
30
35
2007 2008 2009 2010 2011 2012 2013 2014 2015 2016 2017 2018
Average hourly standard deviation during the day Average standard deviation of the daily baseload price
Average standard deviation of the monthly baseload price
€/MWh

37/112
Trade on the Belgian day-ahead market increased by 8.0 TWh in 2018, or 45% compared to 2017 (Table 12). The cause of the increase in trade was increased buyer interest in importing electricity from abroad, probably driven by nuclear unavailability in Belgium. Imports doubled to 15.4 TWh and exports became almost non-existent at 0.2 TWh. Day-ahead trade on the power exchange accounted for more than a third of the Elia load, the highest share since records began. Complemented with the increase in average Belgian day-ahead prices, the value of contracts concluded on the Belgian day-ahead spot exchange increased 80% in 2018 compared to 2017, to 1.5 trillion euro (Figure 27).
Buy volumes increased gradually over the course of the year, achieving peak volumes during the last quarter of the year. Sell volumes remained relatively flat throughout the year indicating that imports are responsible for supplying the increase in buy volumes throughout the year (Figure 28).
The role of the day-ahead power exchange in fairly and objectively creating transparent price signals is important. Day-ahead prices formed on power exchanges determine commercial cross-border exchanges and are used as references for the majority of bilateral contracts. Consequently, the CREG expects market participants to trade, in day-ahead and by efficiently using all products, all available generation and demand capacity at a price that is cost-reflective (i.e. marginal costs). Scarcity on the day-ahead market should be the result of the fair and competitive interplay of demand and supply, not an artificially created opportunity by not offering available generation and demand capacity.
Table 12 – Traded volumes and commercial cross-border exchanges on the Belgian day-ahead power exchange, including the share of traded volume in terms of the Elia load Source: CREG based on data provided by EPEX SPOT
Buy Sell Trade Import Export Net Import Trade / Load ELIA
2007 6,8 4,8 7,6 2,7 0,8 2,0 8,6
2008 10,4 4,3 11,1 6,8 0,7 6,1 12,6
2009 6,0 9,1 10,1 1,0 4,1 -3,1 12,4
2010 9,6 8,9 11,8 2,9 2,3 0,7 13,7
2011 10,3 9,2 12,4 3,1 2,1 1,1 14,8
2012 15,8 8,9 16,5 7,6 0,6 6,9 20,1
2013 16,1 11,2 17,1 5,9 1,0 4,9 21,3
2014 19,6 9,5 19,8 10,3 0,2 10,1 25,6
2015 23,6 9,6 23,7 14,0 0,0 14,0 30,7
2016 18,3 11,9 19,6 7,6 1,2 6,4 25,3
2017 16,6 10,1 17,9 7,7 1,3 6,4 23,1
2018 25,8 10,6 25,9 15,4 0,2 15,2 33,8
2007-2018 178,9 108,2 193,5 85,1 14,4 70,7 20,2
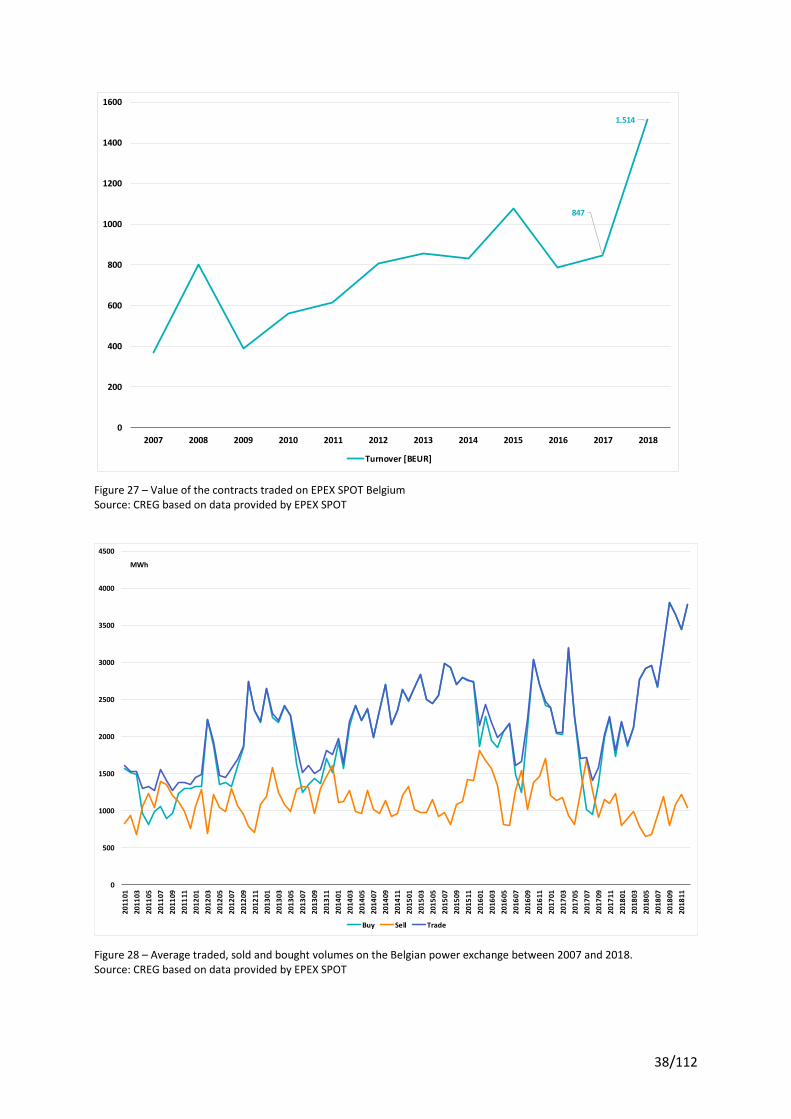
38/112
Figure 27 – Value of the contracts traded on EPEX SPOT Belgium Source: CREG based on data provided by EPEX SPOT
Figure 28 – Average traded, sold and bought volumes on the Belgian power exchange between 2007 and 2018. Source: CREG based on data provided by EPEX SPOT
847
1.514
0
200
400
600
800
1000
1200
1400
1600
2007 2008 2009 2010 2011 2012 2013 2014 2015 2016 2017 2018
Turnover [BEUR]
0
500
1000
1500
2000
2500
3000
3500
4000
4500
2011
01
2011
03
2011
05
2011
07
2011
09
2011
11
2012
01
2012
03
2012
05
2012
07
2012
09
2012
11
2013
01
2013
03
2013
05
2013
07
2013
09
2013
11
2014
01
2014
03
2014
05
2014
07
2014
09
2014
11
2015
01
2015
03
2015
05
2015
07
2015
09
2015
11
2016
01
2016
03
2016
05
2016
07
2016
09
2016
11
2017
01
2017
03
2017
05
2017
07
2017
09
2017
11
2018
01
2018
03
2018
05
2018
07
2018
09
2018
11
Buy Sell Trade
MWh

39/112
Figure 29 – Average change of the Belgian day-ahead price in terms of additional supply or additional demand, 2007-2018 Source: CREG based on data provided by EPEX SPOT
Average day-ahead price robustness in 2018 declined with respect to 2016 and 2017 (Figure 29). Similarly to the previous 2 years, the last quarter of the year showed the highest day-ahead price sensitivity (Figure 30).
Figure 30 – Average absolute sensitivity of the Belgian day-ahead price in terms of 500 MWh/h additional supply or 500 MWh/h additional demand Source: CREG based on data provided by EPEX SPOT

40/112
3.3.2. Intraday wholesale electricity market for delivery in Belgium
In 2018 the traded volume on the intraday power exchange increased slightly compared to the volume traded in 2017 (Table 13). Volumes have increased by 1% since 2017. The yearly traded volume on the intraday market equates to 7.8% of the yearly traded volume on the day-ahead market (see Table 12).
In 2018, a volume was traded during 8,401 hours, compared to 8,489 hours in 2017. The average volume traded during these hours increased from 235 MWh/h in 2017 to 240 MWh/h in 2018 suggesting the intraday market becomes sufficiently liquid for market participants to find a counterparty for their trades.
Intraday prices were on average 1,02 EUR/MWh higher than day-ahead prices (Table 13). Except for the year 2015, the spread in 2018 is the lowest of the observed period, pointing to a continuously decreasing opportunity cost for exercising the option to trade baseload power on the intraday market instead of the day-ahead market. Correlation between day-ahead and intraday prices nonetheless decreased, from 78% in 2017 to 72% in 2017, indicating a continued reduced statistical relationship.
The hourly spread between the day-ahead and intraday prices is lower than 5 EUR/MWh for 50% of the time (Figure 35). It can be as low as -237.3 EUR/MWh and as high as 554.6 EUR/MWh. The tail of the histogram of the price spread is longer on the positive side.
Table 13 – Intraday prices and volumes for delivery of electricity in Belgium, 2008-2018. Export and import volumes are provided since 2014. Source: CREG based on data provided by EPEX SPOT
Figure 31 – Histogram of hourly differences between the day-ahead and intraday prices in 2018 Source: CREG based on data provided by EPEX SPOT

41/112
3.3.3. Long-term wholesale electricity market for delivery in Belgium
The yearly averaged year-ahead wholesale electricity price in Belgium increased to 51.0 €/MWh in 2018 (Figure 32). Year-on-year price increases of 36% were observed in all bidding zones in the CWE region with the exception of France, where the year-on-year increase was 28%. This signals that, on average, market participants expect the average day-ahead price in 2019 to be higher than in 2018 in the CWE region. Year-ahead prices gradually increased throughout 2018 and show a similar profile in each bidding zone. Market participants therefore confidently expect price spreads to remain in the CWE-region during 2018 (Figure 33).
On 26 June 2017 the first long-term contract for delivery in the Austrian bidding zone was traded. As 2018 is the first full year of data, only 2018 data regarding prices for delivery in the Austrian bidding zone is included. The average yearly price is 46.64 €/MWh, or 2.5 €/MWh higher than the average yearly price for delivery in the German bidding zone.
Figure 32 – Yearly averaged year-ahead wholesale electricity prices in the CWE region. Prices for delivery in only the Austrian bidding zone, in contrast to the joint German-Austrian bidding zone, are only shown if a full year of data is available. Source: CREG based on data provided by ICE Endex and EEX
37,27
51,02
36,18
49,00
38,28 48,98
32,42
44,15
46,64
0
10
20
30
40
50
60
70
80
90
2007 2008 2009 2010 2011 2012 2013 2014 2015 2016 2017 2018
BE Y-1 NL Y-1 FR Y-1 DE Y-1 AT Y-1
€/MWh
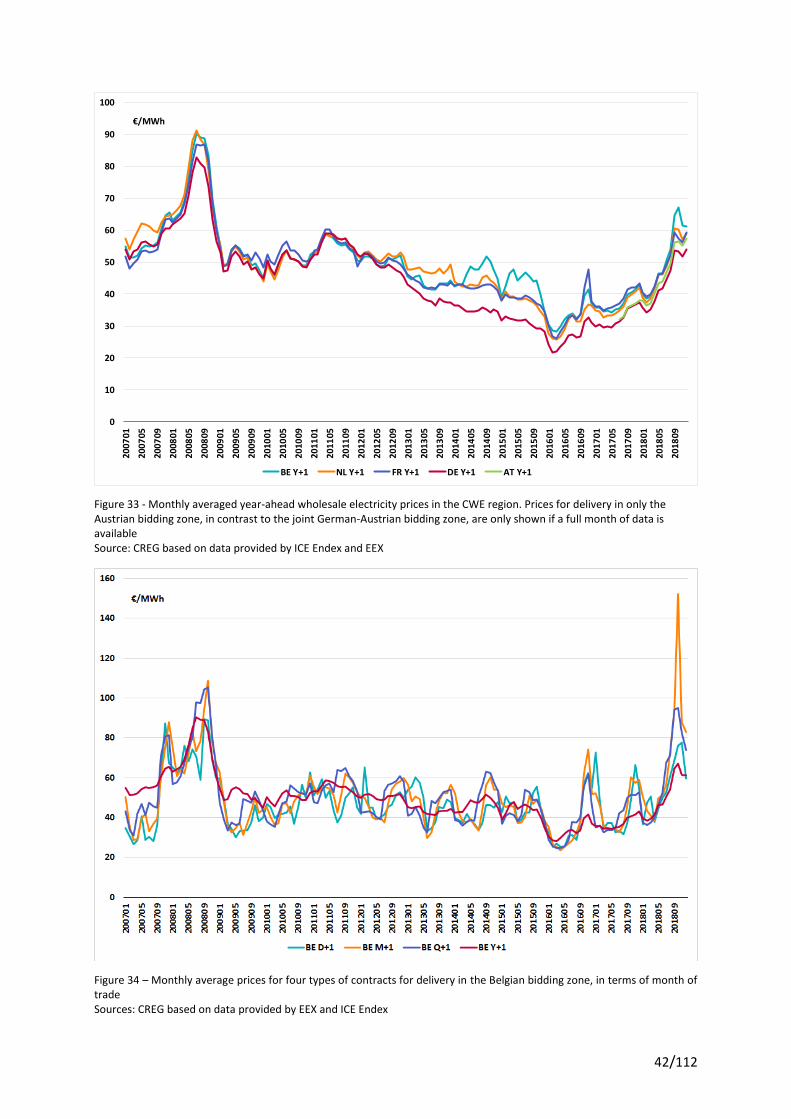
42/112
Figure 33 - Monthly averaged year-ahead wholesale electricity prices in the CWE region. Prices for delivery in only the Austrian bidding zone, in contrast to the joint German-Austrian bidding zone, are only shown if a full month of data is available Source: CREG based on data provided by ICE Endex and EEX
Figure 34 – Monthly average prices for four types of contracts for delivery in the Belgian bidding zone, in terms of month of trade Sources: CREG based on data provided by EEX and ICE Endex
0
10
20
30
40
50
60
70
80
90
100
2007
01
2007
05
20
07
09
20
08
01
20
08
05
20
08
09
2009
01
2009
05
20
09
09
20
10
01
20
10
05
20
10
09
2011
01
2011
05
2011
09
20
12
01
20
12
05
20
12
09
20
13
01
2013
05
2013
09
20
14
01
20
14
05
20
14
09
20
15
01
2015
05
2015
09
2016
01
20
16
05
20
16
09
20
17
01
20
17
05
2017
09
2018
01
20
18
05
20
18
09
BE Y+1 NL Y+1 FR Y+1 DE Y+1 AT Y+1
€/MWh
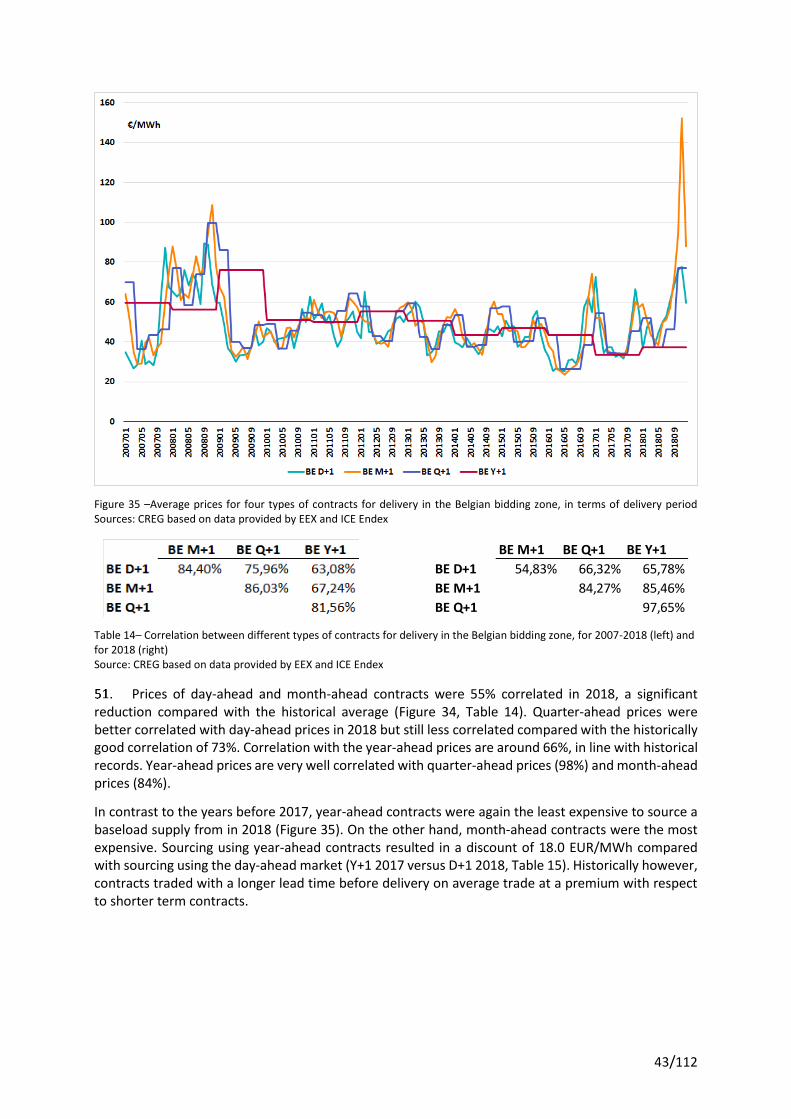
43/112
Figure 35 –Average prices for four types of contracts for delivery in the Belgian bidding zone, in terms of delivery period Sources: CREG based on data provided by EEX and ICE Endex
Table 14– Correlation between different types of contracts for delivery in the Belgian bidding zone, for 2007-2018 (left) and for 2018 (right) Source: CREG based on data provided by EEX and ICE Endex
Prices of day-ahead and month-ahead contracts were 55% correlated in 2018, a significant reduction compared with the historical average (Figure 34, Table 14). Quarter-ahead prices were better correlated with day-ahead prices in 2018 but still less correlated compared with the historically good correlation of 73%. Correlation with the year-ahead prices are around 66%, in line with historical records. Year-ahead prices are very well correlated with quarter-ahead prices (98%) and month-ahead prices (84%).
In contrast to the years before 2017, year-ahead contracts were again the least expensive to source a baseload supply from in 2018 (Figure 35). On the other hand, month-ahead contracts were the most expensive. Sourcing using year-ahead contracts resulted in a discount of 18.0 EUR/MWh compared with sourcing using the day-ahead market (Y+1 2017 versus D+1 2018, Table 15). Historically however, contracts traded with a longer lead time before delivery on average trade at a premium with respect to shorter term contracts.
BE M+1 BE Q+1 BE Y+1
BE D+1 54,83% 66,32% 65,78%
BE M+1 84,27% 85,46%
BE Q+1 97,65%

44/112
Table 15 – Average prices for four types of contracts for delivery in Belgium, per year of delivery, 2007-2018 Source: CREG based on data provided by EEX and ICE Endex
45/112
INTERCONNECTIONS
HISTORICAL BACKGROUND : SIGNIFICANT EVENTS
2001 ETSO (the predecessor to ENTSO-E, i.e. the member organization of all European transmission
system operators) publishes its guidelines regarding methodologies for the calculation of available
transmission capacities (ATC) for cross-border interconnections. In 2016, these methodologies are still
being applied by some Transmission System Operators, among which Elia, for the calculation of
available interconnection capacities.
2005 The Belgian, Dutch, French, Luxembourg and German governments found the Pentalateral
Energy Forum (PLEF). This Forum is established to optimize and harmonize the methodologies applied
for the calculation and allocation of cross-border interconnection capacities between the different
countries involved, among other things. The PLEF consists of representatives of Ministries, National
Regulatory Authorities, Transmission System Operators, Power Exchanges and the Market Parties
Platform.
2007 In February, CWE regulators publish their action plan to strengthen the integration of their
power markets. This action plan anticipates the development and implementation of a flow-based
market coupling for the CWE bidding zones. In June, all Ministers of the CWE countries sign, jointly
with the representatives of TSOs, power exchanges, regulators and market participants, a
Memorandum of Understanding to develop and implement the flow-based market coupling for the
day-ahead timeframe.
2008 In June, CWE TSOs and power exchanges, through the Joint Steering Committee, unilaterally
announce the implementation of an ATC-based approach to couple the markets in the CWE region.
2010 Elia develops and submits a proposal for a new general model for the calculation of the total
transfer capacity and the transmission reliability margin. In addition, Elia submits a proposal for the
calculation of day-ahead transmission capacity to the CREG, for approval. In October, the CREG decides
not to approve the proposal from Elia, due to the fact that it considers the proposal to be in breach of
European legislation on the non-discrimination of domestic and cross-zonal exchanges. In light of other
benefits of increased market coupling in the CWE region, the CREG decides nonetheless to authorise
the implementation of the proposed methodology.
2011 Elia develops and submits a proposal for the calculation for yearly and monthly transmission
capacities as well as the transmission reliability margin. The CREG once again decides not to approve,
based on the same argumentation as above, but takes note of the implementation by Elia of the
proposed methodology. Elia appeals the CREG’s decision but, in 2012, the Court of Appeal rules that
Elia’s arguments for the appeal are unfounded.
2013 The CWE Flow-Based Market Coupling project starts the first “external parallel run”, in order
to compare the simulated flow-based market results with the ATC calculations on a weekly basis. In
August, the CWE FBMC Project develops the first FBMC “approval package”, containing a description
of the flow-based market coupling methodology. This document forms the basis for the first
submission of a proposal by Elia for a day-ahead flow-based market coupling methodology.

46/112
2014 The CWE FBMC Project starts running daily “internal parallel runs”, starting from February. In
May, the CWE FBMC Project submits a second approval package14. CWE regulators consider the
package to be incomplete and continue the development and discussions with the CWE FBMC Project
partners. In June, CWE regulators organize a public consultation on the FBMC. In August, the CWE
FBMC Project submits a third, adapted version of the approval package15. Between then and March
2015, the partners continue modifying and adding to the approval package, in cooperation with CWE
regulators. Over the following months, project partners address issues related to the functioning of
FBMC in times of scarcity and flow factor competition.
2015 In February, Elia submits for approval the methodology for day-ahead flow-based market
coupling of the CWE markets, to the CREG. In March, they publish their views on FBMC in a position
paper16. In April, the CREG rules that the proposal is in breach of Regulation 714/2009, specifically the
articles related to non-discrimination of internal versus external exchanges17. However, in light of the
expected benefits of ongoing market coupling implementation - in particular the social welfare gain
compared to ATC expected by the results of the parallel runs – the CREG decides to approve the
proposal conditionally on the implementation of a number of improvement proposals, by the CREG
and other CWE regulators. In May, the CWE FBMC Project operates the first successful business day of
day-ahead flow-based market coupling. In August, Regulation (EU) 2015/1222 (“CACM Guidelines”)
enters into force, providing a legal framework for regulators, TSOs and power exchanges (“NEMOs”)
to develop common methodologies for all aspects related to single day-ahead and intraday market
coupling of European bidding zones. For long-term (yearly and monthly) market coupling, the CREG
approves, in October, the early implementation of the Harmonized Auction Rules and, for the Belgium-
Netherlands and Belgium-France borders, the introduction of “Financial Transmission Rights –
options”. This replaces the earlier approach where “Physical Transmission Rights with Use-it-or-sell-it”
were used.
2016 Regional (voluntary) cooperation shifts towards a more closely integrated, European approach
for coupling markets. With the introduction of the CACM Guideline in 2015, the single day-ahead and intraday coupling officially become the pillars of the “Target Model” for the design of European electricity Markets. Regulation (EU) 2016/1719 establishing a guideline on forward capacity allocation (the “FCA Guideline”) does the same for forward market coupling. With the introduction of the CACM Guideline in 2015 and the FCA Guideline in 2016, the market coupling of the Belgian bidding zone and other bidding zones can be discussed on a geographical basis (i.e. regional versus European) or on a temporal basis (i.e. long-term markets versus short-term markets). On 17 November 2016, ACER issued its Decision 06-2016 on Capacity Calculation Regions18. With this decision, taken after all regulatory authorities failed to agree on the all TSOs proposal pursuant to art. 9(6)(b) of the CACM Guideline, ACER confirmed that the future regional aspects of both the CACM as well as the FCA Guidelines should be the CORE CCR19, rather than two separate CWE and CEE regions. The most important consequence of ACER’s Decision 06-2016 concerns the regional scope of capacity calculation methodologies and related proposals. Starting from the moment of this decision, TSOs and
14 http://www.elia.be/~/media/files/Elia/Projects/CWE-Flow_Based/CWE_FBMC_approval-document_06-2014.pdf. 15 http://www.jao.eu/support/resourcecenter/overview?parameters=%7B%22IsCWEFBMC%22%3A%22True%22%7D. 16 http://www.creg.info/pdf/Opinions/2015/b1410/CWE_NRA_Position_Paper.pdf. 17 http://www.creg.be/nl/publicaties/beslissing-b150423-cdc-1410. 18 http://www.acer.europa.eu/Official_documents/Acts_of_the_Agency/Individual%20decisions/ACER%20Decision%2006-
2016%20on%20CCR.pdf . 19 The Core Capacity Calculation Region consists of the borders between France, Belgium, the Netherlands, Germany,
Luxemburg, Austria, Czeckia, Slovakia, Hungary, Poland and Romania. https://www.entsoe.eu/major-projects/network-code-implementation/cacm/core-ccr/Pages/default.aspx .

47/112
NEMOs of the CORE CCR need to start developing a flow-based market coupling methodology for the day-ahead and intraday timeframes, to be submitted for approval in Q3 2017. In November, ACER published its Recommendation 02/2016 on the Common Capacity Calculation and Redispatching and Countertrading cost sharing methodologies20, recalling the objectives of the CACM Regulation to establish a well-functioning internal electricity market through the effective implementation of efficient, transparent and non-discriminatory common methodologies. The results of the first one and a half years of CWE FBMC are well below expectations. In 2016, CWE cross-zonal exchanges are 3,700 MW on average during congested hours, a decrease of 900 MW compared to the average of 4,600 MW obtained with ATC in 2014. Internal lines in the Amprion region appear to be the most constraining elements in the CWE FBMC. In December, under regional pressure, Amprion applies winter ratings on these lines, increasing the capacity by 20% compared to summer values. 2017 The persistent underperforming results of the day-ahead market coupling with CWE FBMC prompts action on the part of the NRA. In March 2017, the CREG proposes a revised CBCO-selection method to address the problem of discrimination of domestic versus cross-zonal trade being at the basis of the low cross-zonal available capacity in the CWE FBMC. In December 2017, the CREG publishes Study 1687 on the impact of TSO discretionary actions on the functioning and design of the CWE FBMC21. In December 2017, CWE regulators agree upon a set of short-term and medium-term solutions to remedy the situation of low cross-zonal capacities in the CWE region. This agreement lies at the basis of the 20% minimum RAM threshold applied on 26 April 2018 as a short-term solution, and the CNEC-selection study to be submitted by CWE TSOs on 1 May 2018 towards a medium-term solution. In June 2017, CWE TSOs submit a common proposal for the capacity calculation for the intraday timeframe with planned go-live date in October 2018. In September, CWE NRAs compose a common
position paper with requests for clarifications and improvements of the proposed methodology22. In November CWE TSOs communicate delays for the start of the external parallel runs and the go-live of the new methodology.
Following the entry into force of the CACM Guidelines and ACER’s Decision 06-2016 to establish the
Core capacity calculation regions, TSOs of the Core CCR started to develop the methodologies for
regional capacity calculation and congestion management. In September 2017, the Core TSOs
developed and submitted a proposal for the coordinated capacity calculation methodology, for the
approval of all Core regulatory authorities. The aim of this methodology is to develop and establish
flow-based capacity calculation methodologies for the day-ahead and intraday timeframes.
Status update 2018 The CWE NRA agreement to apply a 20% minimum RAM threshold on CNECs is implemented as of
business day 26 April 2018. The implementation of this short-term measure is considered as a first
important step to structurally improve CWE FBMC performance. With a few exceptions, this minimum
RAM threshold is respected in all hours. One part of the exceptions were communicated as being due
to manual input errors, given that the processes and tools used to implement this 20% minimum RAM
threshold had not yet been fully tested and industrialized. CWE TSOs communicate that such errors
20
https://www.acer.europa.eu/Official_documents/Acts_of_the_Agency/Recommendations/ACER%20Recommendation%2002-2016.pdf 21 http://www.creg.be/nl/publicaties/studie-f1687 22 See annex of CREG Decision 1732 of 22 February 2018 on the methodology for calculating cross-zonal capacities in the intraday time frame : http://www.creg.be/nl/publicaties/beslissing-b1732
48/112
will no longer occur once the fully industrialized solution, expected 1 October 2018, is implemented.
Another part of the exceptions were communicated as being due to system security issues. Market
parties ask for improved transparency and monitoring of these so-called “minRAM derogations”. In
December 2018, CWE NRAs propose a template for extensive monitoring of those cases.
In parallel to the application of the 20% minimum RAM threshold, CWE TSOs prepare a CNEC selection
study following the CWE NRA agreement of December 2017. Based on this study, submitted in May
2018, CWE TSOs conclude to only have the 20% minRAM implemented and to keep the 5% PTDF-
threshold as a single CNEC selection criterium. Given the lack of evidence to back up this conclusion,
the study is not published and not approved by CWE NRAs.
In June 2018, CWE TSOs submit an updated CWE FBMC approval package related to the introduction
of the German/Luxembourg-Austrian (DE/LU-AT) bidding zone border on 1 October 2018 and the
implementation of the 20% minimum RAM threshold. In August 2018 and in addition to the conditions
of the CWE NRA common position paper of 2015, CWE NRAs formulate a common position on this
updated approval package and agree on additional conditions to be fulfilled by CWE TSOs. This includes
improvement of the monitoring on minRAM derogations and compliance with transparency
obligations. In its decision of September 2018, the CREG approves the updates made to the original
CWE FBMC approval package but does not approve it in its entirety since the conditions for approval
of the CWE FBMC approval package in 2015 have not yet been fulfilled. In the same light, CWE NRAs
agree on the organization of a high-level meeting to be held in early 2019 to ensure progress on the
fulfilment of conditions of this 2015 CWE NRA common position paper.
In June 2018, CORE TSOs submit the amended version of the CORE capacity calculation methodology
for the day-ahead and intraday timeframe. With this methodology, the markets of both the CWE and
the CEE region will be coupled with FBMC. CWE NRAs do not reach an agreement on whether to
approve the methodology or not. In August 2018, CWE NRAs refer the methodology to ACER. ACER
starts the discussion with CWE NRAs and CWE TSOs and launches a public consultation of its draft
decision in December 2018.
SPECIAL TOPICS: IMPACT OF SIGNIFICANT EVENTS AND STRUCTURAL IMPROVEMENTS OF CWE FBMC IN 2018
The day-ahead CWE FBMC underwent significant events and structural improvements in 2018. In this
special topic, different market coupling performance indicators are analysed to understand if and to
what extend these changes have affected or improved the market coupling results, notably:
1) The implementation of the 20% minRAM threshold on 28 April 2018. This measure is expected
to improve overall CWE FBMC performance. Specifically, this measure is expected to decrease
the number of active internal CNECs with low PTDF and very low RAM which heavily constrained
the market coupling since the start of CWE FBMC in May 2015. Since these active internal CNECs
with very low RAM were associated with low cross-border exchanges and very high shadow
prices, the minimum RAM threshold is expected to increase cross-zonal exchanges and decrease
shadow prices. It is shown that the congestion shifts from internal CNECs with low PTDF and low
RAM to internal and cross-zonal CNECs with higher PTDF- and RAM-values. This is an obvious
consequence of the fact that the number of limiting internal CNECs is reduced, leading to higher
power exchanges between bidding zones and hence higher loading of cross-zonal CNECs.
2) The inclusion of the DE/LU-AT bidding zone border on 1 October 2018. This measure is
expected to improve overall CWE FBMC performance. The decision to split the large former
49/112
DE/LU/AT bidding zone into two separate bidding zones is expected to reduce redispatching
needs in the German bidding zone and provide more cross-zonal capacity in the CWE and CEE
capacity calculation regions. The increase of available cross-zonal capacity should arise from
three aspects, i.e. firstly, a decrease of the preloading of CNECs in the basecase giving rise to
higher RAM values, secondly, a decrease in loop flows generated by the DE/LU bidding zone
compared to the DE/LU/AT bidding zone and, thirdly, the Austrian bidding zone net position as
extra optimization variable in the FBMC social welfare optimization. The increase of available
cross-zonal capacity allows for higher power exchanges between the bidding zones.
3) The removal of the DE/LU/AT and FR external constraints on 1 October 2018. This measure is
expected to increase the maximum volume of feasible CWE cross-zonal exchanges. The
DE/LU/AT export limit having constrained the market was 477 hours in 2017, and it is expected
that the removal of this export limit will have a significant impact on the average and maximum
CWE cross-zonal exchanges, further improve price convergence and contribute to increased
security of supply during scarcity conditions.
4) The increase of the BE import constraint from 4,500 MW to 5,500 MW on 1 July 2018. This
measure is expected to increase the maximum import capacity for Belgium, at least in
combination with the aforementioned changes (minimum RAM threshold, introduction of the
DE/LU-AT bidding zone border and removal of DE/AT/LU and FR export limits). Since the start of
CWE FBMC in 2015, the Belgian import constraint of 4,500 MW had never been limiting because
the flow based domain in the market-likely corners was been constrained by other much more
limiting network constraints. With the aforementioned changes, however, it is expected that the
flow based domain is increased and that the former import limit of 4,500 MW can be exceeded
when Belgium is willing to pay high prices.
5) The unplanned outages of several Belgian nuclear reactors in winter period (October 2018 –
February 2019). From October to December, these power plant outages represented a decrease
of the total Belgian generation capacity of roughly 1,500 MW to 2,500 MW compared to the
same period in 2017, triggering scarcity situation alerts and the implementation of several
adequacy measures23. A major unknown in the adequacy equation was the available Belgian
import capacity from the CWE region. It has been shown that, thanks to the improvements in
CWE FBMC, Belgium was able to import much more than what was formerly the case and that
the adequacy patch was never triggered.
6) The unplanned outage of one Phase Shift Transformer (PST) in Van Eyck from 21 September
2018 to 14 December 2018. The same moment that Belgium faced adequacy risks due to the
simultaneous outages of several nuclear power plants units, one of the PSTs in Van Eyck at the
Belgian northern border failed. This PST outage was expected to decrease the Belgian import
capacity since PSTs are used to push back loop flows which reduce the commercial capacity at
the Belgian borders. The loss of one PST means that the amount of loop flows which can be
pushed back decreases, at least if the operational procedures concerning the use of the PST tap
positions are maintained.
The analysis shows that the performance of CWE FBMC improved in 2018, starting with the
implementation of the 20% minRAM threshold at the end of April and with the further improvements
related to the increase of the Belgian import limit, the removal of the DE/AT/LU and FR export limit
and the introduction of the DE/LU-AT bidding zone border. Combined with the tight conditions on the
23 For an elaborated study on the impact of the unavailability of Belgian nuclear power plants on the electricity wholesale market, see CREG study (F)1950 published on 20 June 2019 (available in French and Dutch).

50/112
Belgian market from October 2018 on, these improvements made it possible to observe record values
for Belgian imports. With respect to the location of congestion, one observes a shift from congestion
on internal lines with low PTDF and very low RAM towards internal lines and cross-zonal lines with
higher PTDF and higher RAM. This shift is associated with a reduction of the shadow prices.
Figure 36: For all months of 2018 except for September, the average RAM on the active CNEC, expressed as a percentage of the thermal capacity (% Fmax), exceeded the averages obtained in 2016 and 2017.
Figure 37: For all months of 2018 except for September, the frequency of active CNECs with less than 20% RAM was lower compared to 2016 and 2017. Despite the 20% minimum RAM threshold only being formally implemented from end of April 2018 on, the RAM-values on internal CNECs already increased earlier thanks to the implementation of winter limits and DLR on highly impacting CNECs by Amprion. The impact of the 20% minRAM implementation is most notable in the months October to December when the number of active CNECs with RAM values inferior to 20% Fmax were highest. In the summer months the improvement is less pronounced.
0%
10%
20%
30%
40%
50%
60%
70%
1 2 3 4 5 6 7 8 9 10 11 12
Ave
rage
RA
M a
ctiv
e C
NEC
(%
Fm
ax)
2016 2017 2018
20% minRAM
°DE/LU-AT bidding zones
0
100
200
300
400
500
600
700
800
900
1 2 3 4 5 6 7 8 9 10 11 12
Co
un
t R
AM
act
ive
CN
EC <
20
% F
ma
x
2016 2017 2018
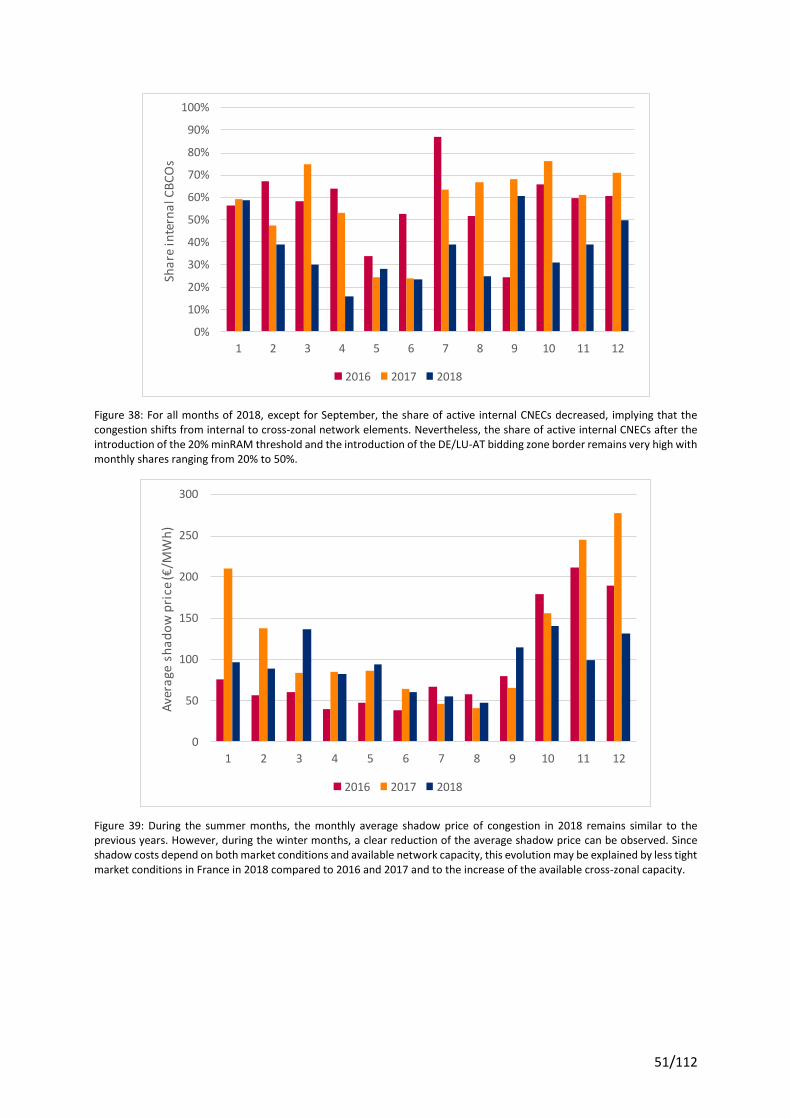
51/112
Figure 38: For all months of 2018, except for September, the share of active internal CNECs decreased, implying that the congestion shifts from internal to cross-zonal network elements. Nevertheless, the share of active internal CNECs after the introduction of the 20% minRAM threshold and the introduction of the DE/LU-AT bidding zone border remains very high with monthly shares ranging from 20% to 50%.
Figure 39: During the summer months, the monthly average shadow price of congestion in 2018 remains similar to the previous years. However, during the winter months, a clear reduction of the average shadow price can be observed. Since shadow costs depend on both market conditions and available network capacity, this evolution may be explained by less tight market conditions in France in 2018 compared to 2016 and 2017 and to the increase of the available cross-zonal capacity.
0%
10%
20%
30%
40%
50%
60%
70%
80%
90%
100%
1 2 3 4 5 6 7 8 9 10 11 12
Sha
re i
nte
rna
l CB
CO
s
2016 2017 2018
0
50
100
150
200
250
300
1 2 3 4 5 6 7 8 9 10 11 12
Ave
rage
sh
ad
ow
pri
ce (€
/MW
h)
2016 2017 2018
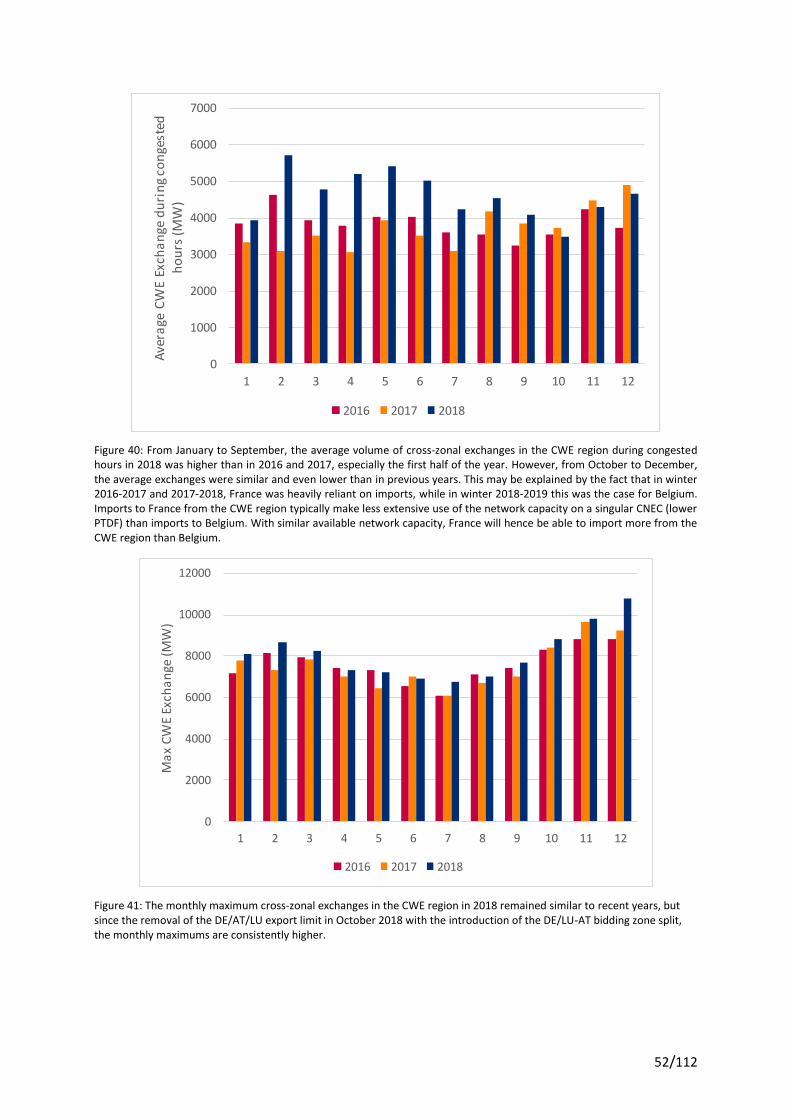
52/112
Figure 40: From January to September, the average volume of cross-zonal exchanges in the CWE region during congested hours in 2018 was higher than in 2016 and 2017, especially the first half of the year. However, from October to December, the average exchanges were similar and even lower than in previous years. This may be explained by the fact that in winter 2016-2017 and 2017-2018, France was heavily reliant on imports, while in winter 2018-2019 this was the case for Belgium. Imports to France from the CWE region typically make less extensive use of the network capacity on a singular CNEC (lower PTDF) than imports to Belgium. With similar available network capacity, France will hence be able to import more from the CWE region than Belgium.
Figure 41: The monthly maximum cross-zonal exchanges in the CWE region in 2018 remained similar to recent years, but since the removal of the DE/AT/LU export limit in October 2018 with the introduction of the DE/LU-AT bidding zone split, the monthly maximums are consistently higher.
0
1000
2000
3000
4000
5000
6000
7000
1 2 3 4 5 6 7 8 9 10 11 12
Ave
rage
CW
E Ex
cha
nge
du
rin
g co
nge
sted
h
ou
rs (M
W)
2016 2017 2018
0
2000
4000
6000
8000
10000
12000
1 2 3 4 5 6 7 8 9 10 11 12
Ma
x C
WE
Exch
an
ge (
MW
)
2016 2017 2018

53/112
Figure 42: The combination of CWE FBMC improvements such as the introduction of the 20% minRAM and the removal of the DE/AT/LU export constraint, combined with the increase of the Belgian import limit in June 2018 from 4,500 MW to 5,500 MW, enabled higher Belgian import capacities than previous years. Especially in September – December 2018, when Belgium faced tight market conditions, Belgian import values hit historical records.
STATISTICS
4.3.1. Long-term transmission capacity auctions
Yearly auctions
Auctioned volumes of long-term transmission rights at the Belgian borders have been relatively stable over the past 10 years, except the auctioned volumes at the southern border in the export direction (BE=>FR). In 2016, there the yearly auctioned capacity dropped from 400 MW to 200 MW and in 2018 this value was further reduced down to 100 MW due to the outage planning related to HTLS upgrade. The volumes of long-term capacity remain the highest at the southern border in the import direction, despite a small decrease from 1,448 MW in 2017 to 1,400 MW in 2018.
Revenues of the yearly auctioned volumes in 2018 were 40.23 M€, comparable to the 41.95 M€ in 2017. Compared to 2017, the price for transmission capacity from France to Belgium (FR=>BE) increased, while the price for transmission capacity from the Netherlands to Belgium (NL=>BE) decreased. Prices in the export direction increased slightly at both borders (BE=>FR and BE=>NL).
40044332
46264385
4195
5196
0
1000
2000
3000
4000
5000
6000
1 2 3 4 5 6 7 8 9 10 11 12
Mo
nth
ly m
ax
BE
imp
ort
net
po
siti
on
(MW
)
2016 2017 2018
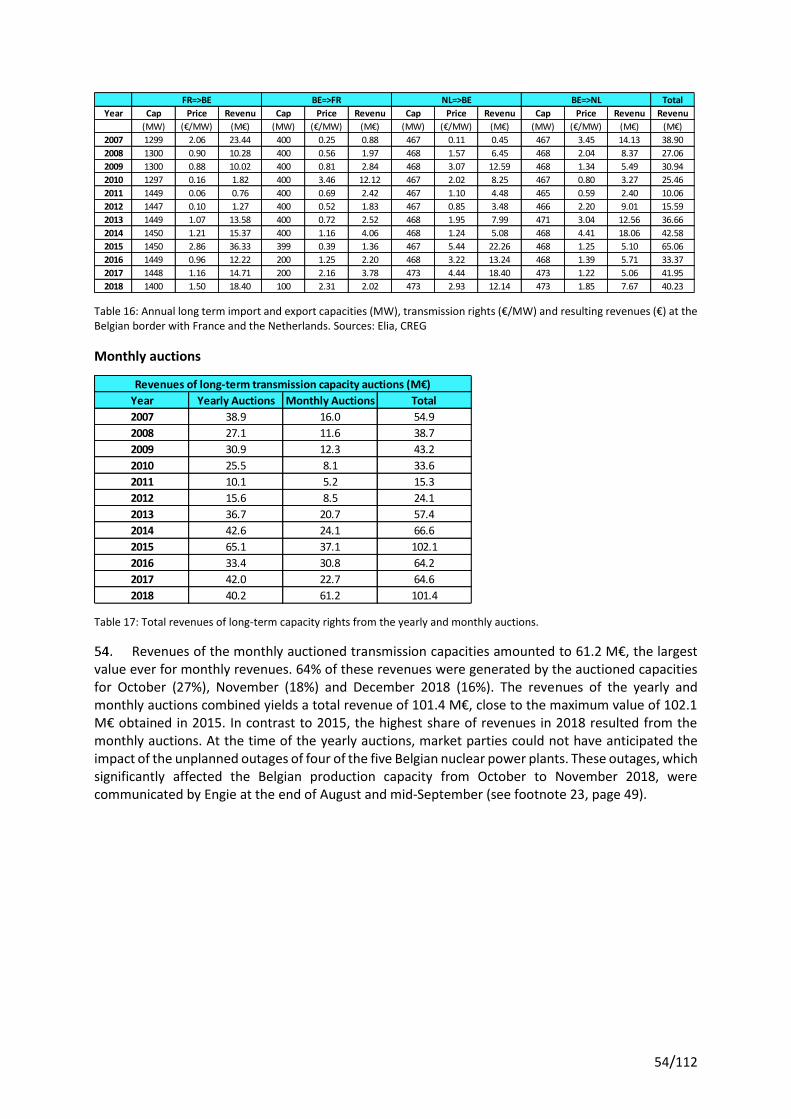
54/112
Table 16: Annual long term import and export capacities (MW), transmission rights (€/MW) and resulting revenues (€) at the Belgian border with France and the Netherlands. Sources: Elia, CREG
Monthly auctions
Table 17: Total revenues of long-term capacity rights from the yearly and monthly auctions.
Revenues of the monthly auctioned transmission capacities amounted to 61.2 M€, the largest value ever for monthly revenues. 64% of these revenues were generated by the auctioned capacities for October (27%), November (18%) and December 2018 (16%). The revenues of the yearly and monthly auctions combined yields a total revenue of 101.4 M€, close to the maximum value of 102.1 M€ obtained in 2015. In contrast to 2015, the highest share of revenues in 2018 resulted from the monthly auctions. At the time of the yearly auctions, market parties could not have anticipated the impact of the unplanned outages of four of the five Belgian nuclear power plants. These outages, which significantly affected the Belgian production capacity from October to November 2018, were communicated by Engie at the end of August and mid-September (see footnote 23, page 49).
Total
Year Cap Price Revenu Cap Price Revenu Cap Price Revenu Cap Price Revenu Revenu
(MW) (€/MW) (M€) (MW) (€/MW) (M€) (MW) (€/MW) (M€) (MW) (€/MW) (M€) (M€)
2007 1299 2.06 23.44 400 0.25 0.88 467 0.11 0.45 467 3.45 14.13 38.90
2008 1300 0.90 10.28 400 0.56 1.97 468 1.57 6.45 468 2.04 8.37 27.06
2009 1300 0.88 10.02 400 0.81 2.84 468 3.07 12.59 468 1.34 5.49 30.94
2010 1297 0.16 1.82 400 3.46 12.12 467 2.02 8.25 467 0.80 3.27 25.46
2011 1449 0.06 0.76 400 0.69 2.42 467 1.10 4.48 465 0.59 2.40 10.06
2012 1447 0.10 1.27 400 0.52 1.83 467 0.85 3.48 466 2.20 9.01 15.59
2013 1449 1.07 13.58 400 0.72 2.52 468 1.95 7.99 471 3.04 12.56 36.66
2014 1450 1.21 15.37 400 1.16 4.06 468 1.24 5.08 468 4.41 18.06 42.58
2015 1450 2.86 36.33 399 0.39 1.36 467 5.44 22.26 468 1.25 5.10 65.06
2016 1449 0.96 12.22 200 1.25 2.20 468 3.22 13.24 468 1.39 5.71 33.37
2017 1448 1.16 14.71 200 2.16 3.78 473 4.44 18.40 473 1.22 5.06 41.95
2018 1400 1.50 18.40 100 2.31 2.02 473 2.93 12.14 473 1.85 7.67 40.23
FR=>BE BE=>FR NL=>BE BE=>NL
Year Yearly Auctions Monthly Auctions Total
2007 38.9 16.0 54.9
2008 27.1 11.6 38.7
2009 30.9 12.3 43.2
2010 25.5 8.1 33.6
2011 10.1 5.2 15.3
2012 15.6 8.5 24.1
2013 36.7 20.7 57.4
2014 42.6 24.1 66.6
2015 65.1 37.1 102.1
2016 33.4 30.8 64.2
2017 42.0 22.7 64.6
2018 40.2 61.2 101.4
Revenues of long-term transmission capacity auctions (M€)

55/112
Figure 43: Monthly long term IMPORT capacity auctions at the French border (top) and at the Dutch border (bottom). The auctioned volumes (‘capVol’, MW) vary on a monthly basis. The better the auction price (‘capPrice’, in €/MW) and the monthly-averaged day-ahead price in the given direction (‘pBE-pFR’ and ‘pBE-pNL’, in €/MWh) are correlated, the better the market was able to anticipate the price spreads. The level of competition, which depends on the number of participating market players, is measured by the HHI-index (‘HHI/1000’).
35.5
10.4
0
5
10
15
20
25
30
35
40
0
100
200
300
400
500
600
700
800
2007
0120
0704
2007
0720
0710
2008
0120
0804
2008
0720
0810
2009
0120
0904
2009
0720
0910
2010
0120
1004
2010
0720
1010
2011
0120
1104
2011
0720
1110
2012
0120
1204
2012
0720
1210
2013
0120
1304
2013
0720
1310
2014
0120
1404
2014
0720
1410
2015
0120
1504
2015
0720
1510
2016
0120
1604
2016
0720
1610
2017
0120
1704
2017
0720
1710
2018
0120
1804
2018
0720
1810
capVol (MW) capPrice (€/MW) pBE-pFR (€/MWh) HHI/1000
FR => BEMW €/MW
€/MWhHHI/1000
45
15
0
5
10
15
20
25
30
35
40
45
50
0
100
200
300
400
500
600
700
800
2007
0120
0704
2007
0720
0710
2008
0120
0804
2008
0720
0810
2009
0120
0904
2009
0720
0910
2010
0120
1004
2010
0720
1010
2011
0120
1104
2011
0720
1110
2012
0120
1204
2012
0720
1210
2013
0120
1304
2013
0720
1310
2014
0120
1404
2014
0720
1410
2015
0120
1504
2015
0720
1510
2016
0120
1604
2016
0720
1610
2017
0120
1704
2017
0720
1710
2018
0120
1804
2018
0720
1810
capVol (MW) capPrice (€/MW) pBE-pNL (€/MWh) HHI/1000
NL=>BEMW €/MW
€/MWhHHI/1000
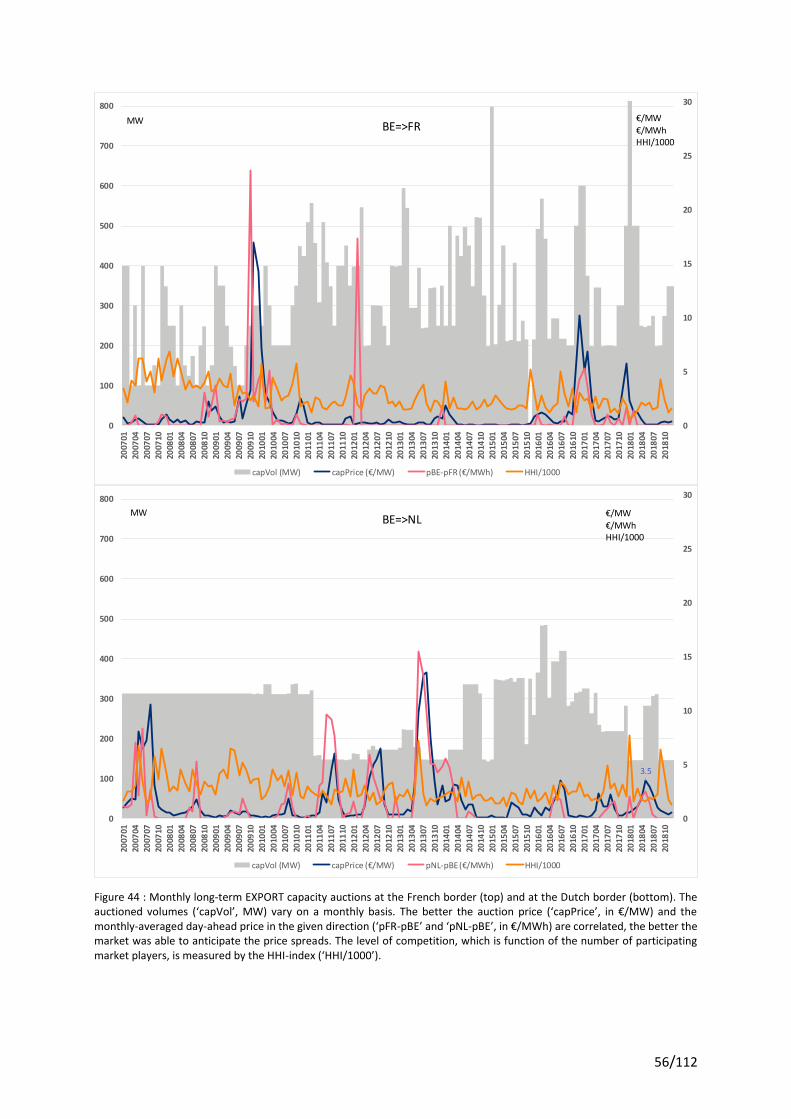
56/112
Figure 44 : Monthly long-term EXPORT capacity auctions at the French border (top) and at the Dutch border (bottom). The auctioned volumes (‘capVol’, MW) vary on a monthly basis. The better the auction price (‘capPrice’, in €/MW) and the monthly-averaged day-ahead price in the given direction (‘pFR-pBE’ and ‘pNL-pBE’, in €/MWh) are correlated, the better the market was able to anticipate the price spreads. The level of competition, which is function of the number of participating market players, is measured by the HHI-index (‘HHI/1000’).
0
5
10
15
20
25
30
0
100
200
300
400
500
600
700
800
2007
0120
0704
2007
0720
0710
2008
0120
0804
2008
0720
0810
2009
0120
0904
2009
0720
0910
2010
0120
1004
2010
0720
1010
2011
0120
1104
2011
0720
1110
2012
0120
1204
2012
0720
1210
2013
0120
1304
2013
0720
1310
2014
0120
1404
2014
0720
1410
2015
0120
1504
2015
0720
1510
2016
0120
1604
2016
0720
1610
2017
0120
1704
2017
0720
1710
2018
0120
1804
2018
0720
1810
capVol (MW) capPrice (€/MW) pBE-pFR (€/MWh) HHI/1000
BE=>FRMW €/MW
€/MWhHHI/1000
3.5
0
5
10
15
20
25
30
0
100
200
300
400
500
600
700
800
2007
0120
0704
2007
0720
0710
2008
0120
0804
2008
0720
0810
2009
0120
0904
2009
0720
0910
2010
0120
1004
2010
0720
1010
2011
0120
1104
2011
0720
1110
2012
0120
1204
2012
0720
1210
2013
0120
1304
2013
0720
1310
2014
0120
1404
2014
0720
1410
2015
0120
1504
2015
0720
1510
2016
0120
1604
2016
0720
1610
2017
0120
1704
2017
0720
1710
2018
0120
1804
2018
0720
1810
capVol (MW) capPrice (€/MW) pNL-pBE (€/MWh) HHI/1000
BE=>NLMW €/MW
€/MWhHHI/1000

57/112
4.3.2. Day-ahead cross-zonal exchange
For the second year in a row, Belgium import levels have broken records. In December 2018, Belgium was able to import a historically high volume of 5,196 MW. This is an increase of 1,127 MW or 28% compared to the previous record of 4,069 MW achieved in May 2017. The 2017 import record was already broken in August 2018, with a net import position of 4,332 MW. From August to December, maximum import net positions ranged from 4,199 MW to 5,196 MW.
Figure 45: Monthly average (‘Net DA’), maximum (‘Max DA’) and minimum (‘Min DA’) Day-ahead Net Position for Belgium. Positive values indicate export, negative values indicate import.
Table 18: Monthly average Net Positions of the 4 CWE bidding zones in 2018 resulting from the CWE day-ahead and long term commercial exchanges. To allow comparison with historical data, net positions of the German-Luxembourg (DE/LU) and Austrian (AT) bidding zone after the DE/LU-AT bidding zone split, have been lumped together. In 2017, Belgium was net importing all months, except from July and August.
-1,387
-956-1,131
-1,985-2,266 -2,276
-1,724
-2,043
-2,882
-2,560
-2,225
-2,730
1,084 972
533
-4 -59
-428
964
199
-1,291
-505-384
-699
-3,315
-2,631
-3,544 -3,624 -3,712
-4,004
-3,195
-4,332
-4,709 -4,625
-4,195
-5,196
-6,000
-5,000
-4,000
-3,000
-2,000
-1,000
0
1,000
2,000
Jan Feb Mar Apr May Jun Jul Aug Sep Oct Nov Dec
Net DA Max DA Min DA
MW
2018 BE NL FR DE/LU + AT CWE
Jan -1,387 -1,161 -361 2,908 3,988
Feb -956 -31 -4,005 4,992 5,359
Mar -1,131 -1,443 -1,210 3,783 4,732
Apr -1,985 -2,659 1,399 3,245 5,135
May -2,266 -2,997 3,534 1,729 5,392
Jun -2,276 -2,437 3,514 1,198 4,907
Jul -1,724 -1,917 1,680 1,961 4,073
Aug -2,043 -1,132 1,088 2,087 4,182
Sep -2,882 -804 979 2,706 4,237
Oct -2,560 26 553 1,980 3,738
Nov -2,225 -449 -630 3,305 4,217
Dec -2,730 -955 -475 4,160 5,194
Average -2,019 -1,338 534 2,823 4,590
Net Position in day-ahead + long term (MW)
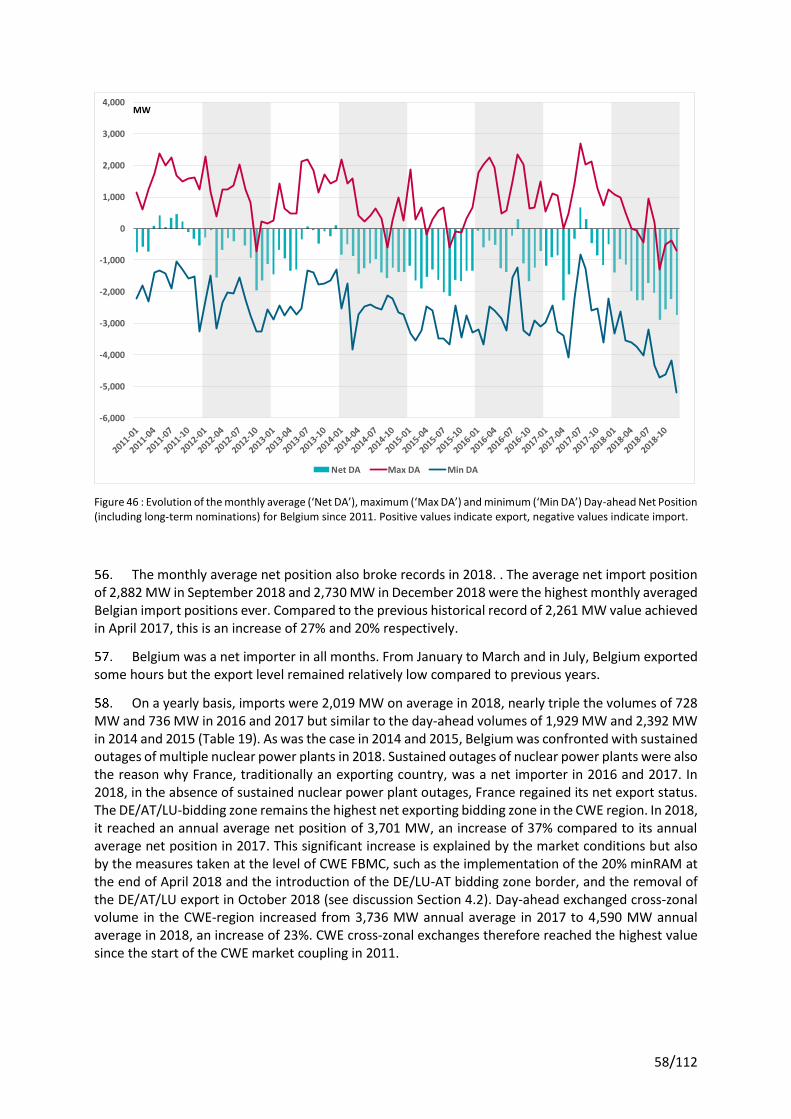
58/112
Figure 46 : Evolution of the monthly average (‘Net DA’), maximum (‘Max DA’) and minimum (‘Min DA’) Day-ahead Net Position (including long-term nominations) for Belgium since 2011. Positive values indicate export, negative values indicate import.
The monthly average net position also broke records in 2018. . The average net import position of 2,882 MW in September 2018 and 2,730 MW in December 2018 were the highest monthly averaged Belgian import positions ever. Compared to the previous historical record of 2,261 MW value achieved in April 2017, this is an increase of 27% and 20% respectively.
Belgium was a net importer in all months. From January to March and in July, Belgium exported some hours but the export level remained relatively low compared to previous years.
On a yearly basis, imports were 2,019 MW on average in 2018, nearly triple the volumes of 728 MW and 736 MW in 2016 and 2017 but similar to the day-ahead volumes of 1,929 MW and 2,392 MW in 2014 and 2015 (Table 19). As was the case in 2014 and 2015, Belgium was confronted with sustained outages of multiple nuclear power plants in 2018. Sustained outages of nuclear power plants were also the reason why France, traditionally an exporting country, was a net importer in 2016 and 2017. In 2018, in the absence of sustained nuclear power plant outages, France regained its net export status. The DE/AT/LU-bidding zone remains the highest net exporting bidding zone in the CWE region. In 2018, it reached an annual average net position of 3,701 MW, an increase of 37% compared to its annual average net position in 2017. This significant increase is explained by the market conditions but also by the measures taken at the level of CWE FBMC, such as the implementation of the 20% minRAM at the end of April 2018 and the introduction of the DE/LU-AT bidding zone border, and the removal of the DE/AT/LU export in October 2018 (see discussion Section 4.2). Day-ahead exchanged cross-zonal volume in the CWE-region increased from 3,736 MW annual average in 2017 to 4,590 MW annual average in 2018, an increase of 23%. CWE cross-zonal exchanges therefore reached the highest value since the start of the CWE market coupling in 2011.
-6,000
-5,000
-4,000
-3,000
-2,000
-1,000
0
1,000
2,000
3,000
4,000
Net DA Max DA Min DA
MW

59/112
Table 19: Annual net import (-) and export(+) volume on the CWE-day-ahead market, including the long-term nominations. To allow comparison with historical data, net positions of the German-Luxembourg (DE/LU) and Austrian (AT) bidding zone after the DE/LU-AT bidding zone split have been lumped together.
4.3.3. Intraday cross-zonal exchange
Since the start of the intraday market coupling in 2007, intraday exchanged volumes have shown an upward trend. The intraday market is still primarily used for optimizing portfolios rather than energy sourcing. This can be concluded from the fact that on average, intraday cross-zonal exchanges do not significantly contribute to the monthly and annual average Belgian net position while hourly exchanges can be high in both import and export directions.
In 2018, the annual average contribution of the intraday cross-zonal exchange to the export net position was +180 MW, and -163 MW to the import net position (see Table 20). Despite the fact that this contribution of the intraday cross-zonal exchanges to the annual Belgian export and import positions remained limited, there was a significant increase of 46% and 24% compared to 2017.
The monthly contributions in 2018 varied between -85 MW in July to +55 MW in June. Monthly averages for export varied from between 7 MW in February to 55 MW in July. Monthly averages for import varied from -100 MW in November to -247 MW in July.
While the contribution of intraday cross-zonal exchange to the annual and monthly basis remained limited, the contribution on an hourly level can be much higher. In 2018, the monthly maximum net intraday export position ranged from 670 MW to 1,291 MW and the monthly maximum net import positions ranged from -360 MW to -1,611 MW. These values remained below the maximum of 1,714 MW intraday export in May 2017 and below the maximum of 1,713 MW intraday import in January 2017.
BE NL FR DE/LU+AT CWE
2011 -255 -967 884 338 3106
2012 -1049 -2019 326 2743 4055
2013 -1109 -2399 361 3148 4415
2014 -1929 -2015 1240 2704 4302
2015 -2392 -1289 656 3025 4419
2016 -728 -1032 -736 2496 3648
2017 -736 -663 -1300 2699 3736
2018 -2019 -1338 534 3701 4590
Average -1277 -1465 246 2607 4034
Yearly average Day-ahead + Long term net position (MW)

60/112
Figure 47: Monthly average export net positions (‘Av Export ID’), average import nominations (‘Av. Import ID’) and resulting average net position (‘Av. Net ID’), along with the monthly maximums (‘Max Export ID’, ‘Max import ID’) in 2018.
Figure 48: Evolution of the monthly average export net positions (‘Av Export ID’), average import nominations (‘Av. Import ID’) and resulting average net position (‘Av. Net ID’), along with the monthly maximums (‘Max Export ID’, ‘Max import ID’), since 2007.
208 189 220 197124 158 162
215 199125 150
212
-192 -183 -210 -177-115 -104
-247 -198-147 -115 -100
-167
16 7 10 20 9 55
-85
16 51 9 50 46
895
670
894
753 721844
1,291
682798
925823
1,049
-684
-984-860
-911-819
-360
-1,611
-931
-768 -733-631
-869
-2,000
-1,500
-1,000
-500
0
500
1,000
1,500
Jan Feb Mar Apr May Jun Jul Aug Sep Oct Nov Dec
Av.Export ID Av. Import ID Av. Net ID Max Net ID Min Net ID
MW
-2,500
-2,000
-1,500
-1,000
-500
0
500
1,000
1,500
2,000
2,500
20
07
-01
20
07
-05
20
07
-09
20
08
-01
20
08
-05
20
08
-09
20
09
-01
20
09
-05
20
09
-09
20
10
-01
20
10
-05
20
10
-09
20
11
-01
20
11
-05
20
11
-09
20
12
-01
20
12
-05
20
12
-09
20
13
-01
20
13
-05
20
13
-09
20
14
-01
20
14
-05
20
14
-09
20
15
-01
20
15
-05
20
15
-09
20
16
-01
20
16
-05
20
16
-09
20
17
-01
20
17
-05
20
17
-09
20
18
-01
20
18
-05
20
18
-09
Av.Export ID Av. Import ID Av. Net ID Max Net ID Min Net ID
MW

61/112
4.3.4. Overview of cross-zonal exchanges
Figure 49 and Table 21 summarize the contribution of the long term, day-ahead and intraday markets in total annual Belgian imported and exported volumes over the past 12 years. The figures complement the main findings discussed above: Combining day-ahead and intraday cross-zonal exchanges, Belgium imported on average 2,466 MW or 89% more than in 2017 and exported on average 453 MW or 19% less. In total, the annual average Belgian net position was -2,013 MW. This remains below the annual average Belgian net position of -2,398 MW in 2015, characterized by sustained nuclear outages as was the case in 2018. In contrast to 2018, 29% of the import in 2015 was explicitly sourced on the long-term market (Table 21). Since the introduction of Financial Transmission Rights (FTR) in January 2016, long-term transmission rights no longer have to be nominated. Their corresponding exchanges are included in the day-ahead exchanges. Firmness of long-term transmission rights is guaranteed through the so-called ‘LTA-patch’. The latter virtually increases the day-ahead flow based domain if it is too small to allow all long-term exchanges.
Figure 49: Yearly average imported and exported volumes on the long term (LT), day-ahead (DA) and intraday (ID) markets.
-3,000
-2,500
-2,000
-1,500
-1,000
-500
0
500
1,000
1,500
2007 2008 2009 2010 2011 2012 2013 2014 2015 2016 2017 2018
LT export DA export ID export LT import DA import ID import
MWh/h

62/112
Table 20: Annual average export, import and net exchanges on the long term, day-ahead and intraday markets.
Table 21: Share of the long term (LT), day-ahead (DA) and intraday (ID) markets in Belgian electricity exports and imports.
4.3.5. Transit flows
Transit flows are physical flows crossing the Belgian control area, resulting from commercial
exchanges between two other bidding zones. With the ATC-method, bilateral commercial exchanges
are translated into capacity nominations on individual borders. For some commercial exchanges, this
results in a transit flow crossing Belgium from North to South (Transit North=>South). For other
commercial exchanges the resulting transit flow crosses Belgium from South to North (Transit
South=>North). The net transit flow, shown in Figure 50, is the result of all transit flows. Positive flows
indicate a resulting flow in the North-South direction.
Prior to May 2015, the computed transit flows showed a clear pattern, with an almost constant
value for the maximum transit flow from FR=>NL and with a seasonal pattern for the maximum transit
flow from NL=>FR. After that date, there was much more variation in the calculated transit flows,
especially in the direction FR=>NL. In addition, much larger transit flows are recorded in both
directions. The difference between before and after May 2015 may be due to the computation
method, the introduction of FBMC and the situation in the French market in 2016 and 2017 resulting
from the sustained outage of several nuclear power plants, turning France from a net exporting bidding
zone to a net importing bidding zone (see also Table 19)
Since the go-live of FBMC in May 2015, record values have been recorded in both directions,
with the highest values recorded in the direction South-North. In 2018, transit flows reached a record
value in the direction South-North of 4,574 MW, compared to the maximum of 4,245 MW in 2016. The
Year Export Import Net Export Import Net Export Import Net
2007 415 903 -488 474 697 -223 10 8 2
2008 119 635 -516 387 1,082 -696 41 25 16
2009 250 288 -37 830 477 353 47 44 3
2010 237 136 101 677 754 -77 56 62 -6
2011 158 299 -141 664 777 -112 81 110 -29
2012 94 354 -260 632 1,421 -789 95 129 -34
2013 110 661 -551 725 1,283 -558 139 154 -15
2014 31 783 -752 395 1,553 -1,158 122 139 -17
2015 1 780 -779 168 1,769 -1,600 137 156 -19
2016 0 0 0 474 1,206 -732 114 136 -22
2017 0 0 0 439 1,175 -736 123 131 -8
2018 0 0 0 273 2,303 -2,029 180 163 17
Long Term
(Average, MW)
Day-ahead
(Average, MW)
Intraday
(Average, MW)
Year Export Import Net %LT %DA %ID %LT %DA %ID
2007 899 -1,609 -709 46% 53% 1% 56% 43% 0%
2008 546 -1,742 -1,196 22% 71% 8% 36% 62% 1%
2009 1,128 -808 319 22% 74% 4% 36% 59% 5%
2010 970 -953 17 24% 70% 6% 14% 79% 7%
2011 903 -1,185 -282 17% 74% 9% 25% 66% 9%
2012 820 -1,904 -1,084 11% 77% 12% 19% 75% 7%
2013 975 -2,099 -1,124 11% 74% 14% 32% 61% 7%
2014 548 -2,475 -1,926 6% 72% 22% 32% 63% 6%
2015 306 -2,705 -2,398 0% 55% 45% 29% 65% 6%
2016 588 -1,342 -754 0% 81% 19% 0% 90% 10%
2017 562 -1,306 -744 0% 78% 22% 0% 90% 10%
2018 453 -2,466 -2,013 0% 60% 40% 0% 93% 7%
LT+DA+ID
(Average, MW)
Share in Export Share in Import

63/112
transit flows in the North-South direction remained well below the maximums calculated in 2016 and
2017 of respectively 2,302 MW and 2,957 MW. Note that since 2015, with FBMC, transit flows are
calculated from the combination of zonal Net Exchange Positions, whereas in ATC these were
calculated from the individual zone-to-zone commercial exchanges. With FBMC, individual zone-to-
zone commercial exchanges cannot be uniquely defined.
Figure 50: Monthly average, maximum and minimum net transit flows through Belgium.
During the first months of 2018, when France was importing from the CWE region, transit flows
through Belgium were mainly North-South. During summer, when the Netherlands was importing from
the CWE region, transit flows were mainly South-North (see also monthly CWE net positions in Table
18).
Table 22: Mean transit flows via Belgium from 2007 to 2018. Transit flows in 2018 were primarily South-North, as in most years. - Sources: Elia and CREG
2302
2957
2201
-3838-4245
-4574-5,000
-4,000
-3,000
-2,000
-1,000
0
1,000
2,000
3,000
4,000
5,000
2007
-01
2007
-04
2007
-07
2007
-10
2008
-01
2008
-04
2008
-07
2008
-10
2009
-01
2009
-04
2009
-07
2009
-10
2010
-01
2010
-04
2010
-07
2010
-10
2011
-01
2011
-04
2011
-07
2011
-10
2012
-01
2012
-04
2012
-07
2012
-10
2013
-01
2013
-04
2013
-07
2013
-10
2014
-01
2014
-04
2014
-07
2014
-10
2015
-01
2015
-04
2015
-07
2015
-10
2016
-01
2016
-04
2016
-07
2016
-10
2017
-01
2017
-04
2017
-07
2017
-10
2018
-01
2018
-04
2018
-07
2018
-10
Monthly max Monthly average Monthly min
MW
NL => FR(North => South)
FR => NL(South => North)
Year Transit NL=>FR Transit FR=>NL Transit Net NL=>FR pFR-pNL (€/MWh)
2007 137 -569 -432 -1
2008 144 -281 -136 -1
2009 327 -187 140 4
2010 307 -239 68 2
2011 109 -454 -345 -3
2012 120 -538 -418 -1
2013 140 -597 -457 -9
2014 25 -418 -393 -7
2015 56 -146 -89 -2
2016 136 -236 -100 5
2017 207 -158 49 6
2018 111 -259 -147 -2
Average 152 -340 -188 -1

64/112
Table 22 shows the annual mean transit flows in both directions and the resulting net transit
flow arising from all CWE cross-zonal exchanges (long-term, day-ahead and intraday). Note again that
with FBMC, one obtains the Net Transit flows resulting from the set of zonal Net Positions. The
breakdown of this Net Transit flow into Transit NL=>FR and Transit FR=>NL is not uniquely defined and
is therefore somewhat arbitrary.
Since 2011, the net transit flows through Belgium are predominantly South to North. This was
not the case for 2017, because France had imported during 10 of the 12 months. In 2018, transit flows
through Belgium arising from CWE exchanges were again predominantly South-North, with an average
of 147 MW (Table 22).
4.3.6. Loop flows
Since 1 January 2017, the level of loop flows in the day-ahead market coupling through the
Belgian zone have been published on a daily basis on the Elia website24. The calculation methodology
adopted by Elia is based on data from the FBMC process. The loop flows in the day-ahead market
coupling are calculated based on the D2CF files of the base case. The calculation method is published
on the Elia website.
Loop flows correspond to physical flows observed on a network element resulting from
commercial exchanges inside another bidding zone. They correspond to externalities for economists.
As discussed before, all commercial exchanges give rise to physical flows. Not all of these are
considered to be “externalities”. Physical flows arising from commercial exchanges between bidding
zones (long term, day-ahead, intraday) are not. They are considered as competitive flows since the
commercial exchanges go in competition for the use of the network transmission capacity. Expected
physical flows arising from commercial exchanges inside another zone, by contrast, take priority over
these flows resulting from the day-ahead market coupling. This priority access is not only market
distorting, it also creates inefficiencies at the grid management level. The loop flows originating from
exchanges inside other bidding zones create uncertainty for which system operators take safety
margins. In turn, these safety margins reduce the capacity available for commercial exchange. It is
therefore important to closely monitor the level of loop flows.
Based on exchanges with Elia in winter 2018, loop flows in the day-ahead market coupling are
overestimated by over 600 MW on average compared to the actual loop flows in real-time. While the
loop flows in the basecase in 2018 amounted to 812 MW on average (see Table 23), it means that the
actual loop flows in real time were ‘only’ around 212 MW on average. From this, one can conclude
that commercial capacity is not only reduced by loop flows, but mainly by the forecast error on these
loop flows. To make things worse, this forecast error also increases the FRM, which further reduces
the commercial capacity. One of the identified measures to improve D-2 forecast accuracy is to include
not only the best forecast of the load and production pattern in the basecase calculation, but the best
forecast of what the actual production infeed is going to be. Those remedial actions will have to solve
internal congestions detected in the basecase as their primary objective. As a welcome side-effect,
those remedial actions will result in a reduction of loop flows in the basecase, closing the gap between
the forecasted and actual loop flows. The requirement for including the best forecast of (costly)
remedial actions is however not explicitly defined as mandatory in the current CWE FBMC, neither in
the foreseen CORE FBMC. Tackling this forecast accuracy issue is identified by CREG as one of the key
measures to further improve the functioning of the market coupling.
24 See Elia website, Data download, Category “Interconnection” on http://www.elia.be/en/grid-data/data-download

65/112
Figure 51 shows the loop flows through Belgium calculated by Elia and based on the D-2 data
since the start of FBMC (May 2015 to December 2018). Most of the hours, the result of all loop flows
generated in the CWE zones through Belgium flows in the North-South direction. Statistical indicators
are presented in Table 23.
Table 23: Statistical indicators on the D-2 forecasted loop flows used in the CWE FBMC capacity calculation
In the last three months of 2018, forecasted loop flows in D-2 were a modest 4% lower compared
to the same period in 2017 (Table 23). In the last three months of 2018, a sensible decrease of loop
flows in the D-2 forecasts was expected because of the CWE TSO agreement on a more extensive use
of the PSTs in the capacity calculation to reduce loop flows when adequacy risks in Belgium were
expected and, more structurally, because of the introduction of the DE/LU-AT bidding zone border on
1 October 2018 (see also Section 4.2). This expected reduction may have been partially offset by the
loss of one of the PSTs at the Belgian border. The maximum value recorded during those months was
2,065 MW, being sensibly lower than the 2,350 MW maximum recorded the same period in 2017. On
26 September 2018, a few days before the DE/LU-AT bidding zone split, a record value of 2,448 MW in
the North-South direction was recorded. In March 2018 a record value in the South-North direction of
-2345 MW was recorded, though this value is a clear outlier as can be deducted from Figure 52.
With further evolutions in the methodologies for capacity calculation and redispatching and
countertrading methodologies in the CORE region, it is expected that the level of loop flows in the
basecase will further reduce. As discussed in paragraph 72 above, improving forecast accuracy of the
D-2 calculations will make a major contribution in reducing loop flows. This can be achieved by
including not only the best forecast of the load and production pattern in the basecase calculation, but
the best forecast of all remedial actions, both costly and non-costly.
2016 2017 2018 2016 2017 2018
Average 761 840 812 939 889 853
Minimum -1010 -504 -2345 -680 -295 -357
Maximum 2459 2413 2448 2459 2350 2065
Standard Deviation 519 513 459 549 492 421
P95 1443 1527 1413 1624 1546 1392
Entire year October - December
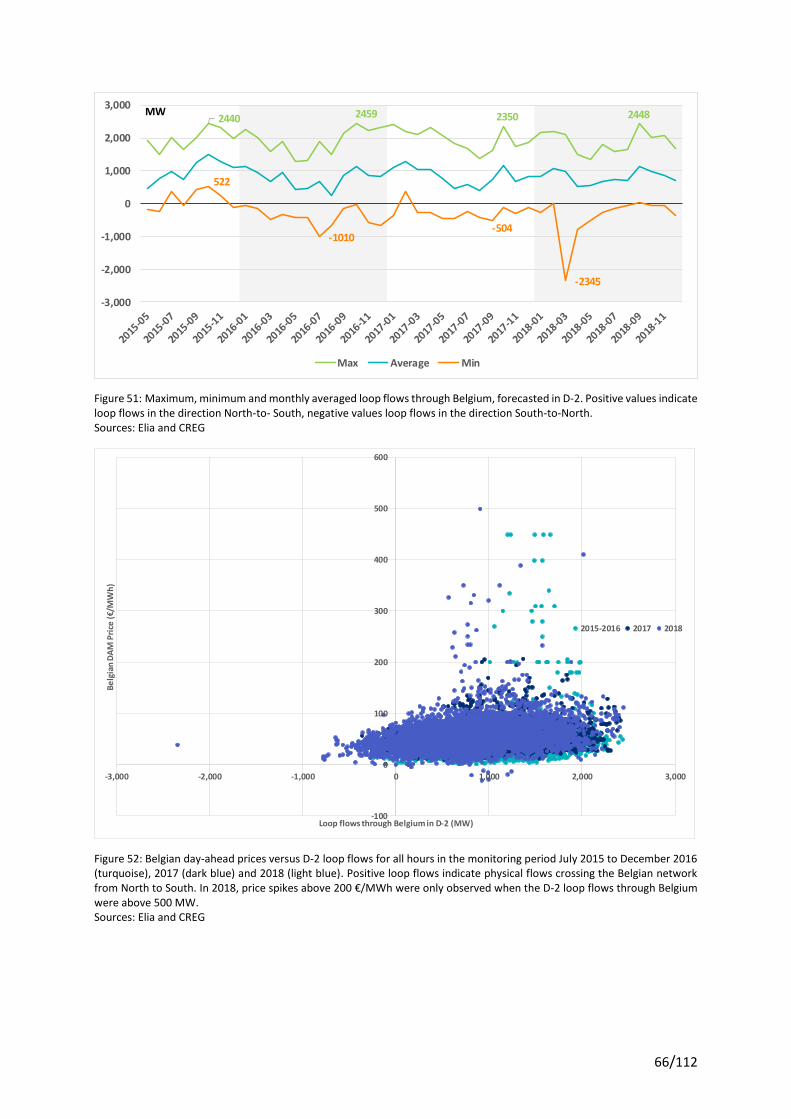
66/112
Figure 51: Maximum, minimum and monthly averaged loop flows through Belgium, forecasted in D-2. Positive values indicate loop flows in the direction North-to- South, negative values loop flows in the direction South-to-North. Sources: Elia and CREG
Figure 52: Belgian day-ahead prices versus D-2 loop flows for all hours in the monitoring period July 2015 to December 2016 (turquoise), 2017 (dark blue) and 2018 (light blue). Positive loop flows indicate physical flows crossing the Belgian network from North to South. In 2018, price spikes above 200 €/MWh were only observed when the D-2 loop flows through Belgium were above 500 MW. Sources: Elia and CREG
2440 2459 2350 2448
522
-1010-504
-2345
-3,000
-2,000
-1,000
0
1,000
2,000
3,000
Max Average Min
MW
-100
0
100
200
300
400
500
600
-3,000 -2,000 -1,000 0 1,000 2,000 3,000
Be
lgia
n D
AM
Pri
ce (
€/M
Wh
)
Loop flows through Belgium in D-2 (MW)
2015-2016 2017 2018

67/112
4.3.7. Physical flows
Since the go-live of FBMC, physical flows on the cross-zonal lines have reached higher maximum
values then with the ATC-based market coupling (Figure 53). In 2018, the following maximums were
reached:
- On the Northern border, a maximum of 3,755 MW (NL=>BE) was recorded in February 2018 and
a maximum of 2,516 MW (BE=>NL) in March 2018. These values do not exceed the maximums
of respectively 4,005 MW recorded in 2015 and 3,341 MW recorded in 2017.
- On the Southern border, a maximum of 2,821 MW (BE=>FR) was recorded March 2018 and a
maximum of 4,196 MW (FR=>BE) in December 2018. This is respectively lower than the
maximum of 3,218 recorded in 2016 (BE=>FR), and higher than the previous record of 3,962 MW
recorded in 2016 (FR=>BE).
High physical flows arise from high volumes of cross-zonal exchange (Belgian import, Belgian export and Transit Flows through Belgium) and/or high real-time loop flows.
-3341 -3105
-2516
40053982 3651
3755
-4,500
-3,500
-2,500
-1,500
-500
500
1,500
2,500
3,500
4,500
2007
01
2007
04
2007
07
2007
10
2008
01
2008
04
2008
07
2008
10
2009
01
2009
04
2009
07
2009
10
2010
01
2010
0420
1007
2010
10
2011
01
2011
04
2011
07
2011
10
2012
01
2012
04
2012
07
2012
1020
1301
2013
04
2013
07
2013
10
2014
01
2014
04
2014
07
2014
10
2015
01
2015
04
2015
07
2015
10
2016
01
2016
04
2016
07
2016
10
2017
01
2017
04
2017
07
2017
10
2018
0120
1804
2018
07
2018
10
Mean Physical Flow NL=>BE Max Physical Flow BE=>NL Max Physical Flow NL=>BE
MW
NL=>BE
BE=>NL

68/112
Figure 53: Physical flows on the Northern border (top) and the Southern border (bottom). Positive values indicate physical flows in the North-to-South direction.
4.3.8. Evaluation of CWE day-ahead Flow Based Market Coupling
CWE day-ahead FBMC went live in May 2015, thereby replacing the former ATC-method for
coupling the day-ahead markets in the CWE region. Contrary to ATC, FBMC makes it possible to
optimize the zonal net positions of the relevant bidding zones simultaneously, based on an
optimization algorithm to maximize CWE social welfare while respecting network constraints. CWE
FBMC makes it possible to be far less conservative than the ATC-method. This potentially allows a more
efficient use and allocation of the existing network capacity.
In 2018, CWE FBMC performed notably better than in the previous 2 years in terms of maximum
and average CWE cross-zonal exchanges. In December 2018, the combination of long-term and day-
ahead cross-zonal exchanges in the CWE region reached 10,813 MW, i.e. 13% more than the maximum
of 9,536 MW reached in October 2017, 22% more than the maximum of 8,829 MW reached in 2016
and even 54% more than the maximum of 7,023 MW reached in 2012 with ATC (Figure 54). Compared
to ATC, however, CWE FBMC still results in lower minimal exchanges. While the minimum CWE cross-
zonal exchanges during congested hours amounted to 2,348 MW before CWE FBMC implementation,
it went down to 1,456 MW with FBMC in 2017. In 2018, the lowest value of CWE exchanges recorded
during congested hours amounted to 1,620 MW (Figure 54).
-3962
-3322
-4196
3218 3209
2821
-4,500
-3,500
-2,500
-1,500
-500
500
1,500
2,500
3,500
4,500
2007
01
2007
04
2007
07
2007
1020
0801
2008
0420
0807
2008
10
2009
01
2009
04
2009
07
2009
10
2010
0120
1004
2010
0720
1010
2011
01
2011
04
2011
07
2011
10
2012
01
2012
0420
1207
2012
1020
1301
2013
04
2013
07
2013
10
2014
01
2014
04
2014
0720
1410
2015
0120
1504
2015
07
2015
10
2016
01
2016
04
2016
07
2016
1020
1701
2017
0420
1707
2017
10
2018
01
2018
04
2018
07
2018
10
Monthly Max Physical Flow FR=>BE Mean Physical Flow BE=>FR Monthly Max Physical Flow BE=>FR
MW
BE => FR
FR=>BE

69/112
Figure 54: Maximum, average and minimum monthly values of CWE cross-border volume (day-ahead + long term) during congested hours for 2011 – 2017. The vertical line indicates the start of FBMC for day-ahead market coupling. Sources: CWE TSOs, CREG
In annual terms, the yearly averaged cross-zonal exchanges in the CWE region reached 4,590
MW i.e. 20% more than the 3,736 MW yearly average achieved in 2017. The yearly averaged cross-
zonal exchange during congested hours reached 4,684 MW, an increase of 17% compared to 4,018
MW in 2017. Based on these indicators, 2018 outperformed all previous years (see Figure 56). The
monthly averaged CWE cross-zonal exchanges are shown in Figure 55, together with the average net
positions of the different bidding zones.
7,023
7,745
8,829
9,536
10,503
5,145
5,596
2,348
1,6341,456
1,620
0
2,000
4,000
6,000
8,000
10,000
12,000
Series4 Monthly Max Monthly Average Monthly Min
ATC FBMCMW

70/112
Figure 55: Monthly averaged Zonal Net Positions and CWE cross-zonal exchanges in day-ahead, including long term nominations, before and after the introduction of FBMC on 21 May 2015. By way of comparison, the net positions of the DE/LU and AT bidding zones after the DE/AT/LU bidding zone split on 1 October 2019, are lumped together.
Figure 56: Yearly averaged day-ahead cross-zonal exchange in the CWE-region, including long-term nominations. The blue and gray bars indicate, respectively, the evaluated results over all hours and over congested hours only. The darker bars show the results with ATC, the lighter ones the results with FBMC. By way of comparison, exchanges between the DE/LU and AT bidding zones after 1 October 2018 are not included in the figures. As such, the net positions of the DE/LU and AT bidding zones after the DE/AT/LU bidding zone split on 1 October 2019, are lumped together.
-8000
-6000
-4000
-2000
0
2000
4000
6000
8000
2011
01
2011
04
2011
07
2011
10
2012
01
2012
04
2012
07
2012
10
2013
01
2013
04
2013
07
2013
10
2014
01
2014
04
2014
07
2014
10
2015
01
2015
04
2015
07
2015
10
2016
01
2016
04
2016
07
2016
10
2017
01
2017
04
2017
07
2017
10
2018
01
2018
04
2018
07
2018
10
Zon
al N
et P
osi
tio
ns
/ To
tal C
WE
exch
ange
(MW
)
NEP BE NEP NL NEP FR NEP DE/AT/LU XB-vol CWE
congested hours only
3106
4055
44154302
4419
36483736
4590
3828
4535 45534389 4409
3794
4018
4684
0
500
1000
1500
2000
2500
3000
3500
4000
4500
5000
2011 2012 2013 2014 2015 2016 2017 2018
Tota
l CW
E Ex
chan
ge b
etw
ee
n z
on
es
(MW
)
All hours (ATC/FBMC) Congested hours (ATC/FBMC)

71/112
The results of CWE FBMC in 2018 were in contrast with its initial years of implementation, from
2015 to 2017, when CWE FBMC was clearly underperforming due to the presence of highly loaded
internal network constraints defining the flow-based domain. In the CREG study 1687, the CREG
identified the role of collective and individual TSO discretionary actions which led to the observed
situation with cross-zonal exchanges being on average below the values promised by the parallel runs
– and even below ATC-values. As discussed in this study, in a majority of hours the capacities offered
in the day-ahead market often merely corresponded to the capacities determined by the long-term
transmission rights, which in turn were only guaranteed thanks to the application of the LTA-inclusion
patch (see also Section 4.2 in the CREG Market Monitoring Report 2016). In essence, CREG concluded
that the risks for non-efficiency and discrimination identified in the CREG Decision 1410 of April 2015
had materialized.
The recovery of CWE FBMC started in October 2017 thanks to a reduction of the size and number
of network constraints. During winter 2017-2018, CWE exchanges were significantly higher than in
winter 2015-2016 and winter 2016-2017 thanks to - among other things - the increase in Fmax-values
of frequently congested internal critical branches with the application of seasonal ratings and/or DLR,
and thanks to lower loop flows. Further performance improvement was obtained during 2018 by the
20% minRAM measure implemented at the end of April 2018, the introduction of the DE/AT-LU bidding
zone split in October 2018, the removal of the French and DE/AT/LU export limits and the increase of
the Belgian import limit. Those structural changes were included in the updated CWE FBMC approval
package submitted by CWE TSOs in June 2018 in view of the inclusion of the DE/LU-AT bidding zone
border, and approved by the CREG in its Decision 1814 of August 2018. Discussions on the impact and
concrete implementation of the Clean Energy Package on the CWE FBMC methodology are still
ongoing.
4.3.9. Evaluation of CWE day-ahead market coupling results
Average day-ahead market prices in 2018 increased in the entire CWE region. In Belgium, the
Netherlands and the German bidding zone, prices went up by roughly 10 €/MWh and in France by 5
€/MWh (Table 24). Compared to 2017, the number of hours with full price convergence and price
spread remained almost the same. Full price convergence was reached in 36% of hours, with an
average CWE DAM price of 52.7 €/MWh (Table 25). The average CWE price spread during congested
hours was 21.0 €/MWh, with prices typically being the highest in Belgium and lowest in the German
bidding zone (Table 26). Average CWE exchange during congested hours was 4,684 MW, which is the
highest value since the start of the market coupling and significantly higher than the 3,794 MW
minimum recorded in 2016.
As discussed in the market monitoring report of 2017, the observed reduction in CWE day-ahead
exchanges in 2016 and 2017 resulted from inefficiencies in the CWE FBMC implementation linked to
the set of network constraints defining the flow-based domain. Similarly, the observed improvement
from October 2017 and continued in 2018 is explained by a couple of short-term and medium-term
measures taken to eliminate a range of network constraints from the flow-based system. It could be
argued that the results in 2016 and in 2017 were also affected by the CWE market conditions, with
France having been a net importer, in contrast to previous years. However, the last 3 months of 2017
do not confirm this assumption. From October to December 2017, CWE cross-zonal exchanges reached
pre-FBMC values (Figure 55) despite France importing 3,063 MW to 3,984 MW from the CWE region
during congested hours, the highest monthly net import values until then. In February 2018, France
imported even more from the CWE region, namely 4,005 MW.

72/112
Table 24: Annual average results for the CWE day-ahead market clearing, evaluated over all hours25.
Table 25: Annual average results for the CWE day-ahead market clearing, evaluated over all non-congested hours25.
Table 26: Annual average results for the CWE day-ahead market clearing, evaluated over all congested hours25.
The number of hours with full price convergence in the CWE region in 2018 remained practically the same as in 2017. Nevertheless, differences are apparent on a monthly basis. Price differences
25 The DAM prices shown for the DE/LU bidding zone correspond to those of the DE/AT/LU bidding zone before 1 October 2018, and to those of the DE/LU bidding zone after 1 October. The DAM prices for the Austrian bidding zone (AT) after 1 October 2018 are not shown. The net positions shown for DE/LU+AT correspond to the DE/AT/LU bidding zone net position before 1 October 2018, and to the sum of the DE/LU and the AT net position after 1 October 2018.
YearConv
(% h)
CWE price
spread BE NL FR DE/LU
CWE XB-
exchBE NL FR
DE/LU
+AT
2011 69% 4.3 48.9 52.0 48.9 51.1 3,106 -255 -967 884 338
2012 50% 8.1 47.0 48.0 46.9 42.6 4,055 -1,049 -2,019 326 2,743
2013 16% 16.3 47.4 51.9 43.2 37.8 4,415 -1,109 -2,399 361 3,148
2014 21% 10.9 40.7 41.1 34.5 32.6 4,302 -1,929 -2,015 1,240 2,704
2015 21% 14.2 44.6 40.0 38.3 31.6 4,419 -2,392 -1,289 656 3,025
2016 38% 10.2 36.6 32.2 36.7 29.0 3,648 -728 -1,032 -736 2,496
2017 37% 14.3 44.5 39.3 45.0 34.2 3,736 -736 -663 -1,300 2,699
2018 36% 13.3 55.3 52.5 50.2 44.7 4,590 -2,019 -1,338 534 3,701
Average 36% 11.5 45.6 44.6 43.0 38.0 4,033 -1,274 -1,465 242 2,606
Average Day-Ahead Market Clearing Price (€/MWh)
averaged over all hours
Average Day-Ahead Cross-zonal Exchanges and Net
Positions incl. Long Term Nominations (MW)
Year % hoursCWE price
spread BE NL FR DE/LU
CWE XB-
exchBE NL FR
DE/LU
+AT
2011 69% 0.0 53.7 53.7 53.7 53.7 2,775 -378 -790 624 544
2012 50% 0.0 47.3 47.3 47.3 47.3 3,570 -1,002 -1,821 653 2,171
2013 16% 0.0 57.2 57.2 57.2 57.1 3,701 -1,092 -1,512 -53 2,658
2014 21% 0.1 43.1 43.1 43.1 43.1 3,975 -1,857 -1,675 922 2,611
2015 21% 0.0 38.3 38.2 38.2 38.2 4,457 -2,407 -1,378 1,503 2,282
2016 38% 0.1 28.9 28.9 28.9 28.8 3,414 -638 -1,355 107 1,885
2017 37% 0.0 37.4 37.4 37.4 37.3 3,252 -575 -1,104 7 1,672
2018 36% 0.1 52.7 52.7 52.7 52.7 4,425 -2,090 -1,363 1,201 2,858
Average 36% 0.0 45.4 45.4 45.4 45.3 3,529 -1,057 -1,304 601 1,837
Average Day-Ahead Market Clearing Price (€/MWh)
during hours with price convergence
Average Day-Ahead Cross-zonal Exchanges and Net
Positions incl. Long Term Nominations (MW)
Year%
hours
CWE price
spread BE NL FR DE/LU
CWE XB-
exchBE NL FR
DE/LU
+AT
2011 31% 13.7 38.6 48.3 38.5 45.5 3,828 14 -1,352 1,448 -109
2012 50% 16.1 46.7 48.7 46.6 38.0 4,535 -1,096 -2,215 3 3,308
2013 84% 19.5 45.6 50.9 40.5 34.0 4,553 -1,113 -2,571 441 3,243
2014 79% 13.7 40.1 40.6 32.2 29.9 4,389 -1,948 -2,105 1,325 2,729
2015 79% 18.0 46.3 40.4 38.4 29.8 4,409 -2,389 -1,265 429 3,224
2016 62% 16.5 41.5 34.3 41.7 29.1 3,794 -785 -830 -1,263 2,877
2017 63% 22.6 48.6 40.4 49.4 32.4 4,018 -830 -407 -2,060 3,296
2018 64% 21.0 56.7 52.4 48.8 40.1 4,684 -1,978 -1,323 151 4,185
Average 64% 17.9 45.8 44.2 41.7 33.8 4,317 -1,396 -1,555 39 3,041
Average Day-Ahead Market Clearing Price (€/MWh)
during congested hours
Average Day-Ahead Cross-zonal Exchanges and Net
Positions incl. Long Term Nominations (MW)
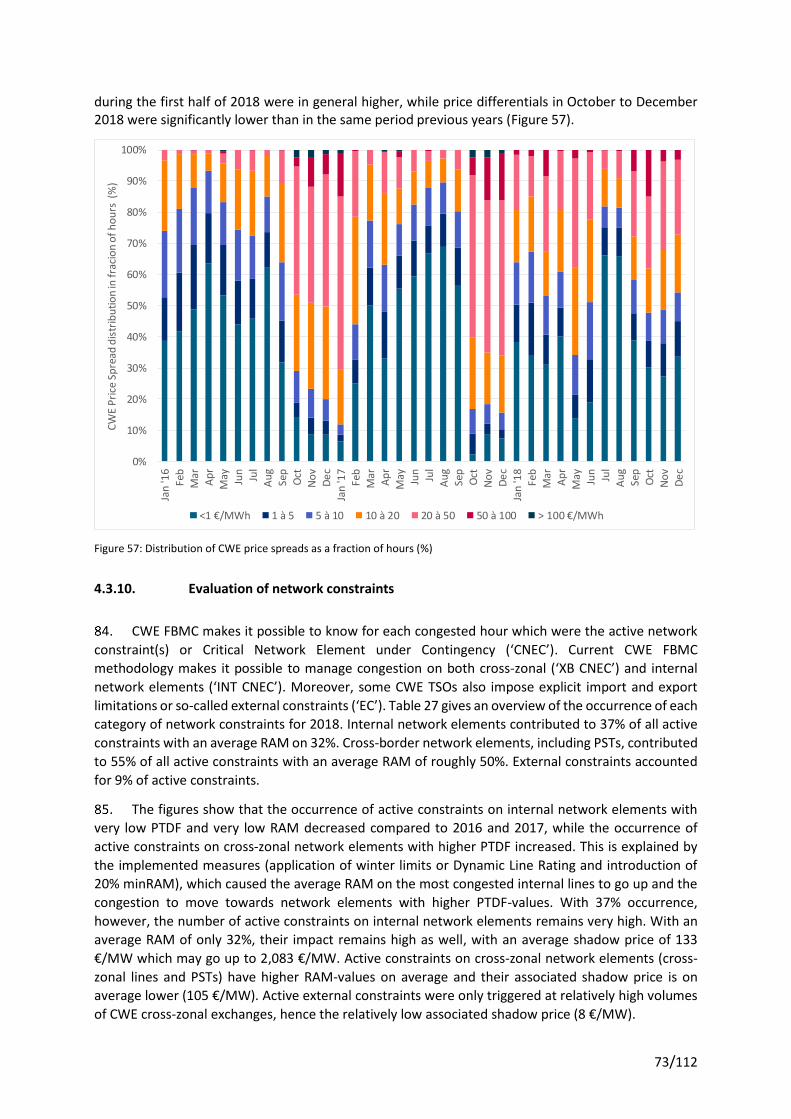
73/112
during the first half of 2018 were in general higher, while price differentials in October to December 2018 were significantly lower than in the same period previous years (Figure 57).
Figure 57: Distribution of CWE price spreads as a fraction of hours (%)
4.3.10. Evaluation of network constraints
CWE FBMC makes it possible to know for each congested hour which were the active network
constraint(s) or Critical Network Element under Contingency (‘CNEC’). Current CWE FBMC
methodology makes it possible to manage congestion on both cross-zonal (‘XB CNEC’) and internal
network elements (‘INT CNEC’). Moreover, some CWE TSOs also impose explicit import and export
limitations or so-called external constraints (‘EC’). Table 27 gives an overview of the occurrence of each
category of network constraints for 2018. Internal network elements contributed to 37% of all active
constraints with an average RAM on 32%. Cross-border network elements, including PSTs, contributed
to 55% of all active constraints with an average RAM of roughly 50%. External constraints accounted
for 9% of active constraints.
The figures show that the occurrence of active constraints on internal network elements with
very low PTDF and very low RAM decreased compared to 2016 and 2017, while the occurrence of
active constraints on cross-zonal network elements with higher PTDF increased. This is explained by
the implemented measures (application of winter limits or Dynamic Line Rating and introduction of
20% minRAM), which caused the average RAM on the most congested internal lines to go up and the
congestion to move towards network elements with higher PTDF-values. With 37% occurrence,
however, the number of active constraints on internal network elements remains very high. With an
average RAM of only 32%, their impact remains high as well, with an average shadow price of 133
€/MW which may go up to 2,083 €/MW. Active constraints on cross-zonal network elements (cross-
zonal lines and PSTs) have higher RAM-values on average and their associated shadow price is on
average lower (105 €/MW). Active external constraints were only triggered at relatively high volumes
of CWE cross-zonal exchanges, hence the relatively low associated shadow price (8 €/MW).
0%
10%
20%
30%
40%
50%
60%
70%
80%
90%
100%Ja
n '1
6
Feb
Mar
Ap
r
May Jun
Jul
Au
g
Sep
Oct
No
v
De
c
Jan
'17
Feb
Mar
Ap
r
May Jun
Jul
Au
g
Sep
Oct
No
v
De
c
Jan
'18
Feb
Mar
Ap
r
May Jun
Jul
Au
g
Sep
Oct
No
v
De
c
CW
E P
rice
Sp
read
dis
trib
uti
on
in f
raci
on
of
ho
urs
(%
)
<1 €/MWh 1 à 5 5 à 10 10 à 20 20 à 50 50 à 100 > 100 €/MWh

74/112
Table 27: Overview of active network constraints in 2018, evaluated per type.
The zone-to-zone PTDF values are typically lower for internal lines than for cross-zonal network
elements. Zone-to-zone PTDFs are computed by CWE TSOs for each individual element and each
individual hour, and express the expected impact of a zone-to-zone commercial exchange on the
physical loading of that line.
The RAM values are typically lower on internal lines than on cross-zonal lines. The RAM
represents the capacity available on a network element for cross-zonal exchange. Because of
preloading of the lines by domestic exchanges, included as reference flows (Fref) with priority grid
access, the RAM currently falls well below the thermal line capacity (Fmax). In 2018, RAM values on
internal lines, expressed relatively to their corresponding Fmax-value, were 39% on average, which is
well above the 16% average observed in 2017 but nevertheless still low. For cross-zonal lines and PSTs
the average RAM amounted to 53% and 50% respectively (Table 27), which is only a slight increase
compared to the averages of 39% and 49% obtained in 2017.
The shadow price of congestion on internal lines is significantly higher than for congestion on
cross-border elements. The shadow price represents the increase in CWE total welfare (€) for a unit
increase of the available capacity on the congested element (MW) and depends on the specific market
situation and on the multiplicative effect of a line. The latter represents the extra volume of cross-
zonal exchange enabled by an extra unit of available capacity on that line. The smaller the zone-to-
zone PTDF, the higher the multiplicative effect. High shadow prices reflect high opportunity costs of
the congestion and typically arise when cross-zonal exchanges are heavily limited. In 2018, the shadow
price of congestion on internal lines was 133 €/MW on average, with maximums up to 2,083 €/MW.
In 2017, before the implementation of the 20% minRAM threshold, the shadow price associated with
active internal CNECs was even higher: 208 €/MW on average, with maximums up to 2521 €/MW. For
congestion on cross-zonal lines and PSTs, shadow costs were respectively 105 €/MW and 69 €/MW
compared to 89 €/MW and 76 €/MW in 2017. The average shadow cost of external constraints, being
triggered at larger volumes of cross-zonal exchanges, was 8 €/MW compared to 10 €/MW in 2017.
Table 28 lists the 25 most frequently active network constraints for 2018. The average values for
the max PTDF, Fmax, RAM and FRM are shown, evaluated for the hours when the considered network
element was congested. The last column indicates the policy for determining Fmax. The analysis at the
individual network element level provides insight into the reasons why a specific network element was
congested. Consider the following examples:
- The CNEC Ens-Lelystad (NL-NENS NLLS), internal to the Dutch bidding zone, was the most
frequently active constraint in 2018. It has a relatively high zone-to-zone PTDF of 15% but a
relatively low RAM as well, only 26% of Fmax on average. The RAM on this internal line is low
because of reference flows in the basecase resulting from internal exchanges, loop flows and
transit flows from non-CWE regions. Transit flows from non-CWE regions, such as e.g. exchanges
over the HVDC-connectors Britned and Nordned within the Channel or Nordic region, have
priority access to exchanges in the CWE region. This problem can be alleviated by the
implementation of advanced hybrid coupling or a full merging of capacity calculation regions,
Type of constraint ('CBCO') Hours % Mean Min Max Mean Min Max Mean Min Max
Internal line (INT) 2788 37% 15% 0% 40% 32% 2% 162% 133 0.1 2083
Cross-border line (XB) 2920 39% 21% 0% 43% 53% 9% 134% 105 0.0 1190
Phase Shift Transformer (PST) 1185 16% 29% 5% 50% 50% 8% 118% 69 0.0 833
External constraint (EC) 647 9% 100% 100% 100% 100% 98% 100% 8 0.0 58
Total 7540 100% 27% 0% 100% 49% 2% 162% 101 0.0 2083
Occurrence
2018
max PTDF
(%)
RAM
(% Fmax)
Shadow price
(€/MW)

75/112
such that the exchanges can effectively enter into competition for gaining access to scarce
network capacity. Note that Tennet Netherlands did not apply seasonal line ratings or Dynamic
Line Rating (DLR) for determining Fmax on its CNECs26.
- The CNEC XDI_ME, the interconnector between Germany and the north of the Netherlands, and
ranked second in terms of occurrence, had only 45% RAM on average. This interconnector has
a relatively small Fmax, relatively high FRM (20% of Fmax) and high loop flows (43% of Fmax).
Tennet Germany (D2) did not apply seasonal line ratings or DLR for determining Fmax on its
CNECs.
- The CNEC PST Zandvliet, located on the Belgian northern border, has been one of the most
frequently congested network element as well, having one of the largest zone-to-zone PTDF of
the list (35% PTDF). Its average RAM of 53% can be considered low for a cross-zonal network
element. In the case of PST Zandvliet, this is partially due to the FRM value of 19% of the average
Fmax of 1,534 MW. The remaining 28% of Fmax is used by loop flows. Similar observations hold
for the Belgian internal line Doel-Zandvliet, directly connected to the PST Zandvliet.
- The CNEC BE-XAV_AV, the interconnector between Belgium and France, was also often
congested. However, unlike the previous three examples, this CNEC with high average zone-to-
zone PTDF (31%) has a high RAM on average (71%) when congested. Moreover, DLR is applied
for determining the Fmax. The high occurrence of this kind of CNECs as active constraints in the
CWE FBMC is perfectly legitimate.
- In contrast to previous years, internal lines with small PTDF inside the Amprion region, such as
D7HANE_DGRON, D7BE_GU and D7KNAP DSECH were constraining far less often. This evolution
is explained by the fact that Amprion applied seasonal line ratings and DLR at the end of 2017,
and by the implementation of the 20% minRAM measure since April 2018.
26 Tennet Netherlands, TenneT Germany and Transnet BW started the implementation of dynamic line rating on some of their internal lines in February 2019, see www.jao.eu/news/messageboard/overview
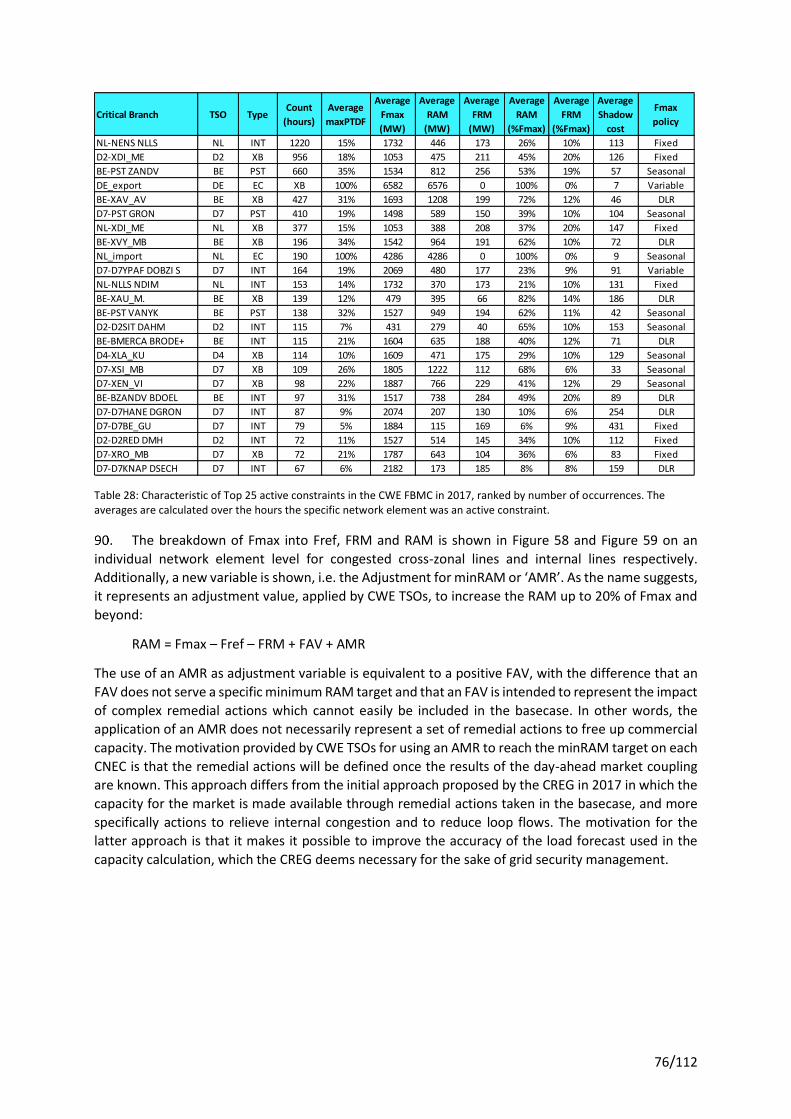
76/112
Table 28: Characteristic of Top 25 active constraints in the CWE FBMC in 2017, ranked by number of occurrences. The averages are calculated over the hours the specific network element was an active constraint.
The breakdown of Fmax into Fref, FRM and RAM is shown in Figure 58 and Figure 59 on an
individual network element level for congested cross-zonal lines and internal lines respectively.
Additionally, a new variable is shown, i.e. the Adjustment for minRAM or ‘AMR’. As the name suggests,
it represents an adjustment value, applied by CWE TSOs, to increase the RAM up to 20% of Fmax and
beyond:
RAM = Fmax – Fref – FRM + FAV + AMR
The use of an AMR as adjustment variable is equivalent to a positive FAV, with the difference that an
FAV does not serve a specific minimum RAM target and that an FAV is intended to represent the impact
of complex remedial actions which cannot easily be included in the basecase. In other words, the
application of an AMR does not necessarily represent a set of remedial actions to free up commercial
capacity. The motivation provided by CWE TSOs for using an AMR to reach the minRAM target on each
CNEC is that the remedial actions will be defined once the results of the day-ahead market coupling
are known. This approach differs from the initial approach proposed by the CREG in 2017 in which the
capacity for the market is made available through remedial actions taken in the basecase, and more
specifically actions to relieve internal congestion and to reduce loop flows. The motivation for the
latter approach is that it makes it possible to improve the accuracy of the load forecast used in the
capacity calculation, which the CREG deems necessary for the sake of grid security management.
Critical Branch TSO TypeCount
(hours)
Average
maxPTDF
Average
Fmax
(MW)
Average
RAM
(MW)
Average
FRM
(MW)
Average
RAM
(%Fmax)
Average
FRM
(%Fmax)
Average
Shadow
cost
Fmax
policy
NL-NENS NLLS NL INT 1220 15% 1732 446 173 26% 10% 113 Fixed
D2-XDI_ME D2 XB 956 18% 1053 475 211 45% 20% 126 Fixed
BE-PST ZANDV BE PST 660 35% 1534 812 256 53% 19% 57 Seasonal
DE_export DE EC XB 100% 6582 6576 0 100% 0% 7 Variable
BE-XAV_AV BE XB 427 31% 1693 1208 199 72% 12% 46 DLR
D7-PST GRON D7 PST 410 19% 1498 589 150 39% 10% 104 Seasonal
NL-XDI_ME NL XB 377 15% 1053 388 208 37% 20% 147 Fixed
BE-XVY_MB BE XB 196 34% 1542 964 191 62% 10% 72 DLR
NL_import NL EC 190 100% 4286 4286 0 100% 0% 9 Seasonal
D7-D7YPAF DOBZI S D7 INT 164 19% 2069 480 177 23% 9% 91 Variable
NL-NLLS NDIM NL INT 153 14% 1732 370 173 21% 10% 131 Fixed
BE-XAU_M. BE XB 139 12% 479 395 66 82% 14% 186 DLR
BE-PST VANYK BE PST 138 32% 1527 949 194 62% 11% 42 Seasonal
D2-D2SIT DAHM D2 INT 115 7% 431 279 40 65% 10% 153 Seasonal
BE-BMERCA BRODE+ BE INT 115 21% 1604 635 188 40% 12% 71 DLR
D4-XLA_KU D4 XB 114 10% 1609 471 175 29% 10% 129 Seasonal
D7-XSI_MB D7 XB 109 26% 1805 1222 112 68% 6% 33 Seasonal
D7-XEN_VI D7 XB 98 22% 1887 766 229 41% 12% 29 Seasonal
BE-BZANDV BDOEL BE INT 97 31% 1517 738 284 49% 20% 89 DLR
D7-D7HANE DGRON D7 INT 87 9% 2074 207 130 10% 6% 254 DLR
D7-D7BE_GU D7 INT 79 5% 1884 115 169 6% 9% 431 Fixed
D2-D2RED DMH D2 INT 72 11% 1527 514 145 34% 10% 112 Fixed
D7-XRO_MB D7 XB 72 21% 1787 643 104 36% 6% 83 Fixed
D7-D7KNAP DSECH D7 INT 67 6% 2182 173 185 8% 8% 159 DLR

77/112
Figure 58: Use of the Thermal Line Capacity (Fmax, vertical axis) for Reference Flows (Fref), Flow Reliability Margins (FRM) and commercial flows from CWE DA cross-zonal exchange (equal to the RAM) for cross-zonal elements when congested, annual averages for 2018. Since the introduction of the 20% minRAM measure at the end of April 2018, CWE TSOs also apply an Adjustment for minRAM (AMR) to ensure that the RAM is equal or higher than 20% of Fmax.
Figure 59: Use of the Thermal Line Capacity (Fmax, vertical axis) for Reference Flows (Fref), Flow Reliability Margins (FRM) and commercial flows from CWE DA cross-zonal exchange (equal to the RAM) for internal lines when congested, annual average for 2018. Since the introduction of the 20% minRAM measure at the end of April 2018, CWE TSOs also apply an Adjustment for minRAM (AMR) to ensure that the RAM is equal or higher than 20% of Fmax.
-500
0
500
1,000
1,500
2,000Fm
ax (
MW
)
Fref (MW) FRM (MW) RAM (MW) AMR (MW)
-500
0
500
1,000
1,500
2,000
2,500
3,000
Fmax
(M
W)
Fref (MW) FRM (MW) RAM (MW) AMR (MW)
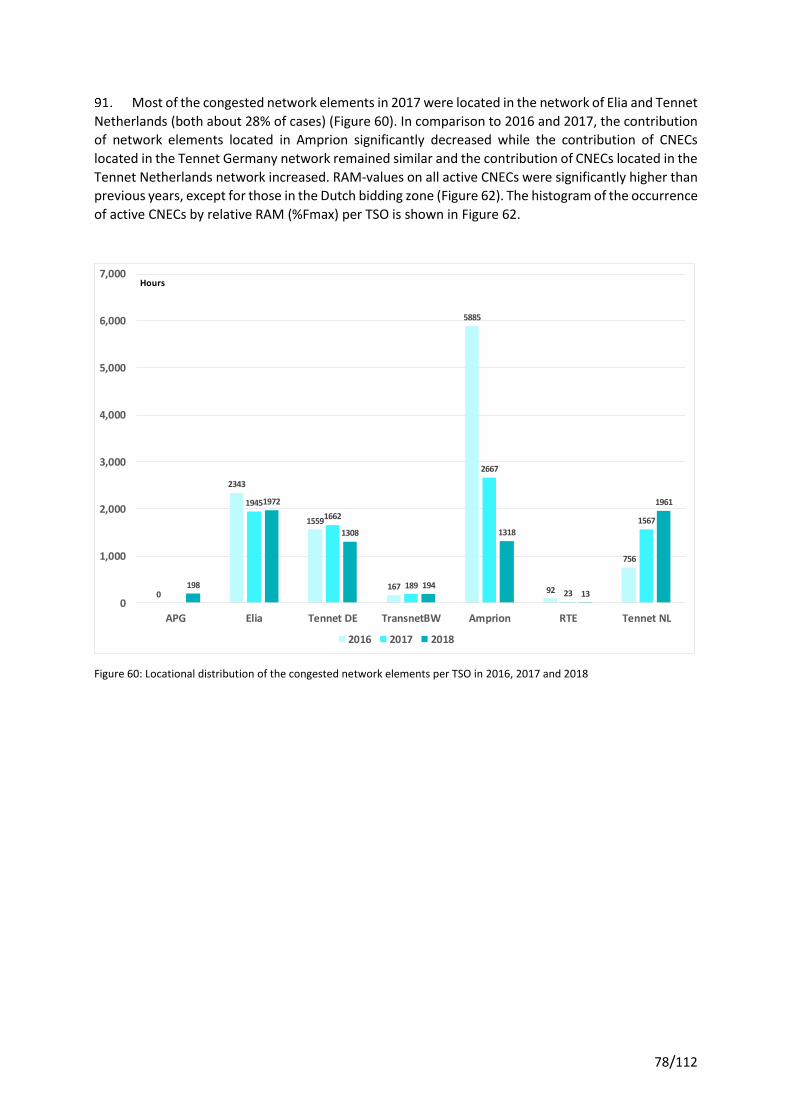
78/112
Most of the congested network elements in 2017 were located in the network of Elia and Tennet
Netherlands (both about 28% of cases) (Figure 60). In comparison to 2016 and 2017, the contribution
of network elements located in Amprion significantly decreased while the contribution of CNECs
located in the Tennet Germany network remained similar and the contribution of CNECs located in the
Tennet Netherlands network increased. RAM-values on all active CNECs were significantly higher than
previous years, except for those in the Dutch bidding zone (Figure 62). The histogram of the occurrence
of active CNECs by relative RAM (%Fmax) per TSO is shown in Figure 62.
Figure 60: Locational distribution of the congested network elements per TSO in 2016, 2017 and 2018
0
2343
1559
167
5885
92
756
1945
1662
189
2667
23
1567
198
1972
1308
194
1318
13
1961
0
1,000
2,000
3,000
4,000
5,000
6,000
7,000
APG Elia Tennet DE TransnetBW Amprion RTE Tennet NL
2016 2017 2018
Hours

79/112
Figure 61: Histogram of the occurrence of congestion by RAM (%Fmax) per TS0 in 2016, 2017 and 2018
Figure 62: Histogram of the occurrence of congestion by RAM (%Fmax) per TS0 in 2018
44%
36%
12%
22%
16%
34%
43%
24%
8%
14%
31%29%
85%
61%
47%
22%
32%
45%
30%
0%
10%
20%
30%
40%
50%
60%
70%
80%
90%
APG Elia Tennet DE TransnetBW Amprion RTE Tennet NL
2016 2017 2018
RAM(% Fmax)
0 6 2048
277
0 40 144
15
227
2
301
547
171
88
246
4
924
20
119
393
37
139
0
402
173
1,799
680
6
429
7
329
0
200
400
600
800
1,000
1,200
1,400
1,600
1,800
2,000
APG Elia Tennet DE TransnetBW Amprion RTE Tennet NL
<10% RAM 10 à 20% RAM 20 à 30% RAM 30 à 40% RAM +40 %RAM
Hours
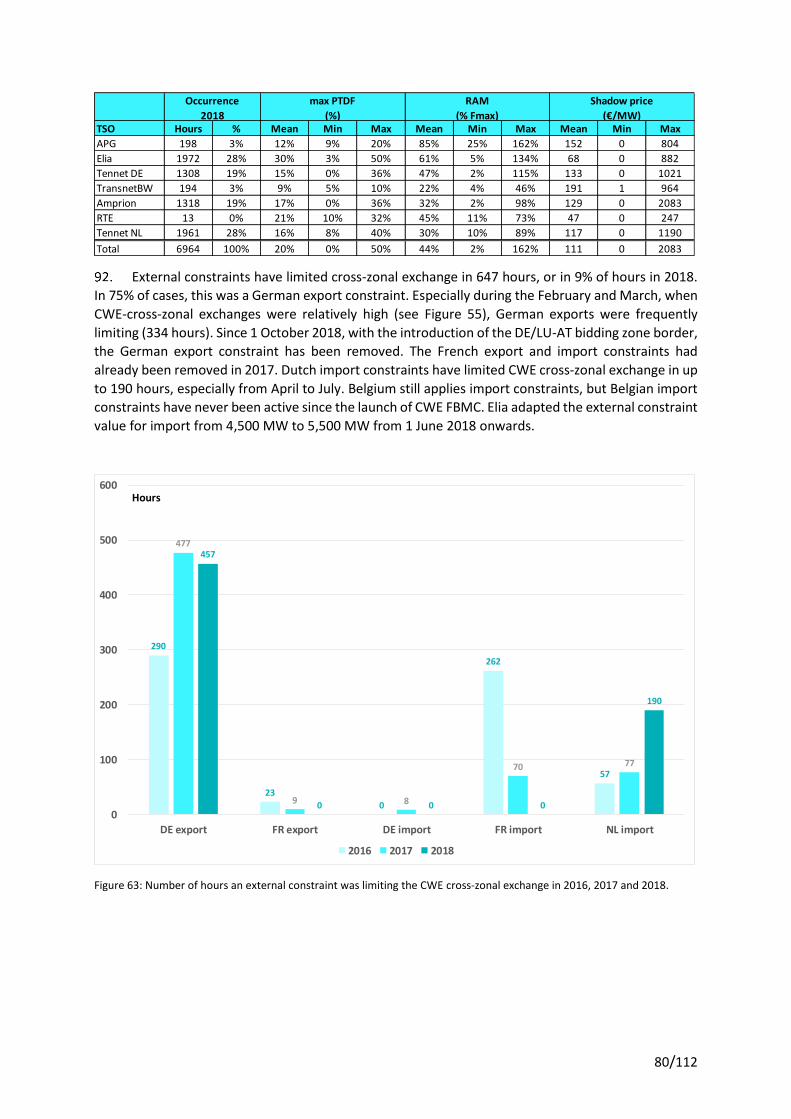
80/112
External constraints have limited cross-zonal exchange in 647 hours, or in 9% of hours in 2018.
In 75% of cases, this was a German export constraint. Especially during the February and March, when
CWE-cross-zonal exchanges were relatively high (see Figure 55), German exports were frequently
limiting (334 hours). Since 1 October 2018, with the introduction of the DE/LU-AT bidding zone border,
the German export constraint has been removed. The French export and import constraints had
already been removed in 2017. Dutch import constraints have limited CWE cross-zonal exchange in up
to 190 hours, especially from April to July. Belgium still applies import constraints, but Belgian import
constraints have never been active since the launch of CWE FBMC. Elia adapted the external constraint
value for import from 4,500 MW to 5,500 MW from 1 June 2018 onwards.
Figure 63: Number of hours an external constraint was limiting the CWE cross-zonal exchange in 2016, 2017 and 2018.
TSO Hours % Mean Min Max Mean Min Max Mean Min Max
APG 198 3% 12% 9% 20% 85% 25% 162% 152 0 804
Elia 1972 28% 30% 3% 50% 61% 5% 134% 68 0 882
Tennet DE 1308 19% 15% 0% 36% 47% 2% 115% 133 0 1021
TransnetBW 194 3% 9% 5% 10% 22% 4% 46% 191 1 964
Amprion 1318 19% 17% 0% 36% 32% 2% 98% 129 0 2083
RTE 13 0% 21% 10% 32% 45% 11% 73% 47 0 247
Tennet NL 1961 28% 16% 8% 40% 30% 10% 89% 117 0 1190
Total 6964 100% 20% 0% 50% 44% 2% 162% 111 0 2083
Occurrence
2018
max PTDF
(%)
RAM
(% Fmax)
Shadow price
(€/MW)
290
23
0
262
57
477
9 8
70 77
457
0 0 0
190
0
100
200
300
400
500
600
DE export FR export DE import FR import NL import
2016 2017 2018
Hours
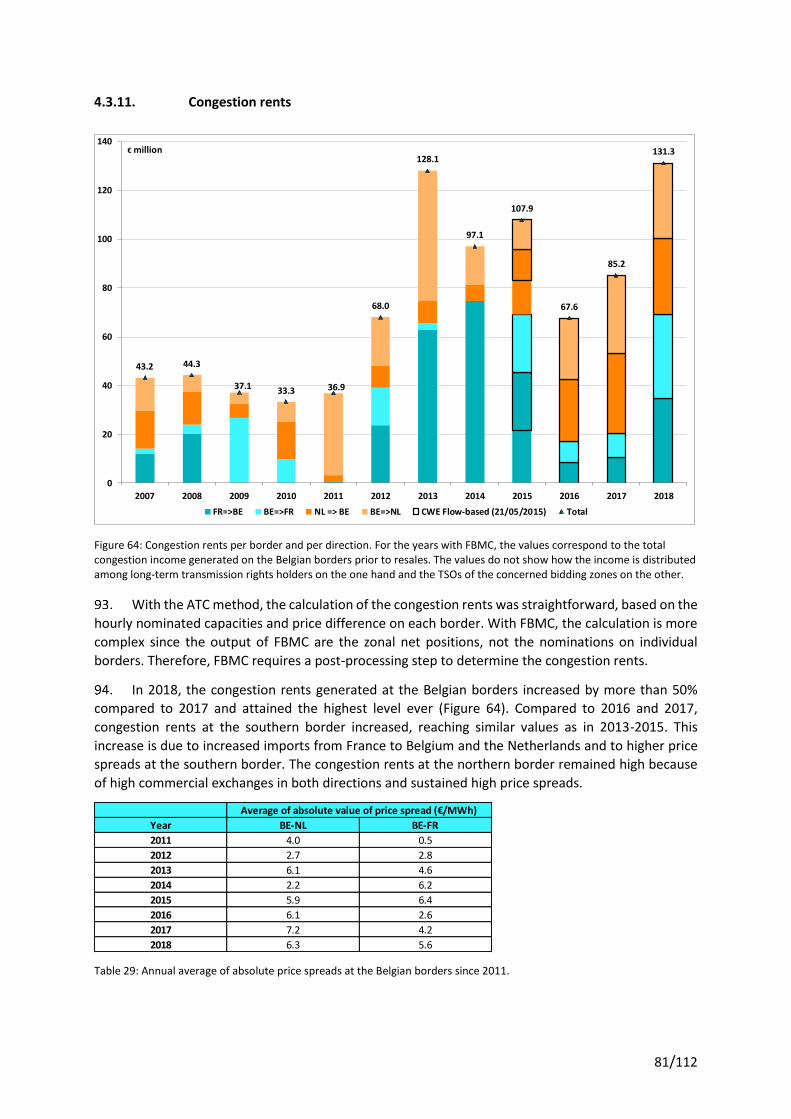
81/112
4.3.11. Congestion rents
Figure 64: Congestion rents per border and per direction. For the years with FBMC, the values correspond to the total congestion income generated on the Belgian borders prior to resales. The values do not show how the income is distributed among long-term transmission rights holders on the one hand and the TSOs of the concerned bidding zones on the other.
With the ATC method, the calculation of the congestion rents was straightforward, based on the
hourly nominated capacities and price difference on each border. With FBMC, the calculation is more
complex since the output of FBMC are the zonal net positions, not the nominations on individual
borders. Therefore, FBMC requires a post-processing step to determine the congestion rents.
In 2018, the congestion rents generated at the Belgian borders increased by more than 50%
compared to 2017 and attained the highest level ever (Figure 64). Compared to 2016 and 2017,
congestion rents at the southern border increased, reaching similar values as in 2013-2015. This
increase is due to increased imports from France to Belgium and the Netherlands and to higher price
spreads at the southern border. The congestion rents at the northern border remained high because
of high commercial exchanges in both directions and sustained high price spreads.
Table 29: Annual average of absolute price spreads at the Belgian borders since 2011.
43.2 44.3
37.1 33.3 36.9
68.0
128.1
97.1
107.9
67.6
85.2
131.3
0
20
40
60
80
100
120
140
2007 2008 2009 2010 2011 2012 2013 2014 2015 2016 2017 2018
FR=>BE BE=>FR NL => BE BE=>NL CWE Flow-based (21/05/2015) Total
€ million
Year BE-NL BE-FR
2011 4.0 0.5
2012 2.7 2.8
2013 6.1 4.6
2014 2.2 6.2
2015 5.9 6.4
2016 6.1 2.6
2017 7.2 4.2
2018 6.3 5.6
Average of absolute value of price spread (€/MWh)

82/112
BALANCING
HISTORICAL BACKGROUND: SIGNIFICANT EVENTS
2012 Single marginal prices for imbalance tariffs were introduced. At the end of June, a virtual
resource with 0 MW capacity was introduced. The objective is to activate the virtual unit at a price
equal to €-100/MWh in periods where all resources for downward activation are activated but still
additional decremental activations are needed. In October, Elia started participating in the
International Grid Control Cooperation platform (IGCC) to optimise the balancing management of the
system and optimize the quality of the frequency. Any imbalances are automatically offset if they are
in opposite directions experienced by system operators. The advantage of this system is that it enables
TSOs to avoid activating secondary reserves in opposite directions. Other IGCC participants are
Amprion, 50Hertz, TransnetBW and TenneT DE (the four German transmission system operators),
Energinet.dk (Denmark), CEPS (Czech Republic), Swissgrid (Switzerland), TenneT NL (The Netherlands),
APG (Austria) and RTE (France).
2014 Asymmetrical products for R1 were introduced, thereby opening the R1 market to demand
response. Additionally, monthly auctions for contracting a part of the R1 and R2 volumes were
introduced. The R3 DP product was introduced. Finally, a special tariff for the hours where strategic
reserve is activated was introduced: €3,000/MWh in case of shortage of injection bids to reach the
clearing of the day-ahead market price and €4,500/MWh in case of structural shortage and technical
trigger in intraday and real time.
2015 Monthly R1 and R2 auctions were extended to contract the whole volume of R1 and R2.
2016 Monthly auctions were introduced to contract a part of the R3 volumes, except for the R3 ICH
product. In August, the market for R1 products was fully opened: any supplier is allowed to participate
in all primary control services, irrespective of the connection point of the resource involved.
Additionally in August, weekly auctions for the whole R1 and R2 volume to be contracted were
organized. Elia and market participants received access to the Regional (AT-BE-DE-NL) Auctions
Platform for R1, to purchase or sell R1 standard products (symmetrical R1 200 mHz).
2017 In February, the project ‘BidLadder’ was finalised, permitting non-CIPU units to offer free bids
for the delivery of tertiary reserves. In March Elia carried out a study concerning the extension of the
existing secondary reserve market. Two extensions by the end of December were proposed: (i) to the
intraday market for CIPU-units and (ii) to day-ahead and intraday for contracted non-CIPU units. In
May a new contractual framework for the delivery of primary reserves was introduced. The energy
sources that qualify for the delivery of primary reserves was extended to include sources with limited
energy volumes such as batteries.
On 25 August the Official Journal of the European Commission published the system operation
guideline. On 28 November the same Journal published guidelines on electricity balancing.
2018 As of 1 June, Transfer of Energy for balancing services for non-reserved mFRR from non-CIPU
units connected to a quarterly meter is allowed. Approved on 24 May, Transfer of Energy reduces
barriers to valorize flexibility services that can be provided by demand resources. From December
onward, Transfer of Energy applied to contracted mFRR Standard and mFRR Flex products.
As of December, contracted mFRR reserves are no longer activated after non-contracted mFRR
reserves irrespective of the price: a merit-order activation is introduced.
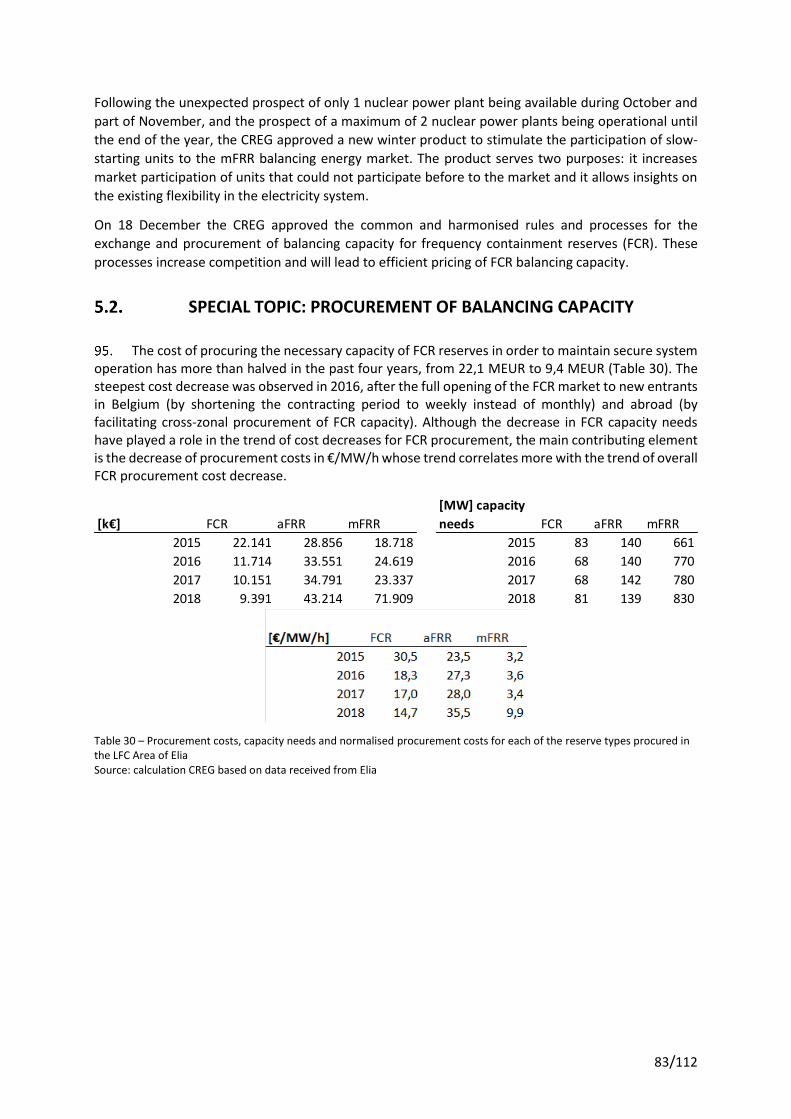
83/112
Following the unexpected prospect of only 1 nuclear power plant being available during October and
part of November, and the prospect of a maximum of 2 nuclear power plants being operational until
the end of the year, the CREG approved a new winter product to stimulate the participation of slow-
starting units to the mFRR balancing energy market. The product serves two purposes: it increases
market participation of units that could not participate before to the market and it allows insights on
the existing flexibility in the electricity system.
On 18 December the CREG approved the common and harmonised rules and processes for the
exchange and procurement of balancing capacity for frequency containment reserves (FCR). These
processes increase competition and will lead to efficient pricing of FCR balancing capacity.
SPECIAL TOPIC: PROCUREMENT OF BALANCING CAPACITY
The cost of procuring the necessary capacity of FCR reserves in order to maintain secure system operation has more than halved in the past four years, from 22,1 MEUR to 9,4 MEUR (Table 30). The steepest cost decrease was observed in 2016, after the full opening of the FCR market to new entrants in Belgium (by shortening the contracting period to weekly instead of monthly) and abroad (by facilitating cross-zonal procurement of FCR capacity). Although the decrease in FCR capacity needs have played a role in the trend of cost decreases for FCR procurement, the main contributing element is the decrease of procurement costs in €/MW/h whose trend correlates more with the trend of overall FCR procurement cost decrease.
Table 30 – Procurement costs, capacity needs and normalised procurement costs for each of the reserve types procured in the LFC Area of Elia Source: calculation CREG based on data received from Elia
[k€] FCR aFRR mFRR
[MW] capacity
needs FCR aFRR mFRR
2015 22.141 28.856 18.718 2015 83 140 661
2016 11.714 33.551 24.619 2016 68 140 770
2017 10.151 34.791 23.337 2017 68 142 780
2018 9.391 43.214 71.909 2018 81 139 830

84/112
Figure 65 – FCR capacity procurement costs in 2018, per week and per product Source: calculation CREG based on data received from Elia
In 2018, every weekly auction FCR capacity is partially procured from outside of Belgium (Figure 65). For the remaining FCR capacity needs, either the fully symmetric 200 mHz profile is procured or this symmetric profile is assembled from symmetric 100 mHz and asymmetric products (“R1 down” and “R1 Upward”). The figure illustrates that opening the market to market participants outside of Belgium is important to create sufficient levels of competition in the FCR procurement market processes. Given that the capacity of asymmetric products has to be equal to the capacity of 100 mHz symmetric products (otherwise it is not possible to assemble the symmetric 200 mHz profile), it can also be derived from the figure that asymmetric products cost much less than symmetric products. Therefore, the figure also illustrates the importance of opening up the market to facilitate the participation of market participants offering competitive asymmetric products.
The importance of opening the markets for the procurement of reserves to new entrants in Belgium and abroad is accentuated when analysing the trend of aFRR and mFRR procurement cost. Procurement costs for aFRR capacity has increased by 52% while the necessary aFRR capacity has remained more or less constant (Table 30). Procurement costs for mFRR capacity have increased by 380%. Although part of the increase in procurement costs is caused by increasing needs for mFRR capacity to maintain system security, the cost increase in €/MW/h is again the main contributing element, despite measures being taken in 2017 and 2018 to reduce barriers to entry for new market participants in Belgium.
The steepest increase of aFRR and mFRR procurement costs was observed in the year 2018. More precisely, the increase of aFRR and mFRR procurement costs was observed during the last quarter of the year, during the same period high day-ahead prices were observed (Figure 66 and Figure 67). As the aFRR and mFRR capacity is contracted prior to the day-ahead market, market participants tend to include opportunity costs in their prices for aFRR or mFRR capacity: the higher the day-ahead market prices, the higher the opportunity costs and the more expensive the procurement of aFRR and mFRR reserves becomes.
0
50.000
100.000
150.000
200.000
250.000
300.000
350.000
W0
1 2
01
8
W0
3 2
01
8
W0
5 2
01
8
W0
7 2
01
8
W0
9 2
01
8
W1
1 2
01
8
W1
3 2
01
8
W1
5 2
01
8
W1
7 2
01
8
W1
9 2
01
8
W2
1 2
01
8
W2
3 2
01
8
W2
5 2
01
8
W2
7 2
01
8
W2
9 2
01
8
W3
1 2
01
8
W3
3 2
01
8
W3
5 2
01
8
W3
7 2
01
8
W3
9 2
01
8
W4
1 2
01
8
W4
3 2
01
8
W4
5 2
01
8
W4
7 2
01
8
W4
9 2
01
8
W5
1 2
01
8
R1 200mHz symmetric (non-BE) R1 200mHz symmetric (BE) R1 100mHz Symmetric R1 down R1 Upward
EUR

85/112
Figure 66 –aFRR capacity procurement cost in 2018, per week and per direction Source: calculation CREG based on data received from Elia
Figure 67 – mFRR procurement costs in 2018, per month and separated per product (standard vs. flex) Source: calculation CREG based on data received from Elia
0
500.000
1.000.000
1.500.000
2.000.000
2.500.000
3.000.000
W0
1 2
01
8
W0
3 2
01
8
W0
5 2
01
8
W0
7 2
01
8
W0
9 2
01
8
W1
1 2
01
8
W1
3 2
01
8
W1
5 2
01
8
W1
7 2
01
8
W1
9 2
01
8
W2
1 2
01
8
W2
3 2
01
8
W2
5 2
01
8
W2
7 2
01
8
W2
9 2
01
8
W3
1 2
01
8
W3
3 2
01
8
W3
5 2
01
8
W3
7 2
01
8
W3
9 2
01
8
W4
1 2
01
8
W4
3 2
01
8
W4
5 2
01
8
W4
7 2
01
8
W4
9 2
01
8
W5
1 2
01
8
R2 down R2 up
EUR
0
5.000.000
10.000.000
15.000.000
20.000.000
25.000.000
30.000.000
35.000.000
JAN FEB MAR APR MAY JUN JUL AUG SEP OCT NOV DEC
Std Flex
EUR
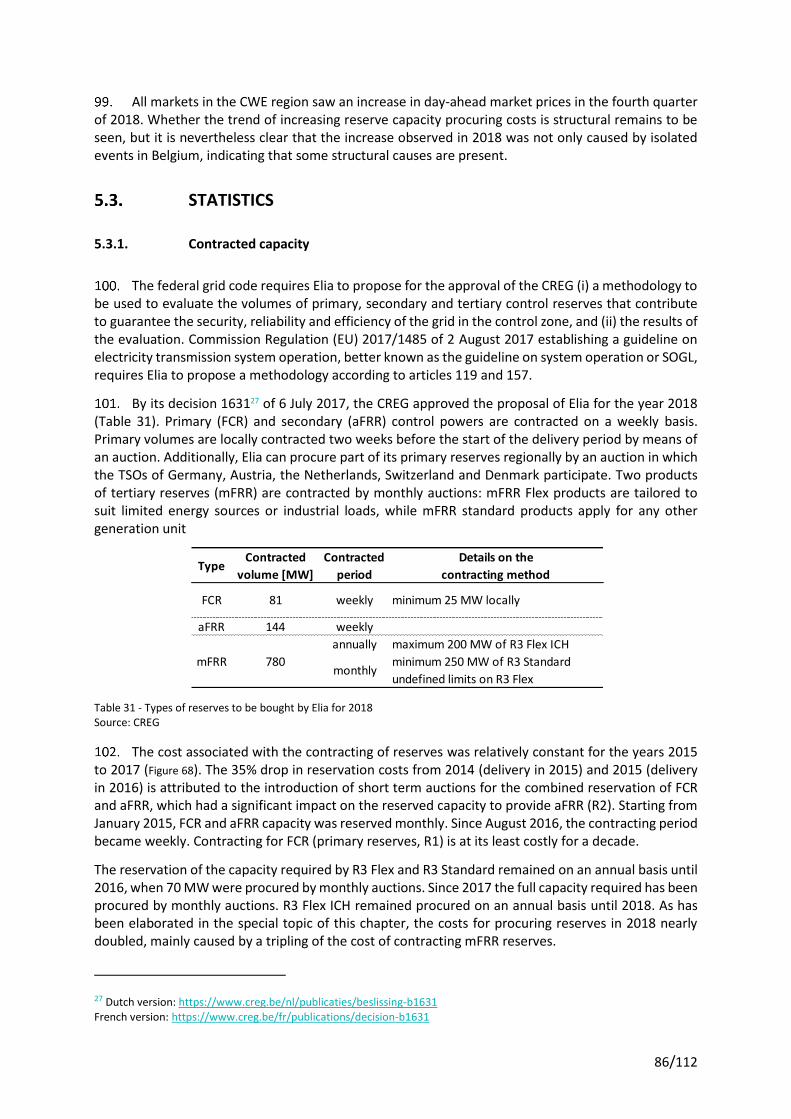
86/112
All markets in the CWE region saw an increase in day-ahead market prices in the fourth quarter of 2018. Whether the trend of increasing reserve capacity procuring costs is structural remains to be seen, but it is nevertheless clear that the increase observed in 2018 was not only caused by isolated events in Belgium, indicating that some structural causes are present.
STATISTICS
5.3.1. Contracted capacity
The federal grid code requires Elia to propose for the approval of the CREG (i) a methodology to be used to evaluate the volumes of primary, secondary and tertiary control reserves that contribute to guarantee the security, reliability and efficiency of the grid in the control zone, and (ii) the results of the evaluation. Commission Regulation (EU) 2017/1485 of 2 August 2017 establishing a guideline on electricity transmission system operation, better known as the guideline on system operation or SOGL, requires Elia to propose a methodology according to articles 119 and 157.
By its decision 163127 of 6 July 2017, the CREG approved the proposal of Elia for the year 2018 (Table 31). Primary (FCR) and secondary (aFRR) control powers are contracted on a weekly basis. Primary volumes are locally contracted two weeks before the start of the delivery period by means of an auction. Additionally, Elia can procure part of its primary reserves regionally by an auction in which the TSOs of Germany, Austria, the Netherlands, Switzerland and Denmark participate. Two products of tertiary reserves (mFRR) are contracted by monthly auctions: mFRR Flex products are tailored to suit limited energy sources or industrial loads, while mFRR standard products apply for any other generation unit
Table 31 - Types of reserves to be bought by Elia for 2018 Source: CREG
The cost associated with the contracting of reserves was relatively constant for the years 2015 to 2017 (Figure 68). The 35% drop in reservation costs from 2014 (delivery in 2015) and 2015 (delivery in 2016) is attributed to the introduction of short term auctions for the combined reservation of FCR and aFRR, which had a significant impact on the reserved capacity to provide aFRR (R2). Starting from January 2015, FCR and aFRR capacity was reserved monthly. Since August 2016, the contracting period became weekly. Contracting for FCR (primary reserves, R1) is at its least costly for a decade.
The reservation of the capacity required by R3 Flex and R3 Standard remained on an annual basis until 2016, when 70 MW were procured by monthly auctions. Since 2017 the full capacity required has been procured by monthly auctions. R3 Flex ICH remained procured on an annual basis until 2018. As has been elaborated in the special topic of this chapter, the costs for procuring reserves in 2018 nearly doubled, mainly caused by a tripling of the cost of contracting mFRR reserves.
27 Dutch version: https://www.creg.be/nl/publicaties/beslissing-b1631 French version: https://www.creg.be/fr/publications/decision-b1631
TypeContracted
volume [MW]
Contracted
period
Details on the
contracting method
aFRR 144 weekly
annually maximum 200 MW of R3 Flex ICH
minimum 250 MW of R3 Standard
undefined limits on R3 Flex
minimum 25 MW locally
mFRR
FCR 81
780
weekly
monthly

87/112
Figure 68 – Cost of contracting reserves, per year of contracting, per type of reserve. The reddish bars together form the reservation cost for tertiary reserves (mFRR). The black number presents the total cost for contracting reserves while the black line represents the budgeted cost. The purple diamonds indicate the cost of contracting reserves per unit of MW offtake in the Elia LFC Area. Source: CREG based on data provided by Elia
The reservation of black-start ancillary services has increased in cost in recent years, from 6.25 MEUR in 2014 to 7.28 in 2017 (Table 32). In 2018 the cost for the reservation of black-start ancillary services remained stable. The cost for contracting ancillary services for the provision of reactive power continued its significant reduction from 0,50 MEUR in 2018. The costs of contracting reserves during 2015 to 2017 were far below the budgeted costs, as well as in 2018.
The reservation costs of power reserves are shared equally by consumers and producers, including the reservation cost for the black start service. The cost for contracting reactive power reserve is fully covered by consumers. Dividing the respective costs with the amount generated to and taken off the Elia grid gives the actual cost for individual producers and consumers in EUR/MWh. The cost for producers in €/MWh more than doubled with respect to 2017; the cost for consumers in €/MWh increased with 70%.
The actual cost differs compared with the necessary tariff as estimated by Elia for the tariff period 2016-201928. Any deviation will be recovered (or added if the tariff was underestimated) during the next tariff period.
28 http://www.creg.be/sites/default/files/assets/Tarifs/Elia/171222_ELIA_Tarifs2016_2019_NL.pdf
25 2922
12 10 10
5357
29
33 3543
2115
14
13 12
49
4 4
3
3 3
2
26 9
23103
107
7067
69
124
0,00
0,20
0,40
0,60
0,80
1,00
1,20
1,40
1,60
1,80
0
20
40
60
80
100
120
140
160
2013 2014 2015 2016 2017 2018
R1 Contracting R2 Contracting R3 Standard Contracting
R3 Flex ICH Contracting R3 Flex Contracting Budgeted Contracting cost of reserves
Total cost per load Elia
MEUR €/MWh
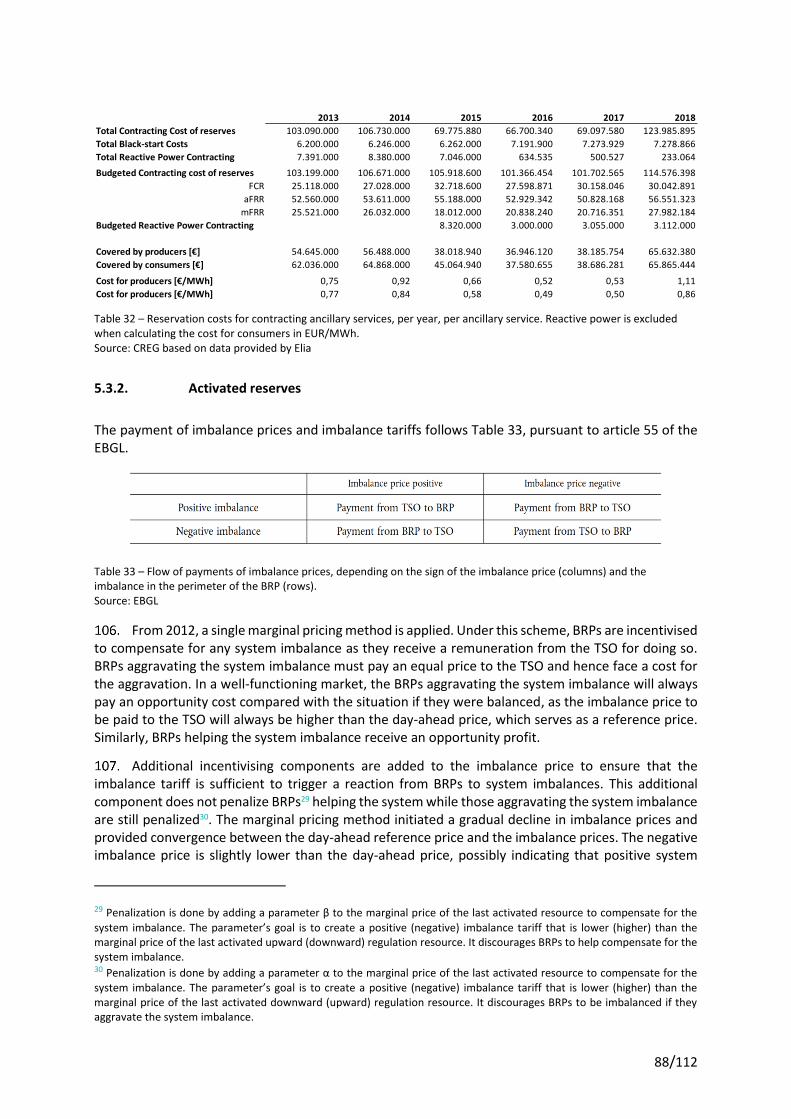
88/112
Table 32 – Reservation costs for contracting ancillary services, per year, per ancillary service. Reactive power is excluded when calculating the cost for consumers in EUR/MWh. Source: CREG based on data provided by Elia
5.3.2. Activated reserves
The payment of imbalance prices and imbalance tariffs follows Table 33, pursuant to article 55 of the EBGL.
Table 33 – Flow of payments of imbalance prices, depending on the sign of the imbalance price (columns) and the imbalance in the perimeter of the BRP (rows). Source: EBGL
From 2012, a single marginal pricing method is applied. Under this scheme, BRPs are incentivised to compensate for any system imbalance as they receive a remuneration from the TSO for doing so. BRPs aggravating the system imbalance must pay an equal price to the TSO and hence face a cost for the aggravation. In a well-functioning market, the BRPs aggravating the system imbalance will always pay an opportunity cost compared with the situation if they were balanced, as the imbalance price to be paid to the TSO will always be higher than the day-ahead price, which serves as a reference price. Similarly, BRPs helping the system imbalance receive an opportunity profit.
Additional incentivising components are added to the imbalance price to ensure that the imbalance tariff is sufficient to trigger a reaction from BRPs to system imbalances. This additional component does not penalize BRPs29 helping the system while those aggravating the system imbalance are still penalized30. The marginal pricing method initiated a gradual decline in imbalance prices and provided convergence between the day-ahead reference price and the imbalance prices. The negative imbalance price is slightly lower than the day-ahead price, possibly indicating that positive system
29 Penalization is done by adding a parameter β to the marginal price of the last activated resource to compensate for the
system imbalance. The parameter’s goal is to create a positive (negative) imbalance tariff that is lower (higher) than the marginal price of the last activated upward (downward) regulation resource. It discourages BRPs to help compensate for the system imbalance. 30 Penalization is done by adding a parameter α to the marginal price of the last activated resource to compensate for the system imbalance. The parameter’s goal is to create a positive (negative) imbalance tariff that is lower (higher) than the marginal price of the last activated downward (upward) regulation resource. It discourages BRPs to be imbalanced if they aggravate the system imbalance.
2013 2014 2015 2016 2017 2018
Total Contracting Cost of reserves 103.090.000 106.730.000 69.775.880 66.700.340 69.097.580 123.985.895
Total Black-start Costs 6.200.000 6.246.000 6.262.000 7.191.900 7.273.929 7.278.866
Total Reactive Power Contracting 7.391.000 8.380.000 7.046.000 634.535 500.527 233.064
Budgeted Contracting cost of reserves 103.199.000 106.671.000 105.918.600 101.366.454 101.702.565 114.576.398
FCR 25.118.000 27.028.000 32.718.600 27.598.871 30.158.046 30.042.891
aFRR 52.560.000 53.611.000 55.188.000 52.929.342 50.828.168 56.551.323
mFRR 25.521.000 26.032.000 18.012.000 20.838.240 20.716.351 27.982.184
Budgeted Reactive Power Contracting 8.320.000 3.000.000 3.055.000 3.112.000
Covered by producers [€] 54.645.000 56.488.000 38.018.940 36.946.120 38.185.754 65.632.380
Covered by consumers [€] 62.036.000 64.868.000 45.064.940 37.580.655 38.686.281 65.865.444
Cost for producers [€/MWh] 0,75 0,92 0,66 0,52 0,53 1,11
Cost for producers [€/MWh] 0,77 0,84 0,58 0,49 0,50 0,86

89/112
imbalances over 140 MW occur or that BRPs do not solve all portfolio imbalances on the day-ahead market.
Figure 69 – Yearly averaged positive and negative imbalance tariffs. The yearly averaged day-ahead price serves as reference. Source: CREG based on data provided by Elia
Figure 70 – Standard deviation of the positive and negative imbalance tariff Source: CREG based on data provided by Elia
41,7796
70,6147
39,3601
46,3022
49,370546,9774 47,4461
40,7890
44,6794
36,6163
44,5832
55,2719
48,6372
77,9192
44,2506
57,2448
62,6976
54,0494
49,3584
41,0714
44,1800
35,7268
43,0408
54,1840
22,0912
43,2419
19,8604
27,760729,2189
51,838347,9061
40,3267
43,4779
34,9030
42,2315
53,3738
0
10
20
30
40
50
60
70
80
90
2007 2008 2009 2010 2011 2012 2013 2014 2015 2016 2017 2018
Mean Belpex Day-Ahead Market Price Negative Imbalance Price Positive Imbalance Price
€/MWh
59,1646
31,9338
21,1574
29,1060
47,381345,3007
53,6587
33,4372
49,9668
47,1861
56,8127
66,8512
32,2761
30,1368
21,3651
22,5114
24,2431
45,8095
53,9921
33,3531
49,8389
46,9484
56,3007
66,3781
54,4725
30,8342
17,3166 16,4141
35,4865
16,4772
19,3456
12,6805
21,432323,5273
21,627923,5450
0
10
20
30
40
50
60
70
80
2007 2008 2009 2010 2011 2012 2013 2014 2015 2016 2017 2018
StDev Negative Imbalance Price StDev Positive Imbalance Price StDev Belpex Day-Ahead Market Price
€/MWh

90/112
Figure 71 – Coefficient of variation of balancing tariffs and the day-ahead market price Source: CREG based on data provided by Elia
The yearly standard deviation of positive and negative imbalance tariffs increased by €10.0/MWh in 2018 compared to 2017, while that of the day-ahead market price increased only slightly back to the level in 2016. The standard deviations of the positive and negative imbalance tariff are closely coupled.
The annual coefficient of variation31 of the balancing tariffs declined in 2018 compared to 2017 and 2016, indicating that the relative risk has decreased. The coefficient on the day-ahead market has decreased as well. The yearly volatility of imbalance prices is however 3 times larger than those of day-ahead prices.
The activated energy, including imbalance netting (IGCC), remained stable in 2018 in comparison with 2017. Non-contracted mFRR, IGCC, and aFRR cover 98,4% of all balancing needs.
Imbalance netting and secondary control (R2/aFRR) are closely linked in nature. As it is calculated before activating aFRR, IGCC avoids aFRR activations and frees aFRR capacity for additional activations. As such, IGCC and aFRR can be considered as very similar in nature, even if IGCC is not a true activation, but through imbalance netting, a way to avoid physical activations. Both complement each other and their sum is relevant to show the increasing importance of automatic control of imbalances compensation.
31 The coefficient of variation equals the standard deviation divided by the average. It is a scaled, relative value of volatility.
122%
41%
48%51%
76%84%
109%
81%
113%
132% 132%
123%
146%
70%
108%
81% 83%
88%
113%
83%
115%
135% 133%
124%130%
44%
44%
35%
72%
35%
41%
31%
48%
64%
49%
43%
0%
20%
40%
60%
80%
100%
120%
140%
160%
2007 2008 2009 2010 2011 2012 2013 2014 2015 2016 2017 2018
Coefficient Negative Imbalance Coefficient Positive Imbalance Coefficient DAM

91/112
Figure 72 – Balancing energy activated by product type Source: CREG based on data provided by Elia
0,13
0,28 0,300,24 0,24 0,27
-0,18-0,26 -0,28 -0,25 -0,27 -0,24
0,12
0,090,10
0,07 0,070,09
-0,20 -0,07 -0,07 -0,06 -0,07 -0,08
0,04
0,12 0,070,17 0,17
0,14
-0,14 -0,19 -0,18 -0,26 -0,26 -0,26
0,640,70
0,76
0,64 0,66 0,69
1,11
0,98 0,940,99 1,01 1,02
-1,4
-1,2
-1
-0,8
-0,6
-0,4
-0,2
0
0,2
0,4
0,6
0,8
1
1,2
1,4
-1
-0,8
-0,6
-0,4
-0,2
0
0,2
0,4
0,6
0,8
1
2013 2014 2015 2016 2017 2018
Mill
ion
s
R2 mFRR, non-contracted IGCC
mFRR, R3 Standard mFRR, R3 Flex mFRR, R3 Flex ICH
Shared reserves inter-TSO Total locally activated Total + IGCC
TWhTWh TWh
92/112
SECURITY OF SUPPLY
6.1.1. Introduction
The CREG believes it is important to evaluate how close or far Belgium was from an adequacy problem. Did we just miss an involuntary load shedding by a hair, or was there still sufficient capacity for Belgium?
In May 2019, the CREG published its study on winter 2018-2019, which was impacted by a the unavailability of several nuclear power plants. In this study, the CREG developed an indicator to measure ex-post how much capacity was still available before involuntary load shedding would have to take place to avoid a black-out.
In this chapter, the part on the SoS-indicator from the study on the winter 2018-2019 will be re-incorporated into this monitoring report. In the following years, this indicator will be calculated and published in the yearly monitoring report.
For this, we will evaluate every day that saw, at least during one hour, a day ahead price equal to or higher than 300 €/MWh on the power exchange.
There were 6 such days in 2018: 24 September, 5 November, 20 November, 21 November, 22 November and 26 November. These days will be analyzed below.
In the analysis, the additional available capacity will be calculated before Belgium would have to envisage involuntary curtailment for the next day, because all demand could not have been met, even though market parties are willing to pay the highest price possible (i.e. 3.000 €/MWh).
To be able to calculate the additional capacity that would have been available if prices had gone to 3.000 €/MWh, four types of capacities are evaluated:
- ‘Additional explicitly available domestic capacity’: this is the additional capacity offered on the Belgian power exchange by Belgian market players. This can be calculated for each hour of the day, based on the aggregated supply and demand curves on the day-ahead power exchange.
- ‘Additional explicitly available import’: this is the additional capacity offered on the Belgian power exchange by foreign market players. This can be calculated for each hour of the day, as the difference of the actual import/export position and the maximal Belgian import capacity (with an additional check whether the resources are available on the foreign power exchanges).
- ‘Additional implicitly available domestic capacity’: this is an estimation by the CREG of the additional capacity not offered on the Belgian power exchange. This estimation is based on the data the CREG received from certain market players and consists mostly of the special measures that were taken by market parties to address the sudden adequacy crisis due to the unexpected nuclear unavailability.
- ‘Available balancing reserve (R23)’: the available balancing reserves for balancing the system. According to European legislation, these reserves need to be exhausted before involuntary load shedding32. The volume of these reserves are proposed by Elia and approved by the CREG. In 2018, these reserves had to be 139 MW on R2 (aFRR) and 830 MW on R3 (mFRR), totaling 969 MW.
32 See article 21 of the network code on ‘Emergency & Restoration’: https://eur-lex.europa.eu/legal-content/EN/TXT/HTML/?uri=CELEX:32017R2196&from=EN#d1e1893-54-1
93/112
In the next section, the total additional capacity will be calculated for each of the six days with a day-ahead price at or above 300 €/MWh for at least one hour. This capacity indicates how far Belgium was from involuntary load shedding.
As regards adequacy, the CREG focuses on the day-ahead time frame. It is also in day-ahead (and intraday) that a TSO should make an adequacy assessment33. The day-ahead is also the most liquid market and through the ‘adequacy patch’ the import capacity is prioritized for countries (price zones) who risk having insufficient capacity (and are therefore willing to pay the highest price possible).
However, the balancing reserves cannot be offered in the day-ahead timeframe, because these reserves need to be kept out of the day-ahead market and so these volumes have no impact on the day-ahead price formation. Hence, if the price on the day ahead market reaches the price cap and the adequacy patch is activated (increasing the import), the balancing capacity is still available as an extra buffer in real time if there is a problem with adequacy. This extra buffer should be taken into account in assessing how far Belgium was from involuntary load shedding.
6.1.2. Special days
24 September 2018
On 24 September 2018, a day-ahead price of 411 €/MWh was reached for hour 21. The figure below shows for this day the available capacity there was still left in day-ahead before consumers would have to be curtailed.
Figure 45 shows that Belgium had still at least 3.700 MW of available capacity, of which at least 2,700 MW was explicitly available on the day-ahead power exchange. This means Belgium was still far from having a problem with security of supply. Note that for this day the estimation of implicitly available capacity that consists mostly of the special measures is estimated at zero, since by the end of September these measures were not yet taken.
33 See article 107 of the Guideline on ‘System Operation’: https://eur-lex.europa.eu/legal-content/EN/TXT/HTML/?uri=CELEX:32017R1485&from=EN
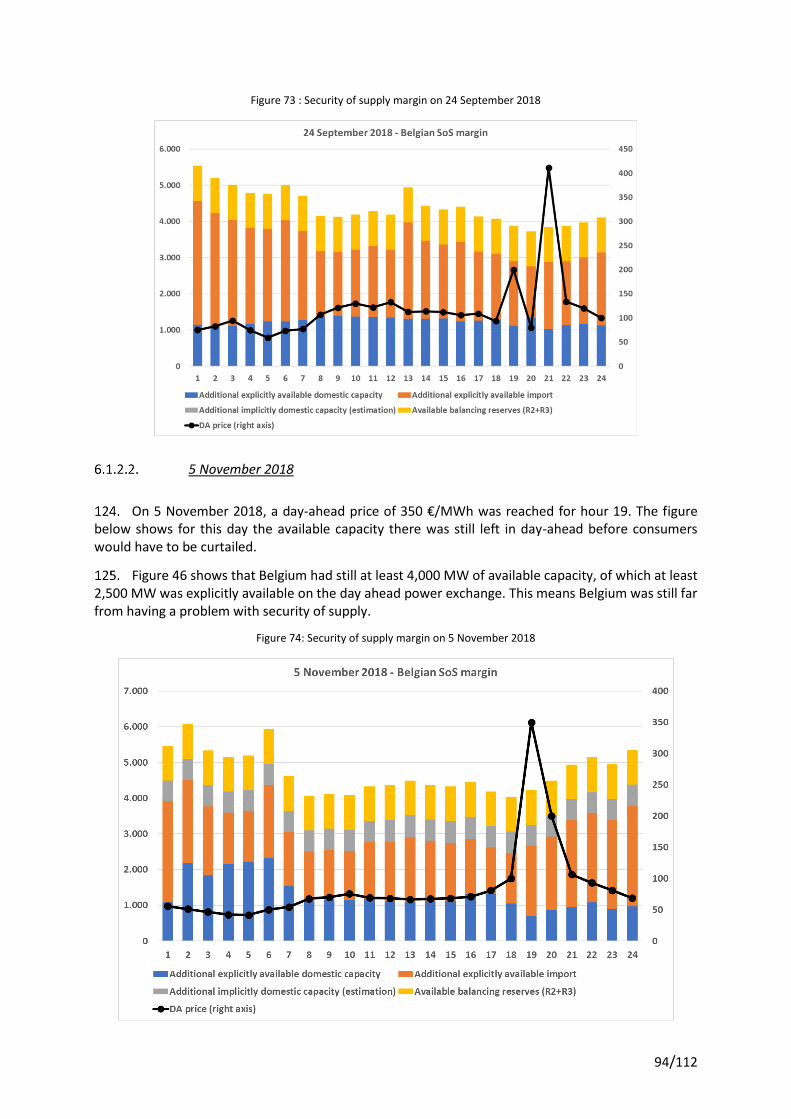
94/112
Figure 73 : Security of supply margin on 24 September 2018
5 November 2018
On 5 November 2018, a day-ahead price of 350 €/MWh was reached for hour 19. The figure below shows for this day the available capacity there was still left in day-ahead before consumers would have to be curtailed.
Figure 46 shows that Belgium had still at least 4,000 MW of available capacity, of which at least 2,500 MW was explicitly available on the day ahead power exchange. This means Belgium was still far from having a problem with security of supply.
Figure 74: Security of supply margin on 5 November 2018

95/112
20-22 November 2018
On 20 to 22 November 2018, several day-ahead prices were above 300 €/MWh, with a maximum day-ahead price of 499 €/MWh reached on 21 November for hour 19. The figure below shows for this day the available capacity there was still left in day-ahead before consumers would have to be curtailed.
Figure 47 shows that Belgium had still at least 4,300 MW of available capacity, of which at least 2,700 MW was explicitly available on the day ahead power exchange. This means Belgium was still far from having a problem with security of supply.
Figure 75 : Security of supply margin on 20-22 November 2018
26 November 2018
On 5 November 2018, a day-ahead price of 331 €/MWh was reached for hour 19. The figure below shows for this day the available capacity there was still left in day-ahead before consumers would have to be curtailed.
Figure 48 shows that Belgium had still at least 4,100 MW of available capacity, of which at least 2,600 MW was explicitly available on the day-ahead power exchange. This means Belgium was still far from having a problem with security of supply.

96/112
Figure 76 : Security of supply margin on 26 November 2018
6.1.3. Conclusion
In 2018, there were 6 days with day ahead prices above 300 €/MWh, indicating a certain scarcity of capacity. All these days occurred at the end of 2018, when nuclear availability was historically low. However, from a detailed analysis of these days, it is clear that for all of them, there was more than sufficient capacity left to address an additional adversity, like losing another production unit or having a severe cold spell, without running the risk of involuntary load shedding. The minimum available capacity in the system is conservatively estimated as at least 3,700 MW, of which 2,500 MW of capacity was explicitly available on the day-ahead power exchange (most of it coming from imports). It is clear that there was still a large capacity margin, even though Belgium faced the lowest nuclear availability for more than 20 years.
Even this high volume is probably an underestimate of the adequacy margin, since the CREG only analyzed part of the market regarding the special measures that were taken to address the unexpected adequacy crisis. There could have been even more flexibility that was already implicitly available in the market. For example, more and more supply contracts are so-called pass-through contracts. With these contracts, the imbalance tariffs are “passed through” to consumers, incentivizing them to lower consumption when imbalance tariffs are high. The total market of these contracts easily surpasses 500 MW. This flexibility is not taken into account because the CREG has no information on whether these contracts are already counted for, thus avoiding the risk of double counting.

97/112
CONCLUSIONS
The Elia grid load in 2018 decreased slightly to 76.7 TWh compared to the previous years and is at its lowest level for the period under review starting in 2007. The maximum Elia grid load, at 12,750 MW, is also at its lowest level for this period.
The maximum Elia grid load in 2018 was 12,440 MW, significantly lower than all the previous years, confirming the downward trend of the Elia grid peak load.
Following years of stagnation, there was an increase of 20% in solar electricity generation. In 2018, solar panels produced 3.6 TWh, up from 2.9 TWh in 2017. There seems to be no significant impact of this increase of solar generation on the variability of the Elia grid load.
The total installed generation capacity increased from 14.1 GW to 15.4 GW in 2018, mainly due to an increase in installed offshore wind capacity and due to the market reaction after the announced unavailability of nuclear plants. In 2018, national generation decreased by almost 20% compared to 2017. In a special topic, the correlation between the age of a CCGT and nuclear units and their planned unavailability and forced outage rate were analysed. On average, an increased unavailability can be observed for older units. The analysis shows that this unavailability is mainly caused by an increase of planned unavailability for the older assets while the forced outage rate seems to be much less affected by the age of the units.
The evolution of the profitability of CCGT plants in Belgium was analysed in a special topic. The main conclusion of the topic is that the outlook of the profitability of an average CCGT plant in Belgium has recently improved. Since 2014, selling energy for delivery the next year has become increasingly profitable as both the frequency and absolute value of the average positive CSS has increased. The same conclusion, albeit a preliminary one, holds for sales for delivery the year after next year. The increase in profitability is primarily caused by European market evolutions given that for the next 2 years, the Belgian electricity mix and market forces still ensure that CCGT plants operate under mid- or peak-load conditions. The profitability based on baseload wholesale electricity products therefore enables CCGT plant operators to pursue multiple strategies to valorise their plants.
Average yearly day-ahead prices increased in each country in Central-West Europe (CWE) in 2018 compared to 2017. The increase is the result of structurally higher day-ahead prices and increases in prices during the last quarter of 2018. Prices never exceeded €500/MWh. The increase in day-ahead prices rippled through to forward markets in the CWE region, illustrating that scarcity prices in an energy-only market can provide the necessary longer term price signals, for example for the continued operation of existing peak power plants. Additionally, the electricity volume traded on the Belgian intraday market increased, surpassing 2 TWh. Primarily originating from cross-border trade, this indicates an increasing need for providing flexibility close to real-time, which provides opportunities for flexible generation units or demand facilities. [Next chapters]
Since 2013, following the introduction of a single price mechanism, the average imbalance tariff (the “real-time electricity price”), is very close to the average day-ahead price. This was also the case in 2018. As such, the average day ahead price serves as an unbiased predictor of the average real-time price. Significant hourly differences exist however, providing opportunities for small, flexible generation units or demand facilities. In 2018, 144 MW of aFRR and 780 MW of mFRR were contracted. Even though these volumes are similar to those contracted in 2017, the cost to cover the system risk doubled, mainly driven by increases in opportunity costs. The use of reserves for balancing the Elia grid was 690 GWh (down and up regulation combined), an increase with respect to the use of reserves in 2017, indicating that BRPs were less successful in maintaining their portfolios balanced on aggregate. Activation of 401 GWh of reserves was avoided with IGCC, a mechanism through which the imbalance of one country can be netted with other countries participating in the mechanism. Consequently, the
98/112
IGCC mechanism highlights, also for balancing and reserves, the importance for Belgium in cooperating at the European level in the interest of Belgian consumers. Lastly, 502 GWh of aFRR were activated (up and down) as well as 188 GWh of mFRR (up, down, contracted and non-contracted). Since 2013, following the introduction of a single price mechanism, the average imbalance tariff (the “real-time electricity price”), is very close to the average day-ahead price. This was also the case in 2018. As such, the average day ahead price serves as an unbiased predictor of the average real-time price. Significant hourly differences exist however, providing opportunities for small, flexible generation units or demand facilities. In 2018, 144 MW of aFRR and 780 MW of mFRR were contracted. Even though these volumes were similar to those contracted in 2017, the cost to cover the system risk doubled, mainly driven by increases in opportunity costs. The use of reserves for balancing the Elia grid was 690 GWh (down and up regulation combined), an increase with respect to the use of reserves in 2017, indicating that BRPs were less successful in maintaining their portfolios balanced on aggregate. Activation of 401 GWh of reserves was avoided with IGCC, a mechanism through which the imbalance of one country can be netted with other countries participating in the mechanism. Consequently, the IGCC mechanism highlights the importance for Belgium in cooperating at the European level in the interest of Belgian consumers, also for balancing and reserves. Lastly, 502 GWh of aFRR were activated (up and down) as well as 188 GWh of mFRR (up, down, contracted and non-contracted).
In 2018, there were 6 days with day-ahead prices above 300 €/MWh, indicating a certain scarcity of capacity. All these days occurred at the end of 2018, when nuclear availability was historically low. However, from a detailed analysis of these days, it is clear that for all these days there was more than sufficient capacity left to address additional adversity, like losing another production unit or having a severe cold spell, without running the risk of involuntary load shedding. The minimal available capacity in the system is conservatively estimated as at least 3,700 MW, of which 2,500 MW of capacity was explicitly available on the day ahead power exchange (most of it coming from imports). It is clear that there was still a large capacity margin, even though Belgium faced the lowest nuclear availability for more than 20 years.
For the Commission of Electricity and Gas Regulation:
Andreas TIREZ Koen LOCQHET
Director Acting president of the Board of Directors

99/112
ANNEXES
GLOSSARY
3rd energy package : this title groups together
• two directives pertaining to gas and electricity markets ;
• two regulations concerning the access conditions to natural gas networks, and the access conditions to networks for cross-border electricity exchanges;
• the regulation establishing ACER.
CIM : Continuous Intra-day Market Segment, a market segment where instruments are traded by the continuous matching of purchase orders and delivery orders, without an opening auction, and for which the nomination of contracts concluded by Belgian market participants is carried out in accordance with the rules of Intra-day Internal Energy Transfer, in the ARP Contract. Consumed capacity, at a given access point and in one quarter of an hour, is equal to the difference, to the extent that it is positive, between the capacity consumed by the loads connected to this access point, and the capacity injected by the local generation associated with this access point. If this difference is negative, the consumed capacity is zero (source: Elia). Consumed energy, at one access point and for a given period, is equal to the total consumed capacity at this access point over the period of time considered (source: Elia). E.g. : the consumed energy for a given load amounts to 100 MW for a quarter of an hour, to which a local generation is linked, injecting 40 MW during the same quarter of an hour, is equal to: 15 MWh = max (0, 100 MW – 40 MW) * 15 minutes.
DAM : Day-Ahead Market Segment’, a market segment where instruments for which the delivery period relates to a precise hour of the day in accordance with the Exchange Day, are traded via auction following an order accumulation phase, and for which the nomination of the contracts concluded by Belgian market participants is carried out in accordance with the rules of Day-Ahead Internal Energy Transfer, in the ARP Contract. Elia control area is the electric area for which Elia must maintain overall equilibrium between the supply and demand of electricity Elia has various means at its disposal to achieve this, including the secondary and tertiary reserves, as well as reserve agreements concluded with neighbouring system operators. The Elia control area covers Belgium and part of the Grand Duchy of Luxembourg (Sotel network).
The Elia-grid load is a calculation based on injections of electrical energy into the Elia grid. It incorporates the measured net generation of the (local) power stations that inject power into the grid at a voltage of at least 30 kV and the balance of imports and exports. Generation facilities that are connected at a voltage of less than 30 kV in the distribution networks are only included if a net injection into the Elia grid is being measured. The energy needed to pump water into the storage tanks of the pump-storage power stations connected to the Elia grid is deducted from the total. Decentralised generation that injects power at a voltage less than 30 kV into the distribution networks is not entirely included in the Elia-grid load. The significance of this last segment has steadily increased during the last years. Therefore Elia decided to complete its publication with a forecast of the total Belgian electrical load. The Elia-grid comprises networks of at least 30 kV in Belgium plus the Sotel/Twinerg grid in the south of Luxembourg. The total load incorporates all electrical loads on the Elia grid and in underlying distribution networks (and also includes electrical losses). It is estimated based on a combination of measurements and upscaled values of injections of power plants, including generation in the distribution networks, to which imports are added. Subsequently, exports and power used for energy storage are deducted, leading to an estimation of the actual total load in the Elia-grid and all underlying networks. (source: Elia).
Energy consumption at a given point of access is the energy consumed by the loads connected at this point of access (source: Elia). Market coupling by prices. In a system of coupling by price, each market participating in market coupling provides different data to a coordinated calculation system: the transmission capacity available at each border for each direction and for each period; the supply and demand curves for each period; the multi-hour orders "in blocks" submitted by the market participants. Based on this information, the exchanges determine the price and net position for each period, using a calculating algorithm, for each market participating in the market coupling. Since the introduction of market coupling by price, the prices between markets only vary if there is not enough available interconnection capacity between two markets. If there is a constraint at a given border, this means that the transmission capacity at the border is saturated, which results in congestion rent.
ENTSO-E, the European Network of Transmission System Operators, which represents 42 GRTs in 35 countries.
100/112
EPEX SPOT is an exchange which manages spot markets for electricity in France, Germany, Austria and Switzerland. Equivalent temperature is obtained by adding 60% of the average temperature of Day X to 30% of the temperature of Day X-1, and by adding this result to 10% of the temperature of Day X-2 (source : http://www.aardgas.be/professioneel/over-aardgas/nieuws-en-publicaties/graaddagen).
The Grid Control Cooperation (hereinafter referred to as "GCC") is a collaboration between German GRTs. It aims to optimise the supply and activation of automatic secondary regulation. It is based on the observation that the regulation of different German control areas often act in opposite directions. It aims at balancing between these control areas the use of reserves acting in opposite directions, with the conditions that the resulting capacity flows do not hinder access to the network, and do not jeopardise the security of the network.
The GCC is made up of four modules:
• Module 1: reduction of the use of reserves in opposite directions;
• Module 2: reciprocal support in the event of a lack of secondary reserves;
• Module 3: technical coordination in the area of pre-qualification of a unit;
• Module 4: merit order lists for German control areas.
The decision was taken to leave open the possibility for other control areas to participate in module 1, which is known under the name of IGCC. Belgium started to participate in the IGCC in October 2012.
Heating value: there are two types, namely • the Higher Heating Value (HHV) is the thermal energy released by the combustion of 1 kilogram of fuel. This
energy includes sensible heat, but also latent heat from water evaporation, which is generally generated by combustion. This energy can be completely recovered if the water vapour released is condensed, in other words if all the evaporated water ultimately ends up in liquid form.
• the Lower Heating Value (LHV) is the thermal energy released by the combustion of 1 kilogram of fuel in the form of sensible heat, excluding energy from evaporation (latent heat) of the water present at the end of the reaction.
The difference between the two heating values is significant. The change of state (between vapour at 100°C and water at 100°C) absorbs or releases a significant amount of heat. To increase the temperature of 1 litre of water by 1°C, 4.18 kJ is required. This is the specific heat value of water (4.18 kJ/kg/°C). Evaporation energy is the energy required to evaporate a substance at its evaporation temperature. The evaporation energy of water is approximately 540 calories per gram, or 2250 J/g (this energy depends on temperature and pressure). This means that to heat 1 litre of water from 0°C to 100°C (418 kJ), 5 times less energy is required compared to evaporating 1 litre of water at 100°C (2250 kJ).
IGCC "International Grid Control Cooperation". Injected capacity, at a given access point and in one quarter of an hour, is equal to the difference, to the extent that it is positive, between the capacity injected by the associated generation at this access point, and the capacity consumed by the load(s) associated with this access point. If this difference is negative, the injected capacity is zero (source: Elia). Injected energy, at one access point and for a given period, is equal to the total injected capacity at this access point over the period of time considered (source: Elia). E.g. : the injected energy for a given load amounts to 40 MW for a quarter of an hour, to which a generation is linked, injecting 100 MW during the same quarter of an hour, is equal to: 15 MWh = max (0, 100 MW – 40 MW) * 15 minutes.
Instantaneous System Imbalance (SI) is calculated by taking the difference between the Area Control Error (ACE) and the Net Regulation Volume (NRV). The System Imbalance (SI) is obtained by neutralising the activated auxiliary services (NRV) – implemented by Elia to manage the equilibrium of the area – of the ACE.
Level of use of a generation unit is the energy actually generated, divided by the energy which the power station would have to generate as long as it generated at its maximum capacity every hour of the year.
Loop flows is the difference in the physical flows measured at the interconnections, and the expected flows based on total nominations for these interconnections.
Market coupling by volumes This coupling has been achieved between the CWE region (BE, DE, FR, NL, LU) and the Nordic region (NO, SE, DK, FI, ES). In this case, the available transmission capacities at each border for each direction and each period, as well as the net export curves of each country for each period, make it possible, using a calculation algorithm from the

101/112
company EMCC to define the flows on the interconnections between areas coupled by price. This information is then taken into account by the exchanges to calculate the prices in the different markets. Market resilience indicates price sensitivity following an increase in supply or demand in the market.
Month-ahead is the Endex Power BE Month which represents the mathematical average expressed in €/MWh of the fixed reference prices at the "end of day" of the month ahead contracts (contracts for the physical supply of electricity on the Belgian high-voltage network for the month ahead), as published on the website http://www.iceendex.com/.
Net Regulation Volume (NRV) is calculated using the difference for each moment between the sum of the volumes of all upward regulations and the sum of the volumes of all downward regulations, including the exchanges via the International Grid Control Cooperation requested by Elia to maintain the balance of the control area. A positive value indicates a net upward regulation signal.
Nomination : a range of forecast data linked to an access point on the network. These data make it possible to define the characteristics of Day X and, in particular, the quantity of active capacity per quarter of an hour to be injected or consumed. These nominations are supplied by the ARP to Elia. Most nominations are shown as Day X-1 for the operation of the network on Day X. (source: Elia). NORD POOL is an exchange which manages spot markets for electricity in the Nordics, the Baltics, Great-Britain and Germany.
Paradoxically rejected block orders (PRB) are non-convex offers which, based on the prices obtained from the market, should have been accepted but which were rejected anyway. Quarter-ahead is the Endex Power BE Month which represents the mathematical average expressed in €/MWh of the fixed reference prices at the "end of day" of the quarter ahead contracts (contracts for the physical supply of electricity on the Belgian high-voltage network for the quarter ahead), as published on the website http://www.iceendex.com/. Secondary reserve (R2) is a reserve which is activated automatically and continually, both upwards and downwards. It intervenes rapidly (from 30 seconds to 15 minutes) and remains active for the time required. This reserve regulates the current imbalances and is intended to continually re-establish the equilibrium within the control area of Elia, and to continually manage the frequency variations.
Spot Market : a completely electronic market for the anonymous trading of electricity blocks, organised and managed by a Nominated Electricity Market Operator (NEMO) in accordance with network codes and, for Belgium, also the Royal Decree. The Spot Market is made up of DAM and CIM market segments. Spread: is the difference between the market price of electricity and its variable short-term cost, estimated on the basis of market prices for fuels, in other words an approximation of the very short-term gross margin;
if CO2 becomes an additional component of the variable cost, it is referred to as a clean spread; if the determination of the spread is calculated to generate with:
a coal-fired power station, it is referred to as a dark spread and, a gas-fired power station, it is referred to as a spark spread.
Tertiary reserve (R3) is a capacity reserve which certain producers or industrial actors make available to Elia. It makes it possible to confront a significant or systemic imbalance in the control zone, offset significant frequency variations, and resolve significant congestion problems. This reserve is mobilised manually. Use-It-Or-Sell-It (UIOSI) is the principle of transferring non-utilised capacity in the daily market. Year-ahead is the Endex Power BE Calendar which represents the mathematical average expressed in €/MWh of the fixed reference prices at the "end of day" of the calendar contracts (contracts for the physical supply of electricity on the Belgian high-voltage network for the calendar year ahead), as published on the website http://www.iceendex.com/.
102/112
LIST OF ABBREVIATIONS
ACER Agency for the Cooperation of Energy Regulators
AFCN Agence fédérale de Contrôle nucléaire (Federal Agency for Nuclear Control)
ACER Agency for the Cooperation of Energy Regulators, operational since 3 March, 2011 aFRR Automatic Frequency Restoration Reserve APX Amsterdam Power Exchange APX-ENDEX currently the ICE - ENDEX Intercontinental Exchange ARP Access Responsible Party, which has concluded an ARP contract with the GRT Elia AT Austria ATC Available Transfer Capacity, a congestion management and capacity allocation method for cross-zonal
exchange where cross-zonal transmission capacities are explicitly defined per border and per direction. BE Belgium CACM Capacity Allocation and Congestion Management CASC Capacity Allocating Service Company, namely an allocating platform for the auction of cross-border
electricity transmission capacities for the CWE and CSE regions, the north of Switzerland and part of Scandinavia (jao.eu)
CCGT Combined Cycle Gas Turbine CCR Capacity Calculation Region CEE Central East Europe, including Austria, Czech Republic, Slovakia, Hungary, Poland and Romania CEER Council of European Energy Regulators, created in 2000 CIM Continuous Intra-day Market CB Critical Branch, network element either within or between bidding zones taken into account in the
capacity calculation process, limiting the amount of power that can be exchanged CBCO Critical Branch Critical Outage, network element in the N-1 state either within or between bidding zones
taken into account in the capacity calculation process, limiting the amount of power that can be exchanged
CO Critical Outage, contingency taken into account in the capacity calculation process for compliance with
the operational security limits. CORE The combination of Central West European (CWE) borders and Central East European (CEE) borders CSE Central South Europe region, including Germany, Austria, France, Greece, Italy and Slovenia CSS Clean Spark Spread CWE Central West Europe including Germany, Belgium, France, Luxembourg and the Netherlands, established
on 9 November, 2010 D2CF Two Day Ahead Congestion Forecast, TSOs’ forecast of network loading in D-2 (best grid estimate in D-2)

103/112
DACF Day Ahead Congestion Forecast, TSOs’ forecast of network loading after day-ahead market coupling (best
grid estimate in D-1) DAM Day-Ahead market DE Germany DLR Dynamic Line Rating, technology and methodology to integrate weather forecasts (temperature, wind…)
in the assessment of a transmission line thermal limit as opposed to the use of static seasonal values. EEX European Energy Exchange ENTSO European Network of Transmission System Operators for Electricity (ENTSO-E) – and Gas (ENTSO-G) ERGEG European Regulators' Group for Electricity and Gas EUPHEMIA "Pan-European Hybrid Electricity market integration algorithm", selected for the PCR initiative FAV Flow Adjustment Variable, parameter in the Flow Based Market Coupling which can be introduced by a
TSO to increase or decrease the RAM on a specific critical network element (see also: FBMC, RAM, CBCO). FBI Flow Based Intuitive, patch in the flow based market coupling which prevents imports from a higher price bidding zone (or export towards a lower price bidding zone). FBMC Flow Based Market Coupling, a congestion management and capacity allocation method for cross-zonal
exchange where the market clearing point equals the set of net positions which maximizes the Social Welfare objective within the feasible domain defined by the network constraints (see: CBCOs).
FBP Flow Based Plain, original result of the Flow Based Market Coupling without or prior to any patches FCR Frequency Containment Reserve FR France Fref Reference flows, physical flows observed in the D2CF basecase Fref0 Zero-balanced Reference flows, physical flows observed in the zero-balanced basecase, i.e. the case which
starts from the D2CF base case and where all Net Positions are brought back to zero (no cross-zonal exchange).
Fref’ Zero-balanced Reference flows including the physical flows induced by long term nominations. These
physical flows get priority access to the grid. They are taken into account in determining the capacity available for the market (see also: RAM, CBCO, FBMC).
FTR Financial Transmission Right, type of long term transmission right entitling its holder to receive a financial
remuneration based on the Day Ahead Market results between two Bidding Zones during a specified period of time in a specific direction (see also : PTR).
GME Gestore Mercati Energetici, operator in the Spanish market for electricity and gas GRT gestionnaire du réseau de transport (Transmission System Operator : TSO) GSK Generation Shift Key, a method of translating a change of zonal net position into estimated specific
injection increases or decreases in the common grid model. HHI Herfindahl-Hirschman Index: measure of the concentration of the market ICH interruptible customers ID-bids incremental/decremental bids
104/112
IRM Institut royal météorologique (Royal Meteorological Institute) IGCC International Grid Control Cooperation for imbalance netting
ITVC Interim Tight Volume Coupling JAO Joint Allocation Office LU Luxembourg LTA Long Term Allocation of transmission capacity
M€ million euros
MCR Multi-Regional Coupling
mFRR Manual Frequency Restoration Reserve
NEMO Nominated Electricity Market Operator
NEP Net (Exchange) Position, the netted sum of electricity exports and imports for each market time unit for
a bidding zone
NL Netherlands NRV Net Regulation Volume is calculated using the difference for each moment between the sum of the
volumes of all upward regulations and the sum of the volumes of all downward regulations, including the exchanges via the International Grid Control Cooperation requested by Elia to maintain the balance of the control area. A positive value indicates a net upward regulation signal.
NTC Net Transfer Capacity = TTC (Total Transfer Capacity) – TRM (Transmission Reliability Margin). NWE North West Europe: including Germany/Austria, the Benelux, Denmark, Estonia, Finland, France, Great
Britain, Latvia, Lithuania, Norway, Poland and Sweden.
OMIE OMI-Polo Español S.A. operator in the Spanish market for electricity and gas
OTC Over-the-counter or off-exchange
OTE Operator in the Czech market for electricity and gas
PCI (HHV) Higher Heating Value (see also glossary)
PCR Price Coupling of Regions, an initiative of 7 European exchanges to develop a single algorithm to calculate a single coupling price in Europe, and to improve the efficiency of allocations of cross-border interconnection capacities on a day-ahead basis.
PCS (LHV) Lower Heating Value (see also glossary) PLEF The Pentalateral Energy Forum, framework for regional cooperation in Central Western Europe
(BENELUX-DE-FR-AT-CH) towards improved electricity market integration and security of supply. The initiative aims to give political backing to a process of regional integration towards a European energy market. This cooperation is formalized trough the PLEF MOU signed in 2007.
PST Phase-Shifting Transformer, a transformer for controlling the power flow through specific lines, without
changing voltage level PTDF (nodal) Nodal Power Transfer Distribution Factor, (set of) parameter of a critical network element representing
the physical flow induced by a change in nodal net position(s) – depends on grid topology.
105/112
PTDF (zonal) Zonal Power Transfer Distribution Factor, (set of) parameters of a network element representing the
physical flow induced by a change in zonal net position(s) – depends on grid topology and on GSK. PTR Physical Transmission Rights, type of long term transmission right entitling its holder to physically transfer
a certain volume of electricity in a certain period of time between two Bidding Zones in a specific direction (see also : FTR)
PV Photovoltaic panels PWR Pressurized Water Reactor R1 Primary Reserve or Primary Control Power; name of FCR in the Electricity Balancing Guidelines R2 Secondary Reserve or Secondary Control Power; called aFRR in the Electricity Balancing Guidelines R3 Tertiary Reserve or Tertiary Control Power; called mFRR in the Electricity Balancing Guidelines R3 DP R3 on dynamic profiles (offtakes and decentralized generation) R3 ICH R3 on interruptible offtakes RAM Remaining Available Margin, capacity (in MW) of a Critical Branch Critical Outage (see: CBCO) which is
given to the market REMIT Regulation (EU) No 1227/2011 of the European Parliament and of the Council of 25 October 2011 on
wholesale energy market integrity and transparency RR Replacement Reserve; not used by ELIA SER - EnR Sources of renewable energy
SWE South West Europe
TGV Turbine Gaz-Vapeur (Combined Cycle Gas Turbine)
TLC Trilateral Market Coupling of the Belgian (Belpex), French (Powernext) and Dutch (APX) electricity markets, established on 21 November 2006 with the GRTs TenneT, Elia and RTE.
TSO Transmission System Operator TTC Total Transfer Capacity TRM Transmission Reliability Margin UIOSI Use-It-Or-Sell-It XBID Cross-border Intraday Units
EUR euro GW gigawatt, equal to 1 billion watts kV kilovolt MEUR million euro mHz millihertz, unit of frequency MW megawatt, equal to 1 million watts MWh megawatt hour, equal to 3.6 billion megajoules TW terawatt, equal to one thousand billion watts W Watt, unit of measurement for capacity derived from the international system of units,
which measures the rate of electric conversion

106/112
LIST OF FIGURES
Figure 1: Evolution of the total electricity demand as published by ENTSO-E (TWh) from 2011 to 2017
for Belgium and its neighbouring countries ............................................................................................ 5
Figure 2: Total Elia Grid load and Baseload Elia Grid load during 2007 to 2018 ..................................... 6
Figure 3: Evolution of the demand levels classified within the Elia control area (MW) for 2007-2018 (for
the higher ¼ hour, hour 100, hour 200 and hour 400), like their trend curve - Sources: Elia and CREG 8
Figure 4: Average monthly Elia grid load for 2007-2008 and 2017-2018 (in MWh/hour) - Sources: Elia
and CREG ................................................................................................................................................. 8
Figure 5: Average Elia grid load per quarter of an hour for 2007-2008 and 2017-2018 (MW) - Sources:
Elia and CREG........................................................................................................................................... 9
Figure 6: Annual variability of the average electricity demand during one day (“AV D-Stdev” - blue line),
the difference between two consecutive days (“StdDev of D-D-1” - red line) and, on the right-hand axis,
the difference between two consecutive fifteen minute intervals (“Stdev of QtoQ” - green line) (MW).
- Sources: Elia, CREG ................................................................................................................................ 9
Figure 7: Daily pattern of the hourly average solar electricity generation (MW) of installed solar panels
for 2013-2018. ....................................................................................................................................... 10
Figure 8: Evolution of the maximum, average and minimum monthly generation at the 13th hour of
the day (midday) ................................................................................................................................... 11
Figure 9: Standard deviation of the average demand per quarter of an hour on the network in the Elia
control area (MW) for 2007-2008 and 2017-2018. ............................................................................... 12
Figure 10: availability of CCGT according to age ................................................................................... 14
Figure 11: average forced outage rate of CCGTs ................................................................................... 15
Figure 12: Planned unavailability of CCGTs ........................................................................................... 15
Figure 13: availability of nuclear plants................................................................................................. 16
Figure 14: forced outage rate of nuclear plants .................................................................................... 17
Figure 15: planned unavailability of nuclear plants .............................................................................. 17
Figure 16: Installed capacity and electricity generation in 2018 by fuel source. .................................. 18
Figure 17: Monthly nominations for generation by nuclear power plants per year ............................ 20
Figure 18: Number of days of unavailability of the 7 nuclear plants per year ...................................... 21
Figure 19: Total nominated energy in day-ahead of the Elia regulation zone CCGTs, per month, as well
as an indication of the minimum average volume to be nominated for secondary reserves (blue line)
............................................................................................................................................................... 22
Figure 20 – Average positive Clean Spark Spread (lines, left axis) and number of days with positive Clean
Spark Spread (bars, right axis), per year, for the three year-ahead wholesale electricity products with
delivery in Belgium Source: CREG based on data received from EPEX SPOT, EEX ................................ 30
Figure 21 – Average positive Clean Spark Spread (lines, left axis) and number of days with positive Clean
Spark Spread (bars, right axis), per year, for the three peak/off-peak periods of the day-ahead
wholesale electricity product with delivery in Belgium Source: CREG based on data received from EPEX
SPOT, EEX............................................................................................................................................... 31
Figure 22 – Average negative Clean Spark Spread (lines, left axis) and number of hours with negative
Clean Spark Spread (bars, right axis), per year, for the three peak/off-peak periods of the day-ahead
wholesale electricity product with delivery in Belgium Source: CREG based on data received from EPEX
SPOT, EEX............................................................................................................................................... 32
Figure 23 – Operational profitability of an average CCGT plant with indicated fixed and variable costs,
from 2007 to 2019. Source: CREG ......................................................................................................... 33
Figure 24: Yearly average hourly day-ahead wholesale electricity prices, per bidding zone in the CWE
region, increased in 2018. The Belgian bidding zone together with the Dutch zone have the highest
107/112
averaged prices. The Austrian bidding zone, separated from the German bidding zone since the first of
October, is not presented as no full year of data is available. .............................................................. 34
Figure 25 – Evolution of the monthly averaged day-ahead prices in the CWE region. Source: CREG based
on data received from EPEX SPOT ......................................................................................................... 34
Figure 26 – Volatility of the Belgian day-ahead price, described by three statistics, per year Source:
CREG based on data provided by EPEX SPOT ........................................................................................ 36
Figure 27 – Value of the contracts traded on EPEX SPOT Belgium Source: CREG based on data provided
by EPEX SPOT ......................................................................................................................................... 38
Figure 28 – Average traded, sold and bought volumes on the Belgian power exchange between 2007
and 2018. Source: CREG based on data provided by EPEX SPOT .......................................................... 38
Figure 29 – Average change of the Belgian day-ahead price in terms of additional supply or additional
demand, 2007-2018 Source: CREG based on data provided by EPEX SPOT ......................................... 39
Figure 30 – Average absolute sensitivity of the Belgian day-ahead price in terms of 500 MWh/h
additional supply or 500 MWh/h additional demand Source: CREG based on data provided by EPEX
SPOT ...................................................................................................................................................... 39
Figure 31 – Histogram of hourly differences between the day-ahead and intraday prices in 2018 Source:
CREG based on data provided by EPEX SPOT ........................................................................................ 40
Figure 32 – Yearly averaged year-ahead wholesale electricity prices in the CWE region. Prices for
delivery in only the Austrian bidding zone, in contrast to the joint German-Austrian bidding zone, are
only shown if a full year of data is available. Source: CREG based on data provided by ICE Endex and
EEX ......................................................................................................................................................... 41
Figure 33 - Monthly averaged year-ahead wholesale electricity prices in the CWE region. Prices for
delivery in only the Austrian bidding zone, in contrast to the joint German-Austrian bidding zone, are
only shown if a full month of data is available Source: CREG based on data provided by ICE Endex and
EEX ......................................................................................................................................................... 42
Figure 34 – Monthly average prices for four types of contracts for delivery in the Belgian bidding zone,
in terms of month of trade Sources: CREG based on data provided by EEX and ICE Endex ................. 42
Figure 35 –Average prices for four types of contracts for delivery in the Belgian bidding zone, in terms
of delivery period Sources: CREG based on data provided by EEX and ICE Endex ............................... 43
Figure 36: For all months of 2018 except for September, the average RAM on the active CNEC,
expressed as a percentage of the thermal capacity (% Fmax), exceeded the averages obtained in 2016
and 2017. ............................................................................................................................................... 50
Figure 37: For all months of 2018 except for September, the frequency of active CNECs with less than
20% RAM was lower compared to 2016 and 2017. Despite the 20% minimum RAM threshold only being
formally implemented from end of April 2018 on, the RAM-values on internal CNECs already increased
earlier thanks to the implementation of winter limits and DLR on highly impacting CNECs by Amprion.
The impact of the 20% minRAM implementation is most notable in the months October to December
when the number of active CNECs with RAM values inferior to 20% Fmax were highest. In the summer
months the improvement is less pronounced. ..................................................................................... 50
Figure 38: For all months of 2018, except for September, the share of active internal CNECs decreased,
implying that the congestion shifts from internal to cross-zonal network elements. Nevertheless, the
share of active internal CNECs after the introduction of the 20% minRAM threshold and the
introduction of the DE/LU-AT bidding zone border remains very high with monthly shares ranging from
20% to 50%. ........................................................................................................................................... 51
Figure 39: During the summer months, the monthly average shadow price of congestion in 2018
remains similar to the previous years. However, during the winter months, a clear reduction of the
average shadow price can be observed. Since shadow costs depend on both market conditions and
available network capacity, this evolution may be explained by less tight market conditions in France
in 2018 compared to 2016 and 2017 and to the increase of the available cross-zonal capacity. ........ 51

108/112
Figure 40: From January to September, the average volume of cross-zonal exchanges in the CWE region
during congested hours in 2018 was higher than in 2016 and 2017, especially the first half of the year.
However, from October to December, the average exchanges were similar and even lower than in
previous years. This may be explained by the fact that in winter 2016-2017 and 2017-2018, France was
heavily reliant on imports, while in winter 2018-2019 this was the case for Belgium. Imports to France
from the CWE region typically make less extensive use of the network capacity on a singular CNEC
(lower PTDF) than imports to Belgium. With similar available network capacity, France will hence be
able to import more from the CWE region than Belgium. .................................................................... 52
Figure 41: The monthly maximum cross-zonal exchanges in the CWE region in 2018 remained similar
to recent years, but since the removal of the DE/AT/LU export limit in October 2018 with the
introduction of the DE/LU-AT bidding zone split, the monthly maximums are consistently higher. ... 52
Figure 42: The combination of CWE FBMC improvements such as the introduction of the 20% minRAM
and the removal of the DE/AT/LU export constraint, combined with the increase of the Belgian import
limit in June 2018 from 4,500 MW to 5,500 MW, enabled higher Belgian import capacities than
previous years. Especially in September – December 2018, when Belgium faced tight market
conditions, Belgian import values hit historical records. ...................................................................... 53
Figure 43: Monthly long term IMPORT capacity auctions at the French border (top) and at the Dutch
border (bottom). The auctioned volumes (‘capVol’, MW) vary on a monthly basis. The better the
auction price (‘capPrice’, in €/MW) and the monthly-averaged day-ahead price in the given direction
(‘pBE-pFR’ and ‘pBE-pNL’, in €/MWh) are correlated, the better the market was able to anticipate the
price spreads. The level of competition, which depends on the number of participating market players,
is measured by the HHI-index (‘HHI/1000’). ......................................................................................... 55
Figure 44 : Monthly long-term EXPORT capacity auctions at the French border (top) and at the Dutch
border (bottom). The auctioned volumes (‘capVol’, MW) vary on a monthly basis. The better the
auction price (‘capPrice’, in €/MW) and the monthly-averaged day-ahead price in the given direction
(‘pFR-pBE’ and ‘pNL-pBE’, in €/MWh) are correlated, the better the market was able to anticipate the
price spreads. The level of competition, which is function of the number of participating market
players, is measured by the HHI-index (‘HHI/1000’). ............................................................................ 56
Figure 45: Monthly average (‘Net DA’), maximum (‘Max DA’) and minimum (‘Min DA’) Day-ahead Net
Position for Belgium. Positive values indicate export, negative values indicate import. ..................... 57
Figure 46 : Evolution of the monthly average (‘Net DA’), maximum (‘Max DA’) and minimum (‘Min DA’)
Day-ahead Net Position (including long-term nominations) for Belgium since 2011. Positive values
indicate export, negative values indicate import. ................................................................................. 58
Figure 47: Monthly average export net positions (‘Av Export ID’), average import nominations (‘Av.
Import ID’) and resulting average net position (‘Av. Net ID’), along with the monthly maximums (‘Max
Export ID’, ‘Max import ID’) in 2018. ..................................................................................................... 60
Figure 48: Evolution of the monthly average export net positions (‘Av Export ID’), average import
nominations (‘Av. Import ID’) and resulting average net position (‘Av. Net ID’), along with the monthly
maximums (‘Max Export ID’, ‘Max import ID’), since 2007. .................................................................. 60
Figure 49: Yearly average imported and exported volumes on the long term (LT), day-ahead (DA) and
intraday (ID) markets. ............................................................................................................................ 61
Figure 50: Monthly average, maximum and minimum net transit flows through Belgium. ................. 63
Figure 51: Maximum, minimum and monthly averaged loop flows through Belgium, forecasted in D-2.
Positive values indicate loop flows in the direction North-to- South, negative values loop flows in the
direction South-to-North. ...................................................................................................................... 66
Figure 52: Belgian day-ahead prices versus D-2 loop flows for all hours in the monitoring period July
2015 to December 2016 (turquoise), 2017 (dark blue) and 2018 (light blue). Positive loop flows indicate
physical flows crossing the Belgian network from North to South. In 2018, price spikes above 200
€/MWh were only observed when the D-2 loop flows through Belgium were above 500 MW. ......... 66

109/112
Figure 53: Physical flows on the Northern border (top) and the Southern border (bottom). Positive
values indicate physical flows in the North-to-South direction. ........................................................... 68
Figure 54: Maximum, average and minimum monthly values of CWE cross-border volume (day-ahead
+ long term) during congested hours for 2011 – 2017. The vertical line indicates the start of FBMC for
day-ahead market coupling. .................................................................................................................. 69
Figure 55: Monthly averaged Zonal Net Positions and CWE cross-zonal exchanges in day-ahead,
including long term nominations, before and after the introduction of FBMC on 21 May 2015. By way
of comparison, the net positions of the DE/LU and AT bidding zones after the DE/AT/LU bidding zone
split on 1 October 2019, are lumped together. .................................................................................... 70
Figure 56: Yearly averaged day-ahead cross-zonal exchange in the CWE-region, including long-term
nominations. The blue and gray bars indicate, respectively, the evaluated results over all hours and
over congested hours only. The darker bars show the results with ATC, the lighter ones the results with
FBMC. By way of comparison, exchanges between the DE/LU and AT bidding zones after 1 October
2018 are not included in the figures. As such, the net positions of the DE/LU and AT bidding zones after
the DE/AT/LU bidding zone split on 1 October 2019, are lumped together. ........................................ 70
Figure 57: Distribution of CWE price spreads as a fraction of hours (%) .............................................. 73
Figure 58: Use of the Thermal Line Capacity (Fmax, vertical axis) for Reference Flows (Fref), Flow
Reliability Margins (FRM) and commercial flows from CWE DA cross-zonal exchange (equal to the RAM)
for cross-zonal elements when congested, annual averages for 2018. Since the introduction of the 20%
minRAM measure at the end of April 2018, CWE TSOs also apply an Adjustment for minRAM (AMR) to
ensure that the RAM is equal or higher than 20% of Fmax. ................................................................. 77
Figure 59: Use of the Thermal Line Capacity (Fmax, vertical axis) for Reference Flows (Fref), Flow
Reliability Margins (FRM) and commercial flows from CWE DA cross-zonal exchange (equal to the RAM)
for internal lines when congested, annual average for 2018. Since the introduction of the 20% minRAM
measure at the end of April 2018, CWE TSOs also apply an Adjustment for minRAM (AMR) to ensure
that the RAM is equal or higher than 20% of Fmax. ............................................................................. 77
Figure 60: Locational distribution of the congested network elements per TSO in 2016, 2017 and 2018
............................................................................................................................................................... 78
Figure 61: Histogram of the occurrence of congestion by RAM (%Fmax) per TS0 in 2016, 2017 and 2018
............................................................................................................................................................... 79
Figure 62: Histogram of the occurrence of congestion by RAM (%Fmax) per TS0 in 2018 .................. 79
Figure 63: Number of hours an external constraint was limiting the CWE cross-zonal exchange in 2016,
2017 and 2018. ...................................................................................................................................... 80
Figure 64: Congestion rents per border and per direction. For the years with FBMC, the values
correspond to the total congestion income generated on the Belgian borders prior to resales. The
values do not show how the income is distributed among long-term transmission rights holders on the
one hand and the TSOs of the concerned bidding zones on the other. ............................................... 81
Figure 65 – FCR capacity procurement costs in 2018, per week and per product Source: calculation
CREG based on data received from Elia ................................................................................................ 84
Figure 66 –aFRR capacity procurement cost in 2018, per week and per direction Source: calculation
CREG based on data received from Elia ................................................................................................ 85
Figure 67 – mFRR procurement costs in 2018, per month and separated per product (standard vs. flex)
Source: calculation CREG based on data received from Elia ................................................................. 85
Figure 68 – Cost of contracting reserves, per year of contracting, per type of reserve. The reddish bars
together form the reservation cost for tertiary reserves (mFRR). The black number presents the total
cost for contracting reserves while the black line represents the budgeted cost. The purple diamonds
indicate the cost of contracting reserves per unit of MW offtake in the Elia LFC Area. Source: CREG
based on data provided by Elia ............................................................................................................. 87
Figure 69 – Yearly averaged positive and negative imbalance tariffs. The yearly averaged day-ahead
price serves as reference. Source: CREG based on data provided by Elia ............................................ 89

110/112
Figure 70 – Standard deviation of the positive and negative imbalance tariff Source: CREG based on
data provided by Elia ............................................................................................................................. 89
Figure 71 – Coefficient of variation of balancing tariffs and the day-ahead market price Source: CREG
based on data provided by Elia ............................................................................................................. 90
Figure 72 – Balancing energy activated by product type Source: CREG based on data provided by Elia
............................................................................................................................................................... 91
Figure 73 : Security of supply margin on 24 September 2018 .............................................................. 94
Figure 74: Security of supply margin on 5 November 2018 .................................................................. 94
Figure 75 : Security of supply margin on 20-22 November 2018 .......................................................... 95
Figure 76 : Security of supply margin on 26 November 2018 ............................................................... 96

111/112
LIST OF TABLES
Table 1: Elia grid load (TWh) and power demand (MW) between 2007 and 2018 ................................ 7
Table 2: Generated electricity of solar origin 2013-2018...................................................................... 10
Table 3: Evolution of generation capacity by fuel type (GW and %) ..................................................... 19
Table 4: Evolution of electricity generated by fuel type (TWh and %) .................................................. 19
Table 5: Evolution of generation capacity by ARP (GW and %) ............................................................ 19
Table 6: Evolution of generated electricity by ARP (TWh and %) ......................................................... 19
Table 7: Ownership of nuclear plants.................................................................................................... 20
Table 8: Overview of major CCGTs in Belgium ...................................................................................... 21
Table 9: Overview of electricity generated by major CCGTs in Belgium and their load factors ........... 23
Table 10 – Histogram of the Belgian day-ahead wholesale electricity prices, per year. Source: CREG
based on data provided by EPEX SPOT.................................................................................................. 35
Table 11 – Full hourly price convergence (≤ 0,01 EUR/MWh) between Belgian day-ahead prices and the
day-ahead prices in the other bidding zones in the CWE region, per year and for each month of 2018
Sources: CREG based on data provided by EPEX SPOT ......................................................................... 36
Table 12 – Traded volumes and commercial cross-border exchanges on the Belgian day-ahead power
exchange, including the share of traded volume in terms of the Elia load Source: CREG based on data
provided by EPEX SPOT ......................................................................................................................... 37
Table 13 – Intraday prices and volumes for delivery of electricity in Belgium, 2008-2018. Export and
import volumes are provided since 2014. Source: CREG based on data provided by EPEX SPOT ........ 40
Table 14– Correlation between different types of contracts for delivery in the Belgian bidding zone, for
2007-2018 (left) and for 2018 (right) Source: CREG based on data provided by EEX and ICE Endex ... 43
Table 15 – Average prices for four types of contracts for delivery in Belgium, per year of delivery, 2007-
2018 Source: CREG based on data provided by EEX and ICE Endex...................................................... 44
Table 16: Annual long term import and export capacities (MW), transmission rights (€/MW) and
resulting revenues (€) at the Belgian border with France and the Netherlands. Sources: Elia, CREG.. 54
Table 17: Total revenues of long-term capacity rights from the yearly and monthly auctions. ........... 54
Table 18: Monthly average Net Positions of the 4 CWE bidding zones in 2018 resulting from the CWE
day-ahead and long term commercial exchanges. To allow comparison with historical data, net
positions of the German-Luxembourg (DE/LU) and Austrian (AT) bidding zone after the DE/LU-AT
bidding zone split, have been lumped together. In 2017, Belgium was net importing all months, except
from July and August. ............................................................................................................................ 57
Table 19: Annual net import (-) and export(+) volume on the CWE-day-ahead market, including the
long-term nominations. To allow comparison with historical data, net positions of the German-
Luxembourg (DE/LU) and Austrian (AT) bidding zone after the DE/LU-AT bidding zone split have been
lumped together. .................................................................................................................................. 59
Table 20: Annual average export, import and net exchanges on the long term, day-ahead and intraday
markets. ................................................................................................................................................. 62
Table 21: Share of the long term (LT), day-ahead (DA) and intraday (ID) markets in Belgian electricity
exports and imports. ............................................................................................................................. 62
Table 22: Mean transit flows via Belgium from 2007 to 2018. Transit flows in 2018 were primarily
South-North, as in most years. - Sources: Elia and CREG ...................................................................... 63
Table 23: Statistical indicators on the D-2 forecasted loop flows used in the CWE FBMC capacity
calculation ............................................................................................................................................. 65
Table 24: Annual average results for the CWE day-ahead market clearing, evaluated over all hours. 72
Table 25: Annual average results for the CWE day-ahead market clearing, evaluated over all non-
congested hours. ................................................................................................................................... 72
112/112
Table 26: Annual average results for the CWE day-ahead market clearing, evaluated over all congested
hours. ..................................................................................................................................................... 72
Table 27: Overview of active network constraints in 2018, evaluated per type. ................................. 74
Table 28: Characteristic of Top 25 active constraints in the CWE FBMC in 2017, ranked by number of
occurrences. The averages are calculated over the hours the specific network element was an active
constraint. ............................................................................................................................................. 76
Table 29: Annual average of absolute price spreads at the Belgian borders since 2011...................... 81
Table 30 – Procurement costs, capacity needs and normalised procurement costs for each of the
reserve types procured in the LFC Area of Elia Source: calculation CREG based on data received from
Elia ......................................................................................................................................................... 83
Table 31 - Types of reserves to be bought by Elia for 2018 Source: CREG ........................................... 86
Table 32 – Reservation costs for contracting ancillary services, per year, per ancillary service. Reactive
power is excluded when calculating the cost for consumers in EUR/MWh. Source: CREG based on data
provided by Elia ..................................................................................................................................... 88
Table 33 – Flow of payments of imbalance prices, depending on the sign of the imbalance price
(columns) and the imbalance in the perimeter of the BRP (rows). Source: EBGL ................................ 88