Embed Size (px)
Citation preview
Study on the Effectiveness, Precision, and Reliability of X-ray Fluorescence Spectrometry and Other Alternative Methods for Measuring Lead in Paint
August 2009
David Cobb U. S. Consumer Product Safety Commission Directorate for Laboratory Sciences Division of Chemistry 10901 Darnestown Road Gaithersburg, MD 20878
This report was prepared by the CPSC staff, has not been reviewed or approved by, and may not necessarily reflect the views of, the Commission.

Summary:
X-ray fluorescence (XRF) spectrometry has the potential to accurately measure lead content in painted films on children's products at the limits required under the Consumer Product Safety Improvement Act (CPSIA) of2008, but appropriate standard reference materials (SRMs) and standard analytical methods need to be developed before a complete evaluation or determination is possible. Staff members from the U.S. Consumer Product Safety Commission (CPSC) are working with the National Institute of Standards and Technology (NIST) to develop appropriate SRMs, and with the ASTM International (formerly the American Society of Testing and Materials) to develop appropriate standard test methods.
In contrast to the situation for paint films, the foundations required for XRF analysis of polymers are in place. A consensus standard test method for lead in polymers exists and some appropriate SRMs of leaded polymers are available. With the appropriate test methods and SRMs, XRF spectrometry is suitable in many cases for the determination of lead in polymers. CPSC staff has conducted comparison testing of plastic samples and SRMs by XRF and by using current wet chemical methods and found generally good agreement. XRF produced good results on homogeneous plastic SRMs with certified concentrations as low as 13.6 parts per million (ppm).
Background:
The CPSIA, section IOI(f)(4)(A) requires the CPSC to complete a study to evaluate the effectiveness, precision, and reliability ofXRF methods and other alternative methods for measuring lead (Pb) in paint or other surface coatings when used on a children's product. This report describes how XRF and another alternative method, Laser Induced Breakdown Spectroscopy (LIBS), could potentially be used to test painted children's products. Standard reference materials and performance based standard methods need to be developed and approved before these analytical techniques could be used to certify that paints on children's products contain less than 0.009% Pb (or 90 mg/kg) as required under CPSIA section IOI(f).
Current Test Method:
The current CPSC staff test method l for determining total Pb in paint involves removing paint from a product by scraping or using a solvent, dissolving the paint scrapings in nitric acid, and analyzing the acid solution by spectroscopic means such as inductively coupled plasma optical emission spectrometry OCP-OES), inductively coupled plasma mass spectrometry (ICP-MS), flame atomic absorption spectrometry (FLAA) or graphite furnace atomic absorption spectrometry (GFAA). These analytical techniques are capable of yielding precise and accurate results and have low enough detection limits to measure Pb in paint at the new limits of 90 mg/kg. Paint powder SRMs such as NIST SRM 2581 (contains 0.45% Pb) and 2582 (contains 0.02% Pb) are available to laboratories to verify performance. The current test method is based on standard test procedures such as ASTM E 16452 ,ASTM EI613-043 and Association of
1 US CPSc. Test Method CPSC-CH-El003-09 Standard Operating Procedure/or Determining Lead(Pb)in Paint and Other Similar Surface Coatings, March 2009 2 ASTM Standard Practice for Preparation of Dried Paint Samples by Hotplate or Microwave Digestion for Subsequent Lead Analysis 2007 3 ASTM Standard Test Method for Determination of Lead by Inductively Coupled Plasma Atomic Emission Spectrometry (ICP-AES), Flame Atomic Absorption Spectrometry (FAAS), or Graphite Furnace Atomic Absorption Spectrometry (GFAAS) Techniques
2

Official Analytical Chemists (AOAC) standard AOAC 974.024. This procedure is time
consuming, typically requiring several hours to prepare and analyze samples, and is sample destructive.
XRF Principles:
In XRF analysis, a source of x-rays irradiates a sample. The source can be an x-ray tube or a sealed radioisotope. When a sample is irradiated with x-rays, the source x-rays may undergo either scattering or absorption by the sample atoms. When an atom absorbs the source x-rays, the incident radiation can dislodge electrons from the innermost shells of the atom, creating vacancies. Electrons from outer shells will fill the inner shell vacancy and emit x-ray photons. The energy of the emitted x-ray depends on the difference in energy of the shell with the initial vacancy and the energy of the electron that fills the vacancy. Each atom has specific energy levels, so the emitted radiation is characteristic of that atom. By measuring the energy of the radiation emitted it is possible to identify which elements are present in a sample. By measuring the intensity of the emitted energies it is possible to quantify how much of a particular element is present in a sample.
Types of XRF Instrumentation:
There are a variety of XRF systems in the marketplace with highly varied power levels, filter systems, and analysis algorithms for converting raw data to useful output information. For any analytical equipment and technique, it is critical for the analyst to understand the capabilities, principles and settings of the particular instrument and technique especially with regard to the particular application and sample in question. XRF analyzers are generally classified as being either Energy Dispersive (EDXRF) or Wavelength Dispersive (WDXRF), but there are some additional sub categories within these two systems. This section provides a brief description of the two maj or types of XRF.
Energy Dispersive X-ray Florescence (EDXRF) - There are a variety of EDXRF spectrometers commercially available. EDXRF spectrometers have a detector that is capable of separating and measuring the different energies of the characteristic radiation emitted from the sample to determine elements present. EDXRF spectrometers include the hand held portable devices used for inspecting paint in homes to determine if lead based paint is present. The U.S. Department of Housing and Urban Development (HUD) has guidelines for the use of portable EDXRF spectrometers. The x-ray sources for portable hand held EDXRF systems may be low powered (1-2 watts) x-ray tubes or radioisotopes. EDXRF systems also include more advanced laboratory models that have higher power, better resolution, and lower detection limits, but are not portable. High Definition XRF (HDXRF) is a type of EDXRF that utilizes special optics to enhance measurement intensities. CPSC staff currently utilizes portable hand held XRF analyzers, as well as larger EDXRF laboratory models for screening samples for the presence of lead.
Wavelength Dispersive X-ray Fluorescence (WDXRF) - WDXRF spectrometers utilize a system of collimators and diffraction crystals to diffract the x-rays of different wavelengths in different
4 Association of Official Analytical Chemists (AOAC) standard AOAC 974.02 (Lead in Paint Test) 1976
5 U.S. Department of Housing and Urban Development Guidelines for the Evaluation and Control of Lead Based Paint Hazards in Housing, Chapter 7 Lead Based Paint Inspection
3

directions. The spectrometers may have a moving detector on a goniometer which measures the intensities of the different wavelengths one at a time or sequentially. Spectrometers can also be equipped with a set of fixed detection systems to allow simultaneous analysis of multiple wavelengths. WDXRF systems are generally slower, more expensive, and require more sample preparation than EDXRF systems, but generally have increased sensitivity and lower detection limits.
Advantages of Using XRF for Paint Analysis:
The main advantages of utilizing XRF over the current digestion/ICP method are:
1. XRF is often non destructive and the paint can be tested in situ on the item. 2. Little to no sample preparation is required which greatly reduces the analysis time and
cost. Sample times for XRF in situ are typically less than 2 minutes. It takes several hours to collect paint scrapings, digest and analyze using the current test method.
3. XRF can be utilized more easily to test small painted areas. It can be difficult to remove enough paint from a small area to quantitatively analyze using the current digestion and ICP method. Small painted areas generally require the compositing of like paints from multiple items of a sample lot to obtain sufficient material for analysis. XRF analyzers equipped with video cameras can be used to analyze spot sizes of a few millimeters.
4. Hand held XRF analyzers are portable, allowing for field-screening of products.
Limitations in Paint Film Analysis:
In situ analysis of paint films on children's products by XRF has the following limitations:
1. XRF instruments do not readily measure lead in thin paint films in mass per mass units such as weight %, mg/kg, or ppm. XRF methods typically report the amount of analyte in a thin layer such as a paint film in mass per unit area, e.g. ~g/cm2 because energetic xrays are typically measured for a known spatial area and the count rate of x-rays is a function of both mass fraction and thickness ofthe specimen layer. The source radiation can travel through a thin paint film and into the underlying substrate. For example, if paint films ofdifferent film thickness, containing the same lead concentration by weight were analyzed by XRF, the thicker film would yield a higher measurement count rate. Paint film thicknesses on children's products vary considerably, which makes it difficult to quantitatively analyze and compare to calibration standards on a mass per mass unit basis.
2. The source radiation can travel through the paint film into the underlying substrate, leading to a measurement result that has contributions from both. Special care needs to be taken in ascertaining the source of lead in any measurement.
3. XRF is matrix sensitive6. Spectral and matrix interferences must be taken into account
during analysis, especially from the underlying substrates. X-ray fluorescence measurements are typically particularly susceptible to errors from metal substrates.
4. There are currently no consensus industry standard test methods for quantifying lead in paint films on a mass per mass unit basis.
6 The matrix is the local environment of chemical components in a sample, other than the analyte.
4

Alternative Unit of Measurement
XRF analysis results of lead in paint films are typically expressed in units of mass per area such as milligram or microgram per square centimeter (mg/cm2
) or (Jlg/cm\ The only currently available paint film standard reference materials are certified in units ofmg/cm2
, and this is the unit of measurement that HUD recognizes for evaluating lead in household paint using EDXRF. In order to convert a mass per area unit of measurement such as Jlg/cm2 to a mass per mass unit of measurement such as mg/kg, the dried paint film thickness and density need to be known. The calculation is as follows:
2C llglcm = Cmglkg X D x T/1 0000
Cllglcm 2 is concentration of lead in the paint in units of micrograms per square centimeter
Cmglkg is concentration of lead in the paint (mg/kg) D is density of the dry paint film in units of grams per centimeter cubed (g/cm3
)
T is thickness of the dry paint film in units of micrometers (Jlm)
The paint film thickness can be determined non-destructively using ultrasonic gages, but the film thickness is likely to vary throughout the product. The density of the dry paint film can only be determined through labor intensive and destructive means such as scraping all the paint from a known area, collecting the paint scrapings and weighing. The difficulty in determining dry paint film thickness and densities on consumer products limits the use of in situ XRF analysis if the allowable lead levels can only be reported on a weight percentage basis as is stated in the CPSIA for paint. A paint film with a density of 1.4 g/cm3 that is 50 microns thick and contains 0.009% Pb would have 0.63 Jlg ofPb/cm2
. Paint films on consumer products that contain 0.009% Pb by weight are likely to have mass per area concentrations in the range of 0.5 - 2 Jlg/cm2
.
Availability of Standard Reference Materials and NIST Collaboration
Standard reference materials should be used to validate any test method. NIST has a series of 6 paint film standard reference materials used mainly for checking the calibration of hand held XRFs when evaluating lead in household paints following HUD guidelines. NIST SRM 2575 has the lowest nominal lead concentration of 0.3 mg/cm2 or 300 Jlg/cm2
, other than NIST SRM 2570 at <0.001 mg/cm2 which serves as a blank. Paints containing 0.009% to 0.06% Pb would likely have Pb levels in the range 0.5 to 15 Jlg/cm2
, which is a small fraction of the amount found in NIST SRM 2575. Paint film standards that contain certified levels ofPb closer to the allowable limits of the CPSIA need to be developed to validate in situ XRF analysis of paint films on children's products. The paint film standards need to have certified Pb values on a mass per area unit basis (mg/cm2
) as well as a mass per mass unit basis (weight %). The paint films should also be well characterized and certified with respect to dry film thickness and density.
NIST is currently working on developing paint film SRMs that have these characteristics and could be used for calibrating and validating in situ XRF analysis of paint films on children's products. CPSC staff is working with NIST in this effort. CPSC staff is also collaborating with NIST in the evaluation of XRF for determining low levels of lead in paint films. Attachment (A) describes some initial work that NIST and CPSC staff have done, using XRF to characterize prototype paint films formulated at CPSC and NIST laboratories. This work was intended to provide information for the following purposes:
1. Produce prototype paint films and measure those films using available XRF tools. 2. Develop the procurement specifications for the materials that will be the new paint film
5
SRMs for low Pb levels. 3. Provide background information and example analyses in support of CPSC staff efforts to
understand the capabilities of current XRF instrumentation.
One important finding in this initial study was that the hand held XRF analyzers that CPSC staff currently uses were not able to detect lead in the paint films that had been spiked with 50 mg/kg (wet paint basis) lead naphthenate and applied to metal substrates. This is of concern since the dried paint films spiked this way had lead concentration similar to the regulatory limits set by the CPSIA. The manufacturer of the instrument has subsequently demonstrated a newer version of the hand held XRF that has an improved type of detector, called a silicon drift detector that was able to detect lead on these same specimens. Other manufacturers also market hand held XRF instruments with silicon drift detectors.
Besides this report, the additional achievements directly resulting from this collaboration include:
1. NIST XRF experts contributed to the public meeting on XRF capabilities that was held by CPSC staff in November 2008.
2. NIST has received a demonstration of new HDXRF technology, and is making arrangements to use an instrument on loan to help qualify candidate SRM films for heterogeneity.
3. CPSC staffs lead in paint test method CPSC-CH-E1003-09 has been further validated by comparison to NIST XRF analyses.
4. NIST is in the process of procuring of paint film SRM candidate materials.
Availability of Standard Test Methods
ASTM International Committee F40 on Declarable Substances is currently developing a proposed new standard, WK21957, Test Method for Identification and Quantification of Lead in Paint and Other Coatings Using Energy Dispersive X-ray Spectrometry (EDXRF). ASTM F40 also started a work item for developing a standard for lead in paint analysis using HDXRF. CPSC staff is collaborating with ASTM in these efforts.
Possible Use of XRF as a Screening Tool
In situ quantitative lead analysis of paint films on a mass per mass unit basis using portable XRFs may not be acceptable until suitable SRMs and analytical methods are developed and validated. It may still be possible to use in-situ XRF as a screening tool. Criteria need to be developed to certify the XRF analyzer used is capable of detecting 0.009% lead in paint films on common toy substrates such as plastic, wood, steel, zinc, and aluminum, with dry film thicknesses and densities in the lower ranges of expected values found for children's products. Standard test methods need to be developed to address pass/fail criteria, and circumstances where confirmatory analysis using other techniques such as those outlined in CPSC-CH-E100309 need to be performed. Paint film SRMs containing lead levels in the 0.009% to 0.06% range need to be developed to calibrate and certify XRF analyzer capabilities.
6

Ex sj{u XRF Analysis
Quantitative analysis of lead in paint on a mass per mass unit basis is possible using ex situ XRF techniques in which the paint is removed from the product and analyzed by an XRF spectrometer as a homogeneous sample. Ex situ XRF analysis is more time consuming than in situ analysis' due to required sample preparation steps which include removing the paint from the product and grinding paint scrapings to a fine powder. Ex situ XRF analysis is destructive to samples. The US Environmental Protection Agency (EPA) Method 62007 could be used to provide guidance to develop ex situ XRF test methods. Paint powder SRMs such as NISI' SRM 2581 (contains 0.45% Pb) and 2582 (contains 0.02% Pb) are available to laboratories to verify performance.
Laser Induced Breakdown Spectroscopy
LIBS is a type of atomic emission spectroscopy like 1CP-OES. LIBS involves use of a high power laser as the excitation source. A laser is focused on a sample surface, and a small amount of mass (in the nanogram range) is ejected by various thermal and non thermal processes. The ablated mass interacts with the laser pulse and becomes a highly excited plasma. LIBS systems analyze the spectral plasma emission allowing both quantitative and qualitative analysis. Operating conditions of a LIBS system can be adjusted to limit the depth of sample surface ablation which allows only analysis of the paint or surface coating and not the underlying substrate. A LIBS system may be able to determine concentrations of lead in paint on a mass per mass unit basis provided adequate reference materials are available to serve as calibration standards, but variations in paint matrices may pose challenges for this emerging technology. The types of lead in paint film SRMs under development by NISI' for XRF methods would also be needed to validate methods and equipment for LIBS analysis.
Future Evaluation
As noted above, CPSC staff will continue to work with NISI' in the devclopment of low level lead paint SRMs, and with ASTM F40 in the development of standard test methods for determining lead in paint films by XRF. When the low level lead in paint SRMs become available, CPSC staff will work with NISI' and ASTM to participate in an interlaboratory study of the effectiveness, precision, and reliability of XRF methods and other alternative methods for measuring lead in paint.
XRF Analysis of Plastics
Quantitative analysis of homogeneous plastic or polymeric materials for Pb content using XRF technologies is possible at this time. Recognized consensus standard test methods such as ASTM F2617-08 8 exist. Some lead containing polymeric reference materials from both metrology institutes and commercial sources exist such as ERM ®- EC680k and EC681 k9. CPSC staff has recognized the applicability of XRF for determining lead in polymeric materials in
7 US EPA Method 6200 Field Portable X-Ray Fluorescence SpectrometlY For The Determination OjElemental Concentrations in Soil and Sediment
8 ASTM Test Method F2617-08 Identification and Quantification o!Chroll1iuIII. Bromine. Cadmium, Mercury, and Lead in Polymeric Material Using Ener?:)' Dispersive X-ray Spectrometrl i
9 European Reference Material, produced and certified under Institute for Reference Material and Measurements (IRMM)
7

CPSC-CH-EI002-0S lO• Components could be analyzed intact without any sample modification if they have suitable surface characteristics, geometry and homogeneity. Compton scatter, or incoherent scatter of the x-ray tube lines can be utilized to account for different types of plastics. Compton scatter occurs when x-rays from the x-ray tube or target strike atoms in the sample without promoting any fluorescence, and energy is lost in the collision. The amount of Compton scatter that occurs gets proportionately smaller as the average atomic number of the sample gets larger. Polyvinyl chloride (PVC) would have less Compton scatter than polyethylene. Rayleigh scatter or coherent scatter of the x-ray tube lines can be utilized to account for irregular shaped samples or samples smaller than the x-ray beam area. Rayleigh scatter occurs when x-rays from the x-ray tube or target strike atoms in the sample without promoting fluorescence, and energy is not lost in the collision. The amount of Rayleigh scatter will decrease as the area of the sample exposed to the x-ray beam decreases. Destructive sample preparation techniques such as milling and compression molding may still be required for certain components to create a uniform sample for testing, or may be necessary in instances when higher degrees of precision and accuracy are needed.
CPSC staff has developed various data comparing XRF and microwave digestion followed by ICP-OES analysis. Table 1 compares XRF and ICP-OES measurements of reference materials. Table 2 shows the repeatability (standard deviation) calculated for 10 measurements on plastic reference materials using the portable XRF spectrometer. Table 3 compares XRF screening results obtained on samples to ICP-OES results. The XRF measurements were done on intact sample components. No special sample preparation techniques such as milling or compression molding were used prior to XRF analysis. XRF results are typically within ±30% ofICP-OES results. Table 4 compares XRF results obtained on cryomilled samples to ICP-OES results. The XRF results on the powders of the cryomilled samples were within ±15% ofICP-OES results. If additional sample preparation techniques such as compression molding of the powder to create a more uniform surface had been done, XRF results would likely have been in even closer agreement with ICP-OES results.
These findings suggest that XRF technology can probably be used to accurately measure lead in plastics relative to regulatory limits under the proper conditions. Section lIB of the CPSC staff test method for determining total lead in non-metal children's products II provides guidance on how XRF could be utilized to analyze for lead in plastic components of children's products and criteria for which additional testing may be required. CPSC staff has concluded that analysis using wet chemical procedures outlined in sections IIA of the CPSC staff test method needs to be done on any samples with lead results determined by XRF to be greater than 200mg/kgbefore certifying the item meets the Pb requirements of the CPSIA.
Duke University Medical Center did a study comparing testing for lead in plastics by XRF and traditional acid digestion followed by GFAAS analysis 12
• Results of that study were comparable to results found by CPSC staff.
10 us CPSc. Test Method CPSC-CH-El 002-08 Standard Operating Procedure for Determining Total Lead (Pb) in Non-Metal Children's Products, Feb 1 2009 II US CPSc. Test Method CPSC-CH-EI002-08 Standard Operating Procedure for Determining Total Lead (Pb) in Non-Metal Children's Products, Feb 1 2009 12 Comparison oftesting ofplastics for lead by x-ray fluorescence and traditional nitric acid digestion/GFAA after mufflefurnace combustion, Nov 8, 2008, Danielle Cappellini, B.Sc., MHA and Woodhall Stopford, MD, MSPH
S

Conclusion:
The ability of XRF to be used to accurately measure lead content in painted films on children's products at the limits required under the CPSIA is currently limited due to the unavailability of SRMs and standard analytical methods. CPSC staff will continue to study the feasibility of using XRF technology for analyzing painted films on children's products as SRMs and standard analytical methods become available.
XRF technology is suitable in many cases for the accurate determination of lead in plastics provided appropriate test methods are followed, with the use of appropriate SRMs.
9

Table 1. XRF and ICP-OES Analysis Results of Certified Reference Materials
Reference Type of Plastic Certified Lead **Digestion and I ***XRF Material Quantity ICP Analysis I Analysis
Pb mg/k~ Pb mg/kg Pb mg/kg ERM® Granulated Low 13.6±0.5 12.0±0.6 13.1±2.0 EC680K Density
I Polyethylene ERM® Granulated Low 98±6 98.5±7.3 91.5±5.8 EC681K Density
I Polyethylene I
*PL(PVC)3 Milled Polyvinyl 300 ±12 303.6±4.8 331.9±13.0 1E(P)-2 Chloride Powder *PL(PVQ3 Milled Polyvinyl 604 ± 24 614.3±28.8 669.1±22.8 1E(P)-3 Chloride Powder *PL(PVC)3-1E(P)-2 and 1E(P)-3 were made and certIfied by AnalytIcal ServIces, Inc ** Represents the mean and standard deviation of at least ten replicates except for ERM® -EC680K for which only 3 replicate measurements have been performed. *** Represents the mean and standard deviation often replicates. Measurements were done for a minimum of30 seconds using ThermoNiton model XLT portable XRF
Table 2. Replicate XRF Data for Plastic Reference Materials
ERMEC680K Pellets
ERMEC680K Disk
ERM-EC681K Pellets
ERM-EC681K Disk
PL(PVC)I1E(P)-1 powder
PL(PVC)11E(P)-2 powder
PL(PVC)11E(P)-3 powder
·PVC-L-03A Disk
·PVC-H-02A Disk
I . I Replicate
Pb ppm ±2"
Pb ppm ±2"
Pb ppm ±2"
Pb Dom ±2"
Pb ppm ±2" Pbppm ±2" Pbppm ±2"
Pb ppm ±2"
Pb ppm ±2"
I 11 5 17 5 88 11 111 12 123 23 331 37 683 51 403 40 1197 70
2 11 5 12 5 87 11 111 12 122 23 332 36 630 50 436 41 1098 67
3 10 5 11 4 95 12 101 II 121 22 313 36 695 52 423 41 1212 72
4 13 5 10 4 93 11 115 12 109 22 329 36 676 50 401 40 1168 70
5
6
13
15
5
5
14
14
5
5
90
86
11
11
111
110
12
11
109
I 15
22
23
316
331
37
37
652
634
50
50
397
399
39
39
1229
1279
73
74 I
7 16 5 17 5 100 11 109 II 120 22 351 38 679 51 395 39 1131 68
8 15 5 13 5 100 II 122 12 104 22 331 38 674 51 391 40 1154 69
9 14 5 10 4 93 12 ]]7 12 119 23 355 38 693 5 I 410 40 1136 69
\0 13 5 16 5 83 12 109 12 98 21 330 36 675 51 438 41 1163 69
avg 13.1 134 91.5 111.6 114 331.9 669.1 409.3 1176.7
stdev 2.0 2.7 5.8 5.6 8.6 13.0 22.8 17.1 53.3
RSD (%) 15.0 20.0 6.3 5.0 7.5 3.9 34 4.2 4.5
Certitied Value
13.6± 0.5
13.6± 0.5 98±6 98±6 100±4 300±12 604±24 400· 1200·
*PVC dIsks are dlstnbuted by AnalytIcal Reference Matenals InternatIOnal CorporatIOn. The dIsks are not certtfied reference materials. Similar disks from the same vendor are supplied with the ThermNiton XRF to be used to verify instrument performance. ±2cr= reported confidence interval for each reading based on a calculated +/-2 standard deviations of the stability of the count rate. Each measurement was done for 30 seconds.
10

Resu ts 0 omp:lanceTable 3. ICP Anal vsis and XRF Screenmg I fC r SampJesI
Sample No. Item Digestion and ICP XRF Analysis Analysis Pb mg/kg Pb mg/kg
09-304-6136 Tires 1080-1230 1210-1540 I
09-304-6139 130-170 170-190 I 09-304-6140-02 Tires 834 1180
09-304-6140-03 Tires 2621 3680 09-304-6142 Big tire 238-250 290 09-304-6142 Small tire 630-690 710-760 09-304-6145 1540-1590 1958-2138 09-304-6146-03 1860 2560±130 09-304-6146-04 1340 1873±115 09-304-6147 2170 2605 09-304-6148 1500-1800 1500-2000 09-304-6308 Green forceps 450-460 390-500 09-304-6309 Green scissors 400-490 450-490 09-304-6310 Green farm sign 740-880 700-850 09-304-6460 Yellow belt 2600-2770 2860-3870 09-304-6567 Basketball 21070-22640 29800-32700 09-304-6567 Football 6610-6780 11100-11500 09-304-6567-06-1 731 970 09-304-6567-06-2 161 177 09-304-6567-07-1 65 288 09-304-6567-07-2 932 752 09-304-6568-05 Penguin 1110 1797 09-304-6568-05 Dolphin 780 1202 09-304-6568-05 Shark 750 927 09-304-6568-05 Walrus 640 834 09-304-6568-08 Penguin 700 1038 09-304-6568-08 Dolphin 700 981 09-304-6568-08 Shark 750 968 09-304-6568-08 Walrus 660 917 09-304-6625 Monkey 1440 1314-1415 09-304-6626 Monkey 1380-1420 1298-1570 09-304-6627-03 Monkey 2050 2380-2495 09-304-6627-04 Monkey 60 <LOD 09-304-6643 Black 330-340 470-490 09-304-6643 Red 340-370 440-500 09-304-6635 Arm and leg 850 970-1050 09-304-6644 Black nut 90-110 80-120 09-304-6645-03 Nut 315 385 09-304-6645-03 Long screw 81 88 09-304-6645-03 Short screw 87 99 09-304-6645-07 Nut 74 113 09-304-6646-05 Nut 235 297
11

Table 3 Continued Sample No. Item Digestion and ICP XRF Analysis
Analysis Pb mg/kg Pb mg/kg 09-304-6646-05 Screw 94 97 09-304-6646-07 Screw 75 80 09-304-6647-03 Screw 73 77 09-304-6647-03 Nut 142 147 09-304-6647-05 Nut 135 166 09-304-6647-05 Screw 93 80 09-304-6655 Hard hat 132-154 155-176 09-304-6655 Buckle 102-196 121-258 09-304-6656 Necklace 332-365 113-440 09-304-6557 Chrome covered 330-440 320-480
plastic I
09-304-6558 Chrome covered 500-520 505-545 plastic
09-304-6675 Horse and dog 1090-1470 1540-1730 09-304-6685 Green vinyl patch 2890-2910 2930 09-304-6691 Blue cat 720-750 810-830 09-810-8387 Buttons 5048-5410 3900-4400 09-810-8389 Buttons 3922-4052 2800-2900 09-810-8390 Buttons 3662-3967 2500-2600 09-810-8391 Buttons 2882-3024 2227±56 09-810-8392 Buttons 2943-2993 2250±56 09-810-8393 Buttons 2922-3018 2072±53 09-810-8394 Buttons 2913-2924 2236±56 09-810-8395 Buttons 2517-2645 1726±46 09-810-8396 Buttons 1529-1546 1128±40 09-810-8397 Buttons 2603-2858 1828±49 09-810-8398 Buttons 3938-4314 3128±72 09-810-8438 Buttons 2900-3100 1450-1750 09-810-8439 Buttons 2900-3100 1400-1650 09-810-8440 Buttons 2700-3030 3000-3300 09-810-8441 Buttons 2980 3000-3400 09-810-8442 Buttons 3020-3150 3040-3202 09-810-8443 Buttons 3080-3130 3100-3300 09-810-8444 Buttons 4808-4966 5100-5500 09-810-8445 Buttons 4122-4176 4300-4850 09-810-8446 Buttons 4662-5321 5400-5500 09-840-6769 206-213 230-350 09-840-9775 1160-2240 1467-3094
12
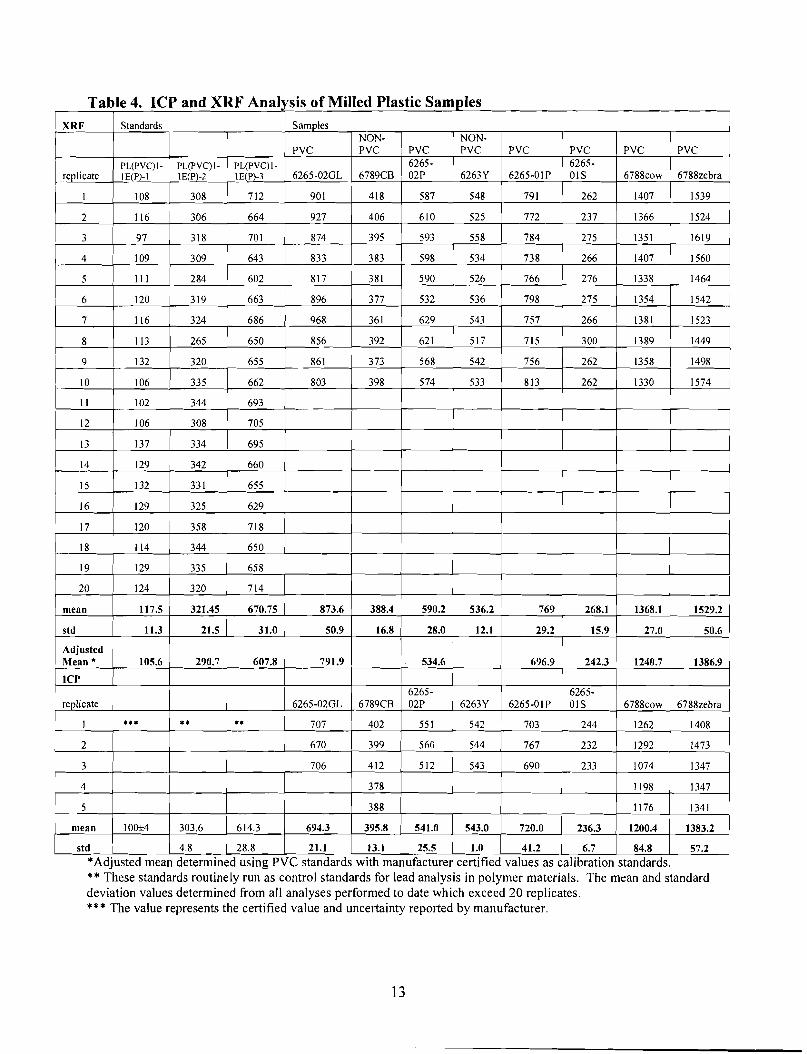
I STahIe 4 ICP and XRF Anan SIS 0fM"1l d PI e asfIe amples"
XRF Standards Samples NON NON
PVC PVC PVC PVC PVC PVC PVC PVC
pL(PVC)1 PL(pVC)I pL(pVe)1 6265 6265replicate IE(p)-1 IE(p)-2 IEip)-3 6265-02GL 6789CB 02P 6263Y 6265-01 P 01S 6788cow 6788zebra
1 108 308 712 901 418 587 548 791 262 1407 1539
2 116 306 664 927 406 610 525 772 237 1366 1524
3 97 318 701 874 395 593 558 784 275 1351 1619
4 109 309 643 833 383 598 534 738 266 1407 1560
5 III 284 602 817 381 590 526 766 276 1338 1464
6 120 319 663 896 377 532 536 798 275 1354 1542
7 116 324 686 968 361 629 543 757 266 1381 1523
8 113 265 650 856 392 621 517 715 300 1389 1449
9 132 320 655 861 373 568 542 756 262 1358 1498
10 106 335 662 803 398 574 533 813 262 1330 1574
11 102 344 693
12 106 308 705
13 137 334 695
14 129 342 660
15 132 331 655
16 129 325 629
I 17 120 358 718
18 114 344 650
19 129 335 658
20 124 320 714
mean 117.5 321.45 670.75 873.6 388.4 590.2 536.2 769 268.1 1368.1 1529.2
std 11.3 21.5 31.0 50.9 16.8 28.0 12.1 29.2 15.9 27.0 50.6
Adjusted Mean • 105.6 290.7 607.8 791.9 534.6 696.9 242.3 1240.7 1386.9 I
lCP 6265 6265
replicate 6265-02GL 6789CB 02P 6263Y 6265-01P OIS 6788cow 6788zebra
J ••• •• •• 707 402 551 542 703 244 1262 1408
2 670 399 560 544 767 232 1292 1473
3 706 412 512 543 690 233 1074 1347
4 378 1198 1347
5 388 1176 1341
mean 100±4 303.6 614.3 694.3 395.8 541.0 543.0 720.0 236.3 1200.4 1383.2
std 4.8 28.8 21.1 13.1 25.5 1.0 41.2 6.7 84.8 57.2
*Adjusted mean determined usmg PVC standards WIth manufacturer certified values as calibratIOn standards. ** These standards routinely run as control standards for lead analysis in polymer materials. The mean and standard deviation values determined from all analyses performed to date which exceed 20 replicates. *** The value represents the certified value and uncertainty reported by manufacturer.
13

839.01-0l)-025
U.S. Department of Commerc(' National Institute of Standards and Technology Clwrnical Science and Technology Lahoratory
Analytical Chemistry Division Gltithersbllrg, !\J[) 20fol99
REPORT OF ANALYSIS
March 20. 2009
Submitted to: S. A. Wise. Chief Analytical Chemistry Division
Title: Investigation or the use orX-Ray Fluorescence Spectrometry for Determinations of Lead in Paint
Authors: .I. L. Molloy. D. Cobh and.l. R. Sichel'
Constituents: Pb
Methods: Wavelength Dispersive X-Ray 1:luorescence Spectrometry (WDXRF). r:nergy Dispersive X-ray 1~luorescence Spectrometry (I:DXRf). and lnduetively Coupled Plasma Optical Emission Spectrometry (ICPOl:S)
Copies to: ACD Docushrlre Intranet. .I. Recht (CPSC)
Background: The NIST is r1ssisting the Consumer Products Sakty COl11mission with their elTorts to investigate the use or XRF 1'01' determinations of Pb in paints. The CPSC has the :.luthority to regulate the sales of children's products under the recently enacted Consulller Products Safety Improvement Act (CllSIA) 01'2008. This act orCongress also gives CPSC the task or reporting on the elTicacy of XRF for measuring the Pb contents of said products. The Inorganic Chemical Metrology Group (fCMG) of NIST volunteered to assist Dr. Joel Recht of CPSC and his staff by developing new Standard Reference Materials for Pb in paint. This task requires NfS'r XRf experts to learn about the IlmllLilation and application ol'paint and ahout the usc of XRF to quantitatively determine the amount of Pb.
Dr. Molloy and Mr. Cobb have created paint films with guidrlnce rrom .I, Chin orthe Materials and Construction Research Division of the I~uilding and Fire Research Lahoratmy. These p,lint films consist of 11Ousehoid latex paint spiked \\ ith either PbCO] or lead naphthenate. 'rhe goals were to learn how to apply thin films using a draw-down brlr and to learn how to usc WDXRF in the ICMG lab and handheld XRF using the CPSC instrument. Results lor comparisons were available It"om an inductively coupled plasma optical emission spectrometry (lCPOES) instrument in the CPSC Gaithersburg laboratory. The inll)rlllation Clnd experience gained from this effort will be applied to the design of new paint lilm SR~1s by NIST and to the investigation of the perlormance or XRF instruments and sonware thal arc commercially available to
Attachment (A)Page I 01 j{)

839.01-09-025
government agencies, testing labs. manunlCturers ofchildren's products and retailers of those products.
This report covers the XRF analyscs perlcmncd at NISI' using a wavclength disrcrsive spectrometer (WDXRF). The NISI' WDXRF instrument is t)pical of those available today. It provides high resolution measurement carability eourled with high sensitivity Icw three key spectral lines ofPb: L3-M 4,5 (Lex 1.2). Le-M 4 (1.[11). and Le-Pe., (Mexle). The I.-series lines arc com man ly used by portab Ie and henc h-tor spectrometers t'm measuremcnts 0 I' Pb. Some commercial instruments also use Pb K-Ln (KO,le) lines that cannot be accessed by the NISI' WDXRF spectrolrlcter due to their high energies. To the knowledge of the authors. the M-series lines are not used in handheld instrumcnts due to their low energies. the low sensitivity afforded by using these lines, and thc inherent surfaee specificity of measurements of low energy X rays. It is that surface specilieity that is attractive in this investigation because it is desired to develop a method for quantifying the Ph mass I'ractions of thin puint layers. The CPSIA stipulates that Pb content of paint be assessed in units of'"rarts per million" \\hich is taken to mean the Sl units ofmg/kg (or ~lg/g).
XRF methods typically report the amount ot'an analyte in a thin layer as mass per unit area. e.g. ~lg /cme, because energetic X rays are typically measured and the count rate or X rays is a function of both mass fraction and thickness of the specimen laycr. Conversion between mass l'raction emd mass per unit area requires knowledge of the density of the layer (or layers) and the distribution of the Pb within thc layer (or layers). By measuring two or more different X-ray lines for Pb, it is possible to derive some information about the layer thiekncss and the distribution 01' Ph in the specimen. This el'fc)rt is aidcd by measuremcnts of scattered primary radiation, viz. from the instrument's X-ray source. usually a tube source. 13y using the M-series lines. in addition to the L-series lines. it may be possihle to dl'termine the mass t'raction of Pb directly at the same time as the mass per unit area is obtained. Because the derivations may requirc the int'ormation, attempts will bc made to measure the thickness of'the film and hulk density of dried paint.
Equipment: Thc following equipment was used to prepare paint films. cut specimens, and measure the specimens.
Draw-Down Bar: The bar was obtained on loan from CI>SC. 11 is approx. 16 cm "ide and constructed of'aluminum alloy. I\djustmcnts orbar height are made using two micrometers to move the bar attached under spring tension.
Hole Saw: Disks of polymethyl methacrylate (PMMI\) were cut using a hole saw altaehmelll for a drill press located in the 839 shop in building 227.
Pan Balance: NIST MettleI'I P[1600 located in building 227. room /\330. capacity 1600 g with lowest increment or 0.01 g.
ICl'rtum C0111IllerCl,ill.'i..1Lllpnk'llt IllSlrlllllClltatlllll, lH 1ll,llL'rldls \.lft' lJCtlll!"H.:d 111 thl'i poskr [0 ~P""l'll\ <'llk'lIl1~\Il'1\ [he l''\!1l'rmi\.:nlal proi,,:l'UUfL' Such ldl,.'nll(lcatlOn dol'S Iwl Imply' rl'l'OI11 I)h..'ll Lbt 1011 or L'llJnrsL'llh..'nl hy NIST. IllH dOL'S 11 1ll1ph l!l,lt tlK' m'Ik'!"1"!." 01 l.'ljlllpn]l'll( ](k'ntll"lL'd eIre
Ih:c\.:'ss~lnl; the hl.'Sl ,1V;liluhk for till.' plirpos\..'
Pagc 2 or 30

839.01-09-025
Pan Balance: CPSC Mettler Toledo PG-503S, c<lpacity 510 g with lowest increment of 0.00 I g.
Semi-micro Bal<lnce: Sartorius MC 210 S locatcd in building 227, room 1\330. The balance is maintained according to TP839.0 I-II O.
Micrometer: Manualmicromcter English units model manufactured by Scherr-Tumieo, St. James, MN, USA. Currently, this micrometcr is not calibrated using a traceable relcrenec material.
UItrason ic th ickncss gage: Pos iteetor mode1200n manul~,ctured by Dc Fel sko f'or determ in ing polymer coating thickncsses nondestructi\ely with a precisioll or J 2 pm. I\ttached probe sends out an ultrasonic pulse which is rellccted b) the substrate material. Assuming a polymer lilm, the specd of the pul se is known and the timc for the re !leeted ec 110 is measured to c1etcrm inc the thickness or a polymer layer.
Hydraulic Press: Two presses werc lIsed to prepare specimens. For high-prceision preparation of specimens, a SPEC model 3630 automated press was employed. For pressing requiring more careful or slower application of lower pressures, a Beckman model 00 press was used. In both machines, pressing was done using standard dies and die pellets constructed or steel in diameters 01' 31 mm and J3 mm.
llead-Over-Heels spinning apparatus: Manufactured by VOOR'T Ll\nO in 13elgium for mixing the contents 0 I' small batt les by rotat ing the bott Ie perpend ieular to its axis 0 I' cy Iindriea I symmct ry.
Oven: Lindberg/13lue M nox Furnace model BF518~2P[3FMC located in building 227, room 1\330. Oven was set to 55°C 1'01' curing paint samples beillre they \vere cut into subsamples for analysis.
Mixer: SPEX Industries mixer/mill catalog number 8000 located in building 227, room 1\344. This was used to mix paint samples for 5 minutes immediately bell)re application to substrates.
Portable XRF Spectrometer: TherllloNITON model X1.1', property orCPSc. The instrument is all I:DXRF spectrometer, and it was calibrated hy the 111anul~lCturer. Dl'tails of the calibration and calculations are not available.
WDXRF Spectrometer: PA Nalyticallllodel PW2404 10calL'd in building 227,1'00111 1\326. The spectrometer is maintained according to the manufacturer's specifications. The spectrometer perrorms to the manu l~l(.:turing spec ifications tllr stabi Iity as demonstrated on a period ic bas is. The spectrometer is equipped with a Rh anode. end-window tube capable of operation at lip to 4 kW with a maximulll potential 01'60 kY or a maximum current or 125 mA. The calibration of this spectrometer is performed in accordance with TP-839.0 1-0]].
Chemicals and Materials: The follc)\\ ing chemicals \\ ere lIsed in the preparation or specimens and ealibrants for the experiments described in this report.
Pagc 3 01' 30

R39.0 1-09-025
L<ltc" Paint: Valspar brand, intcrior semi-gloss, while acrylic late" household paint. Ingredients listed l1n label arc water, acrylic late", titanium dio"ide. dhylene glycol. and crystalline silica.
Lead Carbonate: Spectrum, ACS reagent grade powder.
Lead naphthenate: Alra Aesar. lot number D205013, nominal concentration in 61 (Yo mineral spirits, 24 % as Pb, formula: Pb(C11lhO:!h Calculations show that the uncertainty in the mass fraction of mineral spirits must be 2 O;(l.
Plastic sheet: Several different plastics in sheet rorm were used as substrates for rairll films, as backing material lor specimens. as blank specimens. and as ealibrants.
• Polymethymethacrylatc (PIVIMA) molecular formula Cd IxO:!. Thick sheets (~6.5 mm) were lIsed us the substrate for drawn tilms or household latex paint.
• Polyester -molecular lormula C\ollgOI. The NIST paint film SRMs and commercial films of Pb metal are supported on polyester sheets.
• Acrylonitrile butadiene styrene copolymer- commonly known as ABS, several CRMs fi'om Japan arc composed of ABS.
• Polyethylene - low density polyethylene (LDPF) was used as the matrix for sOl11e calibrants custom made at NIST and containing Pb ethylhe\(anoate (sec calibrants section).
• Polyprupylene several ref'crenee materials Irom PR China were used as calibrants.
Steel sheet: (Jalvanized, low alloy steel was used 1'01' the derosition of paint layers and as an absorber behind thc Pb metal films on polyester. The sheet steel has a thick Zn coating [rom galvanizing. Pieces of SRM 1768 Iligh-Purity Iron werl' used behind the SRM 2570 paint films belore the sheet steel became available. Lead was not detected in either the steel or the iron.
Aluminum sheet: Aluminum alloy sheet containing 2 % Mg by mass was used for the deposition orpaint layers and as an absorber behind the SRM paint lilms anclthe Pb metal lill11s on polyester.
Calihrants: Calibrants consisted orSRM painllilms, SRM powdered paine SRM natural matrix materials, CRM rolymers from the National Metrology Institute of Japan (NMIJ). and metal Ii IillS on polymer substrates.
N1ST SRM paint films: SRM 2579. set or rour Pb paint Iilms and one blank lacqucr film on polyester sheets; NIST SRM 2579a. set or lIve Pb paint Illms and one blank lacquer lilm on polyester sheets; and NIST SRM 2576. one Pb paint I'ilm and one blank lacquer film on polyester sheets.
NlST SRM paint powders: SRM 2581 nominal 0.5 (10 Ph in paint, SRM 2582 nOlllin,ll 0.02 '!;()
Pb in paine SI{M 2586 Pb paint in soil. and SR!'vI 25R7 Pb paint in soil.
NIST naturalmateri'lls: SRM 1566a oyster tissue. SRM 1575 pin\: needles, and SI{M 2583 household dust.
Page 4 or 30

R39.0 1-09-025
NMIJ CRMs: CRM 8105a and CRM 8106a Cd, Cr, and Pb in Al3S resin. These materials are 30 mm diameter disks of approximately 2 mm thickness.
Metal films: Three reference materials were custom-Illade by Micromatter Inc .. WA, USA. All arc Pb metal deposircd on 6.3 ~lm thick polyester sheets using an evapor,ltivc process and gravimetry. The three materinls were designed to simulate coatings containing Ph in the range of 20 ~lg/cm2 to 300 ~lg/em2.
Smnpling Details: l~ach typl' or material \vas prcpared in a ditTerent manner as descrihed he 10\\/.
Paint Film SRMs: One unit ol'each SRM eomposition was cut to provide either a square or a circle that covered the 17 mm diameter opcning ofa sample holder for the WDXRI" spectrometer.
Powdered Paint and Natural Matri:\ SRMs: The powders \\cre prepared as hriquettcs by pressing to 20 tons in a steel die. Briquettes of SRM 258 I and SRM 2582 were prepared from 0.5 g with no support to give thickness of approximately 300 ~111l. SRMs I566a, 1575,2583. 2586, and 2587 were prepared from 6 gin .;\1 support caps to created hriquettes ofahout 3 mm thickness.
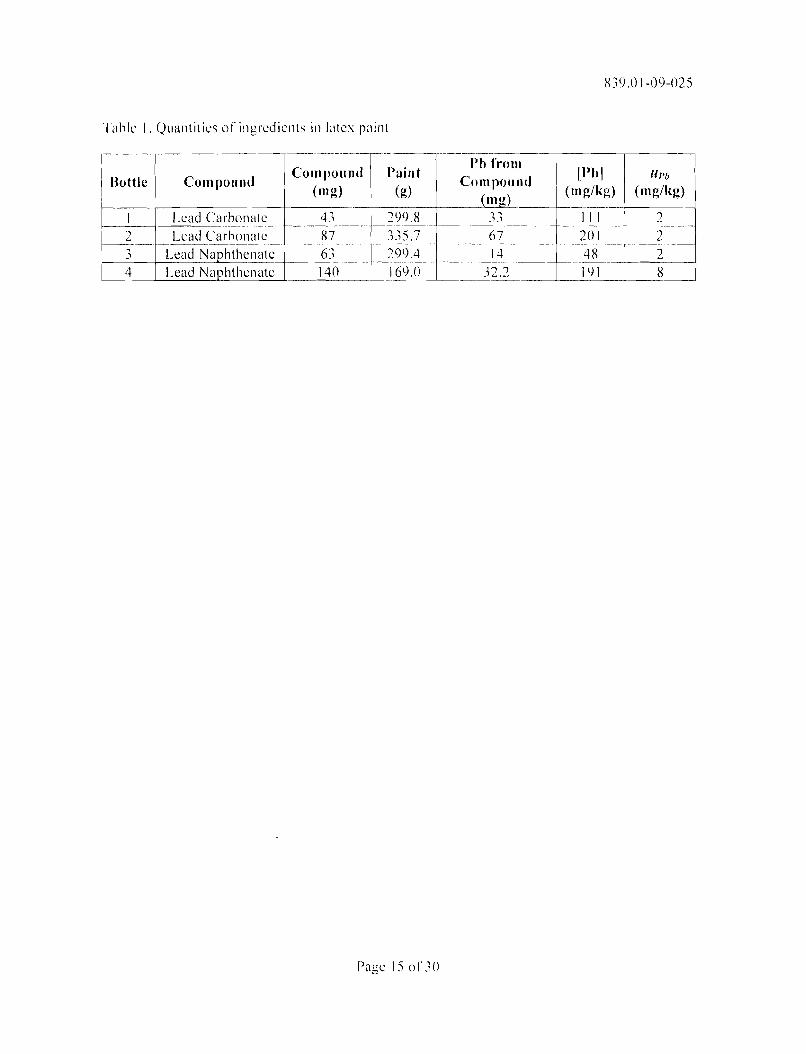
I.aboratory Prepared Paint Fi Ims: Four paints containing I(m levels of lead compounds were prepared at the CPSC laboratory on Nov 10,2008 using \\hite latex paint lead carhonate. and lead naphthenate. The lead eompound was added to a clean. tared bottle and weighed. Paint was then added to the bottle and weighed. Weighing measurements were conducted on the Mettler Toledo PG-503S balance. A magnetic stirring bar was placed in each hottle and the hottles were capped and the paint solutions were stirred 1'01' 2 hours. The bottles were then placed in a lIeadOver-Heels spinning apparatus and spun at 75 rpm for 6 h. Table 1 lists the mass orthe lead eompounds and paint tor each mixture, and the calculated Pb concentrations in \Vet paint. The rightmost column is thl' estimated combined standard uncertainty. II. 01' IPhi based on uncertainty of weighing and the uncertainty ol'the Ph Illass fraction in each compound.
The paint was applied to clean suhstrates as rollows. The drawdown bar was washed with paint thinner to ensure the working sud':lce was clean ordried paint. The height ol'the bar was set using micrometer screws. 2 mL to 3 mL of paint wcre poured on one end oCthe substrate. The drawdown bar was passed over the pool Or\\et paint and suhstrate. creating a \vet lilm. [xcess paint was drawn past the end orthe substrate and the suhstrate was removed to air dry 1'01' 1 d. The sample was then allowed to eure for 5 d in an oven at 55 dc. Finally, subsamples were cut from the suhstrate using machine tools in the Division R39 shop.
Film thickness was determined using the ultrasonic depth gage detailed earlier. Film density was determined using the thicknesses ohtained in conjunction with the mass or dried Ii Ims peeled ofl' substrates. The paint lilms peeled free or metal substrates leaving no visible residue. The density values obtained 1'01' peeled paint iilms were used It)r densities or paints applied to PMMA substrates at the same Ph concentrations. Paint was more dinicult to remove from PMMA
Page 5 or 30

R39.0 1-09-025
substrates without accidental removal orthc substrak itselror destruction of'the film, so paint density was assumed to be relatively unchanged for u given Ilb concentration. This contributed to some uncertainty in the paint Jilm density values 1'01' PMM,t\ samples.
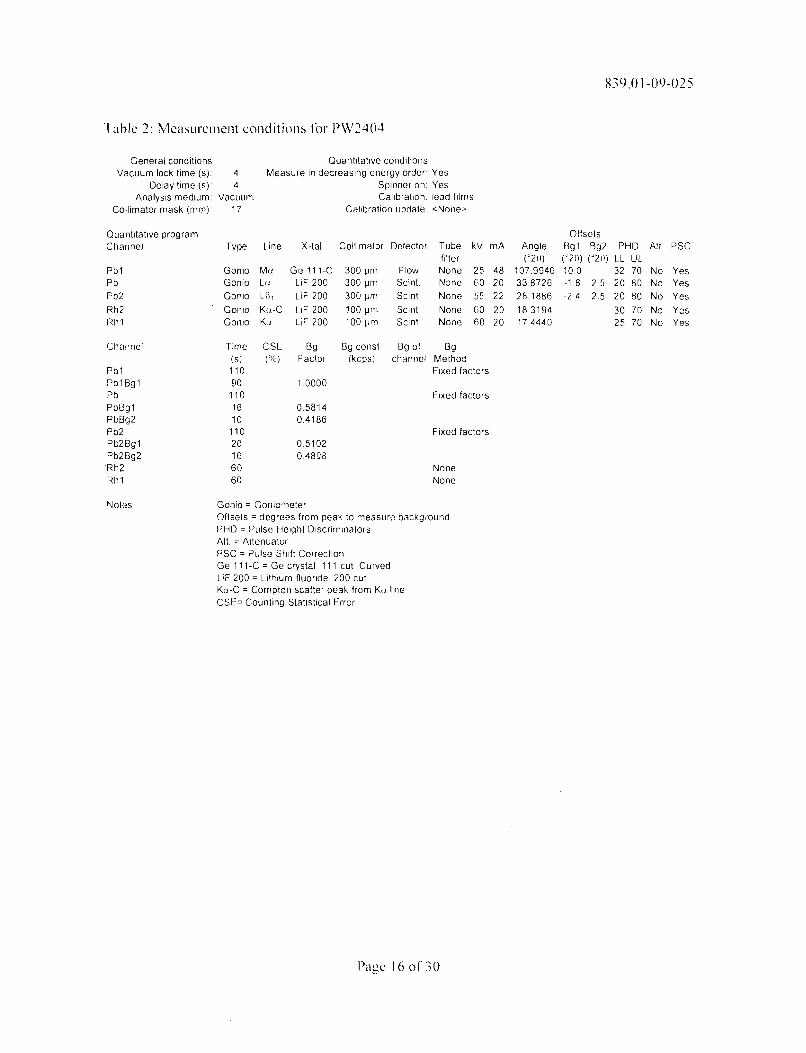
Summary of Analytical Methods: Threl' testmcthnds were used or developed by N1ST and CPSC researchers. All NIST XRF analyses were performed using the PW2404 wavelengthdispersive spectrometer, The spectrometer is equipped with multiple masks ror selecting the area or the specimen to bc 1l1e'lsured, multiple collimator lor optimizing the resolution or secondary X-rays from the spec imen, mult ipIe erysta Is and diffracti ng structures for opt im izi ng rcsolution and sensitivity, three detectors lor optimi/.ing sensitivity and selectivity. Measurement conditions were ehosen to maximize sensitivity, minimize counting statistical uncertainty (CSE), and minimi/.e spectral intcrlerences.
flb I.-Series Lines: Typical spectrometers designed specilically ft)!' Pb measurements arc optimized for measuring the Pb I.-series and Pb K-series characteristic lines. The excitation of K-series lines requires primary source energy in excess 01'90 keY. This is not possible with the PW2404 spectrometer. Excitation of the I.-series lines requires source energy in excess of 16 keY. which is possible. No known portahle or benchlop Spl'ctrome1l:rs ,'or Pb anulyses utili/.e the Pb M-series X-ray lines. These lines arc low energy (2.3 keY to 2.5 keY), and arc of lower inherent sensitivity because they are absorbed stmllgl) by air and lheir Iluorescence yields arc lower than those lor K-series and I.-series lines.
The PW2404 spectrometer is \vell-equipped lor excitution and meusurement of I.-series and Mseries lines of Pb because it has a Rh anode X-ray tube, Rh K-series X rays arc well suited It)r causing fluorescence of Pb L-series X-rays. and Rh I.-series X rays arc well suited lor causing fluorescence of' Ph M-series lines. In add ition, the Rh K -series 1ines arc measured for usc as internal references in a manner similar to an intcrnal standard. but without the need to spike something into each specimen.
Measurement conditions were established for Pb le1.le. Pb !,f)[. one background location on each side of each peak, Rh K-I.n (Kcxl2) Rayleigh peak. and Rh Kexl2 Compton peak. Peak locations \\el'e chosen f'roIT! scans of both high concentration and low concentration specimens. To the extent possible. the measurement condition settings were kept constant for all ol'these measurements. See Table 2 It)r the measlII'ement conditions.
Medium resolution collimation was used to resolve the spectral interferences fhlm the L-series peaks and background locations. For the Pb Lexie peak. signilicant interferences include Hi Lseries lines at the high energy tail of the Ph peak and 13a K-M lines (yd order difTraction) ncar the low energy tail of the Pb peak. These Ba lines arc or little consequencc because ],d order diDhlction yields very low inknsity. Selection of the buckground measurcment angles is complicated by Sr K-L lines on the high energy side of the I'h peak and In K-i\1 lines (2"d order) on the low energy side. The potential haekground inter!erences arc far enough fi'oll1 the Pb peak to cause no signilicant problems. For the Ph LPI. the only significant. potential inlerlcrences arc with background location selection. Se Ke1.12 lines are on the high energy side of'the Pb pe,lk and Rh Kcxl.2 (2 nd order) lines arc on the low energy side. For this work. the high energy
Puge 6 ono

g39.0 1-09-025
background angle was chosen ncar to the Se lines because additional, more likely interlerences e.\ist at higher angles.
Background measuremcnt is complicnted by the wide variety ofspecimcn compositions and by the requirement for low detection limits for the measurement process. Both I)b peaks require two background measurements bracketing the Pb peak because the background slopes either upward in count rate or downward with increasing goniometer angle. The direction ol'slopc and rate of change with angle depend on the matri.\ composition of the specimen. including the substrate beneath the coating 1:1yer(5). 13ackground counting times must be high to ma.\imil.e the detection limits. Targets Il)r detection limits \\ ere set to .5 mg/kg to 10 mg/kg. Again. condition settings arc given in Table 2. 13ackgwund count rates must also be minimized to improve detection limits. The choice ol'llledium collimation reduces background at the expensive of sensitivity, but sensitivity is more than adequate using the L-series lines. Background can also be reduced by careful selection of the discriminator setting f'or pulse height selection.
Pb M-Series Lines: The Pb M-serics lines require a dif'krent set ofmeasurcment conditions. I:or the X-ray tube. low voltage (25 kV) and high current (125 mA) arc optimum because those settings create a strong set of Rh L-series lines from the anode. These Rh lines enhance Iluorescenee of the Pb M-series lines. The Pb line being measured is Pb L;?-P2J (M<Xl;?). The most important spectral interl'crence is the S K<XI.2 peal\. that flartly overlaps the Pb Mal2 peak on its low energy tail when the mass li'action of S is high. Ikcause there arc other interi'cring lines on the high energy side ol'the Pb peak. a single background angle must be chosen far enough below the S pe,lk energy that the tail ofa strung S peak will not interlCre with background measurement. In this case. the background angle is 10" 20 greater than the Pb peak angle.
Measurement (Jeometry: The area ofmeasuremcnt was chosen to be appro.\imately the same as the typical area viewed by a handheld spectrometer. A channel mask of 17 mm inner diameter was chosen to measure all specimcns. Inside thc I)W2404 spectrometer. the X-ray tubc illuminates the speeimcn and its holder over a diameter ol'approximatcl) 45 mm Ii'om an angle 01'45" below the horil.ontal surl~lce of the specimcn. /\ set of'masks arc positioned to intercept the secondary X rays at an angle 90" li'om the axis ot'the X-r'lY tube and 45° from the horizontal surface ot'the specimen. Because the X rays arc collected Ii'om a take-olTangle 01'45() with respect to the surl~lce of a sample. the ef1'cctive cscnpc depth of measured X rays must be considered in that samc direction. This works tuthc advantage orthe analyst when Ineasuring thin specimens hecause the thickness or the layer must be divided by the cosine 01'45° to estimate the thickness in the viewing direction. For the Pb Mau X rays. the thickness of paint that attenuatcs 100 % of the X rays is approximately 112 ~lm r11. This is cnlled "in finite thickness" because no X rays can pass completely through the material. When the viewing angle is 45° f'romthe surf~lce. a layer gO pin thick appears to bc infinitely thick Ill!' that energy of X rays. Undcr conditions oI'infinitc thickness. the count rate is a t'unction or mass f1'action only.
Measurement Time: Measurement times were calculated by the SuperQ sol\ware on the basis or data collected by scanning low concentration specimens and choosing thc required detection limit. in this case 10 mg/kg because the method must be capable orquantif)ing 90 mg/kg Ph. Again, sce Table 2 for the calculatcd times.
Page 7 01' 30

X39.0 1-09-025
Ca lihratiol1s: Quant itat ive ca Iibrat ions \\ cre based on the genera I a Igorithrn shown in Equat ion I. Detailed listings ofthc parameters for the analytes are storcd in the rl/\Nalytical SuperQ sotlware in calibration file lead/11m.\' and in the Excel spreadsheet lead/illl/.xls.
C I =[)
l +/:"I?
I +F/(
I. I I (1)
'v\ here C, = the conccntration of analyte i in mass ll-<lction or mass per unit area. }), c= the intercept. £, =. the coet'1icient orthe linear term. R, = the measured count rate ror the analyte F, = the coelTicient of the quadratic term
It is well known that the relationship between measured count rate and specimen mass per unit area is nonlinear when the specimen thickness is less than the inlinite thickness ('or the X-ray energy and the material composition. Typical corrcction could be applied to account for varying amounts of scattered X-rays rrom substrate materials. Ilm\ ever. plotting instrument response versus concentratiqn gavc virtually identical rcsults rcgardless nfthc suhstrnte used. This is observed by the similar instrument responses for all substratcs shnwn in Figurc I and I:igure 2. Furthermore in the reginn nf interest (Figure I hand I'igure 2b). the calibrntinn ror all three substrates cnuld be assumed to be I;near.
It is possible to prepare a number ofealibration curves 1'01' determinations of either mass per unit are,l or Pb nr mass fraction of lIb. First. the discussion will cover the Pb L-serics lines used I()r delcrminations of mass per unit area. Second.thc discussion will turn to using thc Pb Mex line for determinations of mass rraction Pb in a layer.
Pb L-Series Lines: All six curVl:S were fit to data measured from paint lilm SRMs 2570 through 2579a. excluding SRM 2571. SRM 2576. and SRM 2579 Level I. The SRMs were excluded because the curves are not linear above 2000 pg Pb/em2 and it seemed appropri~lte to use standards which were \\ ;thin a similar concentnltion regime as the samplcs measured. RelCrenee materials from [\'1 icromatter prepared by evaporntion 0 f /lb meta I onto po Iyester sheet were aIso inc luded because there are no available paint films having less than 290 ~lg Pb/cm 2
. Figure I a and Figure 2a both show a polynomial1it using all the standards. while Figure I band Figurc 2b use linear tits additionally excluding SRM 2572. SRM 2573. and SRM 2579 Levels II and llf. The inlcrcepts oLdl curves in Figure I band Figurc 2b wcre set equal to thc intercepts obtained hy littingjust the data fmm the Microll1atler and blank SRM specimens. The reason Ic)r locking the intercept is that XRI: data is heteroscedastic. During the regression to fit a curve. the lowcst concentration points sh(luld be weighted more heavily than the higher points. Ilowe\ler. it is quitc diflicult to perform weighted regressions using Microsoll l:xcel. It is Illuch simpler to force the curve through a lixeel origin. For both I·'igures. one oCthe thrce CUI'\'CS in each Figure is data measured from specimens with plastic disks behind thcm. another with aluminum sheet
Page 8 or 30

~39.0 1-09-025
placed behind the specimens, and a third with steel disks behind the specimens. Count rates are virtually identical for all three substrates, suggesting that no correction lor scattered X-rays from the substrate is necessary.
Comparisons of specimens can be made hy calculating the ratio of the Ph Lex and I.~ net count rates because the Pb 1.[3 X ra)s (\I"e more penetrating than the I.et X rays. The ratio of the Ph L lines eOllnt rates may provide ,1 clue about whcther Pb is present in the laycr. the suhstr(lte. or both. For example, a plastic toy with a blue coating gave a result 50 (Yo greater lor the net Lfj count rate than for the net l.ex count rate. It was 10uIlli tlwt the plastic containcd at least as much Ph as the coating did. This eX<lmplc is in contrast to Figures I and 2 wherc the Ph containing standards on Pb-free suhstrates gave higher count rates for Ph LIL X rays than Ph q3 X rays. In either case, it is critical to have some knowledge of the paint l(lyer thickness so that a determination can be made regarding the substratc's role in c<llibration. !\ layer may be thin enough that its effects on the primary radiation arc negligible compared to those of the substrate. These effects as well as thc mass absorption eodlicients are typically included in a calihration model of an X-ray spectl"Ometer intended for dctcrminations of coating thickness. !\ brieL inllJrmative discussion may bc found in a recently published book on portablc X-ray spectromcters r2j.
\\'hen specimens arc less Ihan infinitcly thick \\ ith respcctto the distanccs travelecl by the measured X rays in the matrix. it is common to correct for the effect by calculating the ratio of the analyte count rate to the count rate of an internal re!en:ncc line such as the scattered, primary Rh radiation li'om the X-ray tube. Ilmvever. this approach only works when the thin specimens have no supporting substrate or when all have the exact same substrate composition. For the paint nlms prepared for these experiments. the substrates absorh the primary X rays to very different extents. Steel absorbs Rh X rays more strongly than aluminum and much mOlT strongly than PMM!\. Therefore. the count rates ol'Rh radi,ltion can be used as an indicator of the nature of the suhstrate bellcath thc pain layer(s). 11()\\ever. the scattered radiatinn cannot be used to correct le)r the thickness ol'the paint layer unless all substmtes arc thc same composition and thickness among all specimens and calibration standards.
Ph M-Series Lines: Figure 3 is a calibration curve for Pb MlXI~ data fi-c)m what are essentially bulk specimens of powdered paint and natural material SRMs. That is, the briquettes of these SRMs are more than thick enough to be infinitely thick for Ph MlXI.2 X rays. The curve does not include data from paint film SRMs for twn reasons. There arc no mass fraction values available Ic)r the paint films. and the protective polymer 111m on each SRM sheet ahsorbs > ~5 01<) of Ph MlXI.2 X rays. Ifany products have a protective, Pb-tree layer applied to their surface. it would not be possible to obtain accurate results using the Pb M-series lines.
l-'igure 3 is used to illustrate the behavinr or I)h MU·I= X rays as the quantity 01' Pb increases in a thin specimen. This curve repn:sents data measured Ic)!" the Micrnmalter I'cfi:renee materials. rhe horizontal axis is the mass ofPb (~lg) estimated to he present in the measured area of each tilm. The shape of the curve illustrates the response as the number of Ph atoll1s in a thin layer is increased. However. the curve cannot be compared to measurements or coatings hecaus(' Pb atoms in a coating arc surrounded by a polymer matrix that strongly ahsorbs low cnergy X rays
Page 9 or 30

~3t).0 1-09-025
such as Pb Ml,(l,~. A fully successful calibration using llleaSLlI'Cments of Pb l\10.1,~ must include the el'fects orthe matrix in which the Pb atoms reside as well as the efTects or layers that arc less than infinitely thick 1'01' Pb Mcxl.~.
Mass rraction results given in the report were determined using the calibration in Figure 4. This was done in spite of the r~lCtthnt some of the specimens wcre not infinitely thick 1'01' Pb M-series X rays «80 ~lm) because the research was designed to shlm trends and to illustrate the numerous eomplicntions of XRF ann lyses of thin specimens. L,lter in the report. the calculated results arc compared to lCPOr:S results ohtained at CPSC for the purpose of testing the limitations ofXRF analyses using Pb M-series lincs. II was nevcr a goal to obtain high accuracy results in this manner.
Results for Lead in Latex Paint Films: Determinations or mass It-action and mass per unit area were perrormed on the paint IIlms prepared at NIST using Intcx paint spiked with PbCOi or Icad n'lphthenate. The results arc collected in n series oftnblcs. Tnble 3 through Tablc 6. one for each substrate type. plus one for the repeatability measuremcnt results, Sumllwries ol'the results nrc shown in Figure 5 through Figure 7. I·'or compnrison to CPSC I('POLS results in the "igurcs, thickness measurements I'rom I'able 7 were used in conjunction with a mcnsured average paint film densitv or 1.4 g!cm1 to convert from Ill ll !k!.!. to Ij!.!.!em=./" 'r b.....
Table 3 and Figure 5 show the results obtained lor paint applied to a PMMA substrnte, All paint lilms were applied with the drawdown bar set to 25 mils (640 ~lm), Sample identifiers starting vvith I and 2 were spiked with PbCOJ • while 3 and 4 denote spiking with lead napthenate. The "A" and "[3" identifiers indicnte agitation of the container of paint belore usc. with "A" samples agitated for 5 Illinutes and "13" samples not being agitated. The agitation did not appear to have a significant elrect. The linear calibrations shown in I"igure Ib and [:igure 2b were used for value assignment tor thc I>b LC!. and Pb L[\ lines while the calibrations 1\'om Figure 4 \vas used for value assignmcnts using the Mo, line.
It is evident from looking at Table 3 that similar results arc obtained for} landheld XRF and WDXRF measurements for the paint l'il1m on PMMA, Comparison to ICPOES also shows similar results in Figure 5, The error bars shown in Figure 5 are only indicalive of the standard deviation of the samples, with the "A" and "{3" samples combined for each concentration. It is also important to note that while the Ilandheid XRF and WDXRF results are lor the same samples, ICPOES results are ror different samples from the s,lme drmvdown, and may have dilTcrent concentrations dl/e to the method of preparation,
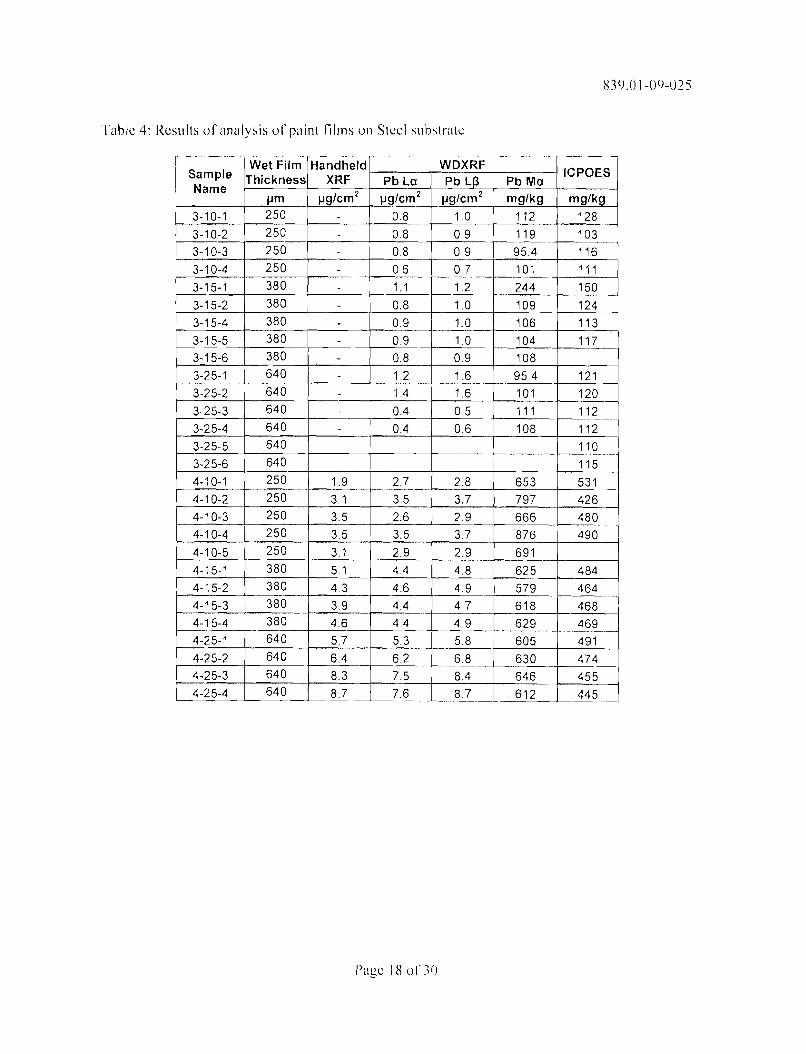
Table 4 and Table 5 give the results ['or analysis 0[' paint lilllls on metal substrates, In this case the lilm thicknesses were varied. The lead naphthenate spiked paint used ['or the application to PMMA was used, The PbC03 \0\ as notl/sed in the interest of limiting the number or samples and because the lead napthenate spiked paint showed belter reproducibility with (Iil'l'crent digestion types for ICPOES.
The most signitieant item in this collection orclata is that the Handheld XRF instrument was not able to detect Pb on either orthe substrates spiked with 50 mg!kg lead napthcnate, This is a
Page 100[' 30

R39.01-09-025
Cl)l1Cern as the dried paint films at this kvel would have a concentration similar to the regulatory limits set by the CPSL\. I~igure 6 and Figure 7 summarize the results 1'01' paint films on Steel and Aluminum respectively. For both substrates. the results ror WDXRF and ICPOES arc similar at the lower concentration level (i"igure 6a and Figure 7a). and higher conccntr<ltion levels (Figure 6b and Figure 7b).
The results orusing the Pb M line are shown in I·'igure Rand 9, It is evi(knt lhatthe lower concentration (50 mg/kg) Pb containing paint films sho\\ <lgreement \\ith the ICPOES analysis. Iinwever, at higher Pb concentrations the two techniques dn not agree. One probable explanation is th,lt during drying. the Pb is partitioning intn the tnpmost reginns orthc paint films. The Pb M X rays are indicative oCthe Ph eoncentratinn ncar the surfilce while the ICPOES results give a result where any depth heterogeneity is eliminated by sampk preparation. While this is a possible explanation, it docs not seem as likely as a calibratinn problem.
Ikcause most or the paint films arc still less than inlinitc thickness (RO fun). depth heterogeneity should not playa signilicant role. It is more probable that other interlCrences such as matri:-.: efTects are causing the WDXRF measurements to be erroneously high. Further study using rundamental parameters and taking into account mass absorptinn coef'licients wnuld be expected to yield more accurate results.
Repeatabilitv or Using DitTerent Spectrometers: The repeatahility standard deviution was calculated for 10 measurements of a single location on a single specimen or Pb-spiked paint on each of the three substrates used. The test was done with the PW2404 spectromcler and with the ThermoN1TON handheld spectrometer. The results arc provided in Table 6 where the individual results (for the Lf1 line) arc listed along with the mean lor each sample. the standard deviation or the 10 results. and the relative standard deviation (RSD). Only two dirrcrent samples within the same drawdown were measured by ICPOLS. nllce with each digestion procedure, <lI1d dn not represent an attcmpt to dclerm inc repeatabi Iit) .
II is clear that the WDX RF spectrometer provided more repeatable measurements. and there ,Ire several reasons why this was expected. The WDXRF spectrollleter has much greater sensitivity resu1ting in higher count rates. Counting times were optimized lor low detection limits, which in turn, results in lower counting statistical uncertainty according to Poisson statistics. The h<lI1dheld spectrometer is conligured for t'clst analyses or 30 SOl' 60 s. lis softwarc can be set to choose a longer time when a low count rate is encountered. Ilowever. the count rates arc t) pieally very low and relative counting uncertainty is> I % and possibly> 5 (/(J. By comparison, WDXRF relative counting uncertainty is typically < I ~,(). An additional source of" variance in the usc orthe handheld unit is movel11ent of" the instrulllent and analyst possihly resulting in small changes to measurement angle and location on the specimen. In contrast. the WDXRF spectrometer loaded the specimen and measured it repeatedly bcl<'11'C unloading it. The only noted change was damage to the paint surface in the Corm of' roughness due to apparent outgassing in the heated vacuum chamber.
The repeatability measurements were also made on one sample of" Pb-rree paint film. sample A3. Table 6 shows results rrom the WDX RF measurements of" a "hlank'" sample. but not f"rom other
techniques. The handheld spectrometer reported a 'less than' value when no Ph X rays were
I>age 11 of" 30
R39.0 1-09-025
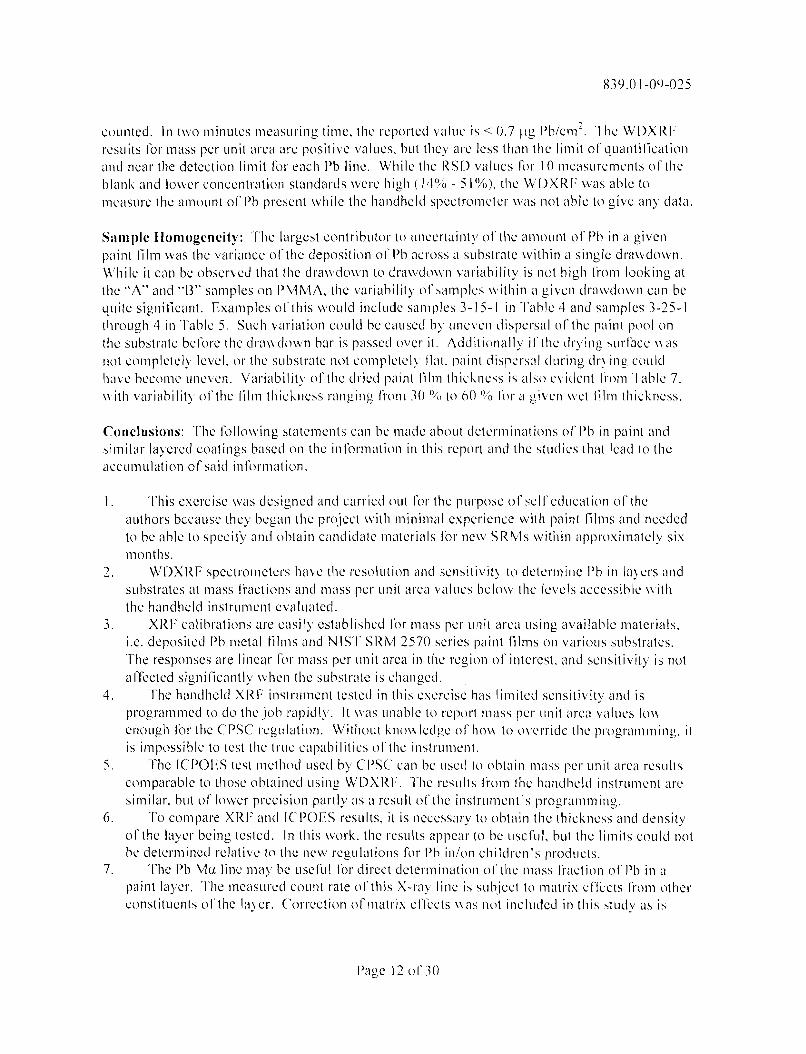
cllunted. In two minutes measuring time, the reponed value is < 0.7 flg Pb/cmc. The WDXRF results for mass per unit area arc positive values. but they arc less than the limit of quantification and ncar the detection limit for e,lch Pb line. While the RSD values for 10 measurements of the blank and lower concentration standards were high (14(!1) - 51 °11,), the WDXRF was able to measure the amount of Pb present while the handheld spectrometer was not able to give any data.
Sample Homogeneity: 'rhe largest contributor to uncertainty of the amount of Pb in a given paint film was the vari,lI1ce ol"the deposition o/'Pb ,lcross a substrate within a single drawdown. While it can be observed th'lt the drawdown to drawdown variability is not high from looking at the "A" and "13" samples on PMMA, the variability of samples within a given drawdown can be quite signiticant. Examples of this vvould include samples 3-/5-1 in Table 4 and samples 3-25-1 through 4 in Table 5. Such variation could be caused by uneven dispersal of the paint pool on the substrate before the drawdown bar is passed over it. Additionally if the drying surface \\as not completely level. or lhe substrate not completely 11<It. paint dispersal during dr) ing could h,1ve become uneven. Variability of the dried paint 111m thickness is also evident li"Dln Table 7. \\ith variability of the lilm thickness ranging /I'om 30 (1<, to 60 Oil) 1'01' a given wet 111m thickness.
Conclusions: The following statements can be made about determimltions 01' Pb in paint and si milar layered coati ngs based on the in format ion in this report and the stud il's that lead to the accumulation of said information.
I. This exercise was designed and carried out for the purpose of self education of the authors bccause they began the project with minimal experience with paint films and needed to be able to specify and obtain candidate materials for new SRMs within approximately six months.
2. WDXRF spectrometers have the resolution and sensitivity to determine Pb in layers ;lnd substrates at mass lI'aetions and mass per unit areu values below the levels accessihle with the handheld instrument eva luatecl.
3. XRF calibrations are easily established for mass per unit area using available materials, i.e. deposited Pb metal films nnd NIST SRM 2570 series paint films on various substrates. The responses are linear for mnss per unit area in the region of interest. and sensitivity is not alTeeted significantly when the substrate is changed.
4. The handheld XRF instrument tested in this exercise has limited sensitivity and is programmed to do the joh rapidly. It was unable to report mass per unit area values lem cnough li)r the CPSC regulatinn. Without knowledge orhow to override the programming, it is impossihle to test the true capabilities of the instrument.
5. The ICflOES test method used by CPSC can be used to obtain Inass per unit area results comparable to those ohtained using WDXRI,'. The results frum the handheld instrumcnt are similar, but of lower precision partly as a result of the instrument's programming.
6. To compare XRF and ICPO[S results, it is necessary to obtain the t.hickness and density of the layer being tested. In this work. the results appear to be useful, but the limits could not be determined relative to the new regulutions for Ph in/on children's products.
7. The Pb Mu,line may be useful for direct determination of the mass fraction orPb in a paint layer. The measured count rate orthis X-nlY line is subject to matrix enccts from other constituents of the layer. Correction or matrix eflects was not included in this study as is
I>age 12 ono
R39,O 1-09-025
easily seen in the scatter of'points in Figlll'e 4 and disagreemcnt between techniques in Figlll'e 9, In addition. it is expected that many coatings on children's products are much thinner than the infinite thickness for Pb M-series X rays in paint and similar materials,
R, Even with a low level of experience. it was possihle to prepare usel'ul paint Iilm samples using the dn1\\down technique, Ilowever. it is obvious that additionulmcasurcs must be tilken if a uni !()l'Ill paint film thickness is desired, In many cases. the paint layer thickness varied utleast 30'% over the course of only a single dnmdown. While additional variance wus not observed between samples from multiple dr~1\\downs (in the case ofPMMA). the need to measure Pb in terms of mass li'action requires much tighter control of the paint layer thickness,
L), The levels 0 f Pb with in sing Ie drawd owns were not homogeneous, Th is appears to be a separate issue from the uni!()I"111ity of layer thickness as unpredictable Pb concentmtions were observed independent of the emission line used for calibration, It is not obvious if this heterogeneity was a result of incomplete mixing/dissolution of the Pb in the paint or a result of uncontrolled v[lri[lbles during the drying process,
References: Project data and document liles are stored on the f)ocushare ACD inlr[lne1. The data are stored in Excel spreadsheets: "leadlill11,xls" 101' the original data. Raw data [lnd locations of subsamples upon each drmvdown samples arc located in lab notebook IIR39803 pgs 101-125.
III \\ eb applet: "X-ray Interactions with Matter" http://henke,lb1.gov/optical_constants/ [lccessed December 2008. 13ased upon: B,t.. Ilenke. E.M. Ciullikson. :lI1d .I.e. Davis. X-roy illleruclilillS: fJ!lliloohslirplilill, scal/erillg, IrOI1SllIissilill, olld n)/eclioll (/1/:' 5()-3()()()() ef', /. 1-1)2. Atomic Data and Nuclear Data Tables Vol, 54 (no,2). 181-3~2 (1993),
121 Potts. Philip J. and Margrct West. Po/'whle X-m)' FI//lirescence '~/JCclrol71e/lyRSC
Publishing. Cambridge. UK. (2008), 131 TP-839.01-023 XRF Calibration Procedures 14] PANalytical SuperQ sol1\,,11'(..' version 3.0. 1\lll1elo. The Netherlands,

839.01-09-025
Reported by:
.g"'~k ';/Jr },i/h,Yrt~JJ- / J John l.. 1\1olloy \
Io:n R. Sieber Research Chemist
Research Chemist
David Cobb Cluest Researcher
Reviewed by:
Gregory C. Turk, Leader Inorganic Chemical Metrology Group
Page 14 ofJO
839.01-09-025
Table 1. Quantities of ingredicnts in latex p,lint
r--I-~~-------I-~----------I--)-'~ -- ----------- -= p~t Ph from I I> I C J Compound J aliiI
, ompoulH (m
I.ead Carbonatc 4_ --~-
8---_._-
6_14
Lead Carbonale _._----_._------~-_.
Lead Naphthenate Lead Naphthcnatc
g) --J'3(g) ____ c07.~:~~ I~JI >ott C
I ") 199 8 33 _..._ -_._,_._-~".
7-.---.-- ---335.7 672 -,... -_.. _---- ~- -~~ ----- --_.-----_.- '-- ----- -----~---
L4 ., ") 299.4 14J
32.2o LJ69.0 ~-
[ph I
(m~/k_~) I111
UPb
(mg/kg)
2 2 2
201 ~_._-,_._-_.. _-----
48 -
191--.1 8
Page 15 orJ(J
R39.01-09-025
Table 2: Mcasuremcnt eonditinns for PW2404
General conditions Quantitative conditions Vacuum lock time (s) 4 Measure in decreasing energy order Yes
Delay time (s) 4 Spinner on: Yes Analysis medium: Vacuum Calibration lead films
Collimator mask (mm)' 17 Calibration update <None>
Quantitative program Offsets Channel Type Line X-tal Collimator Detector Tube kV mA Angle 8g1 8g2 PHD Att PSC
filter ("20) ("20) ("2 II) LL UL Pb1 Gonio Mu Ge 111-C 300 IJm Flow None 25 48 1079946 100 32 70 No Yes Pb Gonio Lft LiF 200 300 IJm ScinL None (30 20 338726 -1.8 2.5 20 80 No Yes Pb2 GOfllO LIl, LiF 200 300 IJm Scint None ~5 22 281886 -2.4 25 20 80 No Yes
Rh2 Gonia Kft.-C LiF 200 100 IJm SCll1t None 60 20 183194 30 70 No Yes Rh1 Gonlo K" LiF 200 100 IJm Scint None 60 20 17 4440 25 70 No Yes
Channel Time CSE 8g 8g const Bg of 8g (s) (%) Factor (kcps) channel Method
Pb1 110 Fixed factors Pb1Bg1 90 10000 Pb 110 Fixed factors PbBg1 16 0.5814 PbBg2 10 0.4186 Pb2 110 Fixed factors Pb2Bg1 20 05102 Pb2Bg2 16 0.4898 Rh2 60 None Rh1 60 None
Notes Gonio = C30niometer Offsets = degrees from peak to measure background PHD = Pulse Height Discriminators Alt. = Altenuator PSC = Pulse Shift Correction Ge 111-C = Ge crystal. 111 cut Curved LiF 200 = Lithium fluoride. 200 cut K,,-C = Compton scatter peak from K" line CSE= Counting Statistical Error
Pagcl6nf'30

R39.0 1-09-025
Page 17oJ"30
Table 3: Results or anal) sis oj" paint films on Pi\l\1i\ suhstrate
-------- r-- ----- -_._ -_._---_._---~- ---- ----_._--------- ---_.- _._------------- -- ._ ~-~
Pb spiked into Form of Pb WDXRF ICPOES
Sample wet paint Handheld XRF Pb La Pb LP Pb MaName added
1J~/cm2 IJg/cm 2 IJg/cm 2 mg/kg mg/kgmg/kg
1A1 100 PbC03 19 3.1 2.6 119 150 ------1~116~1A2 100 PbC0 3 1.1 2.4
1A3 100 PbC0 3 20 25 1.9 124 1
181 100 PbC0 3 1.9 2.2 13 87.0 120 182 100 PbC03 1 1 21 1.1 85.9 100 183 100 PbC03 20 2.3 1.4 67.4 184 100 PbC03 ---+ 13 2.5 1.7 I 109
200 PbC03 I
303 2602A1 3.9 4.6 4.0 2A2 200 PbC03 45 4.7 4.0 288 290 2A3 200 PbC03 2.3 4.0 3.7 313 2A4 200 PbC03 3.2 4.5 4.0 370 281 200 PbC03 38 4.5 3.8 316 280 282 200 PbC03 3.9 4.3 3.8 311 280 283 200 PbC03 29 4.5 3.9 310 284 200 PbC03 3.1 4.3 3.7 337 3A1 50 Lead Naphthenate 1.4 21 1.5 107 120 3A2 50 Lead Naphthenate 12 2.0 14 121 120 3A3 50 Lead Naphthenate 1 2 2.1 1.4 115 381 50 Lead Naphthenate 15 2.2 1.5 I 101 120 382 50 Lead Naphthenate 18 23 1.2 106 110 383 50 Lead Naphthenate 1.6 2.4 1.4 99.0 4A1 200 Lead Naphthenate 9.8 8.6 8.5 591 460 4A2 200 Lead Naphthenate 86 8.2 ~ 440 4A3 200 Lead Naphthenate 9.5 8.2 8.1 578
1481 200 Lead Naphthenate 8.1 8.1 8.1 589 470 482 200 Lead Naphthenate 8.2 7.8 7.9 595.3 520 483 200 Lead Naphthenate 7.8 8.8 8.6 590 484 200 Lead Naphthenate 7.7 8.0 7.8 584
~- --~-
--
lS39,O 1-09-025
Table 4: Results of analysis of paint films 011 Steel substrate
._-- -_ .. -._-- -----_._------- ..,--~-'~- ~--------------~--~--~-~
Wet Film WDXRFHandheld (epOESl~amPI~~ Thickness XRF Pb La Pb MaPb LI3Name
1J9/cm2 IJg/cm 2 mg/kgmg/kg/lg/cm 2IJm 250 -3-10-1 0.8 12810+112 250 - 0.8 09 1193-10-2 103
,
250 -3-10-3 08 11609 r--t5.4 250 -3-10-4 0.6 07 101 111 380 - 1.1 1.2 244 1503-15-1 380 - 1.0 1093-15-2 0.8 124 380 0.9 103-15-4 106 113-380 0.9 1.0 1043-15-5 - 117 3803-15-6 0.9- 08 108 640 -3-25-1 1.2 16 95A 121 640 - 1A 1.63-25-2 101 120 640 - OA 05 1113-25-3 112 640 - OA3-25-4 06 108 112 6403-25-5 110 -6403-25-6 115 2504-10-1 1.9 2.7 2.8 653 531 2504-10-2 3.1 3.5 3.7 797 426 2504-10-3 3.5 2.6 2.9 666 480 2504-10-4 3.5 3.5 3.7 876 490 1 250 3.1 2.94-10-5 2.9 691 380 4A4-15-1 5.1 4.8 625 484 380 43 464-15-2 4.9 579 464 380 4A4-15-3 3.9 4.7 618 468 3804-15-4 4.6 4.4 49 629 469
-~---
6404-25-1 5.7 5.3 5.8 605 491 6404-25-2 6A 6.2 6.8 630 474 6404-25-3 8.3 7.5 8A 646 455 6404-25-4 8.7 7.6 8.7 612 445
-~~~~- ~.~_ ..

- -----
--
--
------
83').01-09-025
Table 5: I{csults llfanalysis of paint films Ull !\IUlllilllllll substrate
- ---'-- ---------_.. -~ -- -'-- ---_...•
-00 -Hand-heidTWet Film WDXRF --~-
lepOESSample Thickness XRF Pb La Pb MaPb LI3Name 2
IJg /cm2IJg/cm 2 mg/kg\-Ig/cm mgtkgIJm 250 -3-10-1 0.5 0.7 104 123 2503-10-2 0.7 0.7- 121 129 250 0.93-10-3 - 0.8 106 113 250 - 0.73-10-4 07 111 156 380 -3-15-1 1.0 1.1 112 137 3803-15-2 1.2 1.3 108 133-3803-15-3 1.1 1.3 125 122-3803-15-4 08- 0.7 123 123 640 -3-25-1 04 0.5 138 121 I
640 - 2.5 584I 3-25-2 27 124 6403-25-3 09 10 315- 115 6403-25-4 11 12- 193 115 250 3.5 3.62.64-10-1 639 490 250 24 2.84-10-2 3.0 630 499 250 3.3 374-10-3 3.9 630 493 2504-10-4 2.6 3.2 3.5 664 459 380 3.94-15-1 59 6.1 872 381 380 43 494-15-2 52 860 487~ 380 42 4.84-15-3 50 753 601 i 380 514-15-4 56 5.8 733 469f-------- 6404-25-1 6.8 6.9
--
7.5 613 524 640 4.14-25-2 64 4.3 607 502 6404-25-3 7.0 6.4 7.0 632 469 6404-25-4__:""'- 7.3 7.5 84 604 452L..-.....:.....
!-~,------------ --_..,-- .,._ ---_._--- -----_._._- -- -_._-----_._
Page /9 of 30

S3CJ,O 1-0()-025
Tabk 6: Repeatability for measurements made on paint standards lIsing PW2404 WDXRF and ThcrmoNiton XLT handheld XRF
Page 20 01'30

i\39.01-09-025
Table 7: Paint Ii I111 thickness meaStirelllents on diflerenl "tlbstrates
)Average Standard I~ Wet paint Ithickness after deviation of
thickness (11m)I thickness (11m)
Plastic
drying (11m)
104640 30 250 35 10
Aluminum 380 58 15 640 103 29
I250 I 49
-t-10
Steel 380 54 12 640 89 53
------~~-~~
I>agc 21 0/' 30

839,01-09-025
r:igure 1: Calibration curves using Pb lAX line 1(.11' three dirferent substrates ror a) ali standards used and b) the concentration region or interest a)
350
.PMMA 300 Aluminum
Steel
250 ,/ ,/
,/
~ ,/
'~ 200 <lI-..!:
,/ ,/
,/ ,/
j .I:I ll.
150
100
50
0 0
/ ,:)1
/
/ /
./ /
1000
,'/ ,/
,/
2000 3000 4000 5000 6000
Pb Concentration (jJg/cm 2 )
b)
100 +PMMA
90 Aluminum
80 Steel
70
~ IIIc: <lI-E t:l
...J
.I:I ll.
60
50
40 • 30
20
10
0 0 100 200 300 400 500 600 700 800 900 1000
Pb Concentration (jJg/cm 2 )

X39.0 1-09-025
[<"igurc 2: Calibration curves using Pb q.l line for three uilTcrcnt substrates for a) all s[Clnuards lIsed Clnd b) the ennecntration region of interest a)
300
250
.PMMA Aluminum
Steel
-Z' 'iii c: $ E C!2. -I .c 11.
200
150
100
50
1000 2000 3000 4000
Pb Concentration (lJg/cm 2 )
5000 6000
b)
70
60
.PMMA Aluminum
Steel
50
Z' .~ 40 CIl +J
E
S- 30 I .c 11.
•
20
10 i
0 0 100 200 300 400 500 600 700
Pb Concentration (lJg/cm 2 )
800 900 1000
I'age 23 01" 30
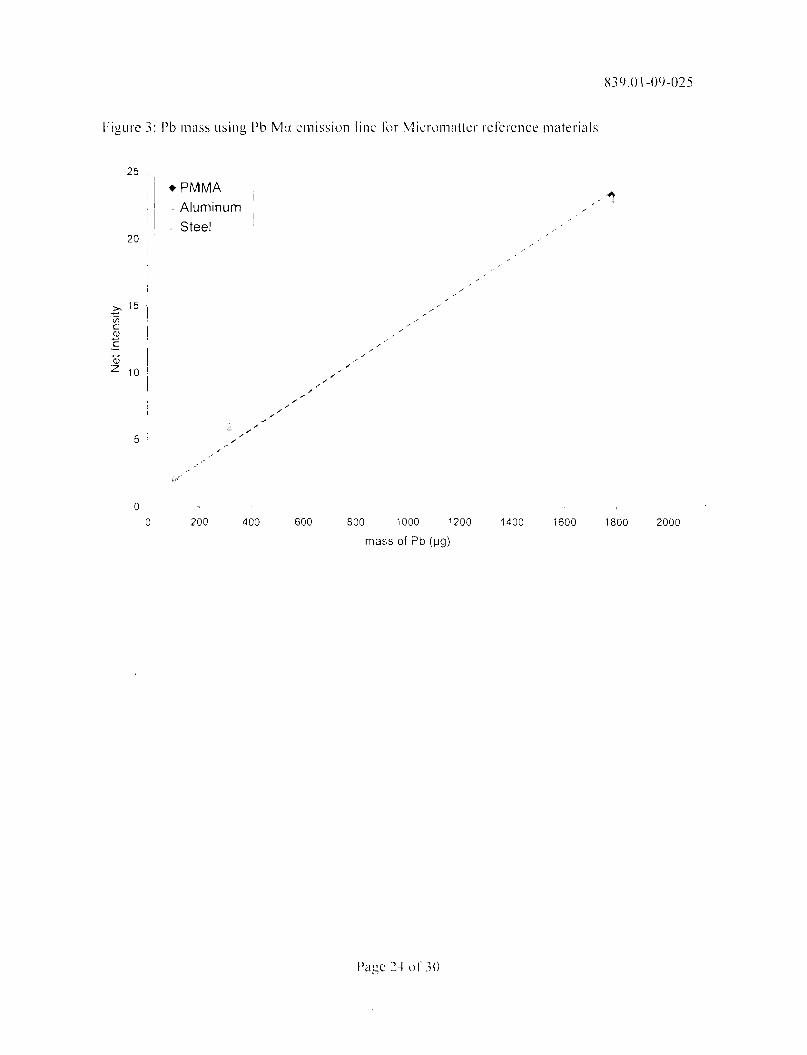
R39.0 1-0<)-025
I'igure 3: Pb 11l,1SS lIsing Pb M(l cmission linc ror Micromilllcr rcfcrcncl' materials
.q 15 I/l c (1)
C Q) Z 10
" " "
5 " " "
o o 200 400 600 800 1000 1200
mass of Pb (~g)
1400 1600 1800 2000
Page ~~ 01']0
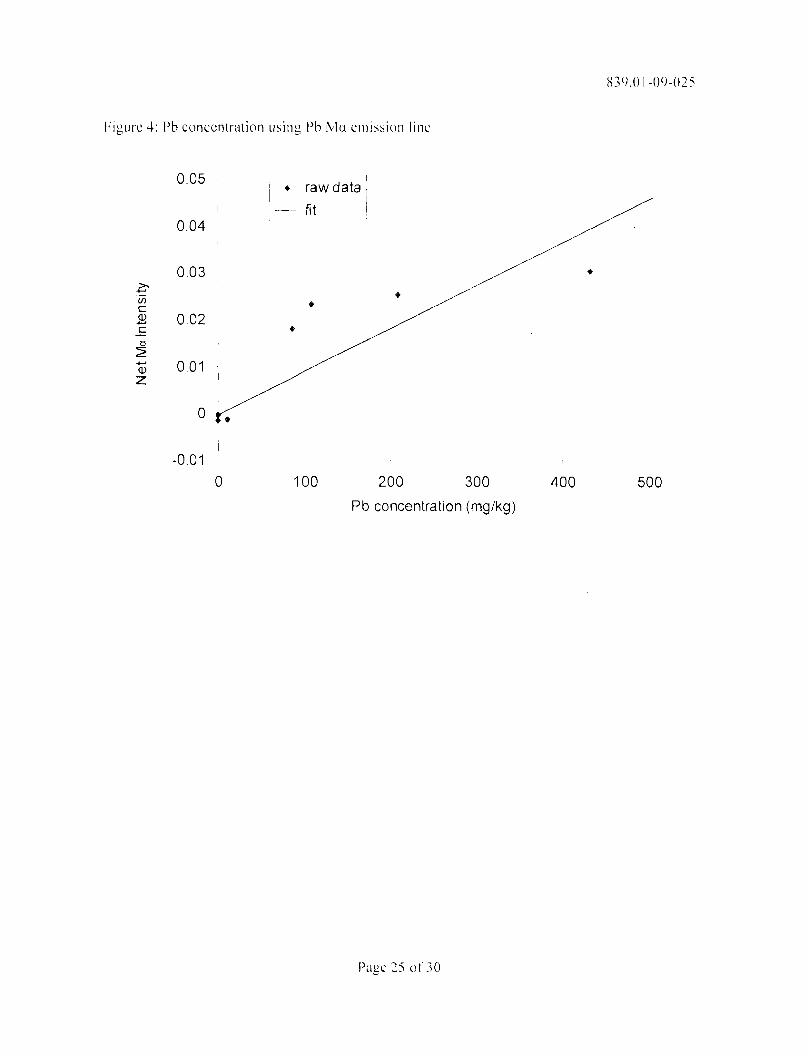
X3 l ).O 1-()()-025
Figurc 4: Pb conccntration using Ph Mo. cmission linc
0.05 I • raw data
--- fit 0.04
C 0.03 //
/ . (/) • c • 2 0.02 c • 0
2 +-' <L> 0.01 z
0 • I
I
I-0.01
0 100 200 300 400 500
Pb concentration (mg/kg)
Page 25 or 30
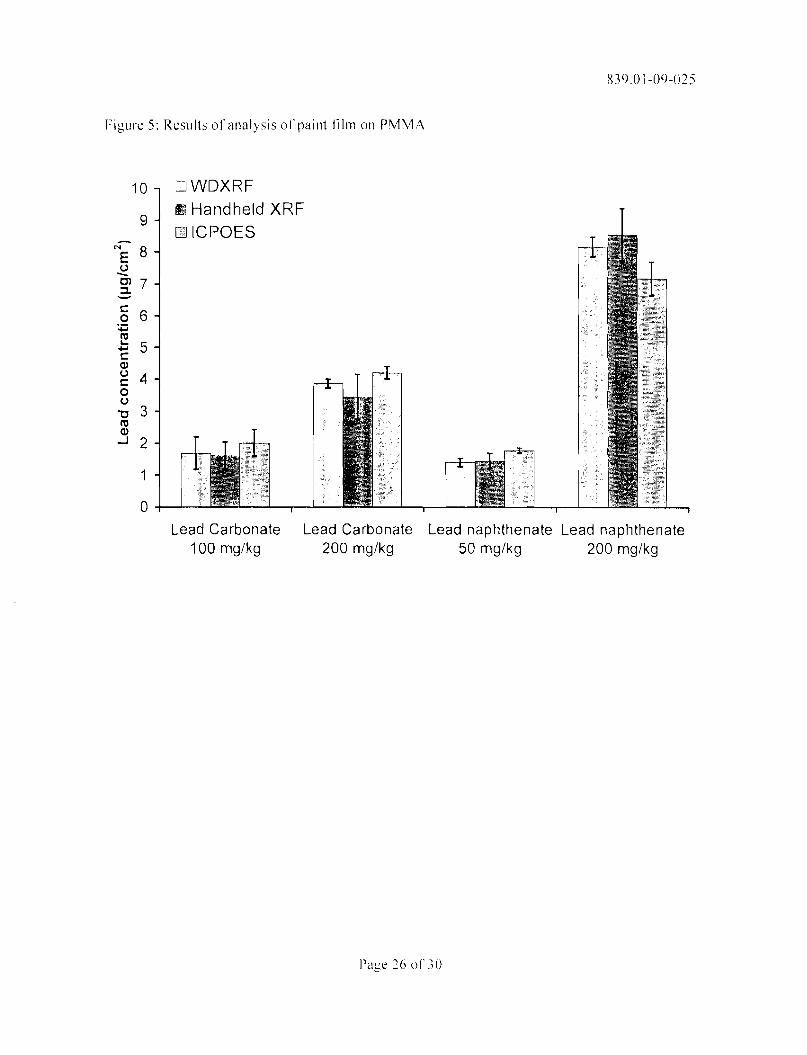
R39.0] -09-025
Figure 5: Results oCanalysis ol'paint lilm on PMMA
10
9
N E
8 0-C'l:::I.
7
C 0 6 :;; lU L...... c 5 Q) 0 c 4 0 0 "0 3 lU Q) -J 2
1
0
DWDXRF
I'll Handheld XRF
ICPOES
Lead Carbonate Lead naphthenate Lead naphthenate 200 mg/kg 50 mg/kg 200 mg/kg
Lead Carbonate 100 mg/kg
Page 26 or 30

~n9,O 1-09-025
F'igurc 6: Results of analysis orpaint film on Steel for a) 50 mg/kg spiked into wet paint and b) 200 mg/kg spiked into \Vet paint a)
b)
20
18
<~ 16E u en 14 ::J..
c 120 .~
10 C <1J u 8 c 0 u 6
""0 ro <1J 4-l
2
0
[J WDXRF
t1 Handheld XRF
[] ICPOES
~I~
I 250 ~m 380 ~m 640 ~m
Wet paint thickness

H39.0 1-09-025
I·'igllrc 7: Results of' analysis 01' paint lilm on A11IIllinlllll 1'01' a) 50 Illg/kg spiked into wet paint and b) 200 Illg/kg spiked into \'vct painl a)
10
9 N 8E u 0, 72; c 60
~ '-- 5C u(])
4 c 0 u 3 "0 ro (]) 2
....J
1
0 I
b)
20
18
N 16E u 0, 14 2; c 120
~ '-- 10 C (]) u 8 c: 0 u 6 "0 ro (]) 4
....J
2
0
DWOXRF ~ Handheld XRF
D ICPOES
250 f-lm 380 f-lm 640 f-lm Wet paint thickness
[]WOXRF
~.~ Handheld XRF LJ ICPOES
250 IJm 380 IJm 640 IJm Wet paint thickness
I)age 28 01' 30

--
700
839.01-09-025
Figure 8: Results of an illysis al'paint lilm on PI\1MA using Pb M X rays
oWDXRF 600 ICPOES
O'l
~500O'l E
§ 400 i '.;:J ('\j "
+oJ
iii 300 u c o u 200 .n Q..
100
o Lead Carbonate Lead Carbonate Lead naphthenate Lead naphthenate
100 mg/kg 200 mg/kg 50 mg/kg 200 mg/kg
Page ~9 or 30
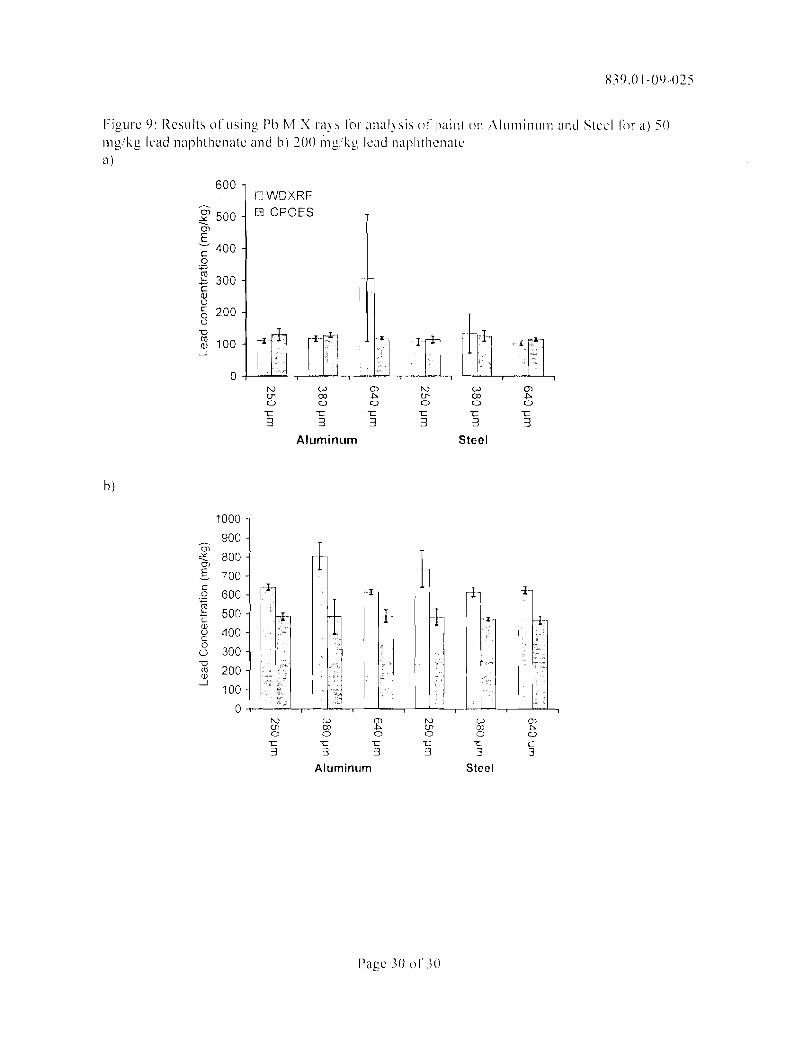
X39.0 1-09-025
Figure 9: Results ol'lIsing Pb I'll X I'ay:> 1'01' analysis uj'paint on /\llIlllinulll and Steel Illl' iI) 50 Illg/kg lead naphthenate and b) 200 lilg/kg lead naphthcnalc a)
b)
1000
900 0)
oX '"'- 800 0,
E- 700 c a 600 ~ '- 500c (j)
400u c a U 300 u (\) (j) 200 -l
100
0 N U1 0 't:
3
I il II
I I
W m 0 't:
3
Aluminum
(J) N W (J) ~ U1 m ~ 0 0 0 0 't: 't: 't: -c 3 3 3 3
Steel
Page 30 or 30