Embed Size (px)
Citation preview

Study on the Applicability of X-ray Fluorescence Spectrometry for Use in ASTM F963 Total Element Screening
April 2015
David Cobb U. S. Consumer Product Safety Commission Directorate for Laboratory Sciences Division of Chemistry 5 Research Place Rockville, MD 20850
This report was prepared by the CPSC staff, has not been reviewed or approved by, and may not necessarily reflect the views of, the Commission.

2
1.0 SUMMARY
The U.S Consumer Product Safety Commission (“CPSC”) requires manufacturers and importers of children’s products to certify that their products meet the requirements of ASTM F963-111, per the statutes of the Consumer Product Safety Improvement Act of 2008 (http://www.cpsc.gov/PageFiles/129663/cpsia.pdf).This standard limits the migration of heavy metals in the substrate materials of toys and toy parts. The heavy metals limited under this standard include antimony (“Sb”), arsenic (“As”), barium (“Ba”), cadmium (“Cd”), chromium (“Cr”), mercury (“Hg”) and selenium (“Se”). The ASTM F963-11 standard test method for determining the soluble element content involves a 2-hour extraction in 0.07M hydrochloric acid and analysis of the extract solution by atomic spectroscopy. The standard also allows for total element content screening in which the test material is digested and analyzed by atomic spectroscopy, and if the total content of each of the elements is below the soluble limits prescribed, the material is considered to be in conformance with the standard, and no further testing is required. The test procedure for determining total element screening is less time-consuming than the test procedure for the soluble element content, and could likely be done for a lower cost. This report describes how X-ray fluorescence (“XRF”) spectrometry potentially could be used for the total element content screening to test homogeneous plastic materials found in children’s toys to determine compliance with the ASTM F963-11 standard.
CPSC evaluations of existing XRF spectrometry technologies demonstrate the potential, with certain limitations, to measure accurately Sb, As, Ba, Cd, Cr, Hg, and Se content in homogeneous plastic materials found in children’s toys at the concentrations necessary to certify compliance with ASTM F963-11. A consensus standard test method for determining lead in homogeneous materials by energy dispersive XRF and appropriate reference materials containing lead in a variety of material types are already available. With the appropriate test methods and reference materials, XRF spectrometry is suitable, in many cases, for the determination of other elements in homogeneous materials.
A standard test method, ASTM F2853-10e12, for determining lead in homogeneous materials by energy dispersive XRF using multiple monochromatic beams, was developed by the ASTM International Committee F40 on Declarable Substances. Energy dispersive XRF using multiple monochromatic beams is more commonly referred to as high definition XRF or (“HDXRF”).The standard and the interlaboratory research report3 have been published and are available on the ASTM website, at: http://www.astm.org/Standards/F2853.htm. During 2014 and 2015, CPSC staff conducted additional testing of plastic samples and reference materials using HDXRF instrumentation, meeting the requirements of ASTM F2853-10e1, and using a portable handheld XRF analyzer (“HHXRF”) to measure total element content of Sb, As, Ba, Cd, Cr, Hg, and Se. The results from using both XRF methods are detailed in this report and compared to other
1 ASTM F963-11 Standard Consumer Safety Specification for Toy Safety. 2 ASTM F2853-10e1, Standard Test Method for Determination of Lead in Paint Layers and Similar Coatings or in Substrates and Homogeneous Materials by Energy Dispersive X-Ray Fluorescence Spectrometry Using Multiple Monochromatic Excitation Beams. 3 ASTM Research Report F40-1001 Interlaboratory Study to Establish Precision Statements for ASTM F2853-10, July 1, 2010.

3
analytical techniques, such as Inductively-Coupled Plasma Optical Emission Spectrometry (“ICP”). This study was limited to evaluating the use of XRF techniques for determining the total element content of Sb, As, Ba, Cd, Cr, Hg, and Se in plastic materials. This study determined that a specific type of XRF instrument, HD Prime, manufactured by X-ray Optical Systems Inc., a bench top energy dispersive XRF that uses multiple monochromatic excitation beams, is an HDXRF device that could accurately determine total element content in a variety of tested polymeric materials, including polyolefins and polyvinyl chloride. Other types of XRF instruments, such as the HHXRF, may be suitable for the total element content screening; but standard test methods and standard reference materials would need to be developed to validate that a particular HHXRF instrument is suitable for testing Sb, As, Ba, Cd, Cr, Hg, and Se in polymeric materials in the range of interest, with detection limits below the maximum soluble element limits listed in Table 1 of the ASTM F963-11.CPSC staff will provide this report to the ASTM F15 committee, along with specific recommendations to modify the F963 standard to allow for HDXRF use to make determinations of the elemental content of Sb, As, Ba, Cd, Cr, Hg, and Se in plastic materials.
2.0 SCOPE AND APPLICABILITY
2.1 Total Element Screening Analysis by Atomic Spectrometry
The current test method as outlined in 8.3.1 of ASTM F963-11 for determining total element content screening involves dissolving the toy material in aqua regia (three parts concentrated hydrochloric acid to one part concentrated nitric acid), and analyzing the diluted acid solution by spectroscopic means, such as ICP, inductively coupled plasma mass spectrometry (“ICP-MS”), flame atomic absorption spectrometry (“FLAA”) or graphite furnace atomic absorption spectrometry (“GFAA”). These analytical techniques are capable of yielding precise and accurate results and have low enough detection limits to measure each element in the substrate to the limits prescribed in Table 1 of section 4 of ASTM F963-11. The method is time-consuming, typically requiring several hours to prepare and analyze samples and standards. The procedure is also sample destructive, requires the use of corrosive and poisonous acids, and generates hazardous waste containing those acids.
2.2 Potential Advantages of Using XRF for Homogeneous Substrate Analysis:
The main advantages of using XRF over the current digestion/ICP method for screening for total element content would be:
1. XRF analysis is often non-destructive for homogeneous materials. 2. Little to no sample preparation is required, which greatly reduces the analysis time
and cost. Sample measurement times for XRF analysis are typically less than 5 minutes per measurement, versus several hours to cut, weigh, digest, and analyze using the current test method. The faster analysis times obtained using XRF would be expected to result in lower test costs.

4
3. XRF does not involve use of hazardous acids, so the costs of hazardous material disposal that are associated with current wet chemical methods are eliminated.
4. Some XRF analyzers are portable, allowing for field-screening of products.
2.3 Limitations of XRF Analysis:
Analysis of plastic toy part substrate materials for Sb, As, Ba, Cd, Cr, Hg, and Se that may be found in children’s products by XRF have the following limitations:
1. Heterogeneous materials, such as painted plastic or layered material, may require some type of sample preparation to produce a homogeneous substrate specimen for quantitative XRF analysis.
2. XRF instruments generate x-ray radiation. This requires specialized training and safety precautions for the use of XRF, to maintain radiation safety during XRF use.
3. Spectral and matrix interferences must be taken into account during analysis. Spectral interferences result from spectral overlaps among the X-ray lines that are unresolved due to limited resolution of the detector. Some well-known overlaps include: As Kα peak directly overlapping lead (Pb) Lα peak, the sum peak of iron (Fe) Kα overlapping Pb Lβ peak, Se Kβ peak overlapping Pb Lβ peak. The XRF manufacturers’ software may provide tools or de-convolution algorithms to compensate for these spectral interferences, but the precision of the analysis may be affected.
4. Plastic materials have a low x-ray absorption, which can lead to a requirement that specimens have a thickness of several millimeters to achieve infinite thickness to obtain accurate quantitative results. Many manufacturers of XRF spectrometers use algorithms that can correct for variations in the thickness of the specimen by means such as measuring x-ray scatter.
3.0 SUMMARY OF METHODS
3.1 XRF Instruments
The XRF instruments used in this study are property that CPSC currently owns. There are many types of XRF analyzers that come from different manufacturers, and CPSC does not endorse the instruments used in this study or any other. The purpose of this study was not to evaluate every XRF analyzer on the market, but to determine if it is feasible to use XRF to measure for the total element screening that is an option in the ASTM F963-11 standard. A description of the XRF instruments used in this study follows:
a. HD Prime, an HDXRF manufactured by X-ray Optical Systems Inc. Bench top energy dispersive XRF that uses multiple monochromatic excitation beams. The analyzer meets the requirements of ASTM F2853-10e1. The software allows the user to select the type of material analyzed, but measurement times and calibration are set by the manufacturer. The manufacturer provides reference materials to allow the user to verify calibration, but the user cannot make any changes to calibration parameters.

5
b. Thermo NITON XL3t 700, manufactured by Thermo Fisher Scientific. An HHXRF with a silicon drift detector. The software allows the user to select a few operating parameters, such as type of material analyzed, filter settings, and measurement time. There is also a system check option in the software that allows the user to perform a calibration of the detector’s energy (“keV”) scale. The manufacturer provides reference materials to allow the user to verify calibration, but the user cannot make changes to parameters in the empirical calibration provided by the manufacturer. The operating parameters selected for this study were:
1. Measurement time – 300 seconds
2. Filter – 60 seconds on main filter and 40 seconds on light filter.
3. Sample type – Consumer Goods/Test All
3.2 ICP Calibration and Analysis
ICP calibration standards were prepared at 0.00, 0.10, 0.25, 0.50, 1.00, 5.00, and 10.0 parts per million (“ppm”) by dilution of a 1000 µg/ml stock standards of As, Sb, Ba, Cd, Cr, Hg, and Se. A quality control standard at 0.50 µg/ml was prepared by the dilution of a 100 µg/ml multi-element standard SPEX CertiPrep, Metuchen NJ; Cat# QC-21. An internal standard of 2 µg/ml yttrium in 2% nitric acid was prepared using a 1000 µg/ml standard SPEX CertiPrep, Metuchen NJ; Cat# PLY-2Y.Standards, blanks, and samples were analyzed using the following conditions: a plasma flow 15.0L/min; nebulizer flow 0.75 L/min; pump speed 20 rpm; auxiliary flow 1.5 L/min; yttrium wavelength 324.228nm; power 1.30kW; and 4 replicates. The calibration curves had correlation coefficients greater than 0.999 with less than 10 percent error for the quality control standard.
3.3 Materials Tested
The materials evaluated in this study included plastic reference materials, plastic parts from consumer products, and a polyvinyl chloride material that was formulated by CPSC staff. The materials evaluated in this study were selected based on the known presence of one or more of the elements listed in ASTM F963-11 with limited soluble migrated element content. A description of materials is provided in Table 1.Table 2 provides the chemical identification of the material as determined by Fourier transform infrared spectrometry (“FTIR”) and information on other non-ASTM F40 elements present, as determined by HDXRF.

6
Table 1. Sample and Reference Material Descriptions
Sample Identification
Description
680k *Certified Reference Material ERM®-EC680k
681k *Certified Reference Material ERM®-EC681k
GBW084044 Research material from the National Institute of Metrology, China
GBW08405 Research material from the National Institute of Metrology, China
EN-71-3 Multi-element reference material plastic disk, lot 50, provided by Thermo Fisher Scientific in
XRF carry case, Niton PN 180-619
RC1 Black plastic from remote control of toy RC car 4106R Red plastic children’s chair
4961GB Green plastic toy boat 4960M Green plastic mortar gun from toy soldier set 4960BP Green plastic toy soldier backpack 2946W Black plastic wheel from toy car 6592BP Black plastic from toy kaleidoscope 4643C Black plastic clip from children’s backpack 2946T Black plastic from toy truck 2949W Black plastic wheel on toy motorcycle 2949H Black plastic handlebar on toy motorcycle
3171PB Children’s Pink belt 3588TS Pink plastic toe strap on children’s sandal 3588HS Pink plastic heel strap on children’s sandal 3587TS Blue plastic toe strap on children’s sandal 3587HS Blue plastic heel strap on children’s sandal 3590B Brown plastic sole on children’s sole
3590TS Purple plastic toe strap on children’s sandal 3590HS Purple plastic heel strap on children’s sandal
PVC-L **Polyvinyl chloride (“PVC”) material containing total elemental concentrations of As, Sb,
Cd, Cr, near 100 ppm and Ba and Se near the maximum soluble limit defined in ASTM F963-11.
PVC-H **PVC material containing total elemental concentrations of As, Sb, Ba, Cd, Cr, Se 3-5 times
higher than PVC-L. PVC-.005-N2 NIST research material, PVC containing 50 ppm nominal concentration of Cd and Pb PVC-0.01-N2 NIST research material, PVC containing 100 ppm nominal concentration of Cd and Pb PVC-0.05-N2 NIST research material, PVC containing 500 ppm nominal concentration of Cd and Pb PVC-0.1-N2 NIST research material, PVC containing 1000 ppm nominal concentration of Cd and Pb
*European Reference Material, polyethylene granules
** Material was formulated at facilities of the North Carolina Polymer Center of Excellence with CPSC staff on site adding the heavy metal elements to the PVC blend
4 Certification of Reference Materials for Cr, Cr, Hg, and Pb in polypropylene by Liuxing Feng, Liandi Ma, Jun Wang, Hai Lu reported in Anal Bioanal Chem (2010) 396:3051–3057

7
Table 2. Plastic Type, Pb and Non-ASTM F963 Elements by HDXRF
Sample Identification
Plastic Type Significant elements besides As, Sb, Ba, Cd, Cr, Hg, and Se detected by HDXRF or noted in Certificate of Analysis
Pb ppm
Br ppm
Fe ppm
Ca ppm Si ppm
Sn ppm
Ti ppm
Zn ppm
680k Polyethylene 14 96 15 137
681k Polyethylene 98 770 86 1250
GBW08404 Polypropylene 96
GBW08405 Polypropylene 913
EN-71-3 Polyethylene 156
RC1 Polystyrene/butadiene 367 242 4386 3478
4106R Polypropylene/ethylene 224 8821
4961GB Polypropylene/ethylene 389 133747 42299 3806 964
4960M Polypropylene/ethylene 122 137 1918 129968 31251 5683 326
4960BP Polypropylene/ethylene 128 2651 117506 30268 4556 253
2946W Polypropylene/ethylene 225 211 5358 112317 40382 3743 681
6592BP Polypropylene/ethylene 341 847 40816 1996 348
4643C Polypropylene/ethylene 106 2945 115984 41195 3649 1121
2946T Polypropylene/ethylene 163 2712 88181 32185 151 4531 390
2949W Polypropylene/ethylene 157 3551 125684 36932 2786 380
2949H Polypropylene/ethylene
3171PB PVC 368 174 81314 17874 564
3588TS PVC 499 2588 1041
3588HS PVC 485 2441 815
3587TS PVC 577
3587HS PVC 237 564
3590B PVC 1814 421 6254 77661 161 2214 218
3590TS PVC 640
3590HS PVC 527 2285 601
PVC-L PVC 886
PVC-H PVC 929
PVC-.005-N2 PVC 56
PVC-0.01-N2 PVC 123 90
PVC-0.05-N2 PVC 524 527
PVC-0.1-N2 PVC 950 1031

8
4.0 RESULTS AND DISCUSSION
The ASTM F963-11 total element screening limits for elements other than Pb are listed in Table 3.If a toy material has total element content for the seven elements below the limit, the material is considered to be in conformance with the standard and no further testing is required. Tables 4-6 show the mean HDXRF, HHXRF, and ICP results for all the materials from Table 1, with results highlighted in bold for materials that exceed the total element screening limits. The HDXRF compared favorably to ICP in determining all instances in which an element was present in a material higher than the screening limits outlined in Table 3. Detailed comparisons of results for each element are provided in sections 4.1 to 4.7.
Table 3. Total Element Screening Limits in PPM (mg/kg) for Substrates Other Than Modeling Clay Included as Part of a Toy
Antimony (Sb)
Arsenic (As)
Barium (Ba)
Cadmium (Cd)
Chromium (Cr)
Mercury (Hg)
Selenium (Se)
60 25 1000 75 60 60 500

9
Table 4. Summary of Mean HDXRF Results
Sample ID Sb
(mg/kg) As
(mg/kg) Ba (mg/kg) Cd
(mg/kg) Cr
(mg/kg) Hg
(mg/kg) Se
(mg/kg)
2946T 35.9 7 13042 1.8 ND ND ND
2946W 62.7 22.8 8044 5.5 80.3 ND ND
2949H 32.6 18.5 22370 7 ND ND ND
2949W 38.4 18.9 19368 6.8 ND ND ND
3171PB 15.1 ND 591 255 ND ND ND
3587HS 10 ND 1667 366 ND ND ND
3587TS 11 ND 1856 444 ND ND ND
3588HS 10.4 6.5 392 205 ND ND ND
3588TS 11.3 ND 348 207 ND ND ND
3590B 1385 ND 338 93.6 61.5 ND ND
3590HS 10.8 17.8 70 151 ND ND ND
3590TS 10.1 ND 1249 384 ND ND ND
4106R ND ND 31 567 ND ND 79.3
4643C 70 18.3 1605 5.3 ND ND ND
4960BP 16.4 11.2 14956 ND ND ND ND
4960M 49 26.3 13683 3.9 ND ND ND
4961GB 15.3 25.7 49910 75.7 ND ND ND
680k 11.5 4.2 4 20.3 18.4 4.8 ND
681k 106 26.2 74.2 130 91.9 33.1 1.1
6952BP 132 3.9 1152 ND 4.4 ND ND
EN-71-3 93.7 47.3 786 259 96.3 111 178
GBW08404 ND ND 230 87.4 92.2 108 ND
GBW08405 ND ND 2189 8.5 884 1076 ND
PVC-H 517 385 5958 270 438 NI 3412
PVC-L 125 94.4 1677 99.4 74.5 NI 753
RC1 187 ND ND 6 59.3 ND ND
PVC-.005-N2 NT NT NT 58.2 NT NT NT
PVC-0.01N2 NT NT NT 124 NT NT NT
PVC-0.05N2 NT NT NT 519 NT NT NT
PVC-0.01N2 NT NT NT 1005 NT NT NT
NT = Not Tested
ND= Not Detected
NI=Hg results for PVC-H and PVC-L not included due to volatility of Hg, which resulted in Hg not being homogeneously dispersed in the materials

10
Table 5. Summary of Mean HHXRF Results
Sample ID Sb
(mg/kg) As
(mg/kg) Ba (mg/kg) Cd
(mg/kg) Cr
(mg/kg) Hg
(mg/kg) Se
(mg/kg)
2946T 31.8 1.8 10986 10.8 ND ND ND
2946W 95.9 ND 9206 ND ND ND ND
2949H 20.4 ND 15842 ND ND ND ND
2949W 19.9 ND 16090 ND ND ND ND
3171PB ND ND 712 113 ND ND ND
3587HS ND ND 628 178 ND ND ND
3587TS ND ND 692 228 ND ND ND
3588HS ND ND 149 96.1 ND ND ND
3588TS ND ND 169 101 ND ND ND
3590B 998 ND 544 52.8 7.1 ND ND
3590HS ND ND 58 43.7 ND ND ND
3590TS ND ND 506 182 ND ND ND
4106R ND 1.9 122 525 ND ND ND
4643C 73.7 7.2 2780 3.5 ND ND ND
4960BP 4.6 7.2 12034 ND ND ND ND
4960M 44.6 10.4 24455 ND ND ND ND
4961GB 8.8 ND 27658 77 ND ND ND
680k 6.3 5.5 ND 17.1 30.7 4.9 ND
681k 87.3 35.3 90 119 128 33 ND
6952BP 126 11.9 1274 ND ND ND ND
EN-71-3 96.5 53.3 661 268 116 103 210
GBW08404 ND 5.2 201 78.9 124 116 ND
GBW08405 ND 38.1 1512 7 1020 1037 ND
PVC-H 388 532 3555 162 445 ND 5551
PVC-L 68.2 126 940 9.6 86.2 NA 1135
RC1 165 4.5 191 ND 199 NA ND
PVC-.005-N2 NT NT NT 49 NT NT NT
PVC-0.01N2 NT NT NT 120 NT NT NT
PVC-0.05N2 NT NT NT 547 NT NT NT
PVC-0.01N2 NT NT NT 1054 NT NT NT

11
Table 6. Summary of Mean ICP Results
Sample ID Sb
(mg/kg) As
(mg/kg) Ba (mg/kg) Cd
(mg/kg) Cr
(mg/kg) Hg
(mg/kg) Se
(mg/kg)
2946T 5 6.7 11314 ND NT NT ND
2946W 51.6 15.8 7165 0.6 NT NT 6.4
2949H 32 12.5 10850 ND NT NT ND
2949W 32.7 13.2 11510 ND NT NT ND
3171PB 6.4 5.4 2039 262 NT NT 7.4
3587HS ND 1.9 1218 314 NT NT ND
3587TS ND ND 1490 389 NT NT ND
3588HS 8.1 ND 231 170 NT NT ND
3588TS ND ND 242 171 NT NT ND
3590B 1428 7.2 479 72.3 NT NT 6.6
3590HS 6 2.9 48 131 NT NT 7.5
3590TS 5.1 ND 1073 327 NT NT ND
4106R ND ND 30 629 NT NT 85
4643C 68.8 20 1862 2.7 NT NT 5.5
4960BP 12.3 13.1 10213 ND NT NT 6.4
4960M 34.2 27.1 10637 ND NT NT 6.9
4961GB 1.2 21.7 10625 68.7 NT NT ND
680k 9.1 2.1 9.7 22.3 NT NT ND
681k 106 24.3 60.4 128 NT NT 1.1
6952BP 107 9.7 1691 0.6 NT NT 7.1
EN-71-3 111 46 669 282 NT NT 203
GBW08404 6.1 2.7 199 81 NT NT 6.7
GBW08405 ND ND 1893 6.7 NT NT ND
PVC-H 538 467 4922 248 NT NT 3188
PVC-L 121 107 1530 86.5 NI NI 695
RC1 145 ND 158 ND NI NI ND
PVC-.005-N2 NT NT NT 47.9 NT NT NT
PVC-0.01N2 NT NT NT 106 NT NT NT
PVC-0.05N2 NT NT NT 467 NT NT NT
PVC-0.01N2 NT NT NT 904 NT NT NT

12
4.1 Antimony (Sb)
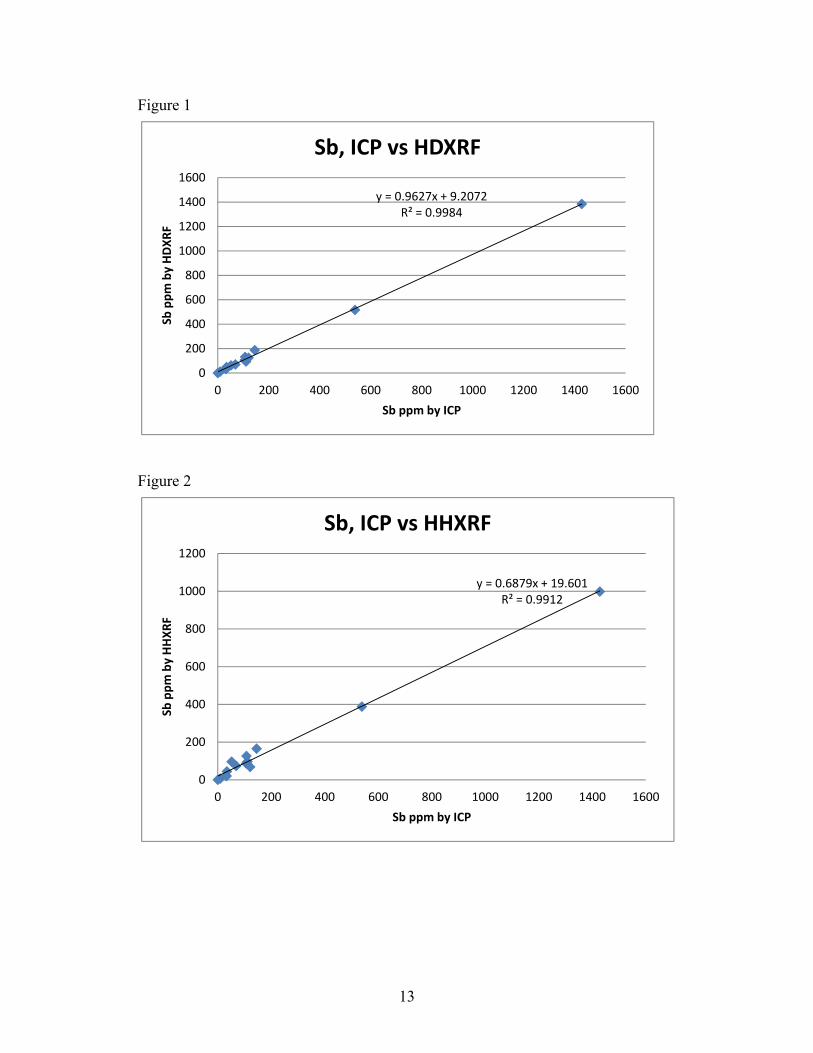
Table 7 compares results for Sb concentration obtained using the HDXRF, HHXRF, and ICP on the sample and reference materials. The certified or expected values noted on certificates are also displayed for the reference materials. The known amount of added Sb for the materials PVC-L and PVC-H are displayed in the same column. These certified or known amounts of elements added to the reference materials shall be referred to as reference amounts for convenience throughout the remainder of this report. At least four measurements were obtained on different locations on materials. The mean and standard deviations (“stdev”) are included in the tables. Measurement results below ICP detection limits or denoted as not detected (“ND”) by HHXRF or HDXRF are recorded as ND in the data tables. Figure 1 shows the correlation between the mean Sb concentration measurements obtained by ICP and HDXRF. Figure 2 shows the correlation between the mean Sb concentration measurements obtained by ICP and HHXRF. The R2 coefficients may be artificially close to 1.0 due to the two much higher concentration points. Figures 3 and 4 show the correlations with those two points dropped.
The HDXRF and HHXRF Sb measurement results generally compare favorably with the ICP Sb results obtained for the samples. The HDXRF and HHXRF Sb measurement results obtained on the sample materials with ICP Sb results >10 ppm are usually within ±30% of ICP results with the following exceptions:
a. The PVC-L sample HHXRF Sb result was approximately 40 percent lower than the ICP Sb result.
b. The 2946W sample HHXRF Sb result was approximately 90 percent higher than the ICP Sb result.
ASTM F963-11 maximum soluble limit for Sb is 60 ppm. If a material screens higher than 60 ppm total Sb, the extraction test is required. The HDXRF and HHXRF successfully identified all the samples that had Sb above 60 ppm, as determined by ICP.
13
Figure 1
Figure 2
y = 0.9627x + 9.2072R² = 0.9984
0
200
400
600
800
1000
1200
1400
1600
0 200 400 600 800 1000 1200 1400 1600
Sb ppm by HDXRF
Sb ppm by ICP
Sb, ICP vs HDXRF
y = 0.6879x + 19.601R² = 0.9912
0
200
400
600
800
1000
1200
0 200 400 600 800 1000 1200 1400 1600
Sb ppm by HHXRF
Sb ppm by ICP
Sb, ICP vs HHXRF

14
Figure 3. Materials with Sb <200 ppm
Figure 4. Materials with Sb <200 ppm
y = 1.1021x + 0.4949R² = 0.9353
0
20
40
60
80
100
120
140
160
180
200
0 20 40 60 80 100 120 140 160
Sb ppm by HDXRF
Sb ppm by ICP
Sb, ICP vs HDXRF
y = 0.6879x + 19.601R² = 0.9912
0
200
400
600
800
1000
1200
0 200 400 600 800 1000 1200 1400 1600
Sb ppm by HHXRF
Sb ppm by ICP
Sb, ICP vs HHXRF

15
Table 7. Analysis of Materials for Sb
Sample ID Replicate HDXRF Sb
mg/kg HHXRF Sb mg/kg
ICP Sb mg/kg
Certified or Added amount of
Sb mg/kg 680k 1 ND 12.5 14.1 10.1
2 16 ND 7.9 3 15.4 12.8 7.0 4 14.4 ND 7.3
mean 11.5 6.3 9.1 stdev 7.7 7.3 3.4
681k 1 106 88.0 112 99 2 105 92.0 102 3 106 84.0 106 4 107 85.0 104
mean 106 87.3 106 stdev 0.8 3.6 4.4
GBW08404 mean ND ND 6.1 GBW08405 mean ND ND ND EN-71-3 1 85.6 96.8 120 102
2 96.5 97.3 114 3 98.9 99.5 91.5 4 93.8 92.4 116
mean 93.7 96.5 111 stdev 5.8 3.0 13.0
4961GB 1 17.7 17.3 4.7 2 24.7 ND ND 3 ND ND ND 4 18.7 18.0 ND
mean 15.3 8.8 1.2 stdev 10.6 10.2 2.3 4960M 1 51.9 47.1 50.9
2 51.0 42.0 18.4 3 49.3 48.9 50.0 4 43.9 40.5 17.4
mean 49.0 44.6 34.2 stdev 3.6 4.0 18.8
4960BP 1 ND ND 11.5 2 22.8 18.5 11.8
3 21.3 ND 11.2 4 21.5 ND 14.6
mean 16.4 4.6 12.3 stdev 11.0 9.2 1.6
Note: ASTM F963-11 Sb total element screening limit is 60ppm

16
Table 7. Continued. Analysis of Materials for Sb
Sample ID Replicate HDXRF Sb
mg/kg HHXRF Sb mg/kg
ICP Sb mg/kg
Certified or Added amount of
Sb mg/kg 2946T 1 31.7 27.2 6.0
2 39.5 34.5 4.5 3 31.9 27.4 8.8 4 40.3 38.2 0.8
mean 35.9 31.8 5.0 stdev 4.7 5.5 3.3 6952BP 1 136 137 104
2 146 111 100 3 121 128 109 4 127 126 114
mean 132 126 107 stdev 10.9 10.5 6.1
4643C 1 69.1 74.9 72.6 2 76.6 53.5 66.6 3 79.8 98.4 63.8 4 54.6 67.8 72.2
mean 70.0 73.7 68.8 stdev 11.2 18.7 4.3
2946W 1 81.5 95.8 44.3 2 98.1 96.9 45.0 3 28.1 95.0 68.2 4 62.9 95.9 48.8
mean 62.7 95.9 51.6 stdev 30.0 0.8 11.3 2949W 1 44.1 ND 32.0
2 55.5 24.2 31.8 3 25.7 24.2 34.0 4 28.3 31.1 33.2
mean 38.4 19.9 32.7 stdev 14.0 13.6 1.0
2949H 1 29.7 26.5 31.8 2 38.5 29.9 33.8 3 32.7 25.0 30.4 4 29.6 ND 32.1
mean 32.6 20.4 32.0 stdev 4.2 13.7 1.4
3171PB mean 15.1 ND 6.4 3588TS mean 11.3 ND ND 3588HS mean 10.4 ND 8.1 3587TS mean 11.0 ND ND 3587HS mean 10.0 ND ND 3590HS mean 10.8 ND 6.0 3590TS mean 10.1 ND 5.1

17
Table 7 Continued. Analysis of Materials for Sb
Sample ID Replicate HDXRF Sb
mg/kg HHXRF Sb mg/kg
ICP Sb mg/kg
Certified or Added amount
of Sb mg/kg 3590B 1 1397 956.8 1428
2 1328 1044 1400 3 1372 949 1525 4 1444 1040 1359
mean 1385 998 1428 stdev 48.4 51.5 71.0
PVC-L 1 137 71 121 107 2 127 69 122 3 129 68 123 4 117 68 118 5 116 65 121
mean 125 68.2 121 stdev 8.8 2.2 2.1
PVC-H 1 524 388 548 526 2 526 384 534 3 515 388 535 4 517 392 541 5 503 389 533
mean 517 388 538 stdev 9.0 2.9 6.4
RC1 1 204 155 141 2 177 175 131 3 189 161 157 4 177 168 150
mean 187 165 145 stdev 12.8 8.8 11.3
4106R mean ND ND ND
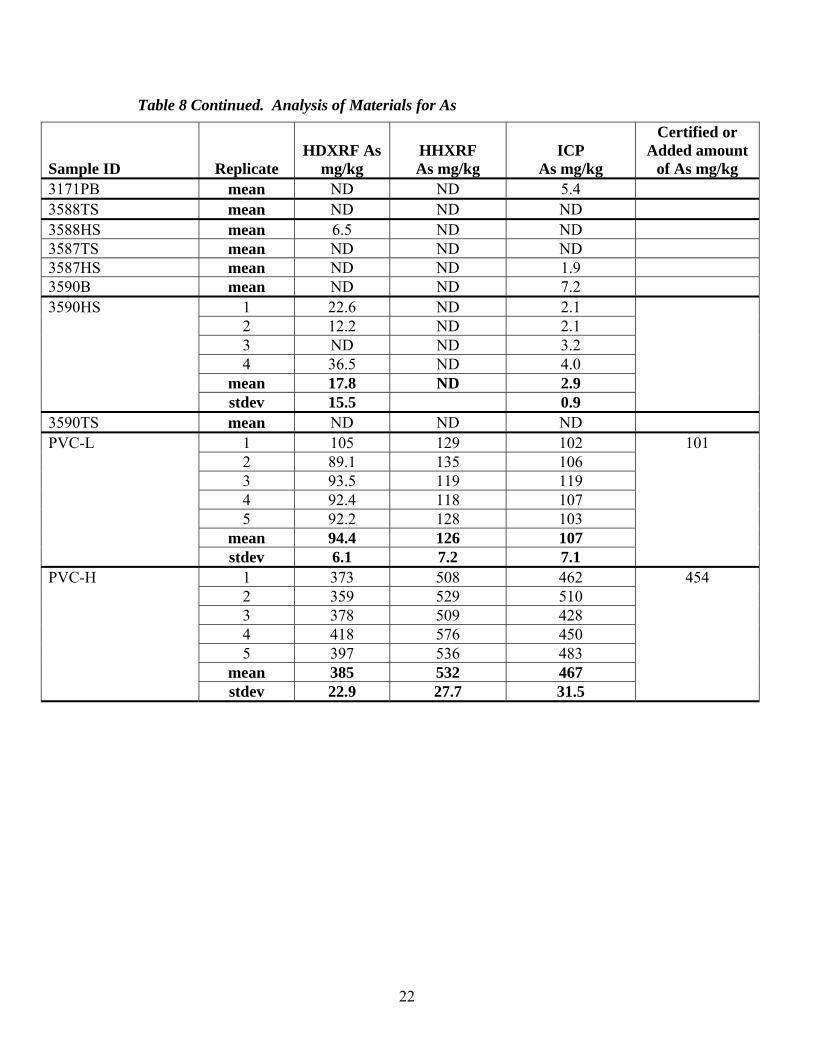
4.2 Arsenic (As)
Table 8 compares results for As concentration obtained using the HDXRF, HHXRF, and ICP on the sample and reference materials. The certified or expected values noted on certificates are also displayed. At least four measurements were obtained on different locations on materials. The mean and stdev are included in the tables. Figure 5 shows the correlation between the mean As concentration measurements obtained by ICP and HDXRF. Figure 6 shows the correlation between the mean As concentration measurements obtained by ICP and HHXRF.
The HDXRF and HHXRF As measurement results generally compare favorably with the ICP As results obtained for the samples. The HDXRF and HHXRF As measurement

18
results obtained on the sample materials with ICP As results >20 ppm are usually within ±30% of ICP results with the following exceptions: a. The 681k sample HHXRF As result was approximately 40 percent higher than the ICP As result. b. HHXRF was unable to detect As in a number of the samples with ICP As results in the 10−25 ppm range. ASTM F963-11 maximum soluble limit for As is 25 ppm. If a material screens higher than 25 ppm total As, the extraction test is required. The HDXRF successfully identified all the samples that had As above 25 ppm, as determined by ICP. The HHXRF successfully identified all the samples that had As above 25 ppm, except for 4960B sample. The mean ICP As result for 4960B was 27 ppm, just over the 25 ppm limit. The mean HHXRF result for 4960B was 10 ppm.
Figure 5
y = 0.814x + 5.6509R² = 0.9976
0
50
100
150
200
250
300
350
400
450
0 100 200 300 400 500
As ppm by HDXRF
As ppm by ICP
As, ppm ICP vs HDXRF

19
Figure 6
y = 1.1619x ‐ 8.8448R² = 0.995
‐100
0
100
200
300
400
500
600
0 50 100 150 200 250 300 350 400 450 500
As ppm by HHXRF
As ppm by ICP
As, ICP vs HHXRF

20
Table 8. Analysis of Materials for As
Sample ID Replicate HDXRF As
mg/kg HHXRF As mg/kg
ICP As mg/kg
Certified or Added amount
of As mg/kg 680k 1 3.7 6.0 4.5 4.1
2 3.9 5.0 2.3 3 4.6 5.6 1.4 4 4.6 5.4 ND
mean 4.2 5.5 2.1 stdev 0.5 0.4 1.9
681k 1 23.6 33.6 25.4 29.1 2 25.3 36.4 23.4 3 26.8 34.5 25.1 4 29.0 36.5 23.4
mean 26.2 35.3 24.3 stdev 2.3 1.4 1.1
GBW08404 mean ND 5.2 2.7 GBW08405 mean ND 38.1 ND EN-71-3 1 44.5 52.3 49.0 51
2 42.2 54.0 49.3 3 52.0 52.8 38.3 4 50.5 54.1 47.2
mean 47.3 53.3 46.0 stdev 4.7 0.9 5.2
RC1 mean ND 4.5 ND 4106R mean ND 1.9 ND 4961GB 1 28.6 ND 24.0
2 21.6 ND 20.7 3 41.4 ND 21.6 4 11.3 ND 20.7
mean 25.7 21.7 stdev 12.6 1.5
4960M 1 23.0 7.4 28.1 2 31.5 8.8 26.5 3 29.6 14.1 27.8 4 21.1 11.2 26.2
mean 26.3 10.4 27.1 stdev 5.0 2.9 0.9
4960BP 1 11.1 ND 12.4 2 10.1 9.2 12.7 3 17.6 9.8 13.4 4 6.0 9.6 13.7
mean 11.2 7.2 13.1 stdev 4.8 4.8 0.6
Note: ASTM F963-11 As total element screening limit is 25ppm

21
Table 8 Continued. Analysis of Materials for As
Sample ID Replicate HDXRF As
mg/kg HHXRF As mg/kg
ICP As mg/kg
Certified or Added amount
of As mg/kg 2946T 1 5.2 7.2 4.3
2 8.8 ND 12.5 3 7.7 ND 4.7 4 6.4 ND 5.4
mean 7.0 1.8 6.7 stdev 1.6 3.6 3.9 6952BP 1 ND 13.8 9.0
2 4.1 12.0 9.0 3 5.9 8.7 10.3 4 5.6 13.2 10.5
mean 3.9 11.9 9.7 stdev 2.7 2.3 0.8
4643C 1 17.6 ND 21.2 2 13.7 13.2 19.3 3 18.5 5.9 20.9 4 23.5 10.0 18.5
mean 18.3 7.2 20.0 stdev 4.0 5.7 1.3
2946W 1 28.7 ND 15.8 2 18.2 ND 14.8 3 20.3 ND 17.0 4 23.8 ND 15.6
mean 22.8 ND 15.8 stdev 4.6 0.9 2949W 1 10.1 ND 12.5
2 27.1 ND 12.4 3 19.3 ND 12.1 4 18.9 ND 15.9
mean 18.9 ND 13.2 stdev 6.9 1.8
2949H 1 21.5 ND 12.7 2 15.3 ND 13.0 3 9.9 ND 12.7 4 27.2 ND 11.7
mean 18.5 ND 12.5 stdev 7.5 0.6
22
Table 8 Continued. Analysis of Materials for As
Sample ID Replicate HDXRF As
mg/kg HHXRF As mg/kg
ICP As mg/kg
Certified or Added amount
of As mg/kg 3171PB mean ND ND 5.4 3588TS mean ND ND ND 3588HS mean 6.5 ND ND 3587TS mean ND ND ND 3587HS mean ND ND 1.9 3590B mean ND ND 7.2 3590HS 1 22.6 ND 2.1
2 12.2 ND 2.1 3 ND ND 3.2 4 36.5 ND 4.0
mean 17.8 ND 2.9 stdev 15.5 0.9
3590TS mean ND ND ND PVC-L 1 105 129 102 101
2 89.1 135 106 3 93.5 119 119 4 92.4 118 107 5 92.2 128 103
mean 94.4 126 107 stdev 6.1 7.2 7.1
PVC-H 1 373 508 462 454 2 359 529 510 3 378 509 428 4 418 576 450 5 397 536 483
mean 385 532 467 stdev 22.9 27.7 31.5

23
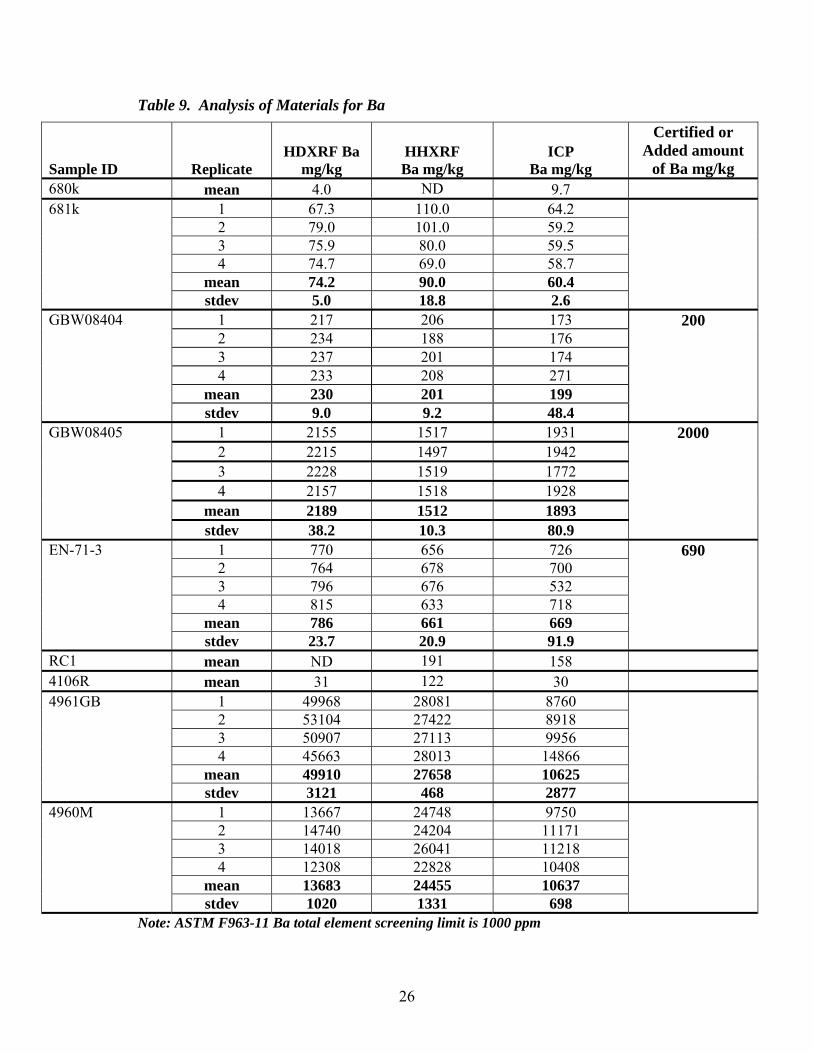
4.3 Barium (Ba)
Table 9 compares results for Ba concentration obtained using the HDXRF, HHXRF, and ICP on the sample and reference materials. The certified or expected values noted on certificates are also displayed. At least four measurements were obtained on different locations on materials. The mean and stdev are included in the tables. Figure 7 shows the correlation between the mean Ba concentration measurements obtained by ICP and HDXRF on samples with less than 10000ppm Ba by ICP. Figure 8 shows the correlation between the mean Ba concentration measurements obtained by HDXRF and the reference amounts of Ba for the reference materials. Figure 9 shows the correlation between the mean Ba concentration measurements obtained by ICP and HHXRF on samples with less than 10000ppm Ba by ICP. Figure 10 shows the correlation between the mean Ba concentration measurements obtained by HHXRF and the referenced amounts of Ba reported for the reference materials. Many of the sample materials evaluated in this study contained high levels of Ba, greater than 10,000 ppm.The higher relative standard deviations for Ba of many of the sample materials indicate some of the materials may be less homogeneous with respect to Ba. Both the HDXRF and HHXRF results had better correlations with the referenced Ba for the reference materials than the Ba ICP results for the sample materials, which may be due to lack of homogeneity of Ba in the samples and high levels of Ba detected in many of the samples. The ASTM F963-11 maximum soluble limit for Ba is 1000 ppm. If a material screens higher than 1000 ppm total Ba, the extraction test is required. The HDXRF successfully identified all the samples that had Ba above 1000 ppm, as determined by ICP, except for sample 3171PB. Based on ICP and HDXRF results, 3171PB sample material does not appear to be homogeneous with respect to Ba, which may explain some of the discrepancies between the ICP and HDXRF Ba results. The HHXRF successfully identified all the samples that had Ba above 1000 ppm, as determined by ICP, except for 3171PB, 3587TS, 3587HS, 3590TS, and PVC-L.

24
Figure 7
Figure 8
y = 1.1298x ‐ 129.64R² = 0.9463
‐1000
0
1000
2000
3000
4000
5000
6000
7000
8000
9000
0 1000 2000 3000 4000 5000 6000 7000 8000
Ba ppm by HDXRF
Ba ppm by ICP,
Ba, ICP vs HDXRF
y = 1.1478x ‐ 31.828R² = 0.9996
0
1000
2000
3000
4000
5000
6000
7000
0 1000 2000 3000 4000 5000 6000
Ba by HDXRF, ppm
Ba ppm, certified/added amt,
Ba, HDXRF vs Reference amt

25
Figure 9
Figure 10
y = 1.1379x ‐ 426.86R² = 0.8838
‐2000
0
2000
4000
6000
8000
10000
0 1000 2000 3000 4000 5000 6000 7000 8000
Ba ppm by HHXRF
Ba ppm by ICP
Ba, ICP vs HHXRF
y = 0.6652x + 98.898R² = 0.9938
0
500
1000
1500
2000
2500
3000
3500
4000
0 1000 2000 3000 4000 5000 6000
Ba by HHXRF, ppm
Ba ppm, certified/added amt
Ba, HHXRF vs Referenced amt
26
Table 9. Analysis of Materials for Ba
Sample ID Replicate HDXRF Ba
mg/kg HHXRF Ba mg/kg
ICP Ba mg/kg
Certified or Added amount
of Ba mg/kg 680k mean 4.0 ND 9.7 681k 1 67.3 110.0 64.2
2 79.0 101.0 59.2 3 75.9 80.0 59.5 4 74.7 69.0 58.7
mean 74.2 90.0 60.4 stdev 5.0 18.8 2.6
GBW08404 1 217 206 173 200 2 234 188 176 3 237 201 174 4 233 208 271
mean 230 201 199 stdev 9.0 9.2 48.4
GBW08405 1 2155 1517 1931 2000 2 2215 1497 1942 3 2228 1519 1772 4 2157 1518 1928
mean 2189 1512 1893 stdev 38.2 10.3 80.9
EN-71-3 1 770 656 726 690 2 764 678 700 3 796 676 532 4 815 633 718
mean 786 661 669 stdev 23.7 20.9 91.9
RC1 mean ND 191 158 4106R mean 31 122 30 4961GB 1 49968 28081 8760
2 53104 27422 8918 3 50907 27113 9956 4 45663 28013 14866
mean 49910 27658 10625 stdev 3121 468 2877
4960M 1 13667 24748 9750 2 14740 24204 11171 3 14018 26041 11218 4 12308 22828 10408
mean 13683 24455 10637 stdev 1020 1331 698
Note: ASTM F963-11 Ba total element screening limit is 1000 ppm

27
Table 9 Continued. Analysis of Materials for Ba
Sample ID Replicate HDXRF Ba
mg/kg HHXRF Ba mg/kg
ICP Ba mg/kg
Certified or Added amount
of Ba mg/kg 4960BP 1 14602 12429 10742
2 13492 12044 9133 3 17722 11700 10223 4 14007 11964 10756
mean 14956 12034 10213 stdev 1899 302 762
2946T 1 12894 10920 10942 2 13502 10963 10268 3 13103 11071 9940 4 12667 10989 14109
mean 13042 10986 11314 stdev 355 64 1909 6952BP 1 976 1283 1694
2 1357 1253 1737 3 1219 1317 1682 4 1056 1243 1649
mean 1152 1274 1691 stdev 170 33.1 36.7
4643C 1 1325 3321 2003 2 1704 1879 1944 3 1583 3651 1783 4 1809 2267 1719
mean 1605 2780 1862 stdev 208 842 133
2946W 1 6416 8819 6744 2 5950 9377 6842 3 9675 9445 7713 4 10133 9183 7363
mean 8044 9206 7165 stdev 2165 281 455 2949W 1 17670 36358 11836
2 21825 9176 10727 3 16458 9278 14316 4 21519 9546 9161
mean 19368 16090 11510 stdev 2709 13513 2169
3588TS mean 348 169 242 3588HS mean 392 149 231 3590B mean 338 544 479 3590HS mean 70 58 48

28
Table 9 Continued. Analysis of Materials for Ba
Sample ID Replicate HDXRF Ba
mg/kg HHXRF Ba mg/kg
ICP Ba mg/kg
Certified or Added amount of
Ba mg/kg 2949H 1 21767 10148 11262
2 23094 10029 9867 3 20210 10194 10374 4 24409 32998 11899
mean 22370 15842 10850 stdev 1799 11437 906
3171PB 1 493 710 1236 2 455 693 2132 3 704 724 2376 4 712 723 2415
mean 591 712 2039 stdev 136 14.3 550
3587TS 1 2233 673 1482 2 1570 691 1474 3 1945 707 4 1676 699 1514
mean 1856 692 1490 stdev 297 14.6 21.1
3587HS 1 1639 609 1031 2 2163 642 1315 3 1724 632 1308 4 1140 630
mean 1667 628 1218 stdev 419 13.9 162
3590TS 1 1124 501 1098 2 893 518 1110 3 1360 497 1058 4 1620 509 1026
mean 1249 506 1073 stdev 312 9.2 38.3
PVC-L 1 1741 944 1388 1498 2 1621 980 1608 3 1769 953 1535 4 1569 901 1533 5 1685 921 1588
mean 1677.0 939.8 1530 stdev 82.8 30.3 86.1
PVC-H 1 6024 3538 4792 5195 2 5919 3490 5237 3 5828 3588 4780 4 5859 3569 4907 5 6158 3591 4896
mean 5958 3555 4922 stdev 135 42.1 185
29
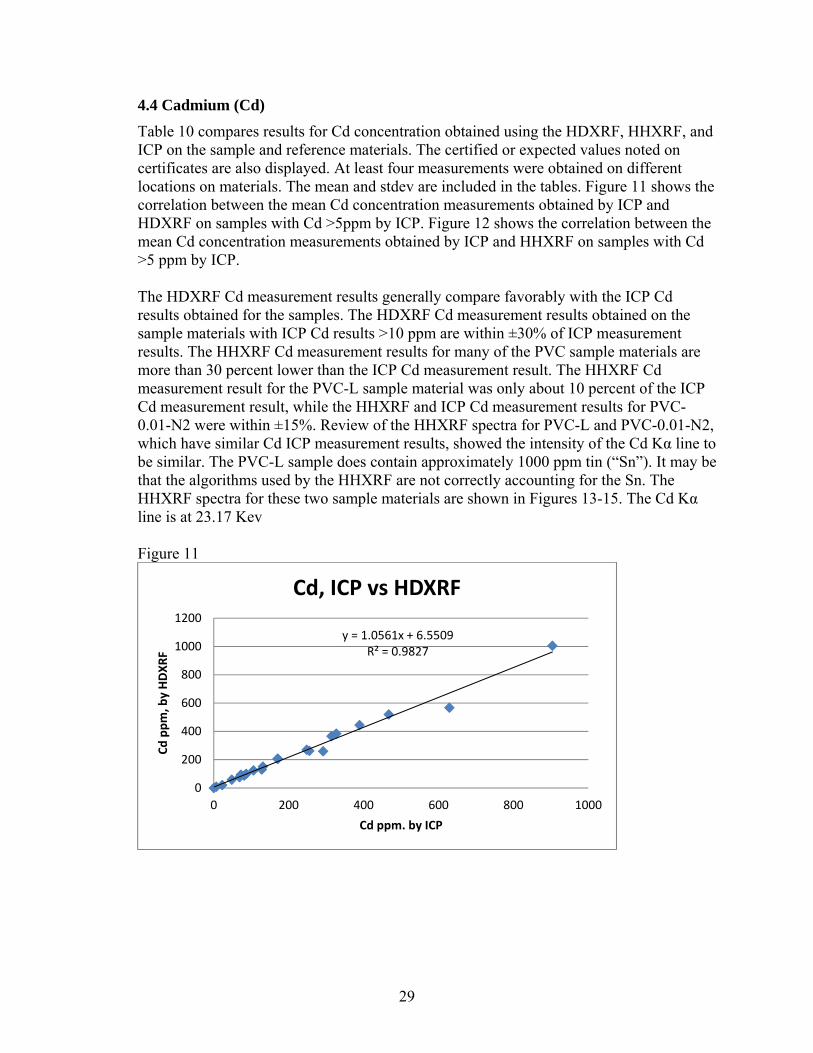
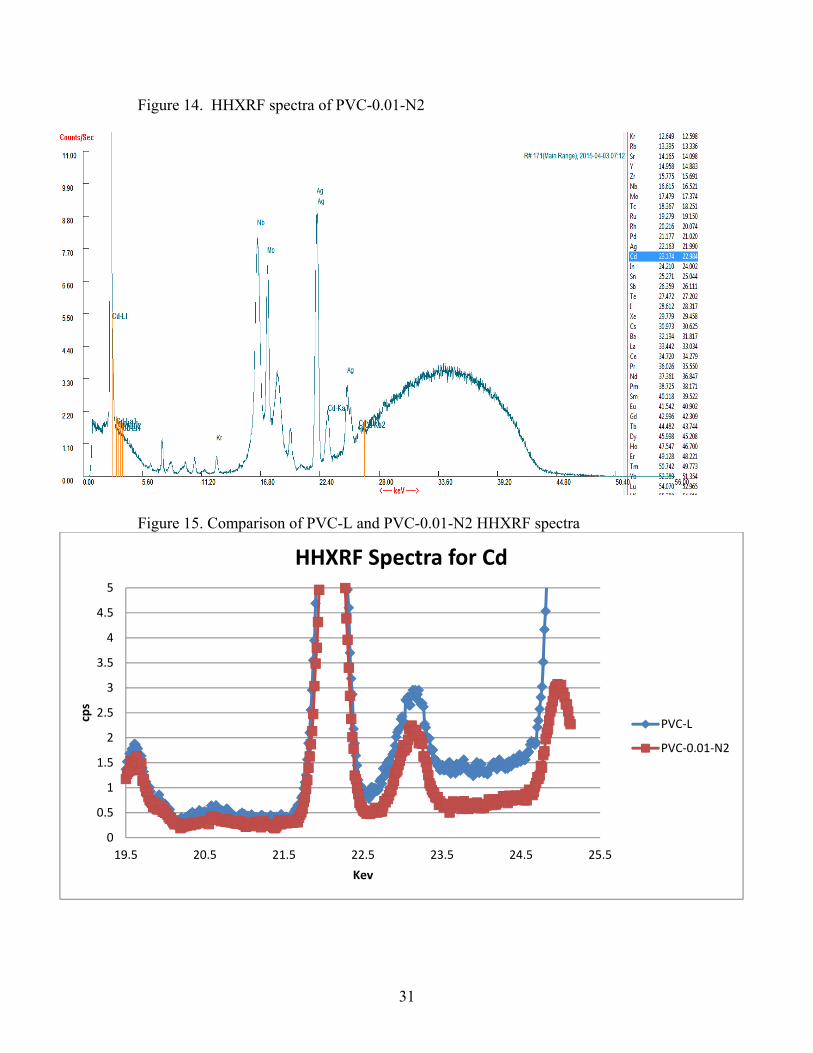
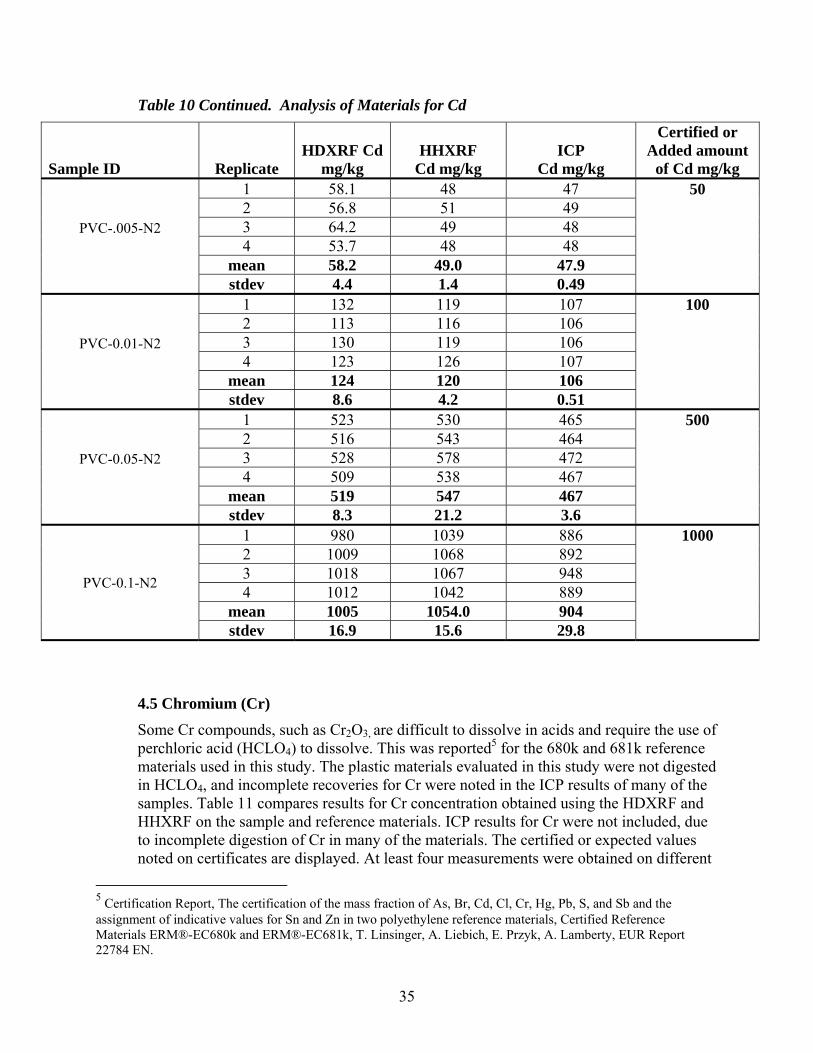
4.4 Cadmium (Cd)
Table 10 compares results for Cd concentration obtained using the HDXRF, HHXRF, and ICP on the sample and reference materials. The certified or expected values noted on certificates are also displayed. At least four measurements were obtained on different locations on materials. The mean and stdev are included in the tables. Figure 11 shows the correlation between the mean Cd concentration measurements obtained by ICP and HDXRF on samples with Cd >5ppm by ICP. Figure 12 shows the correlation between the mean Cd concentration measurements obtained by ICP and HHXRF on samples with Cd >5 ppm by ICP. The HDXRF Cd measurement results generally compare favorably with the ICP Cd results obtained for the samples. The HDXRF Cd measurement results obtained on the sample materials with ICP Cd results >10 ppm are within ±30% of ICP measurement results. The HHXRF Cd measurement results for many of the PVC sample materials are more than 30 percent lower than the ICP Cd measurement result. The HHXRF Cd measurement result for the PVC-L sample material was only about 10 percent of the ICP Cd measurement result, while the HHXRF and ICP Cd measurement results for PVC-0.01-N2 were within ±15%. Review of the HHXRF spectra for PVC-L and PVC-0.01-N2, which have similar Cd ICP measurement results, showed the intensity of the Cd Kα line to be similar. The PVC-L sample does contain approximately 1000 ppm tin (“Sn”). It may be that the algorithms used by the HHXRF are not correctly accounting for the Sn. The HHXRF spectra for these two sample materials are shown in Figures 13-15. The Cd Kα line is at 23.17 Kev Figure 11
y = 1.0561x + 6.5509R² = 0.9827
0
200
400
600
800
1000
1200
0 200 400 600 800 1000
Cd ppm, by HDXRF
Cd ppm. by ICP
Cd, ICP vs HDXRF

30
Figure 12
Figure 13. HHXRF spectra of PVC-L sample
y = 1.044x ‐ 50.212R² = 0.9034
‐200
0
200
400
600
800
1000
1200
0 200 400 600 800 1000
Cd ppm by HHXRF
Cd ppm by ICP
Cd, ICP vs HHXRF
31
Figure 14. HHXRF spectra of PVC-0.01-N2
Figure 15. Comparison of PVC-L and PVC-0.01-N2 HHXRF spectra
0
0.5
1
1.5
2
2.5
3
3.5
4
4.5
5
19.5 20.5 21.5 22.5 23.5 24.5 25.5
cps
Kev
HHXRF Spectra for Cd
PVC‐L
PVC‐0.01‐N2

32
Table 10. Analysis of Materials for Cd
Sample ID Replicate HDXRF
Cd mg/kg HHXRF
Cd mg/kg ICP
Cd mg/kg
Certified or Added amount
of Cd mg/kg 680k 1 18.7 16.2 22.5 19.6
2 18.7 15.6 22.3 3 18.3 19.4 22.6 4 25.4 17.2 21.7
mean 20.3 17.1 22.3 stdev 3.4 1.7 0.4
681k 1 133 120 132 137 2 131 119 126 3 123 118 128 4 133 117 127
mean 130 119 128 stdev 4.8 1.3 2.6
GBW08404 1 9.0 7.3 7.2 9.2 2 8.7 6.3 6.4 3 9.2 6.8 6.6 4 7.2 7.4 6.5
mean 8.5 7.0 6.7 stdev 0.9 0.5 0.4
GBW08405 1 84.1 78.0 82.2 92.3 2 87.9 80.1 83.1 3 86.2 78.9 75.1 4 91.4 78.5 83.7
mean 87.4 78.9 81.0 stdev 3.1 0.9 4.0
EN-71-3 1 283 270 310 300 2 278 269 289 3 219 269 235 4 257 263 292
mean 259 268 282 stdev 29 3.3 32.5
RC1 mean 6.0 ND ND 4106R 1 566 533 606
2 603 521 640 3 554 524 602 4 545 522 667
mean 567 525 629 stdev 25.5 5.7 30.6
Note: ASTM F963-11 Cd total element screening limit is 75ppm

33
Table 10 Continued. Analysis of Materials for Cd
Sample ID Replicate HDXRF Cd
mg/kg HHXRF
Cd mg/kg ICP
Cd mg/kg
Certified or Added amount
of Cd mg/kg 4960BP mean ND ND ND 4961GB 1 71.1 78.0 67.4
2 77.6 72.0 68.5 3 74.8 78.0 70.3 4 79.1 80.0 68.8
mean 75.7 77.0 68.7 stdev 3.5 3.5 1.2
4960M mean 3.9 ND ND 2946T mean 1.8 10.8 ND 6952BP mean ND ND 0.6 4643C mean 5.3 3.5 2.7 2946W mean 5.5 ND 0.6 2949W mean 6.8 ND ND 2949H mean 7.0 ND ND 3171PB 1 248 111
2 244 116 242 3 270 113 266 4 259 110 278
mean 255 113 262 stdev 11.7 2.7 18.3
3588TS 1 213 88.3 168 2 197 93.0 167 3 202 94.3 176 4 217 129 173
mean 207 101 171 stdev 9.3 18.9 4.3
3588HS 1 207 84.4 171 2 205 122 171 3 198 88.8 169 4 209 88.9 168
mean 205 96.1 170 stdev 4.8 17.6 1.4
3587TS 1 446 222 374 2 458 230 398 3 442 230 4 431 230 396
mean 444 228 389 stdev 11.1 4.0 13.3

34
Table 10 Continued. Analysis of Materials for Cd
Sample ID Replicate HDXRF Cd
mg/kg HHXRF
Cd mg/kg ICP
Cd mg/kg
Certified or Added amount
of Cd mg/kg 3590B 1 98.1 53.0 72.5
2 89.9 52.5 75.5 3 93 50.5 71.1 4 93.4 55.3 70.0
mean 93.6 52.8 72.3 stdev 3.4 2.0 2.4
3590HS 1 149 35.9 130 2 155 44.2 130 3 158 49.4 132 4 141 45.4 133
mean 151 43.7 131 stdev 7.5 5.7 1.9
3590TS 1 392 179 340 2 384 187 344 3 386 179 326 4 375 183 298
mean 384 182 327 stdev 7.0 4.0 20.8
PVC-L 1 105 7 85.5 92.8 2 102 7 87.5 3 101 7 87.0 4 96.8 14 87.3 5 97.8 13 85.3
mean 99.4 9.6 86.5 stdev 2.5 3.6 0.3
PVC-H 1 278 159 256 278 2 283 163 246 3 269 163 245 4 269 162 243 5 261 164 250
mean 270 162 248 stdev 9.1 1.9 2.2
3587HS 1 375 180 318 2 366 174 315 3 367 184 311 4 355 176
mean 366 178 314 stdev 8 4.1 3.7
35
Table 10 Continued. Analysis of Materials for Cd
Sample ID Replicate HDXRF Cd
mg/kg HHXRF
Cd mg/kg ICP
Cd mg/kg
Certified or Added amount
of Cd mg/kg
PVC-.005-N2
1 58.1 48 47 50 2 56.8 51 49 3 64.2 49 48 4 53.7 48 48
mean 58.2 49.0 47.9 stdev 4.4 1.4 0.49
PVC-0.01-N2
1 132 119 107 100 2 113 116 106 3 130 119 106 4 123 126 107
mean 124 120 106 stdev 8.6 4.2 0.51
PVC-0.05-N2
1 523 530 465 500 2 516 543 464 3 528 578 472 4 509 538 467
mean 519 547 467 stdev 8.3 21.2 3.6
PVC-0.1-N2
1 980 1039 886 1000 2 1009 1068 892 3 1018 1067 948 4 1012 1042 889
mean 1005 1054.0 904 stdev 16.9 15.6 29.8
4.5 Chromium (Cr)
Some Cr compounds, such as Cr2O3, are difficult to dissolve in acids and require the use of perchloric acid (HCLO4) to dissolve. This was reported5 for the 680k and 681k reference materials used in this study. The plastic materials evaluated in this study were not digested in HCLO4, and incomplete recoveries for Cr were noted in the ICP results of many of the samples. Table 11 compares results for Cr concentration obtained using the HDXRF and HHXRF on the sample and reference materials. ICP results for Cr were not included, due to incomplete digestion of Cr in many of the materials. The certified or expected values noted on certificates are displayed. At least four measurements were obtained on different
5 Certification Report, The certification of the mass fraction of As, Br, Cd, Cl, Cr, Hg, Pb, S, and Sb and the assignment of indicative values for Sn and Zn in two polyethylene reference materials, Certified Reference Materials ERM®-EC680k and ERM®-EC681k, T. Linsinger, A. Liebich, E. Przyk, A. Lamberty, EUR Report 22784 EN.

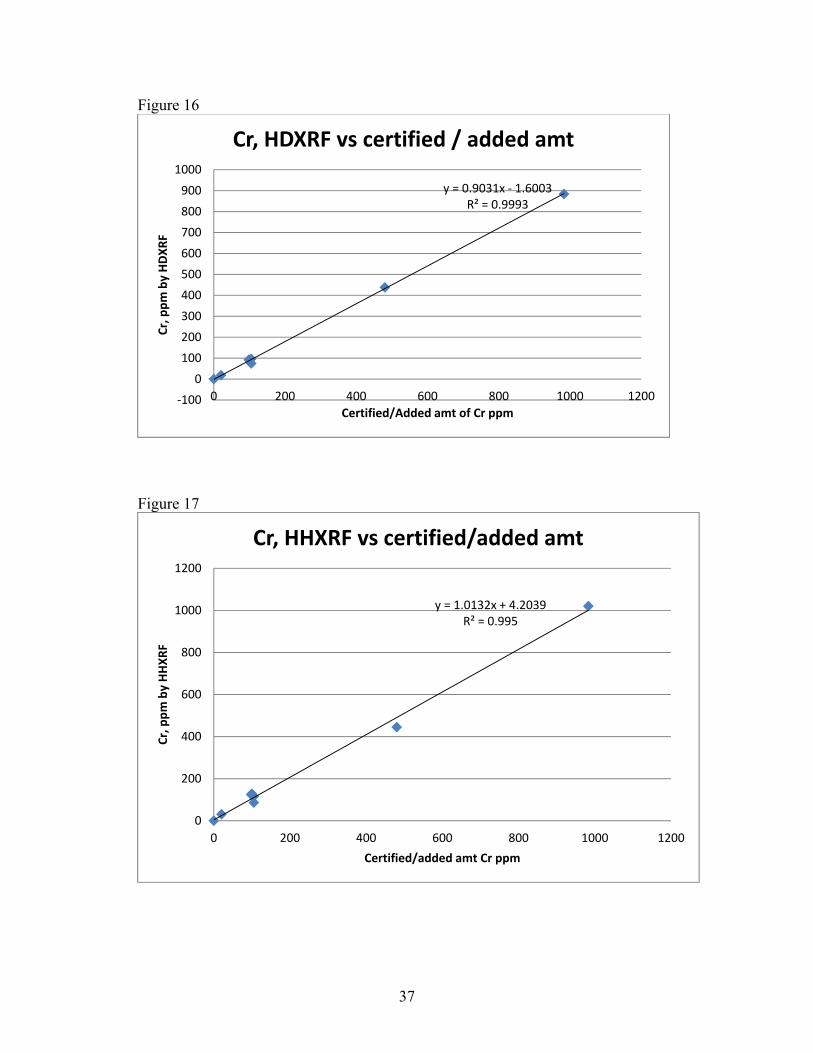
36
locations on materials. The mean and stdev are included in the tables. Figure 16 shows the correlation between the mean Cr concentration measurements obtained by HDXRF and the referenced amounts of Cr reported for reference materials. Figure 17 shows the correlation between the mean Cr concentration measurements obtained by HHXRF and the referenced amounts of Cr reported for the reference materials. The HDXRF and HHXRF Cr measurement results generally compare favorably with the certified or added amount of Cr reported for the reference materials. Comparisons with ICP could not be made due to incomplete digestion of Cr in many of the plastic materials. The HDXRF and HHXRF Cr measurement results obtained on the reference materials are within ±30% of the certified or added amount of Cr reported for the reference materials, except for 680k, which had Cr HHXRF result approximately 50 percent higher than the certified result. This material only contained 20 ppm Cr, which may be approaching the detection limit of the HHXRF for Cr. ASTM F963-11 maximum soluble limit for Cr is 60 ppm. If a material screens higher than 60 ppm total Cr, the extraction test is required. The HDXRF and HHXRF successfully identified all the reference materials that had Cr above 60 ppm.
37
Figure 16
Figure 17
y = 0.9031x ‐ 1.6003R² = 0.9993
‐100
0
100
200
300
400
500
600
700
800
900
1000
0 200 400 600 800 1000 1200
Cr, ppm by HDXRF
Certified/Added amt of Cr ppm
Cr, HDXRF vs certified / added amt
y = 1.0132x + 4.2039R² = 0.995
0
200
400
600
800
1000
1200
0 200 400 600 800 1000 1200
Cr, ppm by HHXRF
Certified/added amt Cr ppm
Cr, HHXRF vs certified/added amt

38
Table 11. Analysis of Materials for Cr
Sample ID Replicate HDXRF
Cr mg/kg HHXRF Cr mg/kg
ICP Cr mg/kg
Certified or Added amount
of Cr mg/kg 680k 1 19.9 31.9 20.2
2 18.5 30.8 3 16.0 31.4 4 19.2 28.6
mean 18.4 30.7 stdev 1.7 1.5
681k 1 95.5 126 100 2 87.6 127 3 91.0 128 4 93.3 129
mean 91.9 128 stdev 3.4 1.1
GBW08404 1 86.8 125 98.1 2 89.7 123 3 99.1 123 4 93.2 124
mean 92.2 124 stdev 5.3 0.8
GBW08405 1 906 1021 983 2 864 1024 3 889 1018 4 879 1018
mean 884 1020 stdev 17.6 3.2
EN-71-3 1 96.3 114 105 2 96.4 114 3 97.4 117 4 95.1 117
mean 96.3 116 stdev 0.9 1.5
RC1 1 61.4 199 2 59.6 188 3 59.6 203 4 56.4 205
mean 59.3 199 stdev 2.1 7.5
4106R mean ND ND 4960BP mean ND ND 4961GB mean ND ND
Note: ASTM F963-11 Cr total element screening limit is 60ppm

39
Table 11 Continued. Analysis of Materials for Cr
Sample ID Replicate HDXRF Cr
mg/kg HHXRF Cr mg/kg
ICP Cr mg/kg
Certified or Added amount
of Cr mg/kg 4960M mean ND ND 2946T mean ND ND 6952BP mean 4.4 ND 4643C mean ND ND 2946W 1 55.9 ND
2 51.8 ND 3 117 ND 4 96.5 ND
mean 80.3 ND stdev 31.7
2949W mean ND ND 2949H mean ND ND 3171PB mean ND ND 3588TS mean ND ND 3588HS mean ND ND 3587TS mean ND ND 3590B 1 61.3 28.3
2 49.5 ND 3 67.1 ND 4 68.1 ND
mean 61.5 7.1 stdev 8.5 14.2
3590HS mean ND ND 3590TS mean ND ND 3587HS mean ND ND PVC-L 1 76.3 89 105
2 82.8 85 3 83.2 91 4 62.1 84 5 68.1 82
mean 74.5 86.2 stdev 9.3 3.7
PVC-H 1 471 437 480 2 431 441 3 408 442 4 434 454 5 445 453
mean 438 445 stdev 22.9 7.6

40
4.6 Mercury (Hg)
Table 12 compares results for Hg concentration obtained using the HDXRF, HHXRF, and ICP on the sample and reference materials. The certified or expected values noted on certificates are also displayed. The only materials that had measureable Hg results by HDXRF and HHXRF were the reference materials with intentionally added Hg. Hg analysis by ICP requires additional steps to ensure there is no carryover of Hg between samples. Because Hg was only detected in the reference materials by the XRF analyses, ICP analysis was not conducted on any of the materials. At least four measurements were obtained on different locations on materials. The mean and stdev are included in the tables. Figure 18 shows the correlation between the mean Hg concentration measurements obtained by HDXRF and the referenced amount of Hg reported for the reference materials. Figure 19 shows the correlation between the mean Hg concentration measurements obtained by HHXRF and the referenced amount of Hg reported for the reference materials. The HDXRF and HHXRF Hg measurement results generally compare favorably with the certified or added amount of Hg reported for the reference materials. The HDXRF and HHXRF Hg measurement results obtained on the reference materials are within ±30% of the certified or added amount of Hg reported for the reference materials except for 681k which had Hg HHXRF and HDXRF results approximately 40 percent higher than the certified result. This material only contained 23.7 ppm Hg. ASTM F963-11 maximum soluble limit for Hg is 60 ppm. If a material screens higher than 60 ppm total Hg, the extraction test is required. The HDXRF and HHXRF successfully identified all the reference materials that had Hg above 60 ppm.

41
Figure 18
Figure 19
y = 1.167x ‐ 0.6053R² = 0.9999
‐200
0
200
400
600
800
1000
1200
0 100 200 300 400 500 600 700 800 900 1000
Hg, HDXRF ppm
Hg referenced amt, pm
Hg, HDXRF vs referenced amt
y = 1.1231x + 1.2757R² = 0.9996
0
200
400
600
800
1000
1200
0 100 200 300 400 500 600 700 800 900 1000
Hg, HHXRF ppm
Hg referenced amt, ppm
Hg, HHXRF vs referenced amt

42
Table 12. Analysis of Materials for Hg
Sample ID Replicate HDXRF Hg
mg/kg HHXRF
Hg mg/kg ICP
Hg mg/kg
Certified or Added amount
of Hg mg/kg 4960M mean ND ND 2946T mean ND ND 6952BP mean ND ND 4643C mean ND ND 2946W mean ND ND 2949W mean ND ND 2949H mean ND ND 3171PB mean ND ND 3588TS mean ND ND 3588HS mean ND ND 3587TS mean ND ND 3590B mean ND ND 3590HS mean ND ND 3590TS mean ND ND 3587HS mean ND ND RC1 mean ND ND 4106R mean ND ND 4960BP mean ND ND 4961GB mean ND ND
Note: ASTM F963-11 Hg total element screening limit is 60ppm

Table 12 Continued. Analysis of Materials for Hg
Sample ID Replicate HDXRF
Hg mg/kg HHXRF
Hg mg/kg ICP
Hg mg/kg
Certified or Added amount
of Hg mg/kg 680k 1 4.9 5.4 4.64
2 6.1 5.8 3 3.8 4.1 4 4.2 4.5
mean 4.8 4.9 stdev 1.0 0.8
681k 1 32.9 34.2 23.7 2 32.3 32.7 3 34.1 32.5 4 33.2 32.7
mean 33.1 33.0 stdev 0.8 0.8
GBW08404 1 111 116 93.0 2 107 115 3 108 114 4 105 117
mean 108 116 stdev 2.5 1
GBW08405 1 1076 1027 922 2 1060 1036 3 1076 1030 4 1091 1043
mean 1076 1037 stdev 12.7 7.1
EN-71-3 1 118 103 102 2 116 104 3 98.3 103 4 113 101
mean 111 103 stdev 8.9 1.2
44
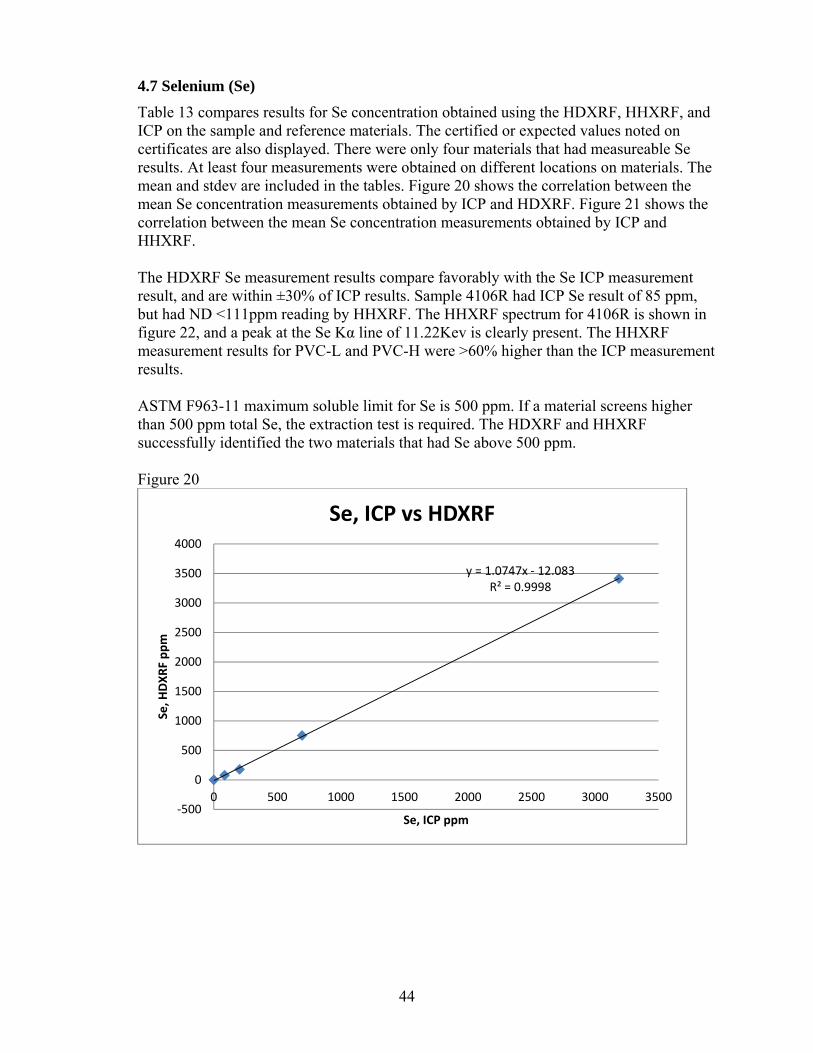
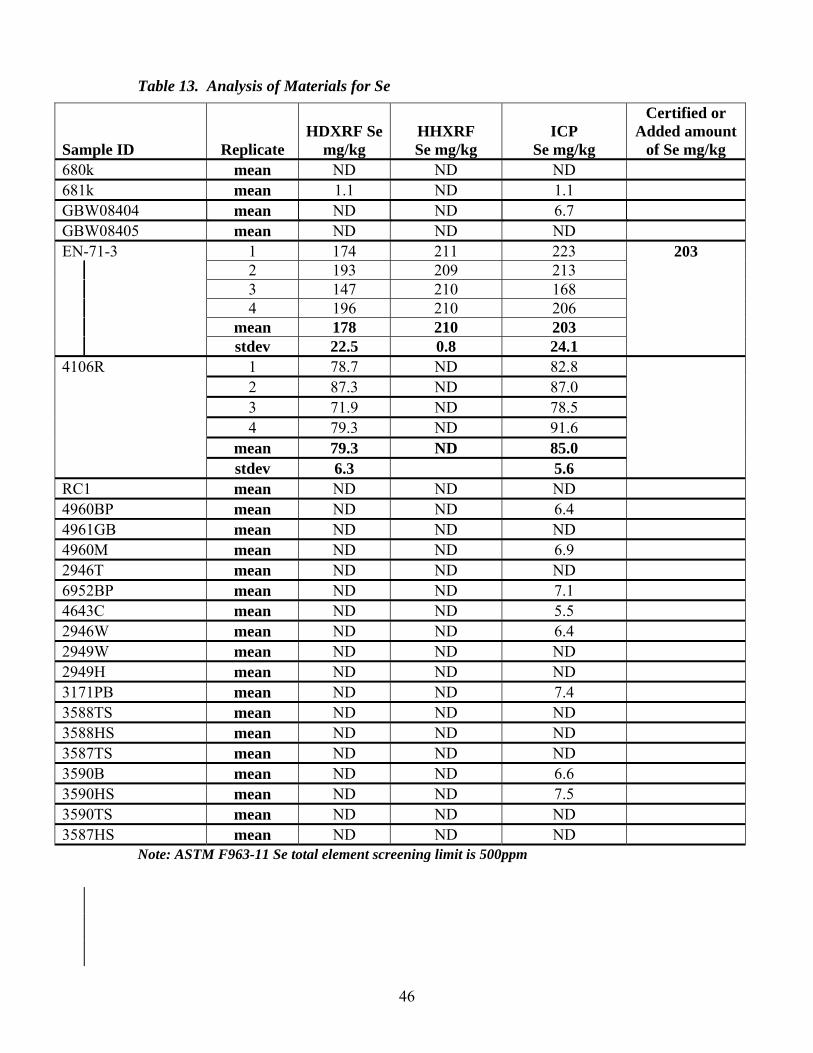
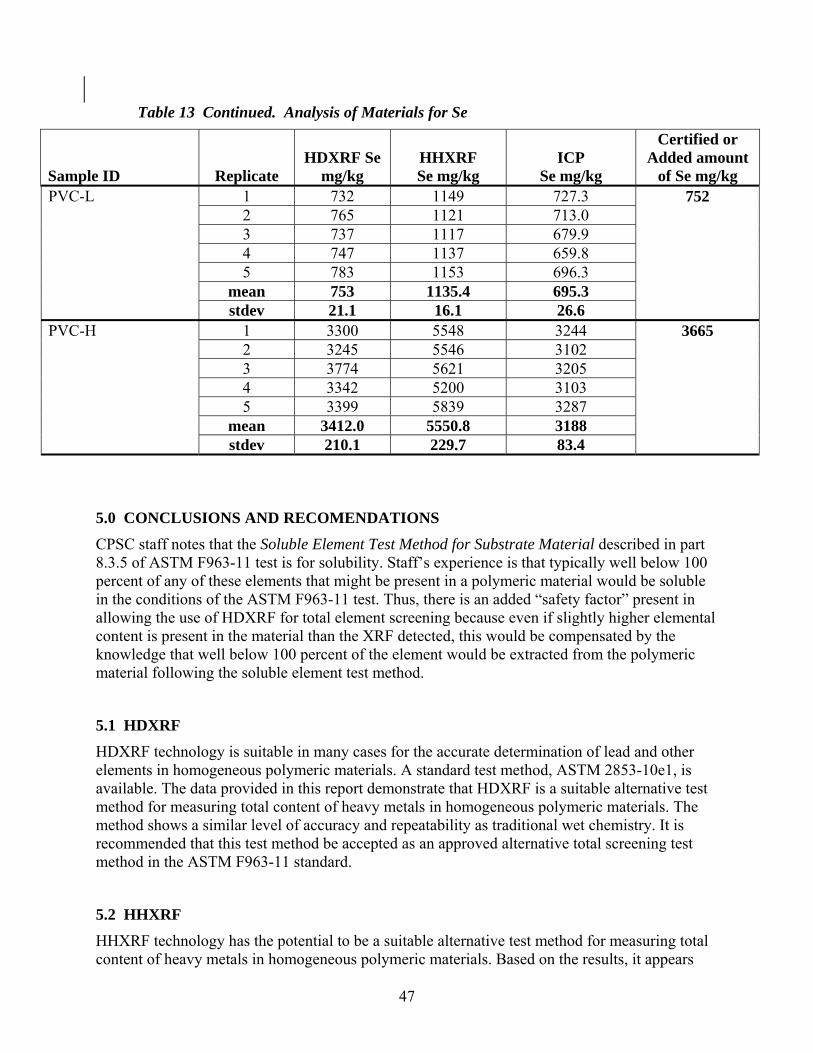
4.7 Selenium (Se)
Table 13 compares results for Se concentration obtained using the HDXRF, HHXRF, and ICP on the sample and reference materials. The certified or expected values noted on certificates are also displayed. There were only four materials that had measureable Se results. At least four measurements were obtained on different locations on materials. The mean and stdev are included in the tables. Figure 20 shows the correlation between the mean Se concentration measurements obtained by ICP and HDXRF. Figure 21 shows the correlation between the mean Se concentration measurements obtained by ICP and HHXRF. The HDXRF Se measurement results compare favorably with the Se ICP measurement result, and are within ±30% of ICP results. Sample 4106R had ICP Se result of 85 ppm, but had ND <111ppm reading by HHXRF. The HHXRF spectrum for 4106R is shown in figure 22, and a peak at the Se Kα line of 11.22Kev is clearly present. The HHXRF measurement results for PVC-L and PVC-H were >60% higher than the ICP measurement results. ASTM F963-11 maximum soluble limit for Se is 500 ppm. If a material screens higher than 500 ppm total Se, the extraction test is required. The HDXRF and HHXRF successfully identified the two materials that had Se above 500 ppm. Figure 20
y = 1.0747x ‐ 12.083R² = 0.9998
‐500
0
500
1000
1500
2000
2500
3000
3500
4000
0 500 1000 1500 2000 2500 3000 3500
Se, H
DXRF ppm
Se, ICP ppm
Se, ICP vs HDXRF

45
Figure 21
Figure 22 HHXRF spectra of 4106R
y = 1.7706x ‐ 97.822R² = 0.9993
‐1000
0
1000
2000
3000
4000
5000
6000
0 500 1000 1500 2000 2500 3000 3500
Se, H
HXRF ppm
Se, ICP ppm
Se, ICP vs HHXRF
46
Table 13. Analysis of Materials for Se
Sample ID Replicate HDXRF Se
mg/kg HHXRF Se mg/kg
ICP Se mg/kg
Certified or Added amount
of Se mg/kg 680k mean ND ND ND 681k mean 1.1 ND 1.1 GBW08404 mean ND ND 6.7 GBW08405 mean ND ND ND EN-71-3 1 174 211 223 203
2 193 209 213 3 147 210 168 4 196 210 206
mean 178 210 203 stdev 22.5 0.8 24.1
4106R 1 78.7 ND 82.8 2 87.3 ND 87.0 3 71.9 ND 78.5 4 79.3 ND 91.6 mean 79.3 ND 85.0 stdev 6.3 5.6 RC1 mean ND ND ND 4960BP mean ND ND 6.4 4961GB mean ND ND ND 4960M mean ND ND 6.9 2946T mean ND ND ND 6952BP mean ND ND 7.1 4643C mean ND ND 5.5 2946W mean ND ND 6.4 2949W mean ND ND ND 2949H mean ND ND ND 3171PB mean ND ND 7.4 3588TS mean ND ND ND 3588HS mean ND ND ND 3587TS mean ND ND ND 3590B mean ND ND 6.6 3590HS mean ND ND 7.5 3590TS mean ND ND ND 3587HS mean ND ND ND
Note: ASTM F963-11 Se total element screening limit is 500ppm
47
Table 13 Continued. Analysis of Materials for Se
Sample ID Replicate HDXRF Se
mg/kg HHXRF Se mg/kg
ICP Se mg/kg
Certified or Added amount
of Se mg/kg PVC-L 1 732 1149 727.3 752
2 765 1121 713.0 3 737 1117 679.9 4 747 1137 659.8 5 783 1153 696.3
mean 753 1135.4 695.3 stdev 21.1 16.1 26.6
PVC-H 1 3300 5548 3244 3665 2 3245 5546 3102 3 3774 5621 3205 4 3342 5200 3103 5 3399 5839 3287
mean 3412.0 5550.8 3188 stdev 210.1 229.7 83.4
5.0 CONCLUSIONS AND RECOMENDATIONS
CPSC staff notes that the Soluble Element Test Method for Substrate Material described in part 8.3.5 of ASTM F963-11 test is for solubility. Staff’s experience is that typically well below 100 percent of any of these elements that might be present in a polymeric material would be soluble in the conditions of the ASTM F963-11 test. Thus, there is an added “safety factor” present in allowing the use of HDXRF for total element screening because even if slightly higher elemental content is present in the material than the XRF detected, this would be compensated by the knowledge that well below 100 percent of the element would be extracted from the polymeric material following the soluble element test method.
5.1 HDXRF
HDXRF technology is suitable in many cases for the accurate determination of lead and other elements in homogeneous polymeric materials. A standard test method, ASTM 2853-10e1, is available. The data provided in this report demonstrate that HDXRF is a suitable alternative test method for measuring total content of heavy metals in homogeneous polymeric materials. The method shows a similar level of accuracy and repeatability as traditional wet chemistry. It is recommended that this test method be accepted as an approved alternative total screening test method in the ASTM F963-11 standard.
5.2 HHXRF
HHXRF technology has the potential to be a suitable alternative test method for measuring total content of heavy metals in homogeneous polymeric materials. Based on the results, it appears

48
that the HHXRF instrument used in this study is capable of detecting Sb, As, Ba, Cd, Cr, Hg, and Se below the ASTM F963-11 total element screening thresholds. The following discrepancies are noted in the comparisons of HHXRF measurement results and the ICP measurement results or referenced amounts:
a. HHXRF Sb results for the PVC-L, PVC-H, and several other PVC samples that were about 30 percent lower than the ICP measurement result.
b. HHXRF was unable to detect As in some sample materials that had ICP and HDXRF measurement results just below the 25 ppm As screening threshold. The HHXRF measurement result for 4960B sample was about 60 percent lower than the ICP and HDXRF measurement results. The mean ICP As result for 4960B was 27 ppm just over the 25 ppm limit. The mean HHXRF result for 4960B was 10 ppm.
c. HHXRF Cd results for the PVC-L, PVC-H and several other PVC samples were more than 30 percent lower than the ICP measurement result. The presence of Sn in these samples may not have been properly accounted for in the HHXRF solver algorithms used for PVC materials.
d. HHXRF Se results for the PVC-L and PVC-H samples were about 60 percent higher than the ICP and HDXRF measurement results.
Standard test methods using HHXRF with scopes that cover the ASTM F963-11 extractable limits for Sb, As, Ba, Cd, Cr, Hg, and Se are not currently available. There is also a lack of PVC and olefin polymeric certified reference materials containing Sb, As, Ba, Cd, Cr, Hg, and Se near the ASTM F963-11 total element screening threshold limits. Development of appropriate certified reference materials could assist HHXRF manufacturers in developing their calibration profiles to more accurately quantify heavy metals in polymeric materials. Staff members from the CPSC are working with the National Institute of Standards and Technology (“NIST”) to develop appropriate PVC Standard Reference Materials (“SRMs”) containing Sb, As, Ba, Cd, Cr, Hg, and Se.CPSC staff encourages HHXRF manufacturers to develop standard test methods that could be used for ASTM F963-11 total element screening when validated with appropriate certified reference materials. CPSC-CH-E1002-8.3 Standard Operating Procedure for Determining Total Lead (Pb) in Nonmetal Children’s Products, Revision November 15, 2012 http://www.cpsc.gov/PageFiles/137832/CPSC-CH-E1002-08_3.pdf. Section I.C Identification and Quantification of Pb in Siliceous Materials Using Other Forms of XRF Spectrometry could be used a guideline. The procedure should utilize appropriate sampling, testing, calibration, and quality control guidelines that would validate the HHXRF instrument is suitable for testing Sb, As, Ba, Cd, Cr, Hg, and Se in polymeric materials in the range of interest, with detection limits below the maximum soluble element limits listed in Table 1 of the ASTM F963-11.

49
List of Tables, Figures, Abbreviations, and Acronyms
Table 1. Sample and Reference Material Descriptions Table 2. Plastic Type, Pb and Non ASTM F963 Elements by HDXRF Table 3. Total Element Screening Limits in ppm (mg/kg) for Substrates other than Modeling Clay Included as Part of a Toy Table 4. Summary of mean HDXRF Results Table 5. Summary of mean HHXRF Results Table 6. Summary of mean ICP Results Table 7. Analysis of Materials for Sb Table 8. Analysis of Materials for As Table 9. Analysis of Materials for Ba Table 10. Analysis of Materials for Cd Table 11. Analysis of Materials for Cr Table 12. Analysis of Materials for Hg Table 13. Analysis of Materials for Se Figure 1. Sb, Plot of ICP vs HDXRF Figure 2. Sb, Plot of ICP vs HHXRF Figure 3. Sb, Plot of Plot of ICP vs HDXRF, with concentrations<200 ppm Figure 4. Sb, Plot of Plot of ICP vs HHXRF, with concentrations<200 ppm Figure 5. As, Plot of ICP vs HDXRF Figure 6. As, Plot of ICP vs HHXRF Figure 7. Ba, Plot of ICP vs HDXRF Figure 8. Ba, Plot of Referenced Amounts vs HDXRF Figure 9. Ba, Plot of ICP vs HHXRF Figure 10. Ba, Plot of Referenced Amounts vs HHXRF Figure 11. Cd, Plot of ICP vs HDXRF Figure 12. Cds, Plot of ICP vs HHXRF Figure 13. HHXRF spectra of PVC-L Figure 14. HHXRF spectra of PVC-0.01-N2 Figure 15. Comparison of PVC-L and PVC-0.01-N2 HHXRF spectra Figure 16. Cr, Plot of Referenced Amounts vs HDXRF Figure 17. Cr, Plot of Referenced Amounts vs HHXRF Figure 18. Hg, Plot of Referenced Amounts vs HDXRF Figure 19. Hg, Plot of Referenced Amounts vs HHXRF Figure 20. Se, Plot of ICP vs HDXRF Figure 21. Se, Plot of ICP vs HHXRF Figure 22. HHXRF spectra of 4106R CPSC= U.S Consumer Product Safety Commission Sb= Antimony As= Arsenic Ba= Barium Cd = Cadmium Cr= Chromium Hg= Mercury Se= Selenium M=molar XRF= X-ray Fluorescence Spectrometry HDXRF= High Definition XRF

50
List of Tables, Figures, Abbreviations, and Acronyms, Continued
HHXRF= Handheld XRF ICP=Inductively Coupled Plasma Optical Emission Spectrometry ICP-MS= Inductively Coupled Plasma Mass Spectrometry GFAA= Graphite Furnace Atomic Absorption keV= kilo electron volt ppm= parts per million µg/ml= microgram per milliliter L/min= liters per minute rpm= rotations per minute kw= kilowatt PVC= polyvinyl chloride FTIR= Fourier Transform Infrared Spectrometry