Embed Size (px)
Citation preview
Study on Shear Strength of Soil In Relation to PlantRoots as A Combind Matrix
Rajesh Kumar Jain
Bharat Group of Colleges,Punjab,India
Email: [email protected]
Abstract
Shear data for the unvegetated soil control samples, Thysanolaena maxima, and Saccharumspontaneum after 4,8 and 12 weeks of growth were studied. The soil stabilization effect ofplant roots is based on two components ,first by friction between the soil particles thattransfer shear stresses from the soil to the root reinforcement system, and second by soilarches that build up between cylindrical soil units that are reinforced by roots (root stock-soil elements) and stabilize areas that are not rooted. Shear increase in rooted soil is basedon the model of a combined matrix of a material that consists of fibres of relatively highstrength and adhesion to a matrix of lower tensile strength. The reduction factor is definedas the ratio of particle size of the output material. The proportion of particle close to 0.425mm was quite large and the amount of clay sized particle was too small to make the wholesample plastic. The 0.075mm sieve were limited to a maximum of 2% although thispercentage was permitted to rise to10% if the fines of this size were non plastic. Althoughexhibiting lower shear strengths than their unvegetated counterparts in the 4-week growthscenario, both species were seen to approach higher soil stability by the 12-week growthscenario. Thysanolaena maxima handled higher shear stresses than the soil control sampleafter 8 and 12 weeks. The existing root area occupied by roots on a potential shear surfaceat a certain depth or by using the relationships of shear-strength increase in the soil versusthe root- area ratio or the bulk weight of root per volume unit of soil. Together all thesethree plants (Thysanolaena maxima, Saccharum spontaneum and Vetiveria zizanioides)are very effective as reinforcer for the prevention of soil erosion. Reinforcement is providedby both thin and coarse roots, the former acting more as tensile elements within the soilmatrix, whereas large diameter roots can also act as tendons or anchors connecting plantedsurface layers to underlying or adjacent stable soil zones.
© 2013 New Delhi Publishers. All rights reserved
Keywords: Soil, Shear strength, Root reinforcement, Mohr and Coulomb shear curve,Root area
IntroductionThe goals of environmental engineering are the restoration of ecosystems that have been substantiallydisturbed by human activities such as environmental pollution or land disturbance, and the development ofnew sustainable ecosystems that have both human and ecological value[1]. Loss in agricultural productioncan be related to poor soil quality. High rates of erosion are due to floods occurs every year, generally weak
International Journal of Applied Sciences & Engineering 1(2): October, 2013: 103-130

46
Jain
soil shear strength [2,3,4,5].It can occur due to a variety of factors, both natural and human-induced, suchas: sediment compaction, organic matter oxidation, faulting[6,7].The reduction rates in ground surfaceelevation on average of 1.5 mm/yr, as high as 10 mm/yr , and as high as 25 mm/yr in certainlocations[8,9,10,11]. Land erosion can be classified into two categories: sheet/rill erosion and gully erosion.These are two terms that essentially describe the same process—rill erosion being gully erosion on a smallscale. Gully erosion is due to local scour and is caused by flowing water in a defined channel[12,13]. Shearstrength is of sincere importance to gully formation and epehemeral gully erosion, which is term explainingerosion that occurs on areas of such topography that runoff collects and concentrates in few well-definedchannels that form in local low points and at the confluences of surface water currents before exiting[13].The work of Hergault[14] cites the shearing processes of a moving fluid as an important parameter involvinggranular flow of sediment bed load transport in a supercritical flow. Erosion is believed to occur once acritical shear stress exerted by the moving fluids over a bed of sediment is exceeded[15,4,16]. When thiscritical value is obtained, erosion will occur over a range of fluid shear stresses and sediment properties ifgiven sufficient time[17] and under critical conditions, a stream is said to be competent to move itssediment[18]. Critical shear stress is an important parameter governing detachment by runoff which appearsin numerous erosion models[3] .
There is a immediate need to develop the design for sustainable ecosystems that integrate human societywith its natural environment for the benefit of both1. It is the creating or restoring of ecosystems to serve asengineering solutions that have value to both nature and humans. Soil shear strength is a valuable parameterto examine for civil engineering applications. The safety of any geotechnical engineering structure isdependent on the shear strength of the soil beneath it [19]. The shear strength of soils is an importantaspect in many foundation engineering problems such as the bearing capacity of shallow foundations andpiles, the stability of the slopes of dams and embankments, and lateral earth pressure on retaining walls[20].Understanding shear strength can lead to the classification of the condition of a soil entity[21] and canassist engineers in drawing critical conclusions about the overall soil mechanics of a specific environment.
From a engineering point, shear strength of common engineering materials, such as steel, is governed bythe molecular bonds that hold the material together. The higher the shear strength of a material, the strongerthe molecular structure[20]. However, soil shear strength operates under a different set of principles. Soil isa particulate material, so shear failure occurs when the stresses between the particles are such that theyslide or roll past each other. Due to the particulate nature of soil, unlike that of a continuum, the shearstrength depends on the inter-particle interactions rather than the internal strength of the soil particlesthemselves[21].
Erosion is the removal of a region of the Earth’s surface due to weathering and transport of sediments,specifically by currents or flows [2,13,17,22] . Sediment transport is the movement of solid particles duethis. To remedy this, we need to conserve materials, reduce their unnecessary erosion, produce, make themlast longer. We also need to develop community consumer initiatives and regulatory processes to supportthese reforms and deal with evaluation, production, consumption, recycling and regulation materials withthe intention of clarifying the relationship between these realms, and therefore contributing to possibleeconomic conversion strategies linking these areas. Our relationship with materials is thus a major influenceon our economy, the natural world, and our personal and spiritual well-being. Some terms that describe thecomplex processes associated with the movement of sediments are erosion, deposition, initiation, motion,suspension, and many others[17]. Sediment transport is of major importance to flood alleviation, waterresource management, and environmental sustainability[14]. Erosivity refers to the intensity of the erodingagent (i.e., water, wind, etc.) to cause detachment and transport of a sediment, while erodibility defines the
47
Study on Shear Strength of Soil In Relation to Plant Roots as A Combind Matrix
resistance of the sediment to those erosional processes. Erodibility can depend on a variety of factors, but itis claimed that the actual properties of the soil are the most important characteristics, such as: soil texture,aggregate stability, infiltration capacity, organic and chemical content (clay content), plasticity index, andsoil shear strength[22].
The role of plant roots on soil shear strength is very important to stabilize the soil. However, literature inthis field is lacking. Sundborg[23]suggested that the cohesive force resisting entrainment of a grain isproportional to the shear strength of the sediment as determined in standard soil tests, and it acts in adirection opposite to the fluid force. Cohesive sediments can be described as those for which the resistanceto initial movement or erosion depends also on the strength of the cohesive bond between the particles[17].In marshy soils , root network protect the cover, and root presence can act to increase cohesiveness [13,17].
It has been widely recognized that plant root systems can improve soil shear strength. Studies have beenconducted that indicate a distinct increase in shear strength from soil containing no roots to those containingembedded root systems[24,25,26,27,28,29] . In an experiment to evaluate the effect of roots on soil shearstrength, Zhang[26] used consolidated-drained triaxial compression tests on samples of composites comprisedof representative loess from the Loess Plateau in Northwest China and roots of Robinia pseucdoacacia.The samples were manually prepared and the roots were placed in the soil in three different configurations:vertical, horizontal, and a cross vertical-horizontal alignment. Two sets of samples were prepared at differentsoil water contents. Testing was conducted with a strain-controlled triaxial compression test apparatus, andeach sample was subjected to four different confining pressures at a constant shear velocity. Grain-sizedistribution curves, stress-strain curves, and Mohr-Coulomb calculations were performed on the test data.Test results confirmed the hypothesis that plant roots can indeed improve soil shear strength in a rathereffective manner. This was confirmed by observing a significant increase in cohesion, with the horizontal-vertical root configuration showing the most dramatic increases. Soil water content also proved to have asignificant effect on the shear strength properties of the composites tested. Findings indicate that with anincrease in water content, a decrease in cohesion is found along with a possible effect on the internal angleof friction, having an overall reducing effect on soil shear strength. It has been widely recognized that plantroots can improve soil shear strength and can act to reinforce a mass of soil against shear failure[26]. Roots,being relatively strong in tension and weak in compression, can increase the shear strength of soil media,which is relatively weak in tension and strong in compression, in a manner that is akin to the reinforcementof concrete structures by steel or fiberglass[25]. During the past twenty years, rapid growth in the field ofecological engineering has coincided with an increased interest in the use of vegetation as an effective,economical and environmentally friendly solution for slope and streambank stabilization and similarapplications [24,26,29].
Establishing vegetation by planting is one solution method used in practice for such applications. The plantroots can improve soil shear strength and that over time the beneficial impacts can become significant,little is known for how long after planting do the benefits on soil shear strength begin to be realized.Coefficients in equations for erosion of cohesive sediments are determined based on laboratory testing ofsamples carefully extracted in-situ from the field site of interest [30]. Analyzing soil shear strength canhelp explain the mechanics of erosional processes in generally weak wetland clays and cohesive sands.Erosion is said to occur once a critical shear stress exerted by moving fluids over a bed of sediment isexceeded [15,4,16]. When this critical value is obtained, erosion will occur over a range of fluid shearstresses and sediment properties if given sufficient time, and under these critical conditions, a stream issaid to be competent to move its sediment[17,18]. Plant roots can increase soil stability and ultimatelyincrease surface erosion resistance by promoting an increase in soil stiffness and shear strength [2,32,31].
48
Jain
During the past twenty years, rapid growth in the fields of biological and ecological engineering has coincidedwith increased interest in the use of vegetation as an effective, economical and environmentally friendlysolution for slope and stream bank stabilization and other similar applications[26]. Observing soil andplant roots as a combined matrix, plant root systems act to reinforce the soil media against shear failure,much like that of steel rebar in reinforced concrete design[25]. There are many factors affecting the degreeto which root systems can strengthen a soil media that would otherwise not benefit from such a shearstrength increase. Some models incorporate root reinforcement as an additional shear strength term in theMohr-Coulomb shear equation. Thomas and Pollen-Bankhead[25] assumed that all roots extended verticallyacross a horizontal shear zone, and that the root matter behaved in a manner much like laterally-loadedpiles when horizontal shearing was applied. This study gave way to other research investigating the angleof alignment of each root relative to the shear plane and its effect on the incorporated term in the Mohr-Coulomb equation.
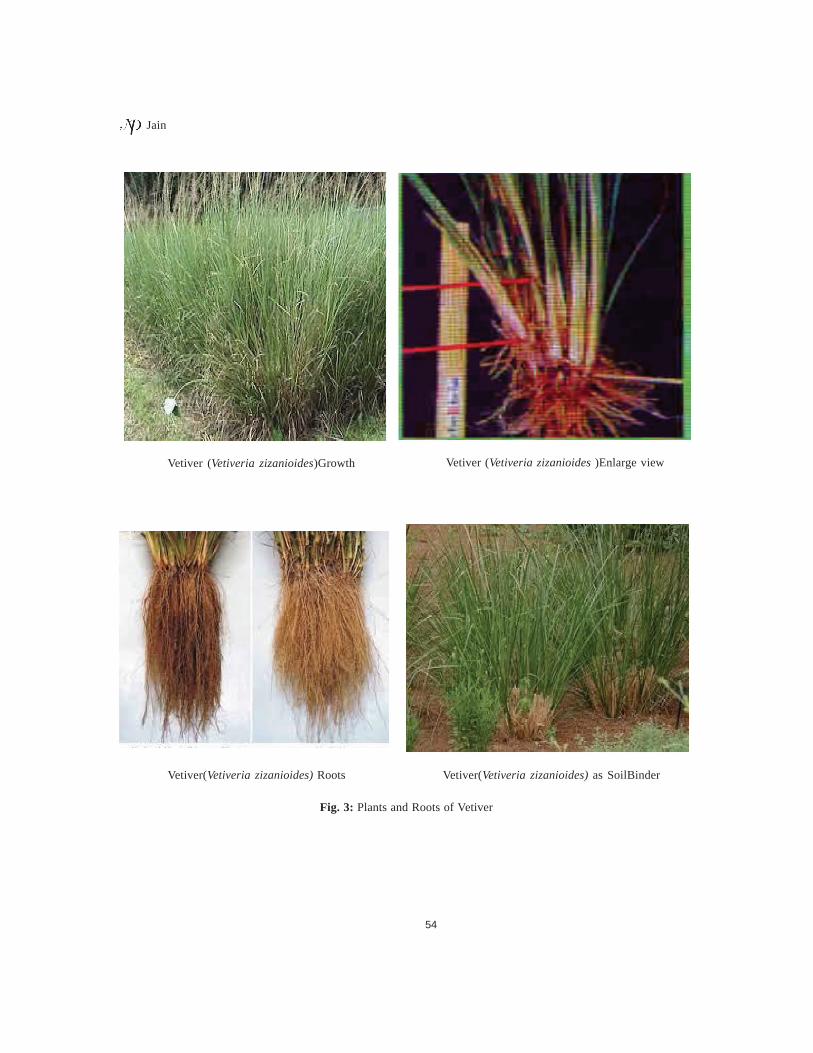
Vetiver grass (Vetiveria zizanioides) has been utilized to reduce soil erosion in many countries throughoutthe world for a long time. It is well understood that the root properties of vetiver grass can help reduce soilerosion and strengthen slope stability when planted properly. Vetiver hedgerows cultivated across slope soilcan block the passage of soil particles and develop terraces between the hedges enhancing stability of theslope. Some previous studies on vetiver have elucidated the morphological properties of the root and theirqualitative significance for erosion control and slope stabilization [32,33]. They emphasize the earlydeveloping deeply penetrating (sometimes up to 3.5 m) fibrous root system of vetiver and its capability ofanchoring, themselves firmly into slope soil profiles. However, the strength properties of vetiver root,which also play an important role in terms of erosion control and slope stabilization by means of theirinfluences on the shear strength of slope soil has not yet been adequately understood. When a plant rootpenetrates across a potential shear surface in a soil profile, the distortion of the shear zone develops tensionin the root; the component of this tension tangential to the shear zone directly resists shear, while thenormal component increases the confining pressure on the shear plane. Therefore it is essential to determinetensile root strength properties in the process of evaluating a plant species as a component in slopestabilization. Recently, in Malaysia the vetiver hedgerow technique starts to gain popularity in erosioncontrol and slope stabilization.
Aims and ObjectivesThe aim of this research is, therefore, to develop and verify the technical viability of using the soil shearstrength with plant roots. The objective of this study to measure changes in soil shear strength due to theexistence of plant root systems. It is intended to understand how long after planting do root-enhanced shearstrength increases begin to manifest themselves. It is generally accepted that soil shear strength correlatespositively with erosion resistance. Furthermore, it was investigated how shear strength can be improved bythe presence of plant roots to increase stabilization in soils. In addition it also provides a thoroughunderstanding of the stress dependent mechanical behavior The general aim of this research is to establishan innovative and relatively simple material characterization technique to enable a more easy applicationof the mechanical behavior of soil in relation to plant root for day to day practice .
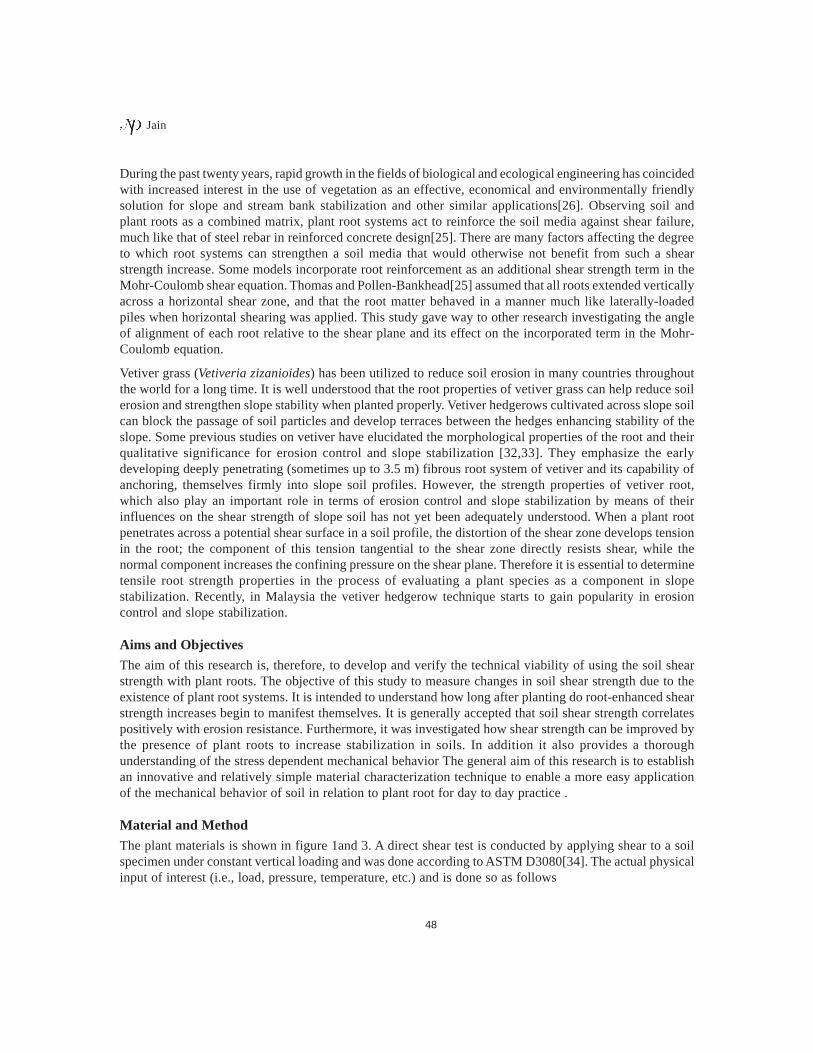
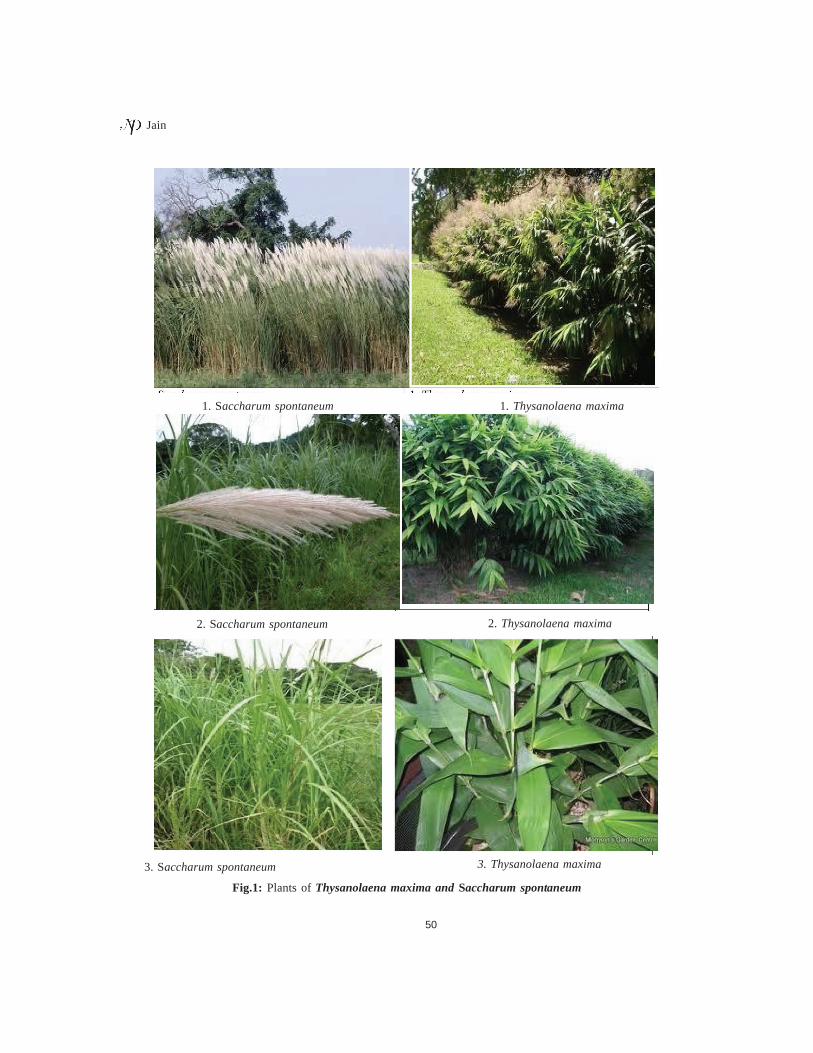
Material and MethodThe plant materials is shown in figure 1and 3. A direct shear test is conducted by applying shear to a soilspecimen under constant vertical loading and was done according to ASTM D3080[34]. The actual physicalinput of interest (i.e., load, pressure, temperature, etc.) and is done so as follows
49
Study on Shear Strength of Soil In Relation to Plant Roots as A Combind Matrix
P = CF X (VS-V
0 / V
E)
Where: P = value of measured physical property
CF = calibration factor
VS = signal voltage value for reading
V0 = signal voltage zero value
VE = excitation voltage value
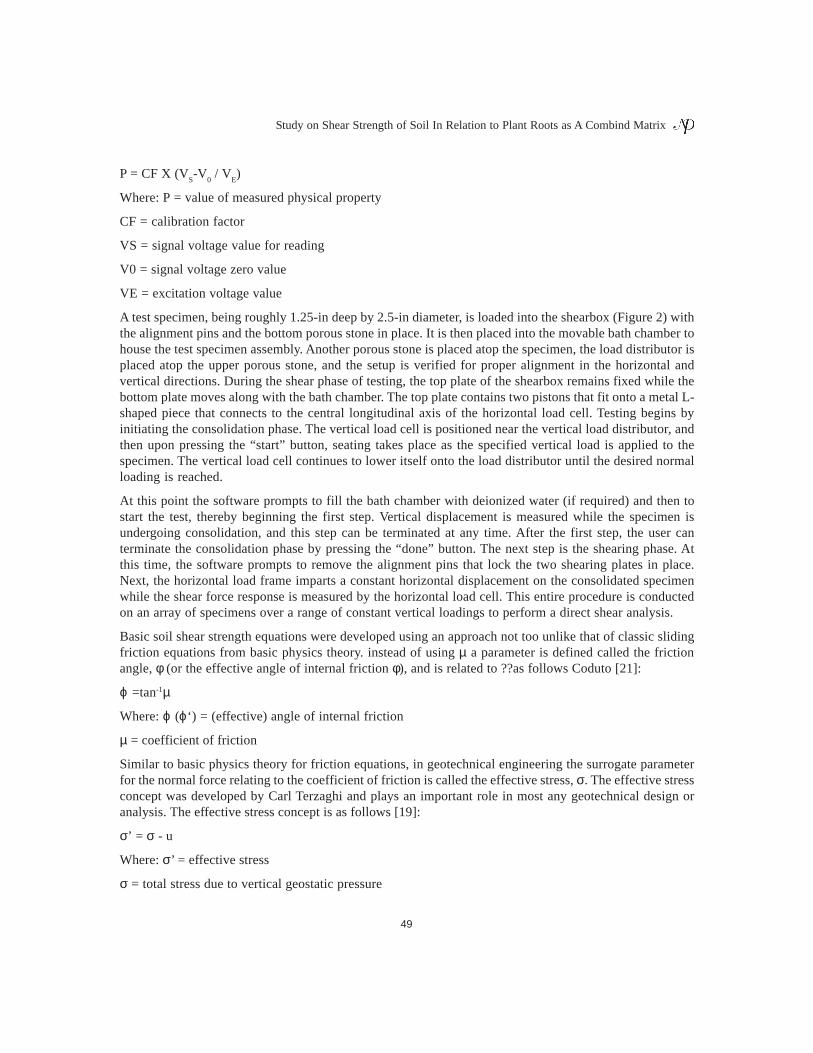
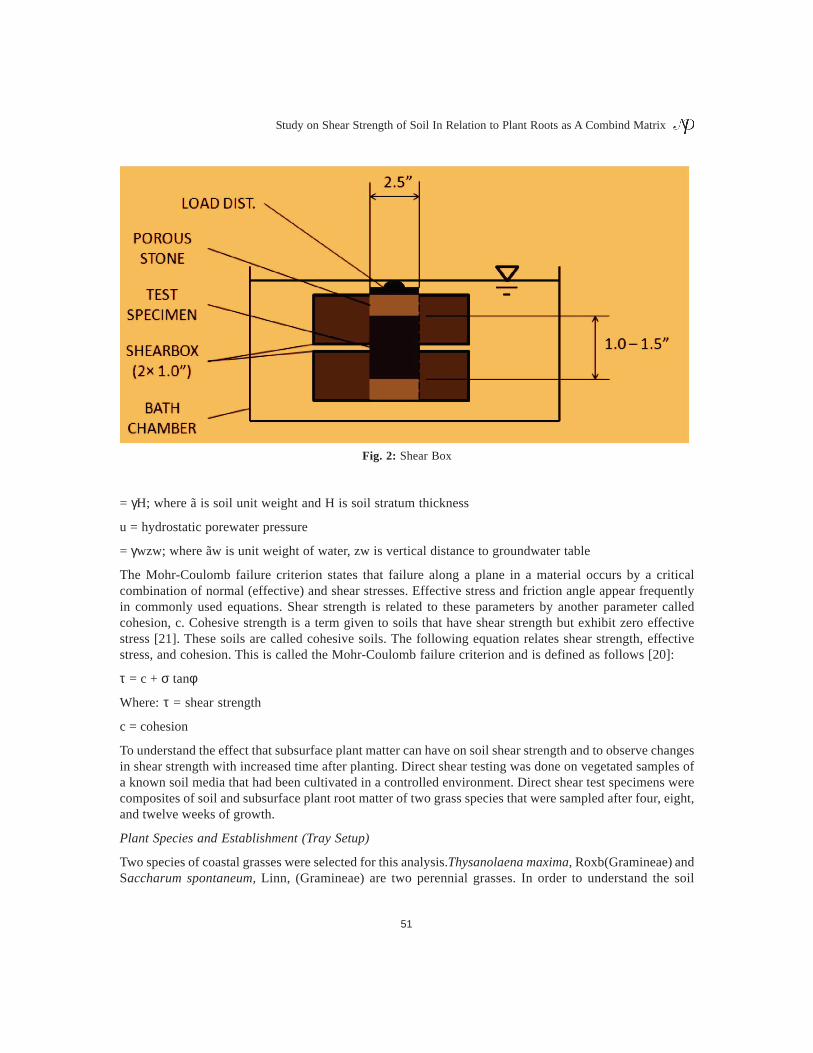
A test specimen, being roughly 1.25-in deep by 2.5-in diameter, is loaded into the shearbox (Figure 2) withthe alignment pins and the bottom porous stone in place. It is then placed into the movable bath chamber tohouse the test specimen assembly. Another porous stone is placed atop the specimen, the load distributor isplaced atop the upper porous stone, and the setup is verified for proper alignment in the horizontal andvertical directions. During the shear phase of testing, the top plate of the shearbox remains fixed while thebottom plate moves along with the bath chamber. The top plate contains two pistons that fit onto a metal L-shaped piece that connects to the central longitudinal axis of the horizontal load cell. Testing begins byinitiating the consolidation phase. The vertical load cell is positioned near the vertical load distributor, andthen upon pressing the “start” button, seating takes place as the specified vertical load is applied to thespecimen. The vertical load cell continues to lower itself onto the load distributor until the desired normalloading is reached.
At this point the software prompts to fill the bath chamber with deionized water (if required) and then tostart the test, thereby beginning the first step. Vertical displacement is measured while the specimen isundergoing consolidation, and this step can be terminated at any time. After the first step, the user canterminate the consolidation phase by pressing the “done” button. The next step is the shearing phase. Atthis time, the software prompts to remove the alignment pins that lock the two shearing plates in place.Next, the horizontal load frame imparts a constant horizontal displacement on the consolidated specimenwhile the shear force response is measured by the horizontal load cell. This entire procedure is conductedon an array of specimens over a range of constant vertical loadings to perform a direct shear analysis.
Basic soil shear strength equations were developed using an approach not too unlike that of classic slidingfriction equations from basic physics theory. instead of using µ a parameter is defined called the frictionangle, φ (or the effective angle of internal friction φ), and is related to ??as follows Coduto [21]:
ϕ =tan-1µ
Where: ϕ (ϕ‘) = (effective) angle of internal friction
µ = coefficient of friction
Similar to basic physics theory for friction equations, in geotechnical engineering the surrogate parameterfor the normal force relating to the coefficient of friction is called the effective stress, σ. The effective stressconcept was developed by Carl Terzaghi and plays an important role in most any geotechnical design oranalysis. The effective stress concept is as follows [19]:
σ’ = σ - u
Where: σ’ = effective stress
σ = total stress due to vertical geostatic pressure
50
Jain
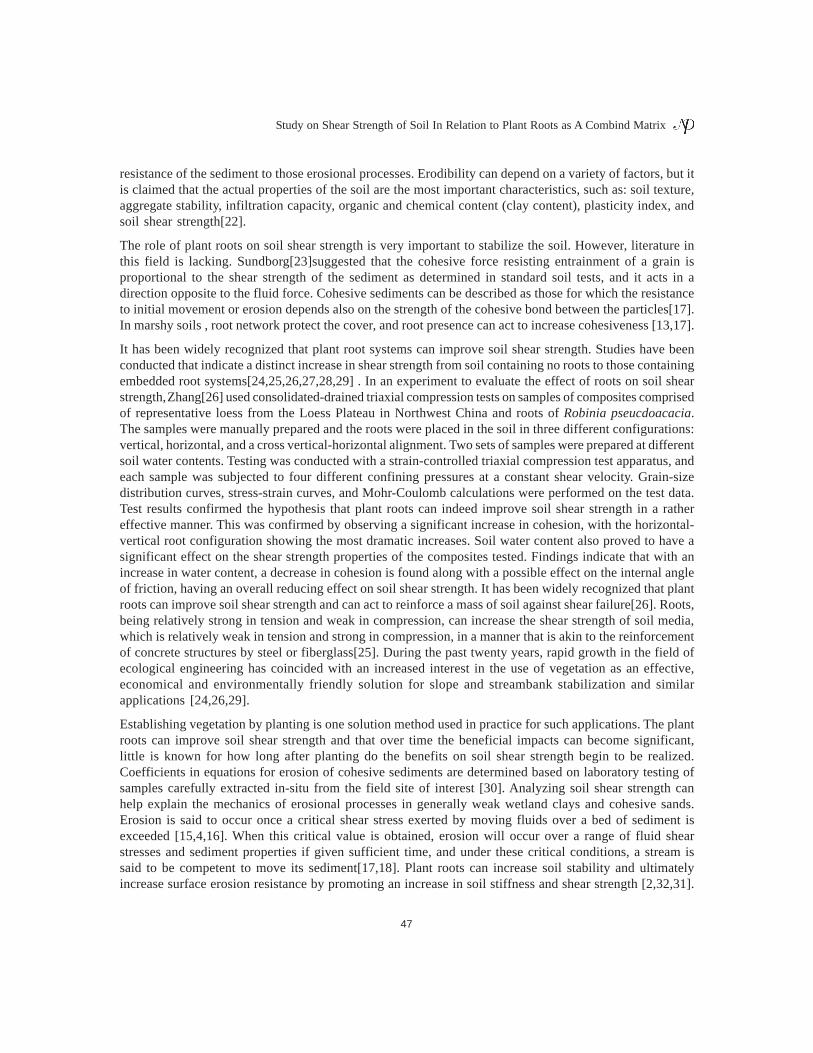
1. Thysanolaena maxima1. Saccharum spontaneum
2. Saccharum spontaneum 2. Thysanolaena maxima
3. Thysanolaena maxima3. Saccharum spontaneum
Fig.1: Plants of Thysanolaena maxima and Saccharum spontaneum
51
Study on Shear Strength of Soil In Relation to Plant Roots as A Combind Matrix
= γH; where ã is soil unit weight and H is soil stratum thickness
u = hydrostatic porewater pressure
= γwzw; where ãw is unit weight of water, zw is vertical distance to groundwater table
The Mohr-Coulomb failure criterion states that failure along a plane in a material occurs by a criticalcombination of normal (effective) and shear stresses. Effective stress and friction angle appear frequentlyin commonly used equations. Shear strength is related to these parameters by another parameter calledcohesion, c. Cohesive strength is a term given to soils that have shear strength but exhibit zero effectivestress [21]. These soils are called cohesive soils. The following equation relates shear strength, effectivestress, and cohesion. This is called the Mohr-Coulomb failure criterion and is defined as follows [20]:
τ = c + σ tanφ
Where: τ = shear strength
c = cohesion
To understand the effect that subsurface plant matter can have on soil shear strength and to observe changesin shear strength with increased time after planting. Direct shear testing was done on vegetated samples ofa known soil media that had been cultivated in a controlled environment. Direct shear test specimens werecomposites of soil and subsurface plant root matter of two grass species that were sampled after four, eight,and twelve weeks of growth.
Plant Species and Establishment (Tray Setup)
Two species of coastal grasses were selected for this analysis.Thysanolaena maxima, Roxb(Gramineae) andSaccharum spontaneum, Linn, (Gramineae) are two perennial grasses. In order to understand the soil
Fig. 2: Shear Box
52
Jain
shear strength improvement characteristics of these grasses, a series of direct shear tests was performed onsoil-root composites (SRCs) of these species in a controlled soil media. A correlation was established betweenthe above-ground biomass (AGB) and the shear strength properties for each grass species over time. A totalof eight mother plant clusters were manually removed with a serrated-edge knife. Four 25-qt rectangularplastic bins were used as growth containers. First, each bin was filled to a depth of approximately four tofive inches of soil media. Two small impressions were made, and two clusters were then transplanted intoeach bin. Next, water was added to completely submerge all soil media. The water level was maintainedapproximately one to two inches above the soil-water interface within (ground surface) and was watered atleast twice per week.
Multiple cultivation scenarios were performed to obtain data in a progressing time series from four totwelve weeks as well as an extreme case of a nearly completely root-bound sample of Saccharum spontaneum.This sample was compaired with the 12-week growth scenario for Thysanolaena maxima and was called a“time equals infinity” sample. This was done to examine the effects that a fully matured below-ground rootsystem could have on soil shear strength after a sufficiently large time after planting. The plants werefertilized and stem counts were recorded and observe rhizomal propagation throughout the growth period.At least once every three days, the plants received water from a garden hose connected to a municipal waterline. A fertilizer solution was prepared and was sprayed on the exterior of the plant stems at the samefrequency that stem counts were performed.
Sampling
At the end of each growth period, all specimens were extracted. This began by emptying the standing waterfrom each growth chamber. Water was poured from the bin into an external container and was removedfrom the chamber. Using a serrated-edge knife all specimens were removed by cutting out a core of soil-rootmedia beneath each stem cluster. The next step was to remove all AGB with a knife. All plant stems wereremoved at the ground surface and their weights were recorded. The SRC sample was then wrapped inaluminum foil for preservation. All samples were then packed into labeled plastic bags for storage. A soilcontrol sample was also taken by filling a plastic bag with soil from each bin. No root or plant matter wasincluded in this sample. The set of samples was stored at 0°C to halt growth and to preserve natural rootorientations.
Laboratory Details
Testing was performed in the Soil Mechanics Laboratory. Each sample produced one test specimen. Inorder to perform a thorough direct shear evaluation, a minimum of three tests must be carried out [19].ASTM standard D3080[34] was consulted, where the inclusion of root matter in the test specimens deviatedfrom the procedure. A total of three vertical loadings were selected based on the increase in effective stressdue to the addition of fill media. The tests were run at vertical loadings of 40, 100, and 300 psf (2, 5, and 14kPa). Table 4 shows normal stress values corresponding to fill depths of soils with properties. For theshearing phase of testing the horizontal displacement rate was set to 0.01 in/min and sheared until theexternal limit of the shearbox, which is the dual shearing plate assembly used for direct shear tests. Saturatedsoil conditions were replicated in the laboratory by submerging the shear box with de ionized water.
For the determination of tensile root strength, mature root specimens were sampled from two-year-oldvetiver plants grown on an embankment slope. The specimens were tested in fresh condition limiting thetime elapsed between the sampling\ and the testing to two hours maximum. The unbranched and straightroot samples, about 15-20 cm long, were vertically connected to hanging spring balance via a wooden
53
Study on Shear Strength of Soil In Relation to Plant Roots as A Combind Matrix
clamp at one end while the other end was fixed to a holder that was pulled down manually until the rootfailed. At failure, the maximum load was monitored. Subsequently, the mode of failure was examined foreach sample and the results of end sheared samples and those with unusually altered rupture points werediscarded. To calculate the tensile root strength, the root diameter without bark was used since the barkfailed before the root due to its weaker strength properties, and eventually the total tensile stress transferredto the root core. About 80 vetiver root specimens of different diameter classes varying from 0.2 to 2.2 mmwere tested and the results were interpreted as the ultimate tensile force and tensile strength in relation toroot diameter without bark.
Direct Shear Tests on Root-Permeated Soil
Roots of trees and other vegetation provide a reinforcing effect to soil through tensile resistance and frictionalor adhesional properties. The reinforcing effect or the increase of shear strength in soil due to roots can bequantified by conduction in-situ direct shear tests on root –permeated and root-free soils at the same location.The difference between shear strength values of root permeated soil and root-free soil sheared under thesame conditions gives the shear strength increase due to the roots. In order to determine the root reinforcementeffect of vetiver grass, large-scale direct shear tests were performed on a sloped soil profile of an embankmentvegetated with vetiver. The test apparatus comprised a shearbox, a hydraulic jacking system, a proving ringand dial gages.
The shear box was made of 8 mm thick steel plates capable of m holding firmly a soil block of 50 cm x 50cm x 50 cm in dimensions. A hydraulic jacking system with capacity of 10 tons produced the shear loadthrough the proving ring of 3 tons of measuring capacity which controlled the shear force while four dialgages measuring the shear displacement (Figure 2).
The test plants were selected from a 50-cm-long vetiver hedgerow that usually includes 3 plants planted ata spacing of 15 cm. The soil surrounding the plants was removed leaving a 50 cm x 50 cm x 25 cm root-permeated soil block centering the hedgerow. Subsequently, the shear box was set so as to cover the soilblock and the loading and displacement measuring systems were assembled. The soil block with 25 cmheight then sheared horizontally towards the slope direction under stress controlled- condition. After shearing,the shear surface and the orientation of failed roots were examined carefully in order to estimate the sheardistortion during failure. It was observed that the average shear distortion during failure was about 30º. Thetotal cross sectional root area on the shear plane and the bulk weight of roots in the sheared soil block weremeasured in order to determine the root area ratio and the biomass, respectively. This procedure was followedfor each 25 cm of depth under the entire vetiver hedgerow length of 50 cm up to 1.5m depth. For each depthlevel of shearing, a root-free soil profile adjacent to the root-permeated soil profile was also sheared underthe same shearing conditions. Each soil block was sheared under its self-weight as the normal load. Thebulk density of test soil was determined before each test for a comparison of the normal load on the root-permeated soil block with that on the counterpart root-free soil block. Each pair of tests was made underequal, normal stress conditions.
Theoretically, the average tensile strength of roots can be used to compute the shear strength increase insoil due to penetration of roots across a shear plane. The computation adapts the simple model of root-reinforced soil subjected to direct shear[35]. According to this model, the tensile force that develops in theroots when the soil is sheared can be resolved into a tangential component which directly resists shear anda normal component which increases the confining stress on the shear plane. The model simply assumesthat the roots are fully mobilized during shearing. The mobilized tensile resistance in the roots translates
54
Jain
Vetiver (Vetiveria zizanioides )Enlarge viewVetiver (Vetiveria zizanioides)Growth
Vetiver(Vetiveria zizanioides) Roots Vetiver(Vetiveria zizanioides) as SoilBinder
Fig. 3: Plants and Roots of Vetiver
55
Study on Shear Strength of Soil In Relation to Plant Roots as A Combind Matrix
into an increase in shear strength in the soil as expressed by the following equation :
∆ = tR [cosθßtanφ + sinθ]
Where are: θ – angle of shear distortion
φ – angle of internal friction
tR – average tensile strength of roots per area unit of soil
The average tensile strength of roots per area unit of soil can be determined by multiplying the averagetensile strength of the roots (TR) by the fraction of the soil cross-section occupied by roots, or the root arearatio (AR/A).
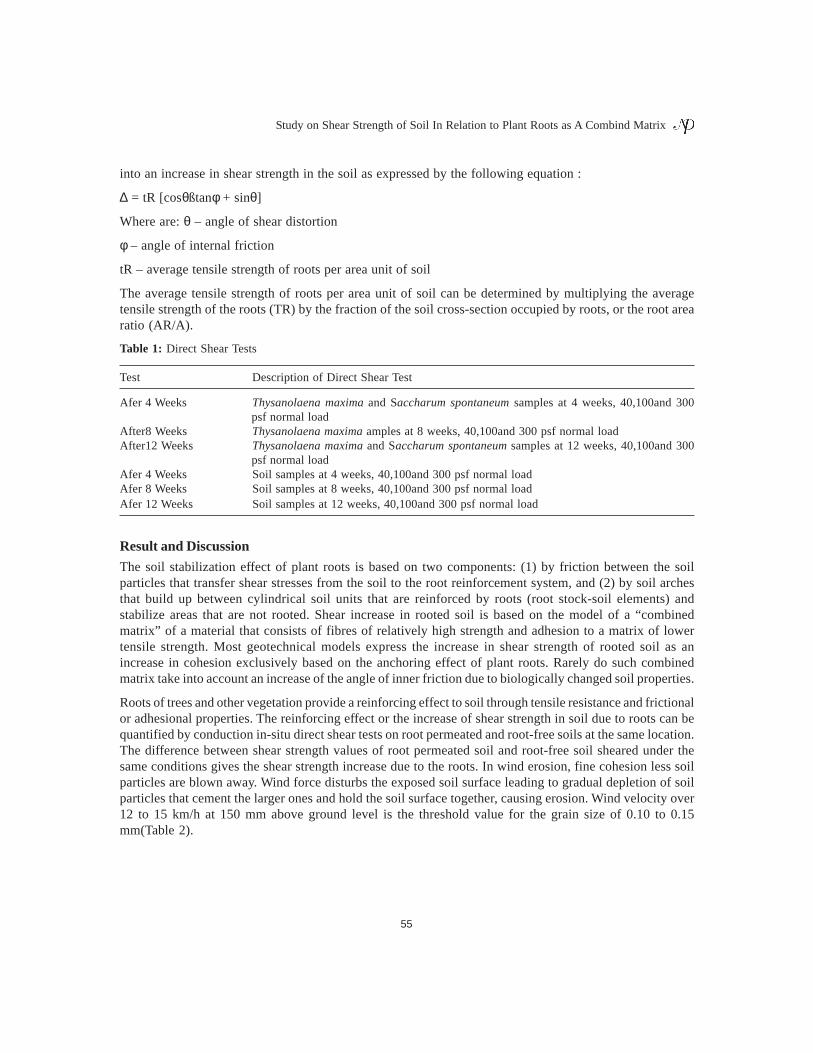
Table 1: Direct Shear Tests
Test Description of Direct Shear Test
Afer 4 Weeks Thysanolaena maxima and Saccharum spontaneum samples at 4 weeks, 40,100and 300psf normal load
After8 Weeks Thysanolaena maxima amples at 8 weeks, 40,100and 300 psf normal loadAfter12 Weeks Thysanolaena maxima and Saccharum spontaneum samples at 12 weeks, 40,100and 300
psf normal loadAfer 4 Weeks Soil samples at 4 weeks, 40,100and 300 psf normal loadAfer 8 Weeks Soil samples at 8 weeks, 40,100and 300 psf normal loadAfer 12 Weeks Soil samples at 12 weeks, 40,100and 300 psf normal load
Result and Discussion
The soil stabilization effect of plant roots is based on two components: (1) by friction between the soilparticles that transfer shear stresses from the soil to the root reinforcement system, and (2) by soil archesthat build up between cylindrical soil units that are reinforced by roots (root stock-soil elements) andstabilize areas that are not rooted. Shear increase in rooted soil is based on the model of a “combinedmatrix” of a material that consists of fibres of relatively high strength and adhesion to a matrix of lowertensile strength. Most geotechnical models express the increase in shear strength of rooted soil as anincrease in cohesion exclusively based on the anchoring effect of plant roots. Rarely do such combinedmatrix take into account an increase of the angle of inner friction due to biologically changed soil properties.
Roots of trees and other vegetation provide a reinforcing effect to soil through tensile resistance and frictionalor adhesional properties. The reinforcing effect or the increase of shear strength in soil due to roots can bequantified by conduction in-situ direct shear tests on root permeated and root-free soils at the same location.The difference between shear strength values of root permeated soil and root-free soil sheared under thesame conditions gives the shear strength increase due to the roots. In wind erosion, fine cohesion less soilparticles are blown away. Wind force disturbs the exposed soil surface leading to gradual depletion of soilparticles that cement the larger ones and hold the soil surface together, causing erosion. Wind velocity over12 to 15 km/h at 150 mm above ground level is the threshold value for the grain size of 0.10 to 0.15mm(Table 2).
56
Jain
Table 2: Relationship between particle diameter and susceptibility to wind erosion
Particle Diameter,mm Wind Susceptibility
<0.42 High Erodibility00.42-0.84 Difficult to Erode0.84-6.4 Usually non Erodible>6.4 Non Erodible
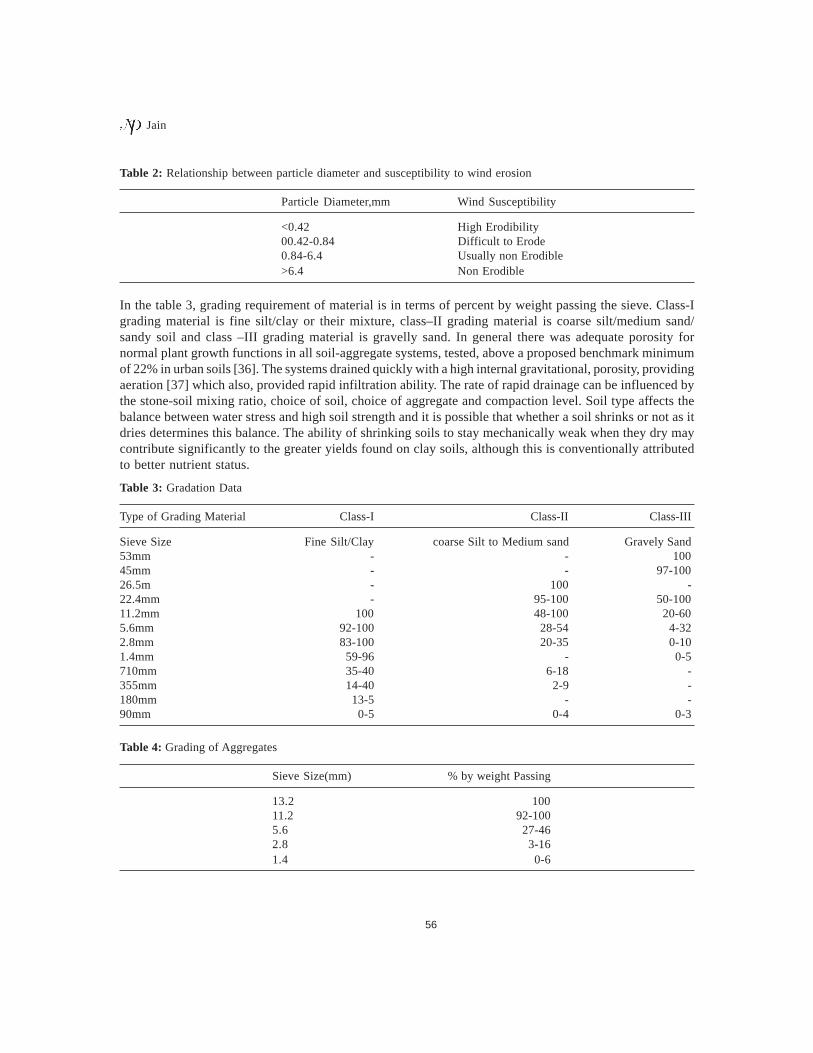
In the table 3, grading requirement of material is in terms of percent by weight passing the sieve. Class-Igrading material is fine silt/clay or their mixture, class–II grading material is coarse silt/medium sand/sandy soil and class –III grading material is gravelly sand. In general there was adequate porosity fornormal plant growth functions in all soil-aggregate systems, tested, above a proposed benchmark minimumof 22% in urban soils [36]. The systems drained quickly with a high internal gravitational, porosity, providingaeration [37] which also, provided rapid infiltration ability. The rate of rapid drainage can be influenced bythe stone-soil mixing ratio, choice of soil, choice of aggregate and compaction level. Soil type affects thebalance between water stress and high soil strength and it is possible that whether a soil shrinks or not as itdries determines this balance. The ability of shrinking soils to stay mechanically weak when they dry maycontribute significantly to the greater yields found on clay soils, although this is conventionally attributedto better nutrient status.
Table 3: Gradation Data
Type of Grading Material Class-I Class-II Class-III
Sieve Size Fine Silt/Clay coarse Silt to Medium sand Gravely Sand53mm - - 10045mm - - 97-10026.5m - 100 -22.4mm - 95-100 50-10011.2mm 100 48-100 20-605.6mm 92-100 28-54 4-322.8mm 83-100 20-35 0-101.4mm 59-96 - 0-5710mm 35-40 6-18 -355mm 14-40 2-9 -180mm 13-5 - -90mm 0-5 0-4 0-3
Table 4: Grading of Aggregates
Sieve Size(mm) % by weight Passing
13.2 10011.2 92-1005.6 27-462.8 3-161.4 0-6
57
Study on Shear Strength of Soil In Relation to Plant Roots as A Combind Matrix
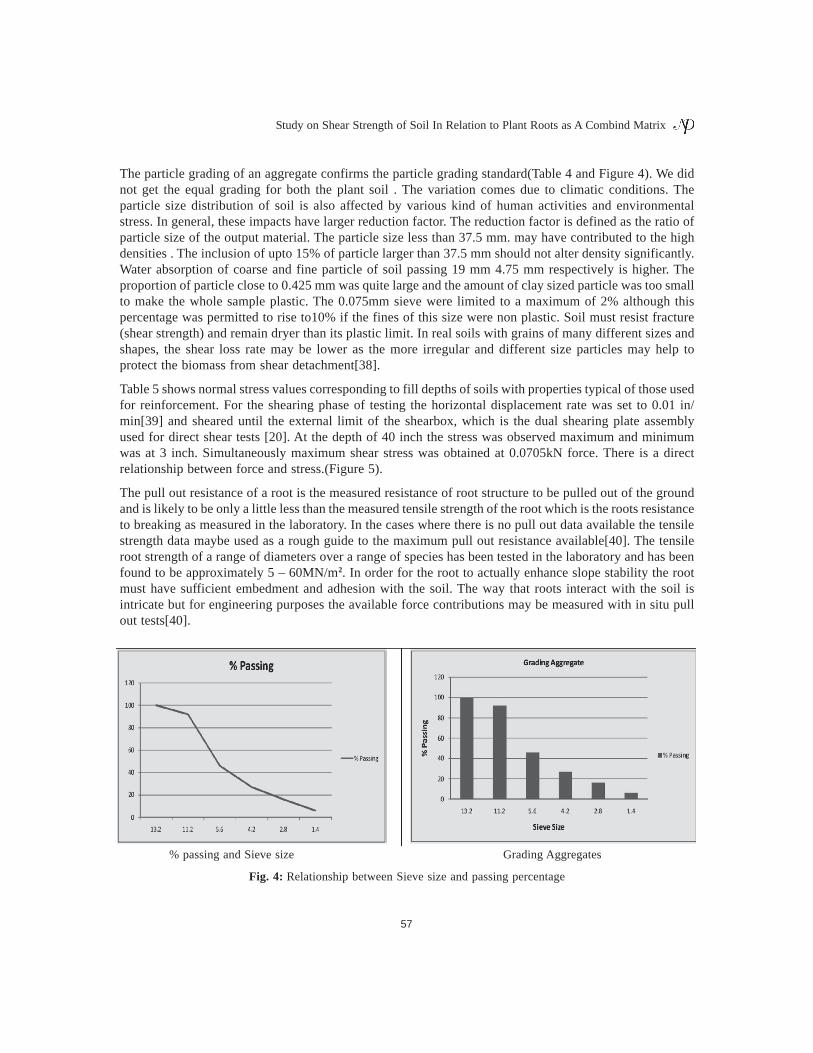
The particle grading of an aggregate confirms the particle grading standard(Table 4 and Figure 4). We didnot get the equal grading for both the plant soil . The variation comes due to climatic conditions. Theparticle size distribution of soil is also affected by various kind of human activities and environmentalstress. In general, these impacts have larger reduction factor. The reduction factor is defined as the ratio ofparticle size of the output material. The particle size less than 37.5 mm. may have contributed to the highdensities . The inclusion of upto 15% of particle larger than 37.5 mm should not alter density significantly.Water absorption of coarse and fine particle of soil passing 19 mm 4.75 mm respectively is higher. Theproportion of particle close to 0.425 mm was quite large and the amount of clay sized particle was too smallto make the whole sample plastic. The 0.075mm sieve were limited to a maximum of 2% although thispercentage was permitted to rise to10% if the fines of this size were non plastic. Soil must resist fracture(shear strength) and remain dryer than its plastic limit. In real soils with grains of many different sizes andshapes, the shear loss rate may be lower as the more irregular and different size particles may help toprotect the biomass from shear detachment[38].
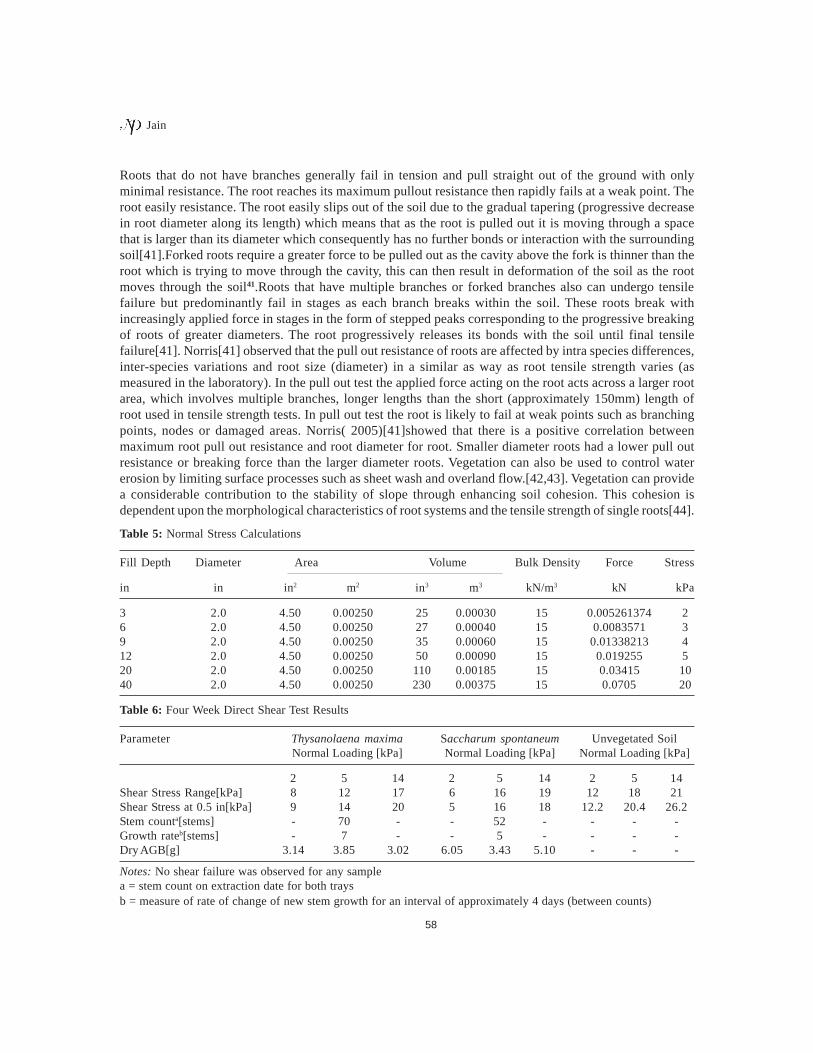
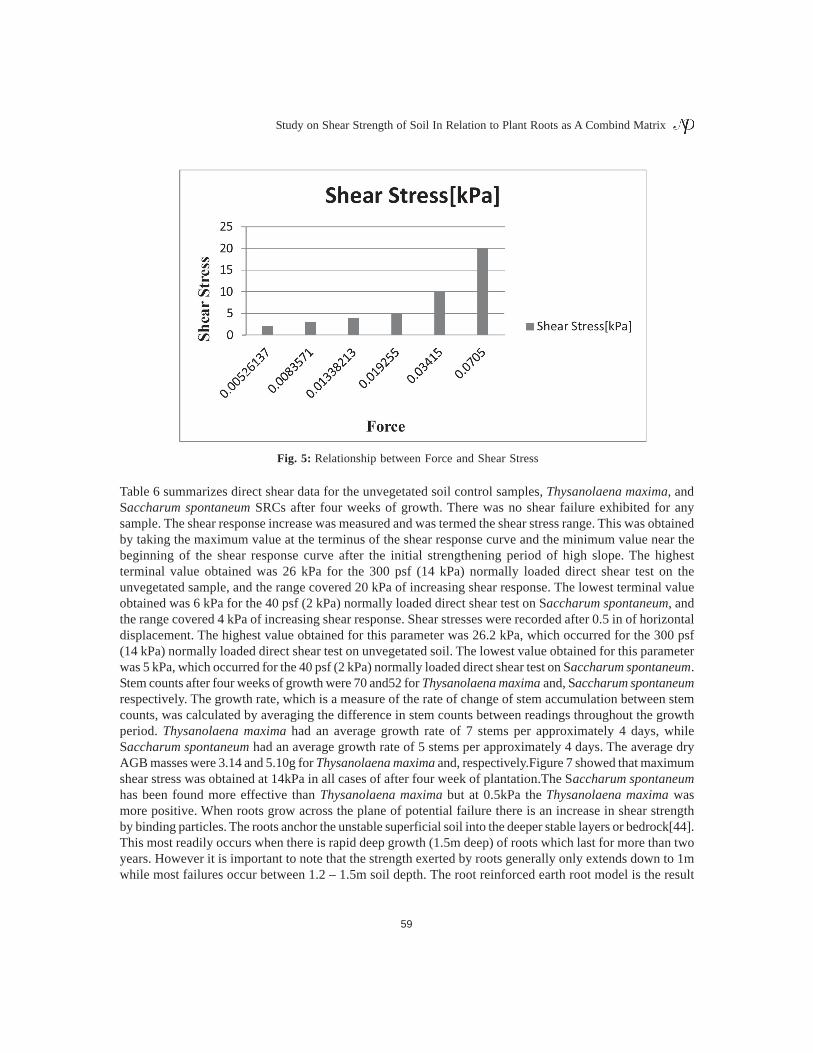
Table 5 shows normal stress values corresponding to fill depths of soils with properties typical of those usedfor reinforcement. For the shearing phase of testing the horizontal displacement rate was set to 0.01 in/min[39] and sheared until the external limit of the shearbox, which is the dual shearing plate assemblyused for direct shear tests [20]. At the depth of 40 inch the stress was observed maximum and minimumwas at 3 inch. Simultaneously maximum shear stress was obtained at 0.0705kN force. There is a directrelationship between force and stress.(Figure 5).
The pull out resistance of a root is the measured resistance of root structure to be pulled out of the groundand is likely to be only a little less than the measured tensile strength of the root which is the roots resistanceto breaking as measured in the laboratory. In the cases where there is no pull out data available the tensilestrength data maybe used as a rough guide to the maximum pull out resistance available[40]. The tensileroot strength of a range of diameters over a range of species has been tested in the laboratory and has beenfound to be approximately 5 – 60MN/m2. In order for the root to actually enhance slope stability the rootmust have sufficient embedment and adhesion with the soil. The way that roots interact with the soil isintricate but for engineering purposes the available force contributions may be measured with in situ pullout tests[40].
% passing and Sieve size Grading Aggregates
Fig. 4: Relationship between Sieve size and passing percentage
58
Jain
Roots that do not have branches generally fail in tension and pull straight out of the ground with onlyminimal resistance. The root reaches its maximum pullout resistance then rapidly fails at a weak point. Theroot easily resistance. The root easily slips out of the soil due to the gradual tapering (progressive decreasein root diameter along its length) which means that as the root is pulled out it is moving through a spacethat is larger than its diameter which consequently has no further bonds or interaction with the surroundingsoil[41].Forked roots require a greater force to be pulled out as the cavity above the fork is thinner than theroot which is trying to move through the cavity, this can then result in deformation of the soil as the rootmoves through the soil41.Roots that have multiple branches or forked branches also can undergo tensilefailure but predominantly fail in stages as each branch breaks within the soil. These roots break withincreasingly applied force in stages in the form of stepped peaks corresponding to the progressive breakingof roots of greater diameters. The root progressively releases its bonds with the soil until final tensilefailure[41]. Norris[41] observed that the pull out resistance of roots are affected by intra species differences,inter-species variations and root size (diameter) in a similar as way as root tensile strength varies (asmeasured in the laboratory). In the pull out test the applied force acting on the root acts across a larger rootarea, which involves multiple branches, longer lengths than the short (approximately 150mm) length ofroot used in tensile strength tests. In pull out test the root is likely to fail at weak points such as branchingpoints, nodes or damaged areas. Norris( 2005)[41]showed that there is a positive correlation betweenmaximum root pull out resistance and root diameter for root. Smaller diameter roots had a lower pull outresistance or breaking force than the larger diameter roots. Vegetation can also be used to control watererosion by limiting surface processes such as sheet wash and overland flow.[42,43]. Vegetation can providea considerable contribution to the stability of slope through enhancing soil cohesion. This cohesion isdependent upon the morphological characteristics of root systems and the tensile strength of single roots[44].
Table 5: Normal Stress Calculations
Fill Depth Diameter Area Volume Bulk Density Force Stress
in in in2 m2 in3 m3 kN/m3 kN kPa
3 2.0 4.50 0.00250 25 0.00030 15 0.005261374 26 2.0 4.50 0.00250 27 0.00040 15 0.0083571 39 2.0 4.50 0.00250 35 0.00060 15 0.01338213 412 2.0 4.50 0.00250 50 0.00090 15 0.019255 520 2.0 4.50 0.00250 110 0.00185 15 0.03415 1040 2.0 4.50 0.00250 230 0.00375 15 0.0705 20
Table 6: Four Week Direct Shear Test Results
Parameter Thysanolaena maxima Saccharum spontaneum Unvegetated SoilNormal Loading [kPa] Normal Loading [kPa] Normal Loading [kPa]
2 5 14 2 5 14 2 5 14Shear Stress Range[kPa] 8 12 17 6 16 19 12 18 21Shear Stress at 0.5 in[kPa] 9 14 20 5 16 18 12.2 20.4 26.2Stem counta[stems] - 70 - - 52 - - - -Growth rateb[stems] - 7 - - 5 - - - -Dry AGB[g] 3.14 3.85 3.02 6.05 3.43 5.10 - - -
Notes: No shear failure was observed for any samplea = stem count on extraction date for both traysb = measure of rate of change of new stem growth for an interval of approximately 4 days (between counts)
59
Study on Shear Strength of Soil In Relation to Plant Roots as A Combind Matrix
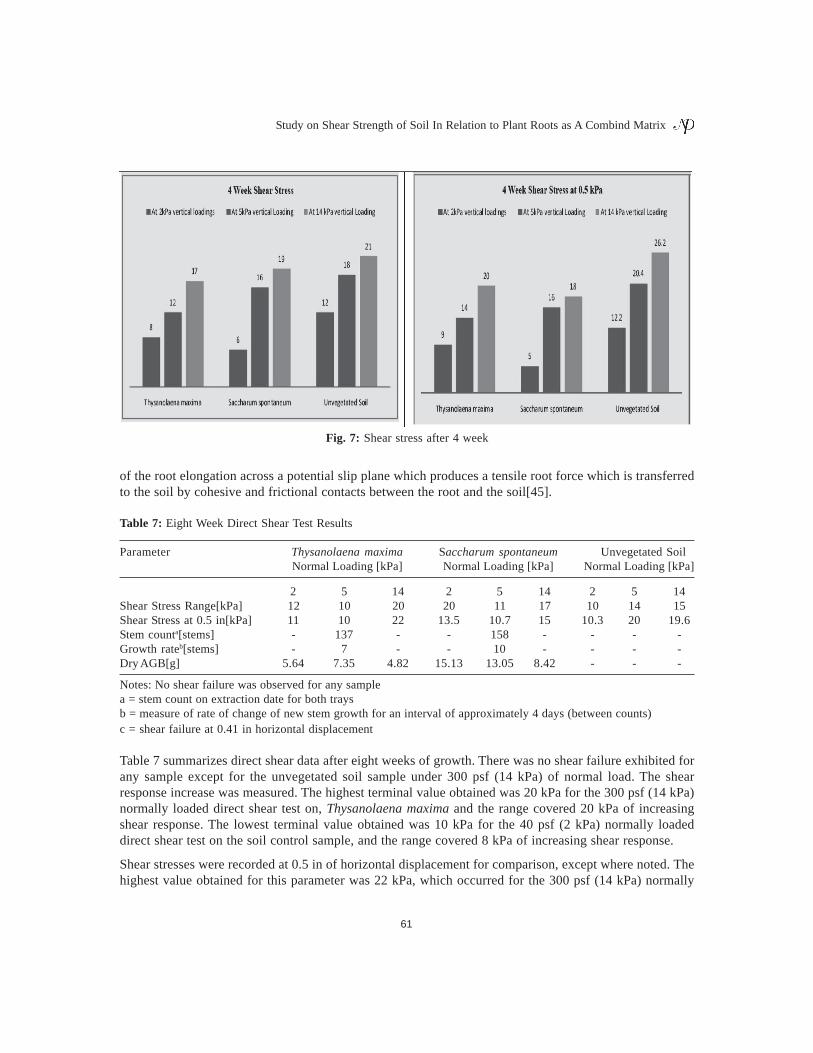
Table 6 summarizes direct shear data for the unvegetated soil control samples, Thysanolaena maxima, andSaccharum spontaneum SRCs after four weeks of growth. There was no shear failure exhibited for anysample. The shear response increase was measured and was termed the shear stress range. This was obtainedby taking the maximum value at the terminus of the shear response curve and the minimum value near thebeginning of the shear response curve after the initial strengthening period of high slope. The highestterminal value obtained was 26 kPa for the 300 psf (14 kPa) normally loaded direct shear test on theunvegetated sample, and the range covered 20 kPa of increasing shear response. The lowest terminal valueobtained was 6 kPa for the 40 psf (2 kPa) normally loaded direct shear test on Saccharum spontaneum, andthe range covered 4 kPa of increasing shear response. Shear stresses were recorded after 0.5 in of horizontaldisplacement. The highest value obtained for this parameter was 26.2 kPa, which occurred for the 300 psf(14 kPa) normally loaded direct shear test on unvegetated soil. The lowest value obtained for this parameterwas 5 kPa, which occurred for the 40 psf (2 kPa) normally loaded direct shear test on Saccharum spontaneum.Stem counts after four weeks of growth were 70 and52 for Thysanolaena maxima and, Saccharum spontaneumrespectively. The growth rate, which is a measure of the rate of change of stem accumulation between stemcounts, was calculated by averaging the difference in stem counts between readings throughout the growthperiod. Thysanolaena maxima had an average growth rate of 7 stems per approximately 4 days, whileSaccharum spontaneum had an average growth rate of 5 stems per approximately 4 days. The average dryAGB masses were 3.14 and 5.10g for Thysanolaena maxima and, respectively.Figure 7 showed that maximumshear stress was obtained at 14kPa in all cases of after four week of plantation.The Saccharum spontaneumhas been found more effective than Thysanolaena maxima but at 0.5kPa the Thysanolaena maxima wasmore positive. When roots grow across the plane of potential failure there is an increase in shear strengthby binding particles. The roots anchor the unstable superficial soil into the deeper stable layers or bedrock[44].This most readily occurs when there is rapid deep growth (1.5m deep) of roots which last for more than twoyears. However it is important to note that the strength exerted by roots generally only extends down to 1mwhile most failures occur between 1.2 – 1.5m soil depth. The root reinforced earth root model is the result
Fig. 5: Relationship between Force and Shear Stress
60
Jain
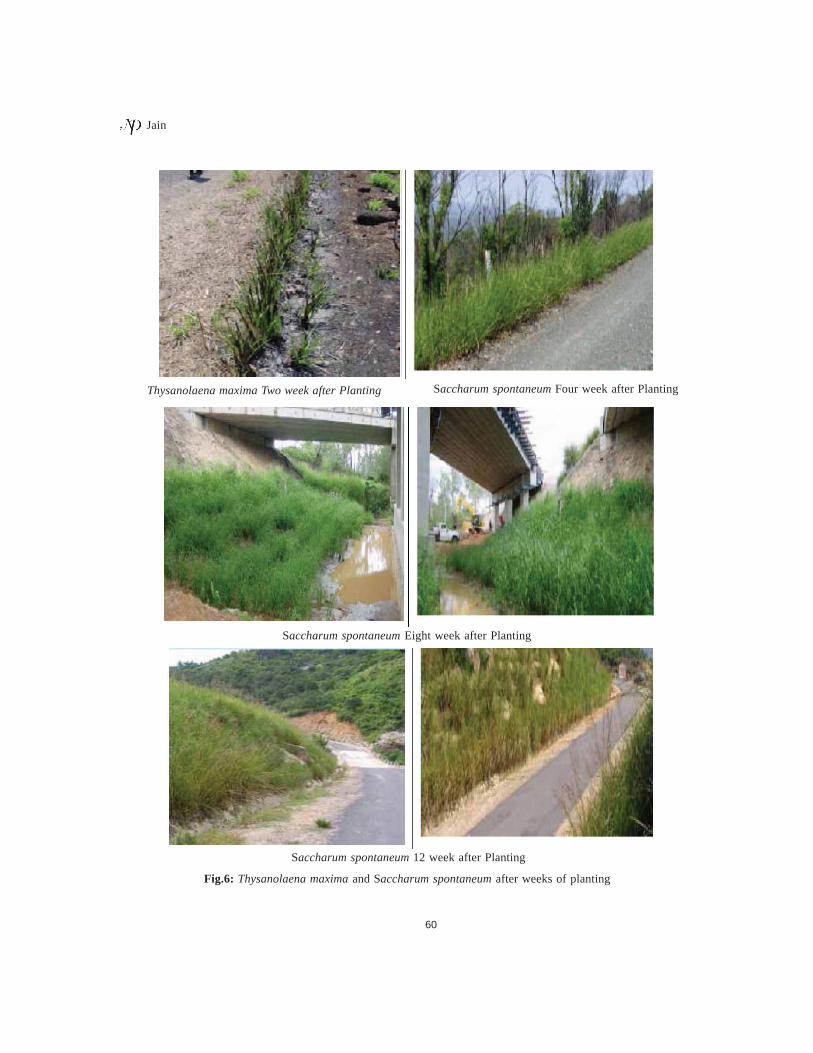
Thysanolaena maxima Two week after Planting Saccharum spontaneum Four week after Planting
Saccharum spontaneum Eight week after Planting
Saccharum spontaneum 12 week after Planting
Fig.6: Thysanolaena maxima and Saccharum spontaneum after weeks of planting
61
Study on Shear Strength of Soil In Relation to Plant Roots as A Combind Matrix
of the root elongation across a potential slip plane which produces a tensile root force which is transferredto the soil by cohesive and frictional contacts between the root and the soil[45].
Table 7: Eight Week Direct Shear Test Results
Parameter Thysanolaena maxima Saccharum spontaneum Unvegetated SoilNormal Loading [kPa] Normal Loading [kPa] Normal Loading [kPa]
2 5 14 2 5 14 2 5 14Shear Stress Range[kPa] 12 10 20 20 11 17 10 14 15Shear Stress at 0.5 in[kPa] 11 10 22 13.5 10.7 15 10.3 20 19.6Stem counta[stems] - 137 - - 158 - - - -Growth rateb[stems] - 7 - - 10 - - - -Dry AGB[g] 5.64 7.35 4.82 15.13 13.05 8.42 - - -
Notes: No shear failure was observed for any samplea = stem count on extraction date for both traysb = measure of rate of change of new stem growth for an interval of approximately 4 days (between counts)c = shear failure at 0.41 in horizontal displacement
Table 7 summarizes direct shear data after eight weeks of growth. There was no shear failure exhibited forany sample except for the unvegetated soil sample under 300 psf (14 kPa) of normal load. The shearresponse increase was measured. The highest terminal value obtained was 20 kPa for the 300 psf (14 kPa)normally loaded direct shear test on, Thysanolaena maxima and the range covered 20 kPa of increasingshear response. The lowest terminal value obtained was 10 kPa for the 40 psf (2 kPa) normally loadeddirect shear test on the soil control sample, and the range covered 8 kPa of increasing shear response.
Shear stresses were recorded at 0.5 in of horizontal displacement for comparison, except where noted. Thehighest value obtained for this parameter was 22 kPa, which occurred for the 300 psf (14 kPa) normally
Fig. 7: Shear stress after 4 week
62
Jain
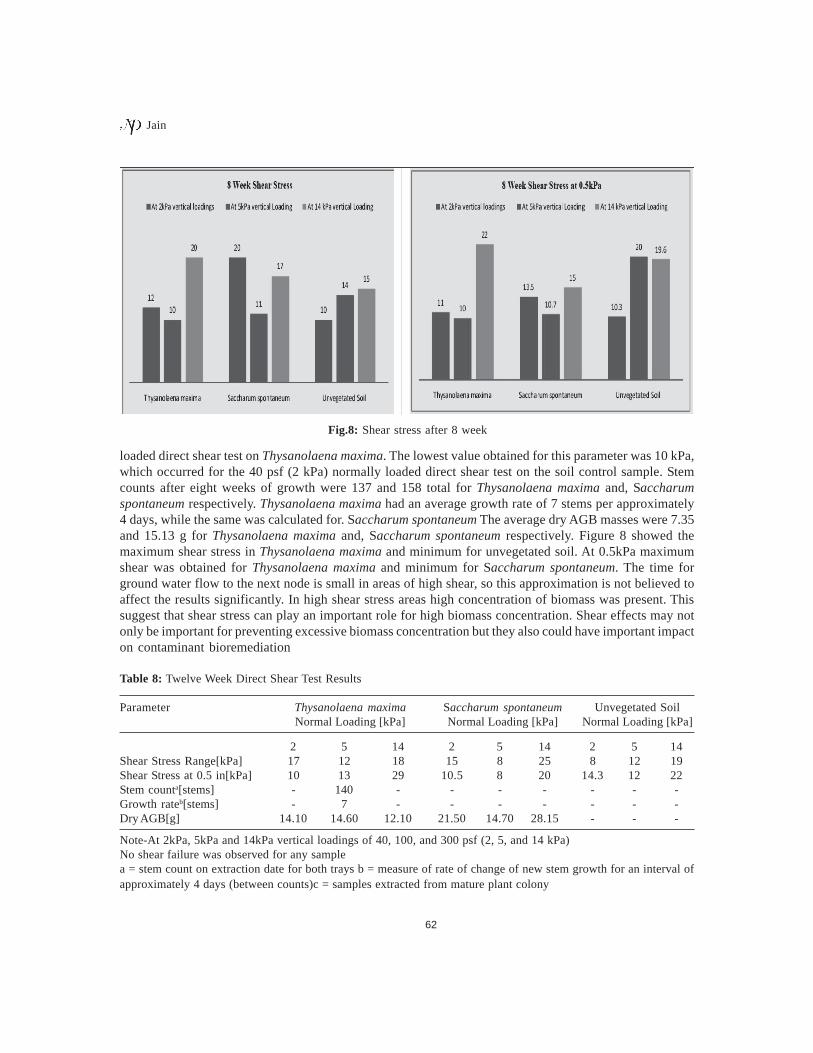
loaded direct shear test on Thysanolaena maxima. The lowest value obtained for this parameter was 10 kPa,which occurred for the 40 psf (2 kPa) normally loaded direct shear test on the soil control sample. Stemcounts after eight weeks of growth were 137 and 158 total for Thysanolaena maxima and, Saccharumspontaneum respectively. Thysanolaena maxima had an average growth rate of 7 stems per approximately4 days, while the same was calculated for. Saccharum spontaneum The average dry AGB masses were 7.35and 15.13 g for Thysanolaena maxima and, Saccharum spontaneum respectively. Figure 8 showed themaximum shear stress in Thysanolaena maxima and minimum for unvegetated soil. At 0.5kPa maximumshear was obtained for Thysanolaena maxima and minimum for Saccharum spontaneum. The time forground water flow to the next node is small in areas of high shear, so this approximation is not believed toaffect the results significantly. In high shear stress areas high concentration of biomass was present. Thissuggest that shear stress can play an important role for high biomass concentration. Shear effects may notonly be important for preventing excessive biomass concentration but they also could have important impacton contaminant bioremediation
Table 8: Twelve Week Direct Shear Test Results
Parameter Thysanolaena maxima Saccharum spontaneum Unvegetated SoilNormal Loading [kPa] Normal Loading [kPa] Normal Loading [kPa]
2 5 14 2 5 14 2 5 14Shear Stress Range[kPa] 17 12 18 15 8 25 8 12 19Shear Stress at 0.5 in[kPa] 10 13 29 10.5 8 20 14.3 12 22Stem counta[stems] - 140 - - - - - - -Growth rateb[stems] - 7 - - - - - - -Dry AGB[g] 14.10 14.60 12.10 21.50 14.70 28.15 - - -
Note-At 2kPa, 5kPa and 14kPa vertical loadings of 40, 100, and 300 psf (2, 5, and 14 kPa)No shear failure was observed for any samplea = stem count on extraction date for both trays b = measure of rate of change of new stem growth for an interval ofapproximately 4 days (between counts)c = samples extracted from mature plant colony
Fig.8: Shear stress after 8 week
63
Study on Shear Strength of Soil In Relation to Plant Roots as A Combind Matrix
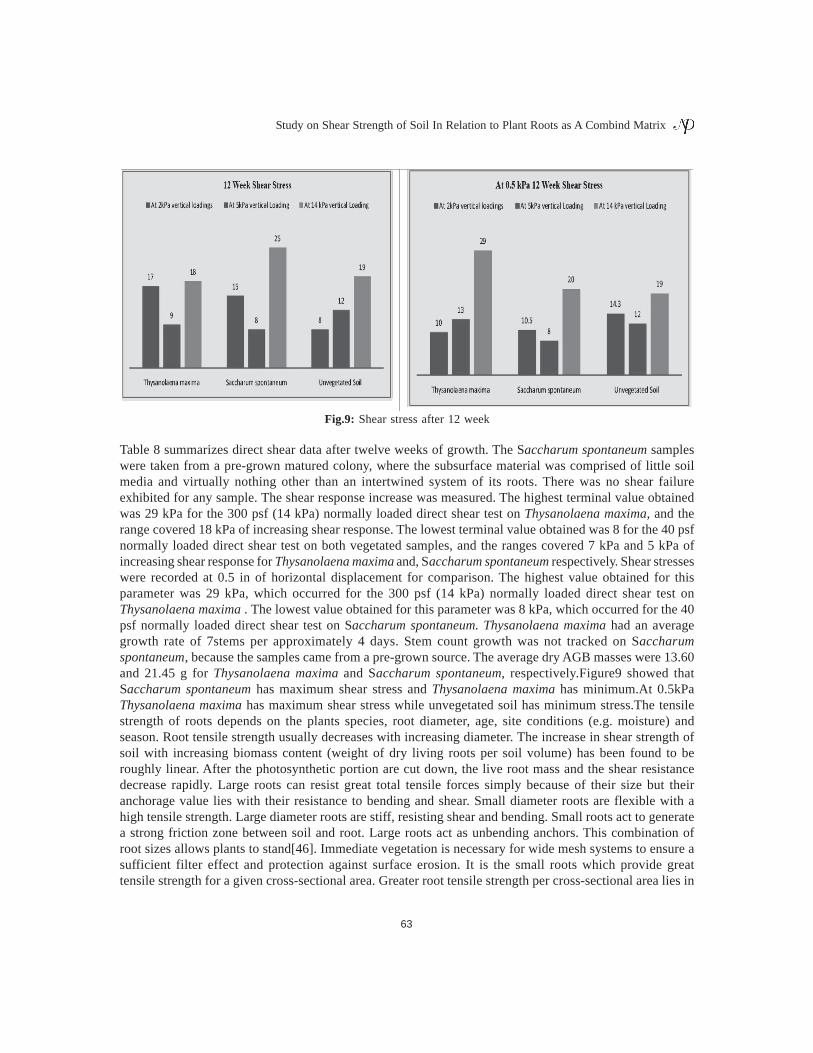
Table 8 summarizes direct shear data after twelve weeks of growth. The Saccharum spontaneum sampleswere taken from a pre-grown matured colony, where the subsurface material was comprised of little soilmedia and virtually nothing other than an intertwined system of its roots. There was no shear failureexhibited for any sample. The shear response increase was measured. The highest terminal value obtainedwas 29 kPa for the 300 psf (14 kPa) normally loaded direct shear test on Thysanolaena maxima, and therange covered 18 kPa of increasing shear response. The lowest terminal value obtained was 8 for the 40 psfnormally loaded direct shear test on both vegetated samples, and the ranges covered 7 kPa and 5 kPa ofincreasing shear response for Thysanolaena maxima and, Saccharum spontaneum respectively. Shear stresseswere recorded at 0.5 in of horizontal displacement for comparison. The highest value obtained for thisparameter was 29 kPa, which occurred for the 300 psf (14 kPa) normally loaded direct shear test onThysanolaena maxima . The lowest value obtained for this parameter was 8 kPa, which occurred for the 40psf normally loaded direct shear test on Saccharum spontaneum. Thysanolaena maxima had an averagegrowth rate of 7stems per approximately 4 days. Stem count growth was not tracked on Saccharumspontaneum, because the samples came from a pre-grown source. The average dry AGB masses were 13.60and 21.45 g for Thysanolaena maxima and Saccharum spontaneum, respectively.Figure9 showed thatSaccharum spontaneum has maximum shear stress and Thysanolaena maxima has minimum.At 0.5kPaThysanolaena maxima has maximum shear stress while unvegetated soil has minimum stress.The tensilestrength of roots depends on the plants species, root diameter, age, site conditions (e.g. moisture) andseason. Root tensile strength usually decreases with increasing diameter. The increase in shear strength ofsoil with increasing biomass content (weight of dry living roots per soil volume) has been found to beroughly linear. After the photosynthetic portion are cut down, the live root mass and the shear resistancedecrease rapidly. Large roots can resist great total tensile forces simply because of their size but theiranchorage value lies with their resistance to bending and shear. Small diameter roots are flexible with ahigh tensile strength. Large diameter roots are stiff, resisting shear and bending. Small roots act to generatea strong friction zone between soil and root. Large roots act as unbending anchors. This combination ofroot sizes allows plants to stand[46]. Immediate vegetation is necessary for wide mesh systems to ensure asufficient filter effect and protection against surface erosion. It is the small roots which provide greattensile strength for a given cross-sectional area. Greater root tensile strength per cross-sectional area lies in
Fig.9: Shear stress after 12 week
64
Jain
smaller roots, while greater root stiffness lies with larger roots. Both rooting depth and length maximizeroot / soil friction, mass of soil held above the roots, and resistance to failure. The process of shear stressmay have a significant impact on both the growth and distribution of a large biomass population. Detachmentof biomass from the soil grains could act to keep the biomass concentrations lower in the area of high shear.Detailed analysis of the shear stress at the field scale is impractical since that would require knowing theflow field everywhere at the pore scale. Principles used in flocculation studies [47]can be used to study theshear of biomass from soil particles and it can act as indicator of high shear stress.
Shear Strength Benefit Index
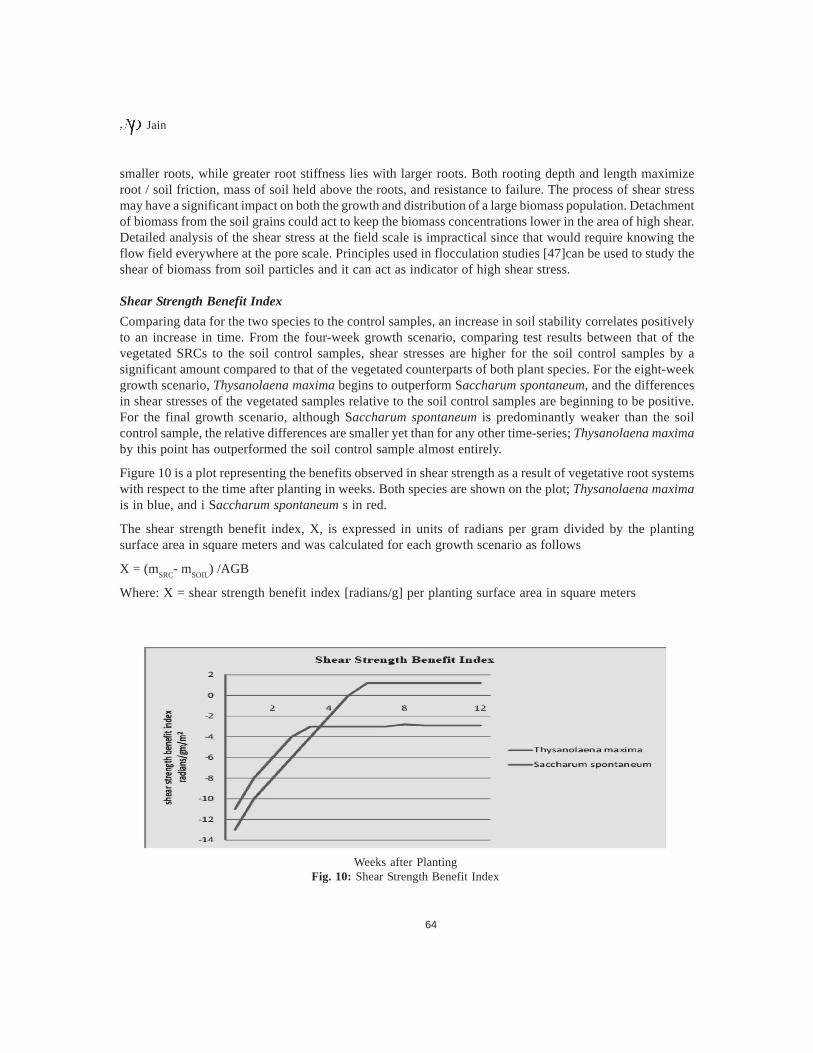
Comparing data for the two species to the control samples, an increase in soil stability correlates positivelyto an increase in time. From the four-week growth scenario, comparing test results between that of thevegetated SRCs to the soil control samples, shear stresses are higher for the soil control samples by asignificant amount compared to that of the vegetated counterparts of both plant species. For the eight-weekgrowth scenario, Thysanolaena maxima begins to outperform Saccharum spontaneum, and the differencesin shear stresses of the vegetated samples relative to the soil control samples are beginning to be positive.For the final growth scenario, although Saccharum spontaneum is predominantly weaker than the soilcontrol sample, the relative differences are smaller yet than for any other time-series; Thysanolaena maximaby this point has outperformed the soil control sample almost entirely.
Figure 10 is a plot representing the benefits observed in shear strength as a result of vegetative root systemswith respect to the time after planting in weeks. Both species are shown on the plot; Thysanolaena maximais in blue, and i Saccharum spontaneum s in red.
The shear strength benefit index, X, is expressed in units of radians per gram divided by the plantingsurface area in square meters and was calculated for each growth scenario as follows
X = (mSRC
- mSOIL
) /AGB
Where: X = shear strength benefit index [radians/g] per planting surface area in square meters
Weeks after PlantingFig. 10: Shear Strength Benefit Index
65
Study on Shear Strength of Soil In Relation to Plant Roots as A Combind Matrix
mSRC = relationship of increase in shear stress to effective stress for vegetated soil-root composite [radians],as defined below m
SOIL = relationship of increase in shear stress to effective stress for soil control sample
[radians], as defined below
m = tan-1(∆τ / ∆σ)
Where: Äô = change in shear stress for dataset
∆σ = change in effective stress for dataset
Field Investigation
To evaluate the shear strength properties of an actual area was visited and samples were obtained in situ.
Table 9: Shear strength increase in soil profile due to root penetration of two-year-old plants with spacing 15 cm in ahedgerow of 50 cm length
Depth(m) DR(kg/m3) AR(mm2) Ar/AX 10-4 ∆S(kN/m2) % ∆S ∆S(kN/m2)
0.25 1.487 350.0 3.11 8.63 89.9 5.190.50 0.691 182.2 1.69 4.07 40.1 4.770.75 0.513 148.8 1.18 3.34 36.1 5.121.00 0.401 111.6 1.11 2.77 25.9 4.991.25 0.200 74.3 0.82 1.89 19.9 5.651.50 0.142 55.6 0.57 1.18 13.2 5.06
DR – bulk weight of root in unit soil volume, AR – root area on shear surface,A – area of the shear surface, ÄS – shear strength increase in soil due to roots,DS - shear strength increase in soil due to 1 cm2 root area.
Root Area
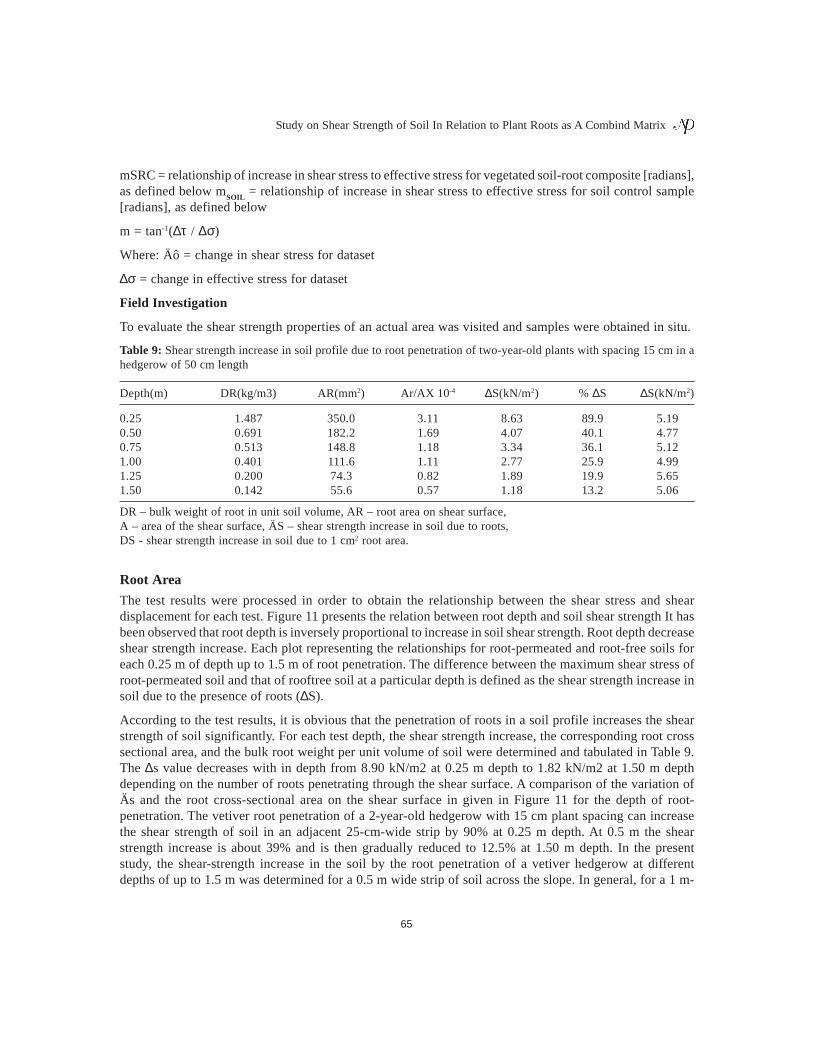
The test results were processed in order to obtain the relationship between the shear stress and sheardisplacement for each test. Figure 11 presents the relation between root depth and soil shear strength It hasbeen observed that root depth is inversely proportional to increase in soil shear strength. Root depth decreaseshear strength increase. Each plot representing the relationships for root-permeated and root-free soils foreach 0.25 m of depth up to 1.5 m of root penetration. The difference between the maximum shear stress ofroot-permeated soil and that of rooftree soil at a particular depth is defined as the shear strength increase insoil due to the presence of roots (∆S).
According to the test results, it is obvious that the penetration of roots in a soil profile increases the shearstrength of soil significantly. For each test depth, the shear strength increase, the corresponding root crosssectional area, and the bulk root weight per unit volume of soil were determined and tabulated in Table 9.The ∆s value decreases with in depth from 8.90 kN/m2 at 0.25 m depth to 1.82 kN/m2 at 1.50 m depthdepending on the number of roots penetrating through the shear surface. A comparison of the variation ofÄs and the root cross-sectional area on the shear surface in given in Figure 11 for the depth of root-penetration. The vetiver root penetration of a 2-year-old hedgerow with 15 cm plant spacing can increasethe shear strength of soil in an adjacent 25-cm-wide strip by 90% at 0.25 m depth. At 0.5 m the shearstrength increase is about 39% and is then gradually reduced to 12.5% at 1.50 m depth. In the presentstudy, the shear-strength increase in the soil by the root penetration of a vetiver hedgerow at differentdepths of up to 1.5 m was determined for a 0.5 m wide strip of soil across the slope. In general, for a 1 m-
66
Jain
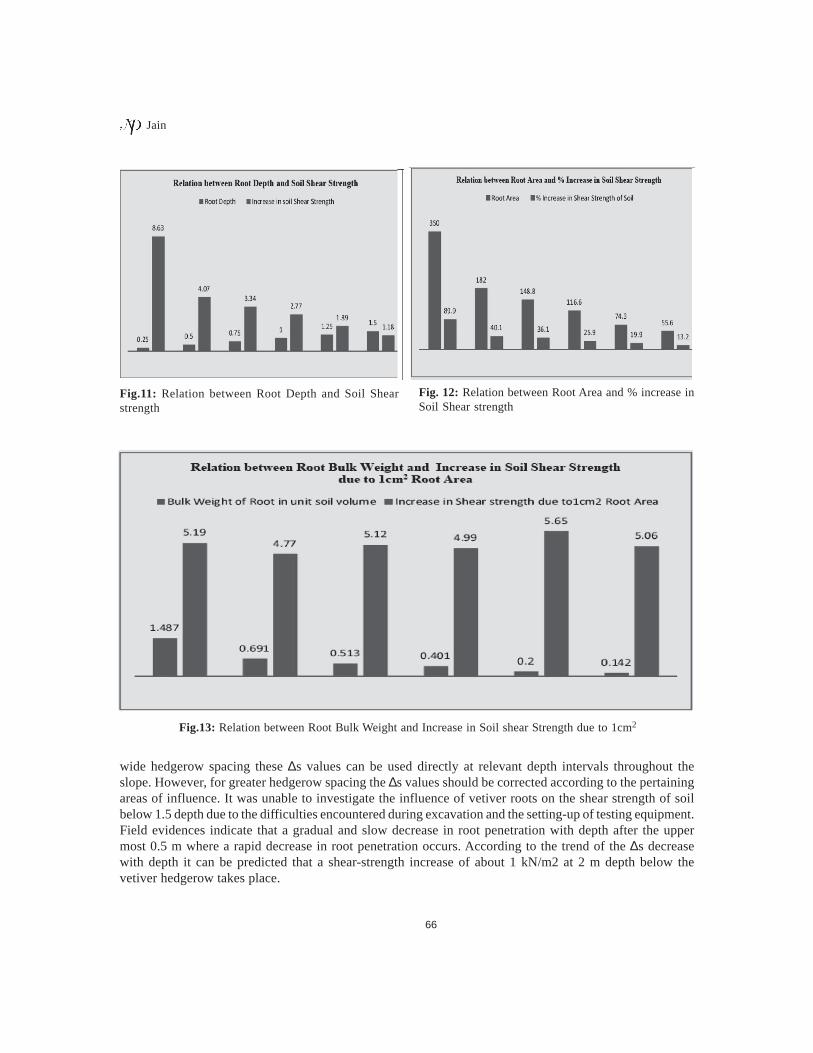
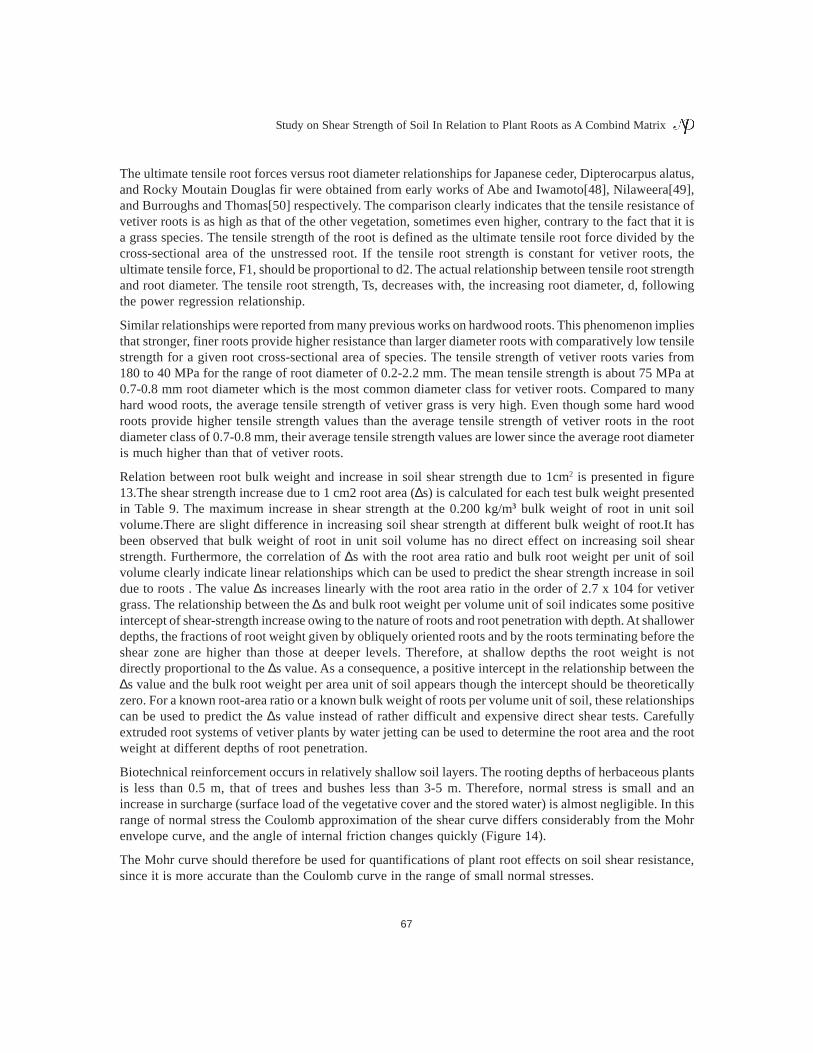
Fig.11: Relation between Root Depth and Soil Shearstrength
Fig. 12: Relation between Root Area and % increase inSoil Shear strength
Fig.13: Relation between Root Bulk Weight and Increase in Soil shear Strength due to 1cm2
wide hedgerow spacing these ∆s values can be used directly at relevant depth intervals throughout theslope. However, for greater hedgerow spacing the ∆s values should be corrected according to the pertainingareas of influence. It was unable to investigate the influence of vetiver roots on the shear strength of soilbelow 1.5 depth due to the difficulties encountered during excavation and the setting-up of testing equipment.Field evidences indicate that a gradual and slow decrease in root penetration with depth after the uppermost 0.5 m where a rapid decrease in root penetration occurs. According to the trend of the ∆s decreasewith depth it can be predicted that a shear-strength increase of about 1 kN/m2 at 2 m depth below thevetiver hedgerow takes place.
67
Study on Shear Strength of Soil In Relation to Plant Roots as A Combind Matrix
The ultimate tensile root forces versus root diameter relationships for Japanese ceder, Dipterocarpus alatus,and Rocky Moutain Douglas fir were obtained from early works of Abe and Iwamoto[48], Nilaweera[49],and Burroughs and Thomas[50] respectively. The comparison clearly indicates that the tensile resistance ofvetiver roots is as high as that of the other vegetation, sometimes even higher, contrary to the fact that it isa grass species. The tensile strength of the root is defined as the ultimate tensile root force divided by thecross-sectional area of the unstressed root. If the tensile root strength is constant for vetiver roots, theultimate tensile force, F1, should be proportional to d2. The actual relationship between tensile root strengthand root diameter. The tensile root strength, Ts, decreases with, the increasing root diameter, d, followingthe power regression relationship.
Similar relationships were reported from many previous works on hardwood roots. This phenomenon impliesthat stronger, finer roots provide higher resistance than larger diameter roots with comparatively low tensilestrength for a given root cross-sectional area of species. The tensile strength of vetiver roots varies from180 to 40 MPa for the range of root diameter of 0.2-2.2 mm. The mean tensile strength is about 75 MPa at0.7-0.8 mm root diameter which is the most common diameter class for vetiver roots. Compared to manyhard wood roots, the average tensile strength of vetiver grass is very high. Even though some hard woodroots provide higher tensile strength values than the average tensile strength of vetiver roots in the rootdiameter class of 0.7-0.8 mm, their average tensile strength values are lower since the average root diameteris much higher than that of vetiver roots.
Relation between root bulk weight and increase in soil shear strength due to 1cm2 is presented in figure13.The shear strength increase due to 1 cm2 root area (∆s) is calculated for each test bulk weight presentedin Table 9. The maximum increase in shear strength at the 0.200 kg/m3 bulk weight of root in unit soilvolume.There are slight difference in increasing soil shear strength at different bulk weight of root.It hasbeen observed that bulk weight of root in unit soil volume has no direct effect on increasing soil shearstrength. Furthermore, the correlation of ∆s with the root area ratio and bulk root weight per unit of soilvolume clearly indicate linear relationships which can be used to predict the shear strength increase in soildue to roots . The value ∆s increases linearly with the root area ratio in the order of 2.7 x 10⁴ for vetivergrass. The relationship between the ∆s and bulk root weight per volume unit of soil indicates some positiveintercept of shear-strength increase owing to the nature of roots and root penetration with depth. At shallowerdepths, the fractions of root weight given by obliquely oriented roots and by the roots terminating before theshear zone are higher than those at deeper levels. Therefore, at shallow depths the root weight is notdirectly proportional to the ∆s value. As a consequence, a positive intercept in the relationship between the∆s value and the bulk root weight per area unit of soil appears though the intercept should be theoreticallyzero. For a known root-area ratio or a known bulk weight of roots per volume unit of soil, these relationshipscan be used to predict the ∆s value instead of rather difficult and expensive direct shear tests. Carefullyextruded root systems of vetiver plants by water jetting can be used to determine the root area and the rootweight at different depths of root penetration.
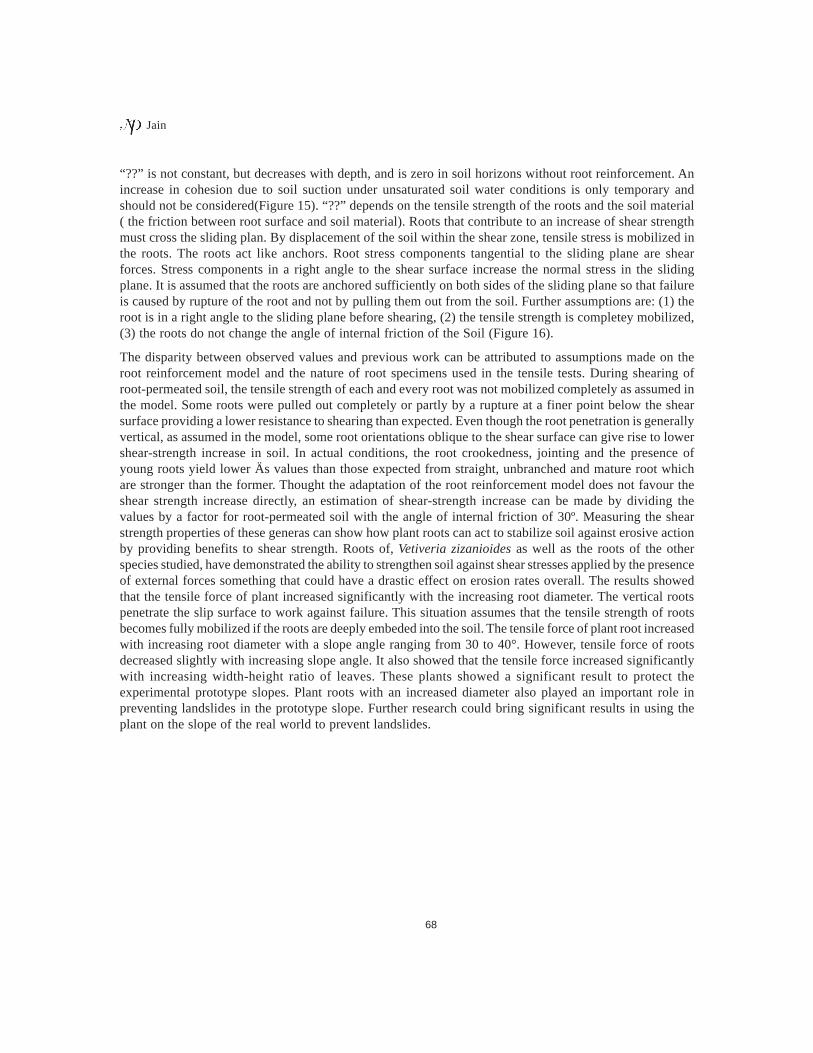
Biotechnical reinforcement occurs in relatively shallow soil layers. The rooting depths of herbaceous plantsis less than 0.5 m, that of trees and bushes less than 3-5 m. Therefore, normal stress is small and anincrease in surcharge (surface load of the vegetative cover and the stored water) is almost negligible. In thisrange of normal stress the Coulomb approximation of the shear curve differs considerably from the Mohrenvelope curve, and the angle of internal friction changes quickly (Figure 14).
The Mohr curve should therefore be used for quantifications of plant root effects on soil shear resistance,since it is more accurate than the Coulomb curve in the range of small normal stresses.
68
Jain
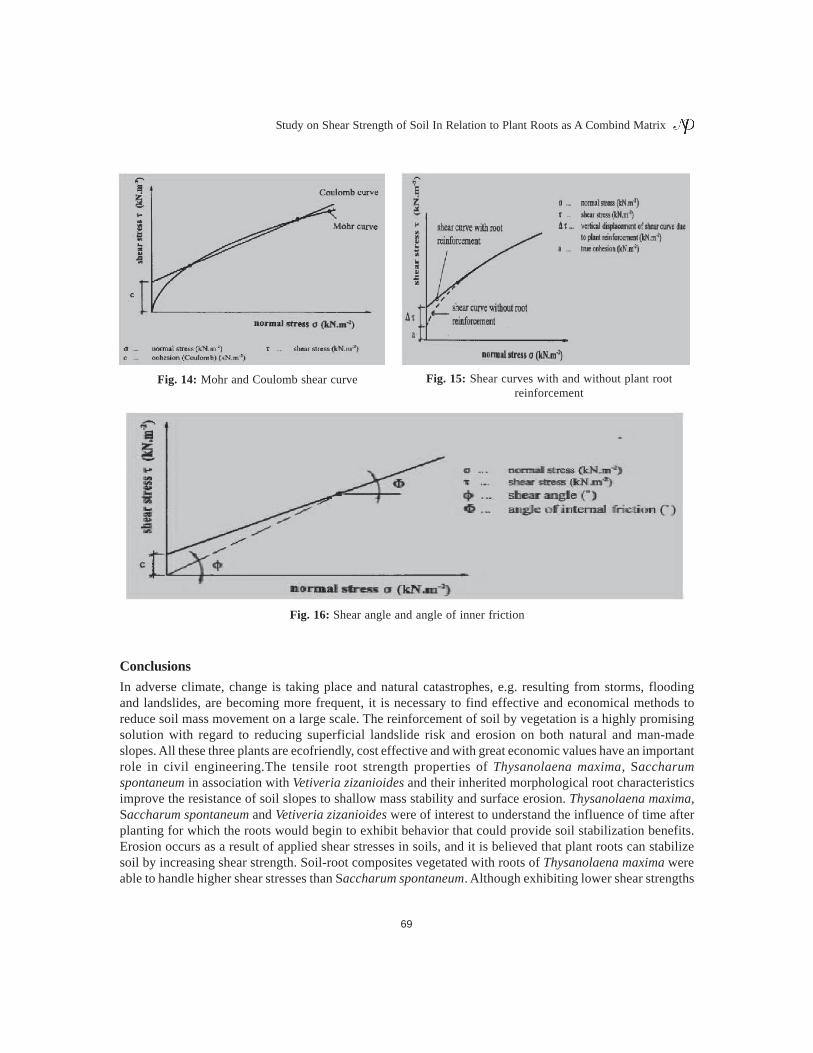
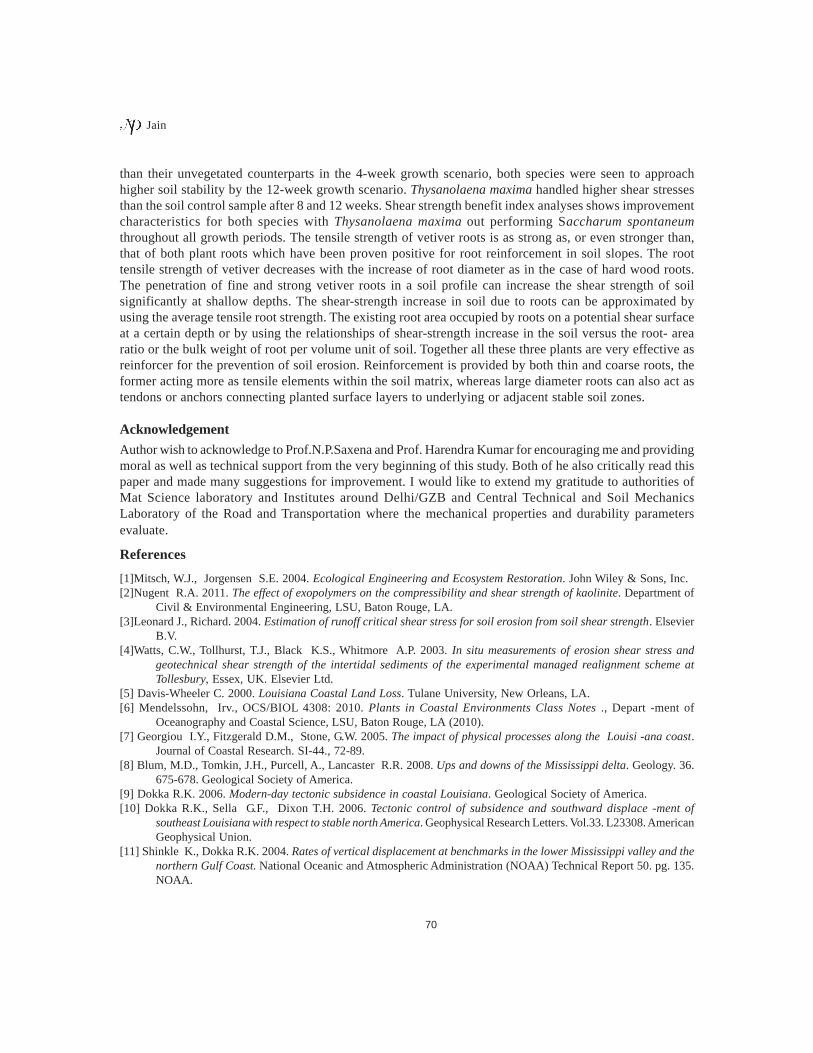
“??” is not constant, but decreases with depth, and is zero in soil horizons without root reinforcement. Anincrease in cohesion due to soil suction under unsaturated soil water conditions is only temporary andshould not be considered(Figure 15). “??” depends on the tensile strength of the roots and the soil material( the friction between root surface and soil material). Roots that contribute to an increase of shear strengthmust cross the sliding plan. By displacement of the soil within the shear zone, tensile stress is mobilized inthe roots. The roots act like anchors. Root stress components tangential to the sliding plane are shearforces. Stress components in a right angle to the shear surface increase the normal stress in the slidingplane. It is assumed that the roots are anchored sufficiently on both sides of the sliding plane so that failureis caused by rupture of the root and not by pulling them out from the soil. Further assumptions are: (1) theroot is in a right angle to the sliding plane before shearing, (2) the tensile strength is completey mobilized,(3) the roots do not change the angle of internal friction of the Soil (Figure 16).
The disparity between observed values and previous work can be attributed to assumptions made on theroot reinforcement model and the nature of root specimens used in the tensile tests. During shearing ofroot-permeated soil, the tensile strength of each and every root was not mobilized completely as assumed inthe model. Some roots were pulled out completely or partly by a rupture at a finer point below the shearsurface providing a lower resistance to shearing than expected. Even though the root penetration is generallyvertical, as assumed in the model, some root orientations oblique to the shear surface can give rise to lowershear-strength increase in soil. In actual conditions, the root crookedness, jointing and the presence ofyoung roots yield lower Äs values than those expected from straight, unbranched and mature root whichare stronger than the former. Thought the adaptation of the root reinforcement model does not favour theshear strength increase directly, an estimation of shear-strength increase can be made by dividing thevalues by a factor for root-permeated soil with the angle of internal friction of 30º. Measuring the shearstrength properties of these generas can show how plant roots can act to stabilize soil against erosive actionby providing benefits to shear strength. Roots of, Vetiveria zizanioides as well as the roots of the otherspecies studied, have demonstrated the ability to strengthen soil against shear stresses applied by the presenceof external forces something that could have a drastic effect on erosion rates overall. The results showedthat the tensile force of plant increased significantly with the increasing root diameter. The vertical rootspenetrate the slip surface to work against failure. This situation assumes that the tensile strength of rootsbecomes fully mobilized if the roots are deeply embeded into the soil. The tensile force of plant root increasedwith increasing root diameter with a slope angle ranging from 30 to 40°. However, tensile force of rootsdecreased slightly with increasing slope angle. It also showed that the tensile force increased significantlywith increasing width-height ratio of leaves. These plants showed a significant result to protect theexperimental prototype slopes. Plant roots with an increased diameter also played an important role inpreventing landslides in the prototype slope. Further research could bring significant results in using theplant on the slope of the real world to prevent landslides.
69
Study on Shear Strength of Soil In Relation to Plant Roots as A Combind Matrix
Fig. 15: Shear curves with and without plant rootreinforcement
Fig. 14: Mohr and Coulomb shear curve
Fig. 16: Shear angle and angle of inner friction
Conclusions
In adverse climate, change is taking place and natural catastrophes, e.g. resulting from storms, floodingand landslides, are becoming more frequent, it is necessary to find effective and economical methods toreduce soil mass movement on a large scale. The reinforcement of soil by vegetation is a highly promisingsolution with regard to reducing superficial landslide risk and erosion on both natural and man-madeslopes. All these three plants are ecofriendly, cost effective and with great economic values have an importantrole in civil engineering.The tensile root strength properties of Thysanolaena maxima, Saccharumspontaneum in association with Vetiveria zizanioides and their inherited morphological root characteristicsimprove the resistance of soil slopes to shallow mass stability and surface erosion. Thysanolaena maxima,Saccharum spontaneum and Vetiveria zizanioides were of interest to understand the influence of time afterplanting for which the roots would begin to exhibit behavior that could provide soil stabilization benefits.Erosion occurs as a result of applied shear stresses in soils, and it is believed that plant roots can stabilizesoil by increasing shear strength. Soil-root composites vegetated with roots of Thysanolaena maxima wereable to handle higher shear stresses than Saccharum spontaneum. Although exhibiting lower shear strengths
70
Jain
than their unvegetated counterparts in the 4-week growth scenario, both species were seen to approachhigher soil stability by the 12-week growth scenario. Thysanolaena maxima handled higher shear stressesthan the soil control sample after 8 and 12 weeks. Shear strength benefit index analyses shows improvementcharacteristics for both species with Thysanolaena maxima out performing Saccharum spontaneumthroughout all growth periods. The tensile strength of vetiver roots is as strong as, or even stronger than,that of both plant roots which have been proven positive for root reinforcement in soil slopes. The roottensile strength of vetiver decreases with the increase of root diameter as in the case of hard wood roots.The penetration of fine and strong vetiver roots in a soil profile can increase the shear strength of soilsignificantly at shallow depths. The shear-strength increase in soil due to roots can be approximated byusing the average tensile root strength. The existing root area occupied by roots on a potential shear surfaceat a certain depth or by using the relationships of shear-strength increase in the soil versus the root- arearatio or the bulk weight of root per volume unit of soil. Together all these three plants are very effective asreinforcer for the prevention of soil erosion. Reinforcement is provided by both thin and coarse roots, theformer acting more as tensile elements within the soil matrix, whereas large diameter roots can also act astendons or anchors connecting planted surface layers to underlying or adjacent stable soil zones.
AcknowledgementAuthor wish to acknowledge to Prof.N.P.Saxena and Prof. Harendra Kumar for encouraging me and providingmoral as well as technical support from the very beginning of this study. Both of he also critically read thispaper and made many suggestions for improvement. I would like to extend my gratitude to authorities ofMat Science laboratory and Institutes around Delhi/GZB and Central Technical and Soil MechanicsLaboratory of the Road and Transportation where the mechanical properties and durability parametersevaluate.
References
[1]Mitsch, W.J., Jorgensen S.E. 2004. Ecological Engineering and Ecosystem Restoration. John Wiley & Sons, Inc.[2]Nugent R.A. 2011. The effect of exopolymers on the compressibility and shear strength of kaolinite. Department of
Civil & Environmental Engineering, LSU, Baton Rouge, LA.[3]Leonard J., Richard. 2004. Estimation of runoff critical shear stress for soil erosion from soil shear strength. Elsevier
B.V.[4]Watts, C.W., Tollhurst, T.J., Black K.S., Whitmore A.P. 2003. In situ measurements of erosion shear stress and
geotechnical shear strength of the intertidal sediments of the experimental managed realignment scheme atTollesbury, Essex, UK. Elsevier Ltd.
[5] Davis-Wheeler C. 2000. Louisiana Coastal Land Loss. Tulane University, New Orleans, LA.[6] Mendelssohn, Irv., OCS/BIOL 4308: 2010. Plants in Coastal Environments Class Notes ., Depart -ment of
Oceanography and Coastal Science, LSU, Baton Rouge, LA (2010).[7] Georgiou I.Y., Fitzgerald D.M., Stone, G.W. 2005. The impact of physical processes along the Louisi -ana coast.
Journal of Coastal Research. SI-44., 72-89.[8] Blum, M.D., Tomkin, J.H., Purcell, A., Lancaster R.R. 2008. Ups and downs of the Mississippi delta. Geology. 36.
675-678. Geological Society of America.[9] Dokka R.K. 2006. Modern-day tectonic subsidence in coastal Louisiana. Geological Society of America.[10] Dokka R.K., Sella G.F., Dixon T.H. 2006. Tectonic control of subsidence and southward displace -ment of
southeast Louisiana with respect to stable north America. Geophysical Research Letters. Vol.33. L23308. AmericanGeophysical Union.
[11] Shinkle K., Dokka R.K. 2004. Rates of vertical displacement at benchmarks in the lower Mississippi valley and thenorthern Gulf Coast. National Oceanic and Atmospheric Administration (NOAA) Technical Report 50. pg. 135.NOAA.
71
Study on Shear Strength of Soil In Relation to Plant Roots as A Combind Matrix
[12]Carey B. 2006. Gully erosion. Natural Resources and Water. L81. Natural Resource Sciences, State of Queensland(Department of Natural Resources and Water).
[13]Poesen J.W.A., Torri D.B., Vanwalleghem T. 2006. Chapter 19, gully erosion: procedures to adopt when modellingsoil erosion in landscapes affected by gullying. Handbook of Erosion Modeling. pgs. 367-396. BlackwellPublishing.
[14]Hergault V., Frey P., Métivier F., Barat C., Ducottet C., Bohm T., Ancey C. 2010. Image processing for the studyof bedload transport of two-size spherical particles in a supercritical flow. Springer Verlag.
[15].Briaud J.L., Chen H.C., Li, Y., Nurtjahyo P., Wang, J. 2004. Pier and contraction scour in cohesive soils.National Cooperative Highway Research Program (NCHRP) Report 516. NCHRP, Transportation Research Board.
[16]Teisson C., Fritsch D. 1998. Numerical modeling of suspended sediment transport in the Loire estuary. Proceedingsof the 21st Conference of Coastal Engineering, Torremolinos, Spain. Chapter 201., 2707-2720. Coastal Engineering.
[17]Vanoni V.A. 2006. Chapter 2: Sediment Transport Mechanics. Sedimentation Engineering., 11-175., ASCE.[18]Abdel-Rahman N.M., 1962. Effect of flowing water on cohesive beds. Swiss Federal Institute of Technology, Zurich,
Switzerland.[19]Budhu M. 2007. Soil Mechanics and Foundations, Second Edition. John Wiley & Sons, Inc.[20]Das B.M. 2008. Advanced Soil Mechanics, Third Edition. Taylor & Francis Group.[21]Coduto, D.P. 2001. Foundation Design: Principles and Practices, Second Edition. Prentice-Hall, Inc.[22]Morgan R.P.C. 2005. Chapter 3: Factors influencing erosion. Soil Erosion & Conservation: Third Edition.45-53.
Blackwell Science Ltd.[23]Sundborg A. 1956. The river Klarelven, a study of fluvial processes. Geografiska Annalen, Stock-holm, Sweden.[24]Fan C., Chen Y. 2010. The effect of root architecture on the shearing resistance of root-permeated soils. Elsevier
B.V.[25]Thomas R.E., Pollen-Bankhead N. 2009. Modeling root-reinforcement with a fiber-bundle model and Monte
Carlo simulation. Elsevier B.V.[26]Zhang C.B., Chen L., Liu Y., Ji X., Liu X. 2009. Triaxial compression test of soil–root composites to evaluate
influence of roots on soil shear strength. Elsevier B.V.[27]Zhang X., Wang Y., Wang Y., Xia Y., Wu Y., Chen, L. 2007. Shear strengths of undisturbed and remolded soil
under typical forests in Jinyun Mountain, Chongqing City, southwest China. Higher Education Press and Springer-Verlag.
[28]Abe K., Ziemer R.R. 1991. Effect of tree roots on a shear zone: modeling reinforced shear stress. Can. J. For. Res.21:333-341.
[29]Waldron L. J., Dakessian S. 1981. Soil reinforcement by roots: calculation of increased soil shear resistance fromroot properties. Soil Science. 3:123-131.
[30]Rosati J.D. 2009. Barrier island migration over a consolidating substrate. Department of Oceano -graphy andCoastal Science, LSU, Baton Rouge, LA.
[31]Tengbeh G.T. 1993. The effect of grass roots on shear strength variations with moisture content. Soil Technology .,6:287-295.
[32]Grimhaw R.G. 1994. Vetiver grass-Its use for slope and structural stabilization under tropical and semi-tropicalconditions. Proc. Int Conf.on Vegetation and Slopes, Oxford, England.
[33]Yoou P.K. 1994. Important biological considerations in use of vetiver grass hedgerows (VGHR) for slope protectionsna stabilization. Proc. Int. Conf. on,Vegetation and Slopes, Oxford, England.
[34]ASTM Standard no. D3080. 2004. Standard test method for direct shear test of soils under consoli -dated drainedconditions., ASTM.
[35]Wu T.H., Watson A. 1998. In situ shear tests of soil blocks with roots. Can. Geotech. J., 32(3):455-462.[36]Craul., Phillip J. 1992. Urban Soils in Landscape Design. John Wiley and Sons, Inc. New York, NY.[37]Grabosky J., N. Bassuk N., L. Irwin L., Van Es H. 2001. Shoot and root growth of three tree species in sidewalk
profiles., Journal of Environmental Horticulture, 19(4):206–211.[38]Chang H.T., Rittmann B.E. 1988. Comparative study of biofilm shear loss on different absorptive media., Journal of
water pollution Control Federation., 60(3):362-368.[39]Louisiana State University (LSU) Geotechnical Engineering CE 3350. 2011. Geotechnical Engineering Laboratory
Procedures., Department of Civil & Environmental Engineering, LSU, Baton Rouge, LA.
72
Jain
[40] Greenwood J., Norris J., Wint J. 2004. Assessing the contribution of vegetation to slope stability ., Proceedings ofthe Institution of Civil Engineers., 157(4):199-207.
[41] Norris J. 2005. Root reinforcement by hawthorn and oak roots on a highway cut-slope in Southern England., Plantand Soil., 278(1):43-53.
[42] Cammeraat C.,Van Beek R., Kooijman A. 2005. Vegetation succession and its consequences for slope stability inSE Spain., Plant and Soil., 278(1):135-147.
[43] Morgan R. 2007. Vegetative-based technologies for erosion control in Stokes, A. (eds), Eco- and GroundBioengineering: The use of vegetation to Improve Slope Stability, Dordrecht, London, pp. 265-272.
[44] Mattia C., Bishetti G., Gentile F. 2005. Biotechnical characteristics of root systems of typical Mediter -raneanspecies., Plant and Soil., 278(1):23-32.
[45] Van Beek, L., Wint J., Cammeraat L., Edwards J. 2005. Observation and stimulation of root reinfor -cement onabandoned Mediterranean slopes., Plant & Soil., 278(1):55-74.
[46] Bischetti G B., Chiaradia E A., Simonato Tm., Speziali B., Vitali B., Vullo P., Zocco A. 2005. Root strength androot area of forest species in Lombardy. Plant and Soil ., 278:11–22.
[47] JMM C.E. 1985. Water treatment Principles and design. New York: Wiley Interscience.[48] Abe, K. 1986. Iwamoto M., An evaluation of tree root effect on slope stability by tree root strength. J. Japanese
Forest. Soc., 68:505-510.[49] Nilaweera N.S. 1994. Effects of tree roots on slope stability: The case of Khao Luang Mountain area, Southern
Thailand. Doctoral Dissertation, Diss. No.GT-93-2, Asian Institute of Technology, Bangkok,Thailand.[50] Burroughs E.R., Thomas B.R. 1997. Declining root strength in Douglas fir after felling as a factor in slope
stability. Research Paper INT-190, Intermountain Forest and Range Experiment Station, USForest Service, Ogden,Utah, USA.