Embed Size (px)
Citation preview

570 S. JANGHU et al.: Power Ultrasound Treatment of Honey, Food Technol. Biotechnol. 55 (4) 570-579 (2017)
ISSN 1330-9862 preliminary communicationdoi: 10.17113/ftb.55.04.17.5263
Study on Power Ultrasound Optimization and Its Comparison with Conventional Thermal Processing for
Treatment of Raw Honey
Sandeep Janghu1,2, Manab B. Bera2, Vikas Nanda2 and Ashish Rawson3*1Department of Food Product Development, IIFPT, MoFPI, Thanjavur, 613005 Tamil Nadu, India
2Department of Food Engineering and Technology, SLIET, Longowal, 148106 Sangrur, Punjab, India3Department of Food Safety and Quality Testing, IIFPT, MoFPI, Thanjavur, 613005 Tamil Nadu, India
Received: March 17, 2017Accepted: October 30, 2017
Summary
The present study was done to optimize the power ultrasound processing for maximizing diastase activity of and minimizing hydroxymethylfurfural (HMF) content in honey using re-sponse surface methodology. Experimental design with treatment time (1-15 min), amplitude (20-100 %) and volume (40-80 mL) as independent variables under controlled temperature con-ditions was studied and it was concluded that treatment time of 8 min, amplitude of 60 % and volume of 60 mL give optimal diastase activity and HMF content, i.e. 32.07 Schade units and 30.14 mg/kg, respectively. Further thermal profile analyses were done with initial heating tem-peratures of 65, 75, 85 and 95 ºC until temperature of honey reached up to 65 ºC followed by holding time of 25 min at 65 ºC, and the results were compared with thermal profile of honey treated with optimized power ultrasound. The quality characteristics like moisture, pH, dia-stase activity, HMF content, colour parameters and total colour difference were least affected by optimized power ultrasound treatment. Microbiological analysis also showed lower counts of aerobic mesophilic bacteria and in ultrasonically treated honey than in thermally processed honey samples complete destruction of coliforms, yeasts and moulds. Thus, it was concluded that power ultrasound under suggested operating conditions is an alternative nonthermal pro-cessing technique for honey.
Key words: power ultrasound, amplitude, diastase activity, HMF, thermal processing
Introduction
Honey is a supersaturated sugar solution produced by honeybees from nectar of flowers, which they collect, transform and combine with some enzymes of their own, store and leave in comb to ripen and mature (1). Process-ing of raw honey after harvesting is important from the shelf-life point of view because with the passage of time glucose crystallizes into d-glucose monohydrate crystals and leads to phase separation (2). The upper liquid phase with reduced sugar concentration becomes more suscep-tible to yeast fermentation and ultimately results in off- -flavour or spoilage. The only commercial method that
industries follow for delaying crystallization and destruc-tion of existing microorganisms is thermal pasteurization (3). However, heating above 40 ºC affects the quality and causes protein denaturation and deactivation of several enzymes which are mainly responsible for its functional behaviour. Another negative aspect of thermal process-ing is darkening of honey due to hydroxylmethylfurfural (HMF) formation, which is the breakdown product of fructose in acidic conditions because of nonenzymatic browning or Maillard reaction (4). Light coloured honey usually has milder flavour and higher commercial value than dark coloured honey (5).
*Coresponding author: E-mail: [email protected], [email protected] IDs: 0000-0002-8422-8429 (Janghu), 0000-0002-1870-3164 (Bera), 0000-0003-0947-9065 (Nanda), 0000-0003-3804-3965 (Rawson)
S. JANGHU et al.: Power Ultrasound Treatment of Honey, Food Technol. Biotechnol. 55 (4) 570-579 (2017) 571
Because of high sugar concentration and acidic pH, honey does not allow the growth of most of the microor-ganisms. Therefore, only those who withstand such a high carbohydrate concentration and low pH can be expected to survive in it (6). The major sources of microbial con-tamination of honey include nectar, pollen, dust, air, hon-eybee and postharvest handling. Contamination through postharvest handling can be prevented by good hygienic practices, but the rest is not at all possible to control and may lead to human illness under specific conditions. The microbes mainly present in honey include yeast, fungi, coliforms and some aerobic mesophillic bacteria (7). Some researchers reported the presence of several Bacillus spe-cies in commercial honey samples in Nigeria (8).
Nowadays consumers are more health conscious and concerned about their diet and food nutritional aspects. This has resulted in research focusing on advanced pro-cessing and preservative techniques with reduced impact on the nutrients and overall quality of the food (9-11). That is why nonthermal or minimal processing techniques like power ultrasound are gaining more importance (12). Moreover, ultrasound processing has been identified as a green technology in food industry with varied functions such as effective mixing, faster energy and mass transfer, reduced thermal and concentration gradients, reduced temperature, selective extraction, reduced equipment size, faster response to process extraction control, faster start- -up, increased production, elimination of process steps, lower usage of energy, improved extraction using food- -grade solvents, and lower production of waste (13,14). Ex-posing honey to ultrasound at a particular frequency for specific period of time keeps it longer in liquid state by dissolving the existing crystals and delaying further crys-tallization, extending the shelf life by destroying most of the yeast cells, while the remaining cells lose the ability to grow (2). Ultrasonic treatment at 40 % amplitude and 20 kHz for 30 min minimally altered the colour, pH, HMF content and enzymatic activity, and noticeably improved the mass fractions of phenols, flavonoids in and antioxi-dant activity of longan, lychee and wildflower honey when compared to the conventional thermal treatment (15).
Response surface methodology (RSM) is a combina-tion of various techniques including statistical and math-ematical analyses of one or more independent and de-pendent variables, which are also known as variables and responses respectively (16). This tool has been successfully used to design and optimize different biotechnological and biochemical processes in relation to food (17). It is very efficient in determining optimum processing con-ditions and ingredient level, reaching desired minimum and maximum output values and reducing number of ex-periments, which ultimately leads to time, cost and energy savings (18). Different researchers worked on various food products like snacks (19), biscuit dough (20) and cake (21) using RSM.
Until today no work related to optimization of power ultrasound for honey processing and its comparison with industrial thermal processing of honey has been reported. Thus, the current study was carried out to develop an op-timum power ultrasound processing technique for honey, which minimally alters the nutritional and physicochemi-
cal properties, by using response surface methodology, and further compared its effects with commercial heat processing protocol for honey.
Materials and Methods
Honey samplesThe raw honey samples were procured directly from
the professional beekeepers of Hisar city, Haryana, India during winter season, in January 2016. The samples of honey were unprocessed and freshly extracted (not older than one week) from the hives kept near the fields of mus-tard crop. After sampling in dark coloured glass jars, the honey was stored at 4 ºC until analysis (completed within 20 days). Further, all the parameters of honey, i.e. diastase activity, hydroxymethylfurfural (HMF), content, colour changes and microbiological analysis were done on the same day following thermal and ultrasonic treatments.
Thermal treatment of honeyThe raw honey samples were thermally treated as per
the conventional method widely applied in food industries, i.e. for 25 min at 65 ºC (22). The honey samples (50 g) were weighed in 50-mL beakers covered with aluminium foil and immersed in thermostatic water bath (Industrial and Labo-ratory Tools Corporation, Chennai, India) at 65, 75, 85 and 95 ºC with continuous stirring until the temperature of all samples reached 65 ºC. Then the temperature of honey was maintained at 65 ºC for 25 min, after which the samples were drawn and cooled at room temperature for analysis.
Ultrasonic treatment of honeyRaw honey sample was put in a 100-mL glass beaker
and placed into treatment chamber. Ultrasound system (VCX 750 ultrasonic processor; Sonics and Materials, Inc., Newtown, CT, USA) with constant frequency of 20 kHz and 19-mm diameter probe attached with the transducer at fixed pulsation (100 %) was used to treat the sample. The ultrasound treatment of raw honey sample was car-ried out at different treatment times, amplitude (%) and volumes for optimization. Temperature of the samples during ultrasound treatment was kept below 40 ºC. Over-heating was prevented by circulating chilled water around the beaker during treatment inside the chamber. Each ex-periment was conducted in triplicate to minimize the er-ror and ensure accuracy.
The energy consumption during thermal and ultra-sound treatments was calculated using calorimetric meth-od (10) given by the equation:
P=m·Cp·dT/dt /1/where P is the used power (W), m is the mass (g), dT/dt is the change in temperature over time (oC/s) and Cp is the specific heat of honey (0.60 cal/(g∙°C)).
Moisture analysis of honeyThe refractive index of honey sample was measured
at 20 ºC with RX7000α refractometer (ATAGO, Tokyo, Japan) and moisture content was determined using stand-

572 S. JANGHU et al.: Power Ultrasound Treatment of Honey, Food Technol. Biotechnol. 55 (4) 570-579 (2017)
ard reference table of honey refractive indices and water content, according to the Harmonized Methods of the In-ternational Honey Commission (23). The reading of each sample was done in triplicate.
pH valueAcidity of honey was checked as per the protocol
given in Harmonized Methods of the International Hon-ey Commission (23) using calibrated (at pH=4.0 and 7.0) digital pH meter (pH Tutor, Eutech Instruments, Thermo Fisher Scientific, Singapore). The reading of each sample was done in triplicate.
Colour measurement and total colour difference calculation
HunterLab ColourFlex EZ, 45°/0° colour spectropho-tometer (Hunter Associates Laboratory, Inc., Reston, VA, USA) was used to measure colour parameters of honey, under the following conditions: illuminant D65, observer 10º and reflectance mode. The three-dimensional colour space is perceived in L*, a* and b*, where L* (luminance) from vertical axis expresses brightness, between complete black to complete white (i.e. 100 % black to 100 % white), and a* and b* axes range from greenness (-a*) to redness (+a*) and blueness (-b*) to yellowness (+b*) respectively (24,25). The reading of each sample was done in triplicate.
For calculating total colour difference (ΔE*) the values of L*, a* and b* were used according to the following for-mula (24,25):
ΔE= [(L0*−L*)2 + (a0
*-a*)2 +(b0*-b*)]1/2 /2/
Diastase activityDiastase activity was calculated in Schade units (SU) on
the basis of 1 % starch hydrolyzed by α-amylase enzyme in 1 g of honey for 1 h at a temperature below 45 ºC (23,26). Decomposition of starch results in the discolouration of the solution from blue to violet/pink/no colour, which is direct-ly proportional to the amount of decomposed starch. The degree of decomposition mainly depends on the intensity of enzymatic activity. This colour change was observed by UV- Vis- spectrophotometer (UV-1800; Shimadzu, Tokyo, Ja-pan) at a wavelength of 660 nm against distilled water as blank. The reading of each sample was done in triplicate.
HMF analysisHMF content (in mg/kg) in honey samples was meas-
ured using a spectrophotometric direct absorption method (27), where honey solution was filtered after dissolving in Carrez solution (Merck Millipore, Darmstadt, Germany) and then absorption was measured at 284 and 336 nm (UV-1800; Shimadzu) against the reference solution of honey and 0.2 % sodium bisulphate (Merck Millipore). The final value (in triplicate for each sample) was obtained using the following equation:
HMF=(A284 nm−A236 nm)∙149.7∙5∙ D
m /3/
where A284 nm and A336 nm are the absorbance of sample solu-tion at 284, and 336 nm respactively, 149.7 is the constant,
5 is the initial mass of honey sample (5 g), D is the dilution factor (in case dilution is necessary) and m is the mass of honey sample (in g).
Microbiological analysisFor determination of microbial flora in the honey, the
methodology suggested by Omafuvbe and Akanbi was fol-lowed (7). Accordingly, 10 g of honey sample were mixed thoroughly in 90-mL pre-sterilized maximum recovery diluent (MRD-7658; HiMedia Laboratories Pvt. Ltd., Mumbai, India) under sterile conditions. After appropriate dilutions with MRD, the sample (100 µL) was cultured in triplicate using spread plate method. Total aerobic meso-phillic bacteria were counted on plate count agar (PCA; HiMedia Laboratories Pvt. Ltd.) after incubation for 48 h at (30±2) ºC. Total coliform count was enumerated on violet red bile glucose (VRBG) agar (HiMedia Laborato-ries Pvt. Ltd.), incubated for 24-48 h at (35±2) ºC. Yeast and fungi were counted on Sabouraud dextrose agar (SDA) supplemented with chloramphenicol (100 mg/L; HiMedia Laboratories Pvt. Ltd.) after incubation period of 3-5 days at (25±2) ºC. After the completion of incubation period, all colonies that appeared were counted using digital colony counter (JAINCO 1037; HiMedia Laboratories Pvt. Ltd.) and average number of colonies, multiplied by the dilu-tion factor, was considered for counting. Results were ex-pressed in colony forming unit per g of honey (CFU/g).
Statistical analysisThe experimental results were analyzed by response sur-face methodology (RSM) using commercial statistical package, Design Expert v. 10.0.6.0 (Stat-Eease Inc., Min-neapolis, MN, USA). A three-factor and three-level cen-tral composite design (CCD) with face-centred model was chosen (28) to determine optimum levels of three inde-pendent variables, i.e. treatment time (min), amplitude (%) and volume (mL) against two dependent variables: dia-stase activity (SU) and HMF content (mg/kg). On the basis of three independent variables, 20 experimental trials were designed including six replicates at centre point. The order of experiments was fully randomized and data were ana-lyzed by multiple linear regression model. A second order polynomial equation was used to express the responses as a function of the independent variables:
/4/
where Yk is the response variable (Y1 is the diastase activity, Y2 is the HMF), β0 is the constant, βki is the linear coefficient, βkii is the quadratic coefficient, βkij is the cross product coefficient, Xi represents coded independent variables (X1 is treatment time, X2 is amplitude and X3 is volume). Statistical significance test was performed using total error criteria with the confi-dence level of 95 %. The significant terms in the model were found by analysis of variance (ANOVA) for all responses and the homogeneity of the variance was checked using Tukey’s test. The adequacy was checked on the basis of coefficient of multiple determination (R2) and adjusted coefficient of de-termination (R2
adj). The numerical optimization of the design
S. JANGHU et al.: Power Ultrasound Treatment of Honey, Food Technol. Biotechnol. 55 (4) 570-579 (2017) 573
was used for the simultaneous optimization of responses. The designed goals of each variable and response were selected in-dividually. Treatment time and amplitude range were kept at minimum, and volume was kept at maximum, so that maxi-mum amount of honey can be treated in minimum time with minimum energy, whereas in the case of responses diastase activity was kept at maximum and HMF content at minimum.
Results and Discussion
Power ultrasound process optimizationIn different ultrasound treatments, the combined effect
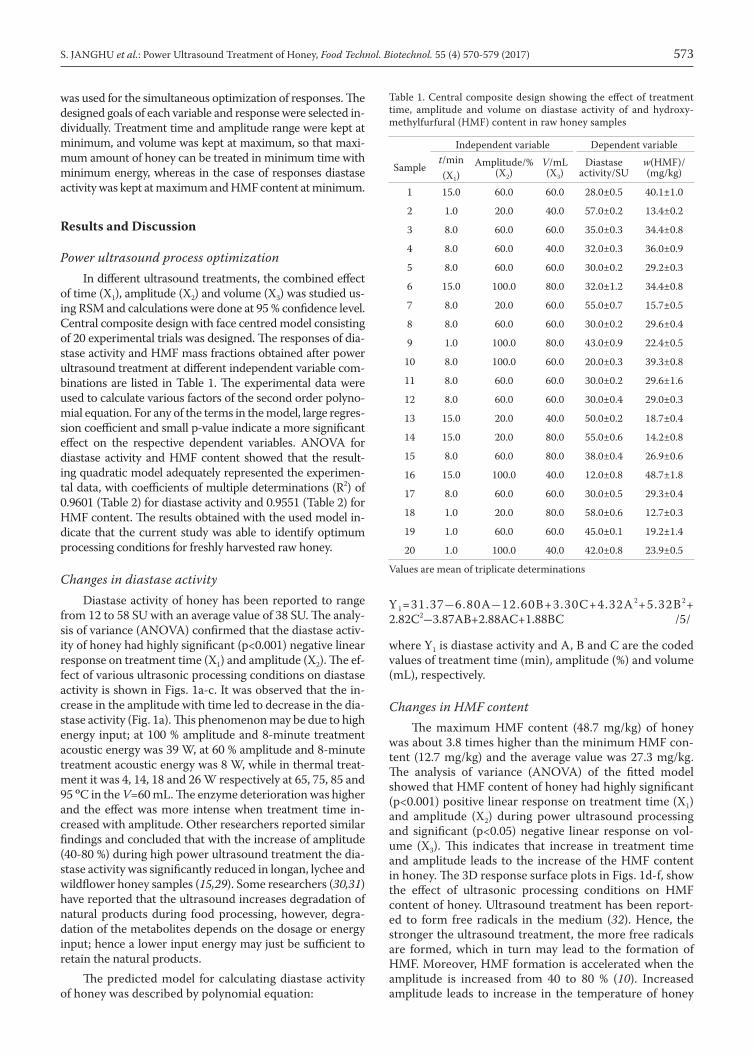
of time (X1), amplitude (X2) and volume (X3) was studied us-ing RSM and calculations were done at 95 % confidence level. Central composite design with face centred model consisting of 20 experimental trials was designed. The responses of dia-stase activity and HMF mass fractions obtained after power ultrasound treatment at different independent variable com-binations are listed in Table 1. The experimental data were used to calculate various factors of the second order polyno-mial equation. For any of the terms in the model, large regres-sion coefficient and small p-value indicate a more significant effect on the respective dependent variables. ANOVA for diastase activity and HMF content showed that the result-ing quadratic model adequately represented the experimen-tal data, with coefficients of multiple determinations (R2) of 0.9601 (Table 2) for diastase activity and 0.9551 (Table 2) for HMF content. The results obtained with the used model in-dicate that the current study was able to identify optimum processing conditions for freshly harvested raw honey.
Changes in diastase activityDiastase activity of honey has been reported to range
from 12 to 58 SU with an average value of 38 SU. The analy-sis of variance (ANOVA) confirmed that the diastase activ-ity of honey had highly significant (p<0.001) negative linear response on treatment time (X1) and amplitude (X2). The ef-fect of various ultrasonic processing conditions on diastase activity is shown in Figs. 1a-c. It was observed that the in-crease in the amplitude with time led to decrease in the dia-stase activity (Fig. 1a). This phenomenon may be due to high energy input; at 100 % amplitude and 8-minute treatment acoustic energy was 39 W, at 60 % amplitude and 8-minute treatment acoustic energy was 8 W, while in thermal treat-ment it was 4, 14, 18 and 26 W respectively at 65, 75, 85 and 95 ºC in the V=60 mL. The enzyme deterioration was higher and the effect was more intense when treatment time in-creased with amplitude. Other researchers reported similar findings and concluded that with the increase of amplitude (40-80 %) during high power ultrasound treatment the dia-stase activity was significantly reduced in longan, lychee and wildflower honey samples (15,29). Some researchers (30,31) have reported that the ultrasound increases degradation of natural products during food processing, however, degra-dation of the metabolites depends on the dosage or energy input; hence a lower input energy may just be sufficient to retain the natural products.
The predicted model for calculating diastase activity of honey was described by polynomial equation:
Table 1. Central composite design showing the effect of treatment time, amplitude and volume on diastase activity of and hydroxy-methylfurfural (HMF) content in raw honey samples
Independent variable Dependent variable
Samplet/min(X1)
Amplitude/% (X2)
V/mL (X3)
Diastase activity/SU
w(HMF)/(mg/kg)
1 15.0 60.0 60.0 28.0±0.5 40.1±1.0
2 1.0 20.0 40.0 57.0±0.2 13.4±0.2
3 8.0 60.0 60.0 35.0±0.3 34.4±0.8
4 8.0 60.0 40.0 32.0±0.3 36.0±0.9
5 8.0 60.0 60.0 30.0±0.2 29.2±0.3
6 15.0 100.0 80.0 32.0±1.2 34.4±0.8
7 8.0 20.0 60.0 55.0±0.7 15.7±0.5
8 8.0 60.0 60.0 30.0±0.2 29.6±0.4
9 1.0 100.0 80.0 43.0±0.9 22.4±0.5
10 8.0 100.0 60.0 20.0±0.3 39.3±0.8
11 8.0 60.0 60.0 30.0±0.2 29.6±1.6
12 8.0 60.0 60.0 30.0±0.4 29.0±0.3
13 15.0 20.0 40.0 50.0±0.2 18.7±0.4
14 15.0 20.0 80.0 55.0±0.6 14.2±0.8
15 8.0 60.0 80.0 38.0±0.4 26.9±0.6
16 15.0 100.0 40.0 12.0±0.8 48.7±1.8
17 8.0 60.0 60.0 30.0±0.5 29.3±0.4
18 1.0 20.0 80.0 58.0±0.6 12.7±0.3
19 1.0 60.0 60.0 45.0±0.1 19.2±1.4
20 1.0 100.0 40.0 42.0±0.8 23.9±0.5
Values are mean of triplicate determinations
Y1=31.37-6.80A-12.60B+3.30C+4.32A2+5.32B2+ 2.82C2-3.87AB+2.88AC+1.88BC /5/
where Y1 is diastase activity and A, B and C are the coded values of treatment time (min), amplitude (%) and volume (mL), respectively.
Changes in HMF contentThe maximum HMF content (48.7 mg/kg) of honey
was about 3.8 times higher than the minimum HMF con-tent (12.7 mg/kg) and the average value was 27.3 mg/kg. The analysis of variance (ANOVA) of the fitted model showed that HMF content of honey had highly significant (p<0.001) positive linear response on treatment time (X1) and amplitude (X2) during power ultrasound processing and significant (p<0.05) negative linear response on vol-ume (X3). This indicates that increase in treatment time and amplitude leads to the increase of the HMF content in honey. The 3D response surface plots in Figs. 1d-f, show the effect of ultrasonic processing conditions on HMF content of honey. Ultrasound treatment has been report-ed to form free radicals in the medium (32). Hence, the stronger the ultrasound treatment, the more free radicals are formed, which in turn may lead to the formation of HMF. Moreover, HMF formation is accelerated when the amplitude is increased from 40 to 80 % (10). Increased amplitude leads to increase in the temperature of honey

574 S. JANGHU et al.: Power Ultrasound Treatment of Honey, Food Technol. Biotechnol. 55 (4) 570-579 (2017)
and finally enhances the HMF level. Likewise, significant HMF accumulation was observed when temperature and processing time were increased (33). Similar findings were obtained by others with honeydew honey and manuka honey (34,35).
The predicted model for HMF formation in honey was described by polynomial equation:
Y2=30.86+6.45A+9.40B-3.01C-2.26A2-4.37B2-0.42C2+3.75AB-2.07AC-1.33BC /6/
where Y2 is HMF content and A, B and C are the coded values of treatment time (min), amplitude (%) and volume (mL), respectively.
Ultrasound processing optimizationThe optimum conditions for power ultrasound pro-
cessing of honey were determined to retain maximum diastase activity with minimal HMF accumulation during processing. Second order polynomial models obtained in the current study were used for both responses, i.e. dia-stase activity and HMF formation in identifying the op-timum processing conditions. In this study, time, ampli-tude and volume were optimized to 1-15 min, 20-100 % and 40-80 mL, respectively. By applying point prediction method, it was determined that the optimum power ul-trasound processing conditions are treatment time of 8 min, 60 % amplitude and volume of 60 mL, which cor-responds to 8 W of acoustic energy given to the system. At this point, predicted diastase activity and HMF content were 31.37 SU and 30.86 mg/kg, respectively. Validation of the model was conducted by using the optimized treat-ment conditions and experimentally obtaining the value of the responses. The predicted (31.37 SU and 30.86 mg/kg) and experimental values (32.07 SU and 30.14 mg/kg) were compared and found to be close, with low error. There-
fore, the model obtained in this study could be used for optimization of power ultrasound process for raw honey treatment.
Effects of power ultrasound and thermal treatment on physicochemical parameters
In the current investigation the comparison between commercial heat processing of honey (i.e. with initial heat-ing at different temperatures and holding time of 25 min at 65 ºC) and optimized power ultrasound conditions (treat-ment time 8 min, amplitude 60 % and volume 60 mL) was done and their effects on different quality parameters of honey are described below.
The temperature profile study of thermally treated honey shown in Fig. 2 clearly indicates that speed of tem-perature increase of honey varies drastically when exposed to different temperature conditions, i.e. heating in water bath at 65 ºC takes more than 21 min to reach the honey temperature of 65 ºC, whereas heating at 75, 85 and 95 ºC takes less than 8, 7 and 5 min respectively. Achieving honey temperature of 65 ºC and holding time of 25 min at the same temperature are recommended for complete de-crystallization and microbial growth inhibition (23). With longer exposure time qualitative damage is greater. Similar findings were documented stating that heating results in degradation of honey quality, and to calculate the intensity of heat to which honey has been subjected, diastase activ-ity and HMF content are used together as quality param-eters (4).
Moisture is the second largest component in honey af-ter sugar and it is one of the deciding factors for shelf life of honey. During processing, some water loss is observed because of high temperature, which is minimal in the case of ultrasonically treated honey because of controlled tem-perature treatment, but the highest loss, i.e. 0.67 %, was ob-
Table 2. Regression coefficients (R2) of second order polynomial and their significance for diastase activity and hydroxymethylfurfural (HMF) content after ultrasonic treatment
SourceDiastase activity HMF content
Coeff. value F-ratio p-value Coeff. value F-ratio p-value
X0 31.37*** 26.76 <0.0001 30.86*** 19.14 <0.0001
X1 -6.80*** 37.77 0.0001 6.45*** 40.97 <0.0001
X2 -12.60*** 129.67 <0.0001 9.40*** 86.99 <0.0001
X3 3.30** 8.89 0.0138 -3.01** 8.92 0.0137
X12 -3.87** 9.81 0.0106 3.75** 11.08 0.0076
X13 2.88** 5.40 0.0425 -2.07* 3.39 0.0954
X23 1.88ns 2.30 0.1606 -1.33ns 1.38 0.2669
X12 4.32* 4.19 0.0679 -2.26ns 1.38 0.2671
X22 5.32** 6.35 0.0304 -4.37** 5.18 0.0461
X32 2.82ns 1.78 0.2113 -0.42ns 0.049 0.8300
R2 0.9601 0.9551
R2adj 0.9242 0.9007
Adeq. precision 19.521 17.085
Lack-of-fit 4.88ns 3.70ns
*significant at p<0.1, **significant at p<0.05, ***significant at p<0.001, ns=not significant

S. JANGHU et al.: Power Ultrasound Treatment of Honey, Food Technol. Biotechnol. 55 (4) 570-579 (2017) 575
Fig. 1. Response surface plot for: a) diastase activity as a function of treatment time and amplitude at fixed V=60 mL, b) diastase activity as a function of treatment time and volume at fixed amplitude of 60 %, c) diastase activity as a function of amplitude and volume at fixed treat-ment time t=8 min, d) hydroxymethyl furfural (HMF) content as a function of treatment time and amplitude at fixed V=60 mL, e) HMF content as a function of treatment time and volume at fixed amplitude of 60 %, f ) HMF content as a function of amplitude and volume at fixed treatment time t=8 min. SU=Schade unit
a) d)
b) e)
c) f )

576 S. JANGHU et al.: Power Ultrasound Treatment of Honey, Food Technol. Biotechnol. 55 (4) 570-579 (2017)
served in honey heated at 65 ºC. Initial moisture content of raw honey was 16.5 %, which was reduced up to 15.8, 16.01, 16.2 and 16.3 % when initial heating temperature was 65, 75, 85 and 95 ºC respectively (Table 3). Moisture loss was higher at longer heat exposure time, and it was the highest at 65 ºC (46-minute treatment, i.e. 21 min arrival time and 25 min holding time) and least at 95 ºC (30-minute treat-ment, i.e. 5 min to achieve 65 °C and 25 min holding time).
Only power ultrasound treatment of honey did not have a significant (p>0.05) effect on pH when compared to unprocessed honey, whereas pH of all thermally treated honey samples significantly decreased. More specifically, greater pH decrease (p≤0.05) was observed in the samples exposed to heat for a longer period of time. Initial heating at 65 ºC resulted in maximum pH drop, i.e. from 3.52 to 3.35 in raw honey, while initial heating at 75, 85 and 95 ºC also
resulted in the decrease of pH in descending order: 3.40, 3.43 and 3.43 respectively when compared to unprocessed honey (pH=3.52), as shown in Table 3. The finding was simi-lar to a previous study with conventionally and ultrasoni-cally treated longan, lychee and wildflower honey (15). The decrease in pH might be because of the increase in hydro-gen ion concentration due to heat treatment or because pol-len releases organic acids during heating, which also affects the pH of the final sample (36).
Diastase activity in honey is extensively dependent on floral source of honey and may vary from season to season in the honey from the same flora (37). Diastase activity of unprocessed raw honey was 60 SU and it was reduced to 32.1 SU during ultrasound treatment (Table 3). But during heat processing with different initial temperatures, the loss in diastase activity is higher than in ultrasonically treated
Fig. 2. Temperature profile of thermally treated honey sample from 65 to 95 ºC. The line represents the time taken to achieve the tempera-ture of honey of 65 ºC after initial heating at temperatures of 65, 75, 85 and 95 ºC
Table 3. Effects of power ultrasound and heat treatments on physicochemical properties of raw honey
Treatment w(moisture)/% pH (at 25 ºC) Diastase activity/SU
w(HMF)/(mg/kg) L* a* b* ΔE*
Raw honey 16.5±0.2 3.52±0.05 60±5 11.9±0.2 29.1±0.9 2.21±0.04 18.5±0.6
Ultrasound 16.4±0.2 3.48±0.02 32.0±0.1 30.1±1.3 28.8±0.3 2.5±0.3 20.1±0.5 1.8±0.1
Temperature/ºC
65 (15.8±0.3)a (3.35±0.03)b (16.5±0.3)d (48.8±2.7)g (23.8±1.3)j (5.4±0.5)k (25.7±0.4)l (9.5±0.3)n
75 (16.01±0.09)a (3.40±0.02)bc (21.9±0.5)e (43.6±0.4)h (25.4±1.3)j (4.3±0.3)k (22.96±0.06)m (6.2±0.5)o
85 (16.2±0.7)a (3.43±0.03)c (23.3±0.8)f (39.4±0.9)i (25.5±1.4)j (4.2±0.6)k (22.9±0.5)m (6.1±0.2)o
95 (16.3±0.3)a (3.43±0.01)c (24.1±0.2)f (38.9±1.1)i (25.5±0.5)j (4.2±1.1)k (22.78±0.02)m (6.0±0.2)o
Mean values in the column followed by different letters are significantly different according to Tukey’s test (p<0.05). Three replicates were per-formed for each measurement. Ultrasonic treatment was performed at t=8 min, amplitude=60 % and V=60 mL. For each thermal treatment, when temperature of honey reached 65 ºC it was maintained for 25 min and then the samples were drawn and cooled before analysis. L*=lightness, a*=redness, b*=yellowness, ΔE*=total colour difference

S. JANGHU et al.: Power Ultrasound Treatment of Honey, Food Technol. Biotechnol. 55 (4) 570-579 (2017) 577
honey. The diastase activity decreased from 24.0 to 16.5 SU within the initial heating temperature range from 95 to 65 ºC. This clearly indicates that heating for longer time de-pletes more enzymes in honey, which is why the highest loss is at 65 ºC for 46 min, followed by 75 ºC (diastase activ-ity 21.9 SU), 85 ºC (diastase activity 23.3 SU) and 95 ºC (di-astase activity 24.0 SU) with total exposure times of 34, 32 and 30 min, respectively. In contrast, the diastase activity of all samples after thermal treatment is higher than the level (8 SU) recommended by International Honey Commission (23), which was similar to a previous study where greater loss in diastase activity was reported during heat treatment (90 ºC/5 min) than during ultrasound treatment (40-80 % amplitude/30 min) of longan, lychee and wildflower honey (15). Similar results (20-40 % amplitude/20 kHz/1 h) were obtained for sunflower honey treated with ultrasound (29).
5-Hydroxymethylfurfural (HMF) is a breakdown prod-uct of sugar degradation formed during exposure to high temperature under acidic conditions and is used as freshness or thermal damage indicator for honey (15,37). As per our observations, the initial HMF content in unprocessed fresh honey sample was 11.9 mg/kg (Table 3), which increased in all samples after treatments. However, the increase in HMF content was greater in thermally treated samples than in the ultrasonically treated sample. It increased up to 48.8 mg/kg at initial heating temperature of 65 ºC due to longer heat exposure time, which is beyond the acceptable limit of 40 mg/kg (38), while in the ultrasonically treated sample the HMF increase was minimal, i.e. 30.1 mg/kg, which is because of the temperature control (below 40 ºC) during power ultrasound treatment. The increased HMF content is directly proportional to the browning index of honey, as shown in Table 3. The accumulation of HMF is mainly dependent on treatment temperature, exposure time and storage (33). Similarly, thermal processing is more effec-tive in producing HMF and decreasing diastase activity in honey than ultrasonication (40 % amplitude/30 min/52.63 ºC and 80 % amplitude/30 min/75.09 ºC) (29). Higher rate of HMF formation in honey at 100 ºC than in those heated at 90 and 75 ºC was also reported (34).
Colour of honey is one of the most important accept-ability factors for consumers. Light coloured honey is mild in flavour with high commercial value and preferred over dark honey (5). The colour of honey depends on many fac-tors like nectar source, climatic conditions, floral origin, processing technique, etc. In the current investigation, comparative analysis of changes in colour parameters (L*, a*, b* and ΔE*) of honey due to thermal and power ultra-sound treatments was done (Table 3). In all honey samples significant decrease in the lightness was observed when compared to the control. The decrease in lightness was the lowest in ultrasonically treated sample compared to all other thermally processed honey samples. Higher val-ues of redness (+a*) and yellowness (+b*) were observed in thermally processed honey sample followed by ultrasoni-cally treated samples than in control. In particular, samples treated at initial temperature of 65 ºC revealed maximum +a* (5.4) and +b* (25.7) values followed by samples treated at initial temperatures of 75, 85 and 95 ºC. Smaller increase in +a* (2.5) and +b* (20.1) values was observed in ultra-sonically treated honey samples than in control sample
(+a*=2.21 and +b*=18.5). Similar results were reported in floral honey from Thailand, where maximum increase in +a* and +b* values was observed in thermally processed (90 ºC/5 min) and the lowest in ultrasonically treated (80 and 40 % amplitude/30 min) samples (15). L* value was decreased compared to the control, and the decrease was higher in thermally processed than in ultrasonically pro-cessed honey samples because of longer heating time, which caused the formation of more HMF. The results are further supported by significant increase in +a* and +b* parameters after ultrasonic treatment of guava juice (35 kHz/20 oC/30 min) and decreased L* value when compared to the control sample (39).
Total colour difference (ΔE*) data of both thermally and power ultrasound-treated honey samples in Table 3 further confirms that the colour change is minimum in ul-trasonically treated honey (1.8), which is close to the con-trol. However, ΔE* is more than double in thermally pro-cessed honey samples. This clearly indicates that browning reaction occurred due to high temperature treatment and the effect is more severe in samples treated for a longer pe-riod of time.
Effects on microbiological qualitiesThe microbial counts in raw, thermally processed and
power ultrasound-treated honey samples are reported in Table 4. The total aerobic mesophilic bacterial count in raw honey sample was 5.2∙103 CFU/g, which is close to the value reported by other researchers (7,40). After heat treatment, total aerobic mesophilic bacterial count was re-duced to 2.6∙102 CFU/g and in ultrasonically treated honey reduction was 1.8∙102 CFU/g, showing that both thermal and ultrasound treatments were effective in total aerobic mesophilic bacterial reduction in honey. Total coliform count (TCC) was very low, i.e. 0.6∙105 CFU/g in raw honey sample, which was completely destroyed during heat treat-ment for 25 min at 65 ºC and also no sign of coliforms was found in ultrasonically treated honey samples. Similarly, total fungal count and total yeast count were reduced up to half of their existing level by thermal processing, whereas in ultrasound treatment complete destruction took place.
These results clearly indicate that power ultrasound is more effective than conventional heat processing for mi-crobial inactivation. Microbial inactivation in ultrasonic treatment is due to micromechanical shockwaves which destroy cellular components and ultimately cell lysis takes place. Similar findings were reported in research using ul-trasonic treatment (60 ºC/9 min/120 µm) where complete destruction of Escherichia coli, Staphylococcus aureus, Salmonella sp., Listeria monocytogenes and better Bacillus cereus inactivation (3.48 log CFU/mL) were obtained (41). Thus, the ultrasound processing of honey has significant industrial potential as it could improve the diastase reten-tion in honey as well as decrease the formation of HMF, which in turn retains the colour of honey when compared to thermal processing with the added advantage of micro-bial inactivation for extended shelf life. Moreover, devel-opment in the improved ultrasound systems to date offers better control of treatment conditions which can be easily integrated in industry, and is environmentally friendly.

578 S. JANGHU et al.: Power Ultrasound Treatment of Honey, Food Technol. Biotechnol. 55 (4) 570-579 (2017)
Conclusions
Power ultrasound processing under optimized condi-tions and controlled temperature could be an alternative to heat processing of honey. In the current research, optimized power ultrasound completely destroyed yeast, mould and coliform bacteria, while the total plate count results were better than in thermally processed honey. Similarly, other physicochemical properties like moisture, pH, diastase ac-tivity and HMF formation were least affected under opti-mum power ultrasound treatment and higher nutritional value was achieved than in thermally processed honey samples. Moreover, ultrasound treatment can lead to a mi-crobially safe honey with minimum deviation in colour and browning index, which can have a better commercial value. However, further research is needed to study the changes during storage at various temperature conditions.
References 1. Basmaci I. Effect of ultrasound and high hydrostatic pressure on
liquefaction and quality parameters of selected honey varieties (MSc. Thesis). Ankara, Turkey: Middle East Technical Universi-ty; 2010 (in Turkish).
2. Thrasyvoulou A, Manikis J, Tselios D. Liquefying crystallized honey with ultrasonic waves. Apidologie. 1994;25:297-302.https://doi.org/10.1051/apido:19940304
3. Kowalski S, Lukasiewicz M, Bednarz S, Panus M. Diastase num-ber changes during thermal and microwave processing of honey. Czech J Food Sci. 2012;30:21-6.
4. Bogdanov S, Martin P, Lüllmann C. Harmonized Methods of the European Honey Commission. Apidologie. 1997;1-59.
5. Gonzales AP, Burin L, del Pillar Buera M. Colour changing dur-ing storage of honeys in relation to their composition and initial colour. Food Res Int. 1999;32:185-91.https://doi.org/10.1016/S0963-9969(99)00075-7
6. Snowdon JA, Cliver DO. Microorganisms in honey. Int J Food Microbiol. 1996;31:1-26.https://doi.org/10.1016/0168-1605(96)00970-1
7. Omafuvbe BO, Akanbi OO. Microbiological and physico-chemi-cal properties of some commercial Nigerian honey. Afr J Micro-biol Res. 2009;3:891-6.
8. Buba F, Gidado A, Shugaba A. Physicochemical and microbio-logical properties of honey from North East Nigeria. Biochem Anal Biochem. 2013;2:1-7.https://doi.org/10.4172/2161-1009.1000142
9. Rawson A, Brunton N, Tuohy M. High pressure-temperature degradation kinetics of polyacetylenes in carrots. Food Chem. 2012;133:15-20.https://doi.org/10.1016/j.foodchem.2011.11.123
10. Rawson A, Tiwari BK, Tuohy MG, O’Donnell CP, Brunton N. Ef-fect of ultrasound and blanching pretreatments on polyacetylene and carotenoid content of hot air and freeze dried carrot discs. Ultrason Sonochem. 2011;18:1172-9.
https://doi.org/10.1016/j.ultsonch.2011.03.009
11. Krishnan VCA, Kuriakose S, Rawson A. Ultrasound assisted ex-traction of oil from rice bran: A response surface methodology approach. J Food Process Technol. 2015;6:454.https://doi.org/10.4172/2157-7110.1000454
12. Mañas P, Muñoz B, Sanz D, Condón S. Inactivation of lysozyme by ultrasonic waves under pressure at different temperatures. Enzyme Microbial Technol. 2006;39:1177-82.https://doi.org/10.1016/j.enzmictec.2005.11.053
13. Chemat F, Rombaut N, Meullemiestre A, Turk M, Perino S, Fabi-ano-Tixier AS, Abert-Vian M. Review of green food processing techniques. Preservation, transformation, and extraction Innov Food Sci Emerg Technol. 2017;41:357–77.https://doi.org/10.1016/j.ifset.2017.04.016
14. Chemat F, Rombaut N, Sicaire AG, Meullemiestre A, Fabiano-Tixier AS, Abert-Vian M. Ultrasound assisted extraction of food and natural products. Mechanisms, techniques, combinations, protocols and applications. A review. Ultrason Sonochem. 2017;34:540–60.
https://doi.org/10.1016/j.ultsonch.2016.06.03515. Chaikham P, Kemsawasd V, Apichartsrangkoon A. Effects of
conventional and ultrasound treatments on physicochemical properties and antioxidant capacity of floral honeys from North-ern Thailand. Food Biosci. 2016;15:19-26.https://doi.org/10.1016/j.fbio.2016.04.002
16. Cacace JE, Mazza G. Optimization of extraction of anthocya-nins from black currants with aqueous ethanol. J Food Sci. 2003;68:240-8.https://doi.org/10.1111/j.1365-2621.2003.tb14146.x
17. Bansal V, Sharma HK, Nanda V. Optimisation of spray drying process parameters for low-fat honey-based milk powder with antioxidant activity. Int J Food Sci Technol. 2014;49:1196-202.https://doi.org/10.1111/ijfs.12416
18. Režek Jambrak A. Experimental design and optimization of ul-trasound treatment of food products. J Food Process Technol. 2011;2:102e.https://doi.org/10.4172/2157-7110.1000102e
19. Thakur S, Saxena DC. Formulation of extruded snack food (gum based cereal-pulse blend): Optimization of ingredients levels us-ing response surface methodology. LWT - Food Sci Technol. 2000;33:354–61.https://doi.org/10.1006/fstl.2000.0668
20. Gallagher E, O’Brien CM, Scannell AGM, Arendt EK. Use of re-sponse surface methodology to produce functional short dough biscuits. J Food Eng. 2003;56:269-71.https://doi.org/10.1016/S0260-8774(02)00265-0
21. Gan HE, Karim R, Muhammad SKS, Bakar JA, Hashim DM, Rahman RA. Optimization of the basic formulation of a tradi-tional baked cassava cake using response surface methodology. LWT - Food Sci Technol. 2007;40:611-8.https://doi.org/10.1016/j.lwt.2006.05.005
22. Wakhle DM, Phadke RP. Design of honey processing unit. Part I. Indian Bee J. 1995;57:144–6.
23. Bogdanov S. Harmonised methods of the International Honey Commission. Bremen, Germany: International Honey Commis-sion; 2009.
Table 4. Mean microbial count of raw, thermally treated and ultrasonically treated honey
Honey sampleN/(CFU/g)
TAMB TCC TFC TYC
Raw (5.2±0.2)·103 (0.6±0.1)·105 (0.2±0.1)·102 (3.2±0.2)·102
Thermally treated* (2.6±0.3)·102 ++ (0.1±0.1)·102 (1.00±0.08)·103
Ultrasonically treated** (1.8±0.1)·102 ++ ++ ++
TAMB=total aerobic mesophilic bacteria, TCC=total coliform count, TFC=total fungal count, TYC=total yeast count, ++=absence of microbes. *Treatment temperature T=65 ºC, time t=25min, **treatment time t=8 min, ampli-tude=60 % and V=60 mL
S. JANGHU et al.: Power Ultrasound Treatment of Honey, Food Technol. Biotechnol. 55 (4) 570-579 (2017) 579
24. Rawson A, Koidis A, Patras A, Tuohy MG, Brunton NP. Model-ling the effect of water immersion thermal processing on poly-acetylene levels and instrumental colour of carrot disks. Food Chem. 2010;121:62–8. https://doi.org/10.1016/j.foodchem.2009.12.003
25. Rawson A, Koidis A, Rai D, Tuohy M, Brunton N. Influence of sous vide and water immersion processing on polyacetylene con-tent and instrumental colour of parsnip (Pastinaca sativa) disks. J Agric Food Chem. 2010;58:7740–7.
https://doi.org/10.1021/jf100517p26. Schade JE, Marsh GL, Eckert JE. Diastase activity and hydroxyl-
methyl-furfural in honey and their usefulness in detecting heat alteration. J Food Sci. 1958;23:446-63.https://dx.doi.org/10.1111/j.1365-2621.1958.tb17592.x
27. White JW. Spectrophotometric method for hydroxymethylfurfural in honey. J AOAC Int. 1979;62:509-14.
28. Myers RH, Montgomery DC, Anderson-Cook CM. Response surface methodology: Process and product optimization using design experiments. Hoboken, NJ, USA: John Wiley and Sons, Inc.; 2016.
29. Nunta R, Intipunya P. Effects of melting methods on properties of crystallized sunflower honey. Proceedings of the 13th ASEAN Food Conference, September 9-11, 2013. Singapore: Singapore Institute of Food Science and Technology (SIFST)/ASEAN COST/FIFSTA; 2013. pp. 86-92.
30. Achat S, Tomao V, Madani K, Chibane M, Elmaataoui M, Dan-gles M, Chemat F. Direct enrichment of olive oil in oleuropein by ultrasound-assisted maceration at laboratory and pilot plant scale. Ultrason Sonochem. 2012;19:777-86.
https://doi.org/10.1016/j.ultsonch.2011.12.00631. Jacotet-Navarro M, Rombaut N, Deslis S, Fabiano-Tixier AS,
Pierre FX, Bily A, Chemat F. Towards a ‘dry’ bio-refinery without solvents or added water using microwaves and ultrasound for to-tal valorization of fruit and vegetable by-products. Green Chem. 2016;18:3106-15.https://doi.org/10.1039/C5GC02542G
32. Zhang QA, Shen Y, Fan XH, García Martín JF, Wang X, Song Y. Free radical generation induced by ultrasound in red wine and model wine: An EPR spin-trapping study. Ultrason Sonochem.
2015;27:96-101.https://doi.org/10.1016/j.ultsonch.2015.05.003
33. Gianelli Barra MP, Ponce-Díaz MC, Venegas-Gallegos C. Vola-tile compounds in honey produced in the central valley of Ñuble Province, Chile. Chilean J Agric Res. 2010;70:75–84. https://doi.org/10.4067/S0718-58392010000100008
34. Turhan I, Tetik N, Karhan M, Gurel F, Tavukcuoglu HR. Quality of honeys influenced by thermal treatment. LWT - Food Sci Technol. 2008;41:1396-9.https://doi.org/10.1016/j.lwt.2007.09.008
35. Fauzi NA, Farid MM. High-pressure processing of manuka hon-ey: Brown pigment formation, improvement of antibacterial ac-tivity and hydroxymethylfurfural content. Int J Food Sci Tech-nol. 2015;50:178–85.https://doi.org/10.1111/ijfs.12630
36. Chaikham P, Apichartsrangkoon A. Comparison of dynamic vis-coelastic and physicochemical properties of pressurised and pas-teurized longan juices with xanthan addition. Food Chem. 2012;134:2194-200.https://doi.org/10.1016/j.foodchem.2012.04.056
37. Da Silva PM, Gauche C, Gonzaga LV, Costa ACO, Fett R. Honey: Chemical composition, stability and authenticity. Food Chem. 2016;196:309-23.https://doi.org/10.1016/j.foodchem.2015.09.051
38. Codex Stan 12-1981: Codex standard for honey (Revised codex standard for honey). In: Standards and Standard Methods, vol. 11. Rome, Italy: The Codex Alimentarius Commission, Food and Agricultural Organization of the United Nations (FAO)/World Health Organization (WHO); 2001. pp. 1-8.
39. Cheng LH, Soh CY, Liew SC, Teh FF. Effects of sonication and car-bonation on guava juice quality. Food Chem. 2007;104:1396-401.https://doi.org/10.1016/j.foodchem.2007.02.001
40. Tysset C, Rousseau M. Problem of microbes and hygiene of com-mercial honey. Rev Med Vet. 1981;132:591-600.
41. Herceg Z, Markov K, Sobota Šalamon B, Režek Jambrak A, Vukušić T, Kaliterna J. Effect of high intensity ultrasound treat-ment on the growth of food spoilage bacteria. Food Technol Bio-technol. 2013;51:352-9.