Embed Size (px)
Citation preview
Written by Christoph Grimpe Wolfgang Sofka and Andreas Distel Copenhagen Business School Denmark March 2017
EUR 28532 EN
Study on Innovation in
Horizon 2020 Projects
A content analysis of 233 innovation project proposals
awarded in 2015
Final report
EUROPEAN COMMISSION
Directorate-General for Research and Innovation
Directorate A mdash Policy development and coordination Unit A6 mdash Data Open Science and Foresight
Contact Katarzyna Bitka
E-mail RTD-RISEeceuropaeu
katarzynabitkaeceuropaeu
European Commission B-1049 Brussels
EUROPEAN COMMISSION
Directorate-General for Research and Innovation
2014 EUR 28532 EN
Study on Innovation in Horizon 2020 Projects
A content analysis of 233 innovation project proposals
awarded in 2015
Final report
LEGAL NOTICE
The information and views set out in this study are those of the authors and do not necessarily reflect the official opinion of the Commission The Commission does not guarantee the accuracy of the data included in this study Neither the Commission nor any person acting on the Commissionrsquos behalf may be held responsible for the use which may be made of the information contained therein
More information on the European Union is available on the Internet (httpwwweuropaeu)
Luxembourg Publications Office of the European Union 2014
ISBN 978-92-79-66946-0 doi 102777610808 ISSN 1831-9424 copy European Union 2014
Europe Direct is a service to help you find answers
to your questions about the European Union
Freephone number ()
00 800 6 7 8 9 10 11
() The information given is free as are most calls (though some operators phone boxes or hotels may charge you)
5
TABLE OF CONTENTS
EXECUTIVE SUMMARY 6
1 INTRODUCTION 9
2 COGNITIVE INDICATORS OF INNOVATION IMPACT 11
Technological Novelty 12
Market Scope 12
Ecosystem Embeddedness 13
Innovation Readiness 14
3 METHODOLOGY 18
Content Analysis 18
Cluster Analysis 20
4 RESULTS 21
Descriptive Results 21
Qualitative Results 23
Comparison of Call and Proposal Texts 26
Cluster Analysis 27
5 DISCUSSION AND IMPLICATIONS 31
Implications for the Funding Instruments Under Study 31
Implications for Innovation Indicators 33
REFERENCES 36
APPENDIX 40
6
EXECUTIVE SUMMARY
Horizon 2020 puts special emphasis on a number of cross-cutting issues that are
intended to develop new knowledge competences and technological breakthroughs
with the aim to translate knowledge into economic and societal value One of these
cross-cutting issues focuses on facilitating innovation by bridging discovery with
market application stages This study provides an exploratory analysis of the current
likelihood of innovation impact of a small subset of Horizon 2020 projects by studying
227 Innovation Action and six public procurement projects (PPP) for which contracts
were signed in 2015 These actions have only started recently and are ongoing It is
therefore not possible to assess project outcomes ex-post Rather this study applies a
forward-looking methodology by applying cognitive innovation impact indicators to the
project proposals It seeks to trace a projectrsquos likely innovation impact back to the
attention various consortia devote to specific innovation aspects in their project
proposals Following the attention-based theory of organisational behaviour dedicated
attention of a consortium might have an impact on how it will act in the future
Consortia neglecting particular issues are unlikely to consider these issues throughout
the project Thus it can be hypothesised that on the basis of differences in the
attention towards specific topics heterogeneity between the consortia regarding their
input decisions will occur which in turn will lead to differences in project outcomes
and likely innovation impact
The main analytical technique of this study is a content analysis of proposal texts
Content analysis builds on the insight that language is central in human cognition
Accordingly cognitive schemas can be inferred from the systematic replicable
analysis of text Given that grant proposals are carefully and purposefully written they
reveal a consortiumrsquos attention and priorities for certain issues vis-agrave-vis others given
that overall space is limited The content analysis of this study rests on a multi-stage
validation process and identifies the attention that proposals devote to four crucial
innovation impact indicators (derived from an in-depth literature review)
technological novelty (advancement in the technological performance frontier) market
scope (potential to create a new product market) ecosystem embeddedness
(connections with important organisations and stakeholders) and innovation readiness
(technological and commercial maturity)
The content analysis of the proposal texts has some limitations The study is based on
counting the identified key words that are to measure the four innovation impact
indicators These keywords do not measure the material content of the proposals nor
the actual outcome of the projects Therefore the analysis is measuring the initial
intention rather than the final results of the innovation project Moreover the writing
of the proposal and the development of the innovation are activities which are linked
but separate which is why the findings based on proposals might not fully hold for the
actual projects These limitations have to be taken into account when using this study
Following the content analysis differences in attention allocation can be identified
among proposals and clusters of proposals emerge with distinct patterns The
following results and implications can be identified for the funding instruments under
study
As intended by the Innovation Action and PPP funding schemes attention to the
commercialisation of innovation dominates the studied project proposals Almost
all Innovation Action and PPP call texts use technological novelty at least as a
starting point and all proposals contain indications of technological novelty
However the average proposal pays roughly 33 more attention to innovation
readiness than to technological novelty Taking attention to readiness
ecosystem embeddedness and market scope together consortia dedicate on
7
average almost three times as much attention to the commercialisation of
technologies compared with describing technological novelty
A cluster of proposals containing ldquoPioneeringrdquo project consortia (64 out of 227)
can be identified which pay comparatively more attention to achieving ambitious
innovation impact vis-agrave-vis the goals of Horizon 2020 Consortia are significantly
more likely to allocate their attention accordingly with increasing participation of
private firms including SMEs It is noteworthy that projects in this cluster
combine attention to technological novelty and market creation (market scope)
Another cluster of 58 proposals containing ldquoDiffusingrdquo project consortia can be
identified with dedicated attention to diffusing innovation based on a broad
representation of the innovationrsquos ecosystem and its readiness Within the
ambition of Horizon 2020 for bridging discovery and market application these
consortia are clearly more specialised for the latter stages and can make an
important contribution to achieving market success
A substantial share of Innovation Action projects can be characterised as
ldquoSustainingrdquo (105 out of 227) Project proposals in this cluster contain only
modest focus on the four innovation impact indicators which may suggest that
these projects do not correspond very well to the stipulated objectives of
Innovation Actions Nevertheless the analysis only includes consortia that
received funding It is therefore not possible to compare ldquoSustainingrdquo projects
with those proposals that did not receive funding Within the context of this
study ldquoSustainingrdquo projects should therefore be considered as a baseline
reference group for ldquoPioneeringrdquo and ldquoDiffusingrdquo cluster proposals
With the caveat of the limited number of six PPP proposals analysed in this
study they share many attention allocation similarities with Innovation Actions
However the attention devoted to innovation readiness is comparatively lower
Market scope only plays a minor role similar to the Innovation Actions There is
a risk that PPP currently do not allocate enough attention to the broader market
application of innovation beyond public procurement
Overall the comparatively low scores for market scope across all projects under
study in comparison to the other cognitive innovation impact indicators suggest
that based on the content of the proposals the current schemes are not geared
explicitly towards supporting market creating innovation
This study proposes and applies cognitive innovation impact indicators Hence
conclusions can be derived on how these indicators relate to more traditional impact
indicators such as surveys or patent counts No single innovation impact indicator is
per se superior to others The cognitive innovation impact indicators proposed in this
study can alleviate some of the weaknesses of more traditional approaches eg the
confirmation bias in surveys long time delays and selective applicability of patent or
publication counts or case-specific qualitative studies The cognitive innovation impact
indicators allow an early assessment of the likely innovation impact of the proposals
even before they are actually funded They can be applied systematically to large
numbers of proposals and allow a quantification of attention as well as subsequent
interpretation Hence the following implications can be derived in the context of this
study
The high levels of attention to innovation readiness in ldquoPioneeringrdquo and
ldquoDiffusingrdquo clusters of project proposals provides an indication that these
projects might achieve impact in the short to medium term The comparatively
lower attention to innovation readiness in PPP proposals suggests the opposite
(albeit based on only 6 proposals under consideration)
8
The allocation of attention to the four innovation impact indicators expressed in
project proposals correlates positively and significantly with the attention
expressed in the respective call texts Hence a cognitive transfer of attention
priorities from call texts to funded consortia has successfully occurred
There is no evidence that innovation project proposals are research proposals in
disguise since technological novelty does not dominate proposal attention
Given that this study analyses exclusively granted project proposals it is equally
likely that such proposals have not been submitted or that evaluators have
performed their duties well and ranked them low In both cases the purpose of
the grant scheme would have been accomplished
9
1 INTRODUCTION
One of the cornerstones of the Europe 2020 strategy for smart sustainable and
inclusive growth (European Commission 2010) has been a commitment to investing
into research and innovation With a budget of around EUR 77 billion Horizon 2020 is
the European Unionrsquos Framework Programme for Research and Innovation in the
period 2014 to 2020 that helps to implement these policy priorities and objectives
Overall Horizon 2020 strives to facilitate excellent science and technology
development in Europe in order to create economic prosperity and to increase the
quality of life
Horizon 2020 puts special emphasis on a number of cross-cutting issues that are
promoted across the three priorities ldquoexcellent sciencerdquo ldquoindustrial leadershiprdquo and
ldquosocietal challengesrdquo They are intended to develop new knowledge competences and
technological breakthroughs with the aim to translate knowledge into economic and
societal value (European Commission 2016) One of these cross-cutting issues
focuses on bridging discovery with market application stages and in that sense on
facilitating innovation Innovation is commonly understood as the commercial
exploitation of new or improved products services or processes (Schilling 2016) The
focus of Horizon 2020 on innovation is particularly pronounced in the priorities
ldquoindustrial leadershiprdquo and ldquosocietal challengesrdquo They feature the new instruments
available in Horizon 2020 ndash Innovation Actionsprojects innovation procurement and
inducement prizes ndash that are expected to play a prominent role in bridging discovery
with market application stages and thus in helping to increase growth and
employment in Europe Innovation Actions describe activities aimed at producing new
or improved products processes or services while innovation procurement refers to
pre-commercial public procurement (PCP) or public procurement for innovative
solutions (PPI) (European Commission 2014a) Inducement prizes are ldquochallengerdquo
prizes that offer cash rewards to those who can most effectively meet a defined
challenge According to the Horizon 2020 Monitoring Report 2015 (European
Commission 2016) a substantial share of the total EU funding (199 corresponding
to EUR 14 billion) has been allocated to Innovation Action projects while only 65 of
the signed grants were Innovation Actions In comparison EUR 185 million were
allocated to six PCP and PPI projects and inducement prizes played a minor role This
distribution of funding illustrates the economic importance of Innovation Actions within
Horizon 2020
The Horizon 2020 Monitoring Report 2015 presents for the first time preliminary data
on outputs of projects responding to calls in 2014 and 2015 (European Commission
2016) The figures are collected through the continuous project reporting made by the
beneficiaries and refer to publications in peer-reviewed journals patent applications
and granted patents They show a total of 1760 publications 109 patent applications
and 29 granted patents across the three Horizon 2020 priorities ldquoexcellent sciencerdquo
ldquoindustrial leadershiprdquo and ldquosocietal challengesrdquo While these numbers show very early
indications of outputs directly related to or produced through EU intervention they are
hardly sufficient to draw conclusions about the innovation impact of Horizon 2020
Within this context impact refers to the wider societal economic or environmental
cumulative changes over a longer period of time (European Commission 2015b)
Innovation impact in that sense focuses on bridging discovery and market application
in order to achieve those changes (European Commission 2012) Current counts of
publication or patent outcomes for assessing the innovation impact of Horizon 2020
have two primary weaknesses First most projects have only just begun and the
eventual innovation impact can only be assessed once the projects have been finalised
and project outcomes have been commercially exploited Second publications and
patents describe the results of scientific inquiry as well as invention and are as such
more distant to actual exploitation eg through innovative products or services They
10
can in other words be characterised as intermediate innovation outcomes that create
potentials for ultimate innovation impact
This study provides an exploratory analysis of the current likelihood of innovation
impact of a small subset of Horizon 2020 The focus of this study is on Innovation
Actions and public procurement projects (PPP) for which contracts were signed in
2015 Because these actions have only started recently and are therefore still running
it is not possible to assess project outcomes ex-post Rather this study applies a
forward-looking methodology based on the proposals that were submitted to the calls
and subsequently contracted The goal of the study is to identify the likely innovation
impact of a project
The main analytical tool used in the study is a content analysis of the proposal texts
Social science research has frequently relied on content analysis It builds on the
insight that language is central in human cognition Accordingly cognitive schemas
can be inferred from the systematic replicable analysis of text (Duriau et al 2007)
Examples for the application of content analysis methods can be found in the
systematic use of media reports for the identification of public disapproval (Vergne
2012) or letters to shareholders for managerial cognition (Nadkarni and Barr 2008)
Proposal texts are a particularly fitting text source for applying content analysis
because Horizon 2020 uses standardised procedures and guidelines for the
development and evaluation of proposal texts which ensure that texts are uniformly
structured and comparable
The application of a content analysis requires that indicators are chosen that can be
reliably measured by this analytical technique Indicators are commonly defined as the
measurement of an objective to be met a resource mobilised an effect obtained or a
context variable (European Commission 2015b) This study develops and analyses
four indicators that can be assumed to mirror facets of a projectrsquos likely innovation
impact technological novelty market scope ecosystem embeddedness and
innovation readiness These indicators are measured for each of the 233 Innovation
Action and public procurement projects under study Moreover they are combined
with data on the composition and other characteristics of the project consortia in order
to derive a comprehensive assessment of the likely innovation impact
The content analysis of the proposal texts has some limitations The study is based on
counting the identified keywords that are to measure the four innovation impact
indicators These keywords do not measure the material content of the proposals nor
the actual outcome of the projects Therefore the analysis is measuring the initial
intention rather than the final results of the innovation project Moreover the writing
of the proposal and the development of the innovation are activities which are linked
but separate which is why the findings based on proposals might not fully hold for the
actual projects These limitations have to be taken into account when using this study
The ultimate goal of this study is to derive conclusions for the Innovation Actions and
public procurement projects as new instruments in Horizon 2020 at the instrument
and the programme level At the instrument level typical characteristics of proposals
that score highly on the selected indicators are identified and can be implemented as
recommendations for the configuration of consortia in future calls for proposals At the
programme level the assessment of the likely innovation impact of funded projects
provides one building block in the overall assessment of the effectiveness of these
instruments as suitable tools to achieve the stipulated objectives
The report is organized as follows Section 2 presents and discusses the innovation
impact indicators chosen for the analysis vis-agrave-vis the academic literature on this
topic Section 3 presents the methodology and data sources used in the analysis while
the results are presented in Section 4 Section 5 closes with a discussion and
implications followed by concluding remarks
11
2 COGNITIVE INDICATORS OF INNOVATION IMPACT
Many projects funded in Horizon 2020 are expected to have an innovation impact
However the projectsrsquo innovation impact is not readily measurable because projects
under consideration in this study have just been started and their full impact will only
be observable in the more distant future Moreover innovation impact originates from
the interaction of multiple innovation outcomes (eg technological performance
customer adoption market success) which can hardly be captured by traditional
indicators such as counts of patents or new products
Therefore this study takes an alternative approach and traces projectsrsquo innovation
impact back to the attention various consortia devote to specific innovation aspects in
their project proposals Following the attention-based theory of organisational
behaviour (Ocasio 1997) attention is defined here as the ldquonoticing encoding
interpreting and focusing of time and effortrdquo by a consortium on innovation issues and
action alternatives and mirrors the developing focus of a consortiumrsquos cognitive
endeavour (Eggers and Kaplan 2009) Dedicated attention of a consortium might
have an impact on how it will act in the future (cf Ocasio 1997 Barr 1998 Cho and
Hambrick 2006 Nadkarni and Barr 2008) Put differently consortia neglecting
particular issues ie not dedicating attention to them are unlikely to consider these
issues throughout the project The relationship between attention and actual action is
well established in the literature on managerial cognition in the context of
organisational renewal Specifically prior studies have provided empirical evidence for
the impact of managerial attention (measured through text analysis) on subsequent
observable organisational actions such as strategy changes (Cho and Hambrick
2006) new product launches (Eggers and Kaplan 2009) and patenting and alliance
activities (Kaplan et al 2003) Studying the attention helps to unveil the planned
input decisions a consortium wants to make regarding its innovation activities As
suggested by prior cognition research (eg Eggers and Kaplan 2009 Kaplan et al
2003) the greater an organisationrsquos attention towards a specific innovation aspect
(eg towards a new technology) the more likely it will have developed necessary
skills and expertise to succeed in this dimension (eg entering into a new product
market faster than competitors) Thus it can be hypothesised that on the basis of
differences in the attention towards specific topics heterogeneity between the
consortia regarding their input decisions is likely to occur which in turn will lead to
differences in project outcomes and innovation impact between the consortia In this
one has to bear in mind that proposal writing is an activity often decoupled from the
innovation development ndash which is why a certain ldquonoiserdquo might be observed stemming
from the involvement of professional partners in proposal writing
A basic premise of this study is that a consortiumrsquos attention is represented in a
consortiumrsquos project proposal (cf Kaplan 2011 Eggers and Kaplan 2009) in which
distinct attention foci can be set and expressed A proposal reflects a plan that
includes the purpose and objectives of the innovation and indicates measures the
consortium seeks to take to develop and commercialise the innovation Due to set
rules for the ultimate length of any proposal a consortium is forced to concentrate its
attention to the aspects it considers being most important and thus may emphasise
different innovation facets to a varying degree
To explore relevant facets of innovation impact that might be differentially emphasised
in proposal texts a thorough review of the extant academic literature was conducted
The objective of this review was to synthesise a set of indicators providing a
meaningful systematisation of relevant innovation facets that can be reliably measured
in the content analysis of proposal texts As a starting point existing literature review
articles on innovation (Brown and Eisenhardt 1995 Krishnan and Ulrich 2001
Montoya-Weiss and Calantone 1994) were screened for an initial set of important
innovation aspects This set was then refined by a review of further literature with
12
reference to the following criteria First only articles published in high-quality
academic management and innovation journals (including some practitioner-focused
journals such as Harvard Business Review) as well as innovation-related publications
of the European Commission such as the Innovation Radar methodology (De Prato et
al 2015) were considered Second potential indicators and related sub-items should
exhibit a strong contribution to innovation impact in terms of bridging discovery and
market application (ie ensuring the commercial exploitation of an innovation) andor
making a difference to economy and society (ie having the potential to increase
growth and employment) Thereby they should be consistent with previous definitions
of Horizon 2020 indicators (European Commission 2015b) Third the respective
indicators should capture conceptually discriminable contributions to innovation
impact assumed to also be cognitively distinguishable by a consortium Although
some overlap might be inevitable indicators should be sufficiently different from one
another in order to uncover different attention foci within proposals
Based on this review procedure four so-called cognitive indicators of innovation
impact were identified technological novelty market scope ecosystem
embeddedness and innovation readiness These indicators are used to measure the
attention the consortia devote to crucial innovation facets and thus can also be
referred to as attention foci In the following these indicators are described and
discussed in more detail
Technological Novelty
Technological novelty refers to the extent to which an innovation advances the
technological performance frontier more significantly than the existing technological
path (Gatignon et al 2002 Govindarajan and Kopalle 2006) and constitutes a major
transformation of existing products and services (OConnor and DeMartino 2006)
While technological novelty can reflect a technological breakthrough it can also be
traced back to a completely new combination of already existing technologies
processes and knowledge (European Commission 2015a OConnor 2008) According
to the basic differentiation of innovations (Dewar and Dutton 1986) the varying
degrees of technological novelty intended by the consortia can be described on a
continuum ranging from radical to incremental Thus a high degree of novelty
corresponds to a radical advancement of the technological performance frontier
rendering the existing product or service designs as well as the prevailing technologies
obsolete (Subramaniam and Youndt 2005 Chandy and Tellis 2000)
A low degree of novelty relates to incremental refinements or gradual progressions of
existing technologies that strengthen the potential of existing solutions and extant
product or service designs (Subramaniam and Youndt 2005 Ettlie 1983) In this
regard the technological novelty indicator focuses on the technology-based magnitude
of change rather than on the market-based consequences of an innovation
(Govindarajan and Kopalle 2006) Hence it only captures the degree of radicalness of
the technological dimension of the innovation but does not mirror whether it also
induces dramatic changes in the market For instance a completely new technology
(or novel combination of existing technologies) may create a new market and attract
new customers ndash also referred to as ldquoarchitectural innovationrdquo (Abernathy and Clark
1985) However it may also be applied to existing markets only without any changes
of market linkages while providing existing customers with a significantly better
technological solution ndash also labelled as ldquorevolutionary innovationrdquo (Abernathy and
Clark 1985)
Market Scope
Market scope relates to the extent to which an innovation has the potential to create a
new market (Hamel and Prahalad 1991) and introduces a different set of features
compared to existing products and services that is attractive to a new class of
13
customers (Govindarajan and Kopalle 2006 Christensen et al 2015 Darroch and
Miles 2011) It refers to the degree to which a consortiumrsquos innovation can unlock
untapped demand (Kim and Mauborgne 2005) or address a new customer segment
(Gilbert 2003) thereby creating the potential to develop and expand an entirely new
market or market segment It relates to the magnitude of change in customer value
propositions achieved through differences in features and performance characteristics
relative to established products and services (Govindarajan and Kopalle 2006
Charitou and Markides 2002)
Based on the reviewed literature innovations with a high degree of market scope are
typically reflected in two related but distinct forms of new-market creation as new-
market disruption (cf Christensen et al 2015) or as ldquoBlue Oceanrdquo strategy (cf Kim
and Mauborgne 2005) In the former case the innovation disrupts existing market
linkages or an entire industry by displacing established products or services
(Christensen and Bower 1996 Abernathy and Clark 1985) Typically at the time of
its introduction such an innovation serves only customers in niche markets who value
the innovationrsquos new characteristics However over time due to further
improvements the innovation attracts more and more customers in mainstream
markets and replaces existing offerings while crowding out incumbent providers
(Govindarajan and Kopalle 2006 Christensen et al 2015)
Alternatively the innovations can create uncontested market space labelled as ldquoBlue
Oceanrdquo without disrupting an existing market (Kim and Mauborgne 2005 Lindič et
al 2012) This kind of innovation embraces new additional demand by redefining a
customer problem and adding a new type of offering that did not exist before (Kim
and Mauborgne 1999) It complements rather than replaces existing offerings as it
typically addresses former non-customers and is not aimed at displacing incumbent
providers (Kim and Mauborgne 2015) A low degree of market scope on the other
hand indicates that the innovation tends to maintain and reinforce existing market
linkages while serving a new offering (but within established categories) to the same
customers who already bought the previous offering (Abernathy and Clark 1985)
For the purpose of this study it is important to separate technological novelty from
market scope since both can be achieved independently For instance Starbucks or
Southwest Airlines have shown that the creation of new additional demand does not
need to be based on cutting-edge technologies (Kim and Mauborgne 1999 2015)
Accordingly market scope explicitly captures the extent to which a consortium pays
attention to its innovation creating new demand but not whether this is achieved by a
radically new technology or based on existing technological solutions
Ecosystem Embeddedness
Ecosystem embeddedness refers to the extent to which the development and
commercialisation of an innovation is embedded in a community of organisations and
individuals who can affect or are affected by the innovation such as suppliers
customers and other stakeholders (Teece 2007 Clarkson 1995) It corresponds to
the degree to which the consortium understands itself as part of a system of
multilateral actors that need to co-operate in order for the innovation to materialise
(Adner 2006 2017)
Borrowing insights from neighbouring research on innovation networks (Gemuumlnden et
al 1996) and external knowledge sources (Koumlhler et al 2012 Grimpe and Sofka
2009) four major groups of ecosystem members were identified that a consortium
may take into consideration when pursuing its innovation activities (a) market-related
members such as end-users and customers competitors distributors consultants
intermediaries as well as organisations from other related industries (b) supplier-
related members such as main suppliers co-suppliers and complementors (c)
science-related members such as universities and research institutes and (d)
14
members of the wider innovation environment such as public legal political and
governmental institutions advocacy groups or civil society organisations
The notion of an innovation ecosystem goes beyond the concept of an innovation
network (cf Adner 2017) while an innovation network reflects a pattern of
connectivity in which network ties enable information flows (eg Powell et al 1996)
an ecosystem is additionally coupled with a specific purpose (eg the development of
a specific drug) and may be regarded as a configuration of activities determined by a
focal value proposition (Adner 2017) As such members of an innovation ecosystem
do not necessarily have to be affiliated with one and the same industry (Teece 2007)
but may come from different industries because cross-sectoral fertilisation can
stimulate open innovation (Leveacuten et al 2014 Laursen and Salter 2006)
A high degree of ecosystem embeddedness indicates that the consortium clearly
identifies and understands its own innovation ecosystem (Adner 2006 Adner and
Kapoor 2010) and closely collaborates with other members of the system (Davis
2016) A strong embeddedness allows for positive spill-over effects between the
consortium and the other ecosystem members during the development and
commercialisation of the innovation (De Prato et al 2015) Moreover it ensures
sufficient supplies of critical components and access to complementary assets such as
manufacturing capabilities and distribution channels (Teece 1986 2006) as well as
increases an innovationrsquos social acceptance or support from relevant stakeholders
making it unlikely for the consortium to be confronted by resistance or protests (Olsen
et al 2016) In contrast a low degree of ecosystem embeddedness corresponds to a
low awareness of the ecosystem with little attention to and collaboration with other
members in this case a consortium will risk to oversee opportunities that occur
outside of its internal focus (Chesbrough 2003) and will more likely face diffusion
barriers for its innovation (Talke and Hultink 2010)
Innovation Readiness
Innovation readiness corresponds to the extent to which an innovation achieves a
satisfactory level of technological maturity (European Commission 2014b) and is
likely to be successfully commercialised (De Prato et al 2015) On the basis of the
reviewed literature three main types of activities can be identified that underlie
innovation readiness and that a consortium may pursue to prepare and ensure
commercialisation The first type of activities is associated with the late stages of the
development process (Krishnan and Ulrich 2001 Montoya-Weiss and Calantone
1994) and includes technical tasks such as proving the technical feasibility of the
innovation (Hart et al 2003) designing testing and validating prototypes (Thomke
1998) validating the production process for the best prototype (Krishnan and Ulrich
2001) configuring the physical supply chain (Fisher 1997) as well as slowly scaling
up production as necessary for product and market testing (Terwiesch and Bohn
2001)
The second type of activities covers different strategic and operational marketing tasks
a consortium has to take into account to ensure market launch and diffusion (cf
Hultink et al 1997) Strategic marketing activities include market positioning and
product introduction timing (Chiesa and Frattini 2011) as well as the specification of a
business plan and model to capture financial value from the innovation (Zott et al
2011 Amit and Zott 2001) Operational marketing tasks cover activities related to
the classical marketing mix (Vorhies and Morgan 2003 2005 Vorhies et al 2009)
including product management (eg product-market research product
demonstration branding) pricing (eg price-setting) promotion (eg
advertisement communication) and distribution (eg distribution channels
logistics) The third type of activities related to innovation readiness encompasses
measures helping a consortium to protect the competitiveness of its innovation
(Pisano and Teece 2007 De Coster and Butler 2005) including intellectual property
15
rights (eg patents copyrights trademarks trade secrets) product certification or
ldquonaturalrdquo barriers to imitation (eg unique product features difficulty in reverse
engineering)
A high level of innovation readiness indicates a high degree of technical maturity of
the evolving innovation and its closeness to market (De Prato et al 2015) A low level
of innovation readiness reflects that the innovation is in an earlier stage of the
development process and rather far from being commercialised (European
Commission 2014b) While ecosystem embeddedness emphasises how well the
development and commercialisation of the innovation is embedded in a supporting
infrastructure of different stakeholders and thus focuses more on structural aspects
(Adner 2017) innovation readiness embraces the activities and tasks that the
consortium has to undertake to realise the innovation in the market place (cf
Krishnan and Ulrich 2001)
Table 1 gives an overview of the cognitive indicators of innovation impact including
their definition principles and selected literature references
16
Table 1 Overview of cognitive innovation indicators
Cognitive Innovation
Indicator
Definition Principles Selected References
(1) Technological
Novelty
The extent to which an
innovation significantly
advances the technological
performance frontier and
constitutes a major
transformation of existing
products and services
Focusing on an innovationrsquos technology-based
magnitude of change rather than on market
consequences
Ranging on a continuum from radical to incremental
innovation
Technological breakthrough and completely new
combination of existing technologies as typical
manifestations of high technological novelty that
have the potential to make prevailing solutions
obsolete
Gatignon et al (2002)
Govindarajan and
Kopalle (2006)
OrsquoConnor and DeMartino
(2006) Subramaniam
and Youndt (2005)
European Commission
(2015a)
(2) Market Scope The extent to which an
innovation has the potential to
create a new market and
introduces a different set of
features compared to existing
products and services that is
attractive to a new customer
segment
Focusing on an innovationrsquos market-based magnitude
of change regardless of its technological novelty
Relating to the extent of shifts in customer value
propositions
New-market disruption as a typical manifestation of
high market scope that changes established market linkages and displaces existing offerings
Blue ocean strategy as an alternative manifestation
of high market scope that creates uncontested market space and complements existing offerings
Hamel and Prahalad
(1991) Govindarajan
and Kopalle (2006)
Christensen et al
(2015) Kim and
Mauborgne (2005
2015) Charitou and
Markides (2002)
17
Cognitive Innovation
Indicator
Definition Principles Selected References
(3) Ecosystem
Embeddedness
The extent to which the
development and
commercialisation of an
innovation is embedded in a
community of organisations
and individuals who can affect
or are affected by the
innovation (eg suppliers
customers and other
stakeholders)
bull Viewing an innovation ecosystem as a system of
multilateral actors whose interactions enable an innovation to materialise
Going beyond the mere conception of innovation
networks since an ecosystem is also determined by a
focal value proposition
Strong ecosystem embeddedness allows for spill-over
effects between partners ensuring access to
complementary assets and increasing an
innovationrsquos social acceptance and support among
relevant stakeholders
Teece (1986 2007)
Clarkson (1995) Adner
(2006 2017) Leveacuten et
al (2014) Olsen et al
(2016) Talke and
Hultink (2010)
(4) Innovation
Readiness
The extent to which an
innovation achieves a
satisfactory level of
technological maturity and is
likely to be successfully
commercialised
Focusing on the content of activities for rolling out an
innovation rather than on the structural configuration
of such activities (as captured by the ecosystem
indicator)
Technical development tasks strategic and
operational marketing efforts as well as measures
protecting an innovationrsquos competiveness as main
types of activities underlying an innovationrsquos
readiness
High levels of technological maturity and
commercialisation preparation efforts indicate a high
degree of innovation readiness
European Commission
(2014b) De Prato et al
(2015) Krishnan and
Ulrich (2001) Hultink et
al (2007) Vorhies and
Morgan (2005) Pisano
and Teece (2007)
18
3 METHODOLOGY
The empirical methodology adopted in this study involves a number of different
analyses which are based on data for all 227 Innovation Actions and six public
procurement project proposals whose contracts were signed in 2015 Data on those
projects were taken from the CORDIS database which includes information on the
participants ndash their names type and home country ndash as well as on the projects ndash the
requested EC contribution the total project cost and the evaluation score of the
consortium These data serve to provide a basic description of the projects under
study but they are also combined with data generated from the proposal texts of
these projects The proposals are confidential and were made available for the
purpose of this study by the European Commission
Content Analysis
The main analytical technique of this study is a content analysis of the proposal texts
Content analysis builds on the assumption that cognitive schemas can be inferred from
the systematic replicable analysis of text (Duriau et al 2007) Consequently this
study adopts the idea that the cognitive innovation indicators as defined above can be
measured through the language adopted by the participants in a consortiumrsquos
proposal In other words dedicating attention to different aspects related to the
planned and foreseen innovation impact of the project is assumed to be reflected in
the proposal text of the consortium which will guide the research and innovation
activities performed within the project In this regard proposal texts are a particularly
fitting source for applying content analysis because Horizon 2020 uses standardised
procedures and guidelines for the development and evaluation of proposal texts which
ensure that texts are uniformly structured and comparable
An important step of any content analysis is the creation of a dictionary of words or
short phrases which can capture each construct of interest (Duriau et al 2007) The
methodology follows recent research on content analysis by applying a three-step
protocol which iteratively improves reliability and validity of the dictionaries (Olsen et
al 2016 Vergne 2012)
Based on an analysis of the relevant literature and existing tools typical
formulations of innovation-related project impacts are identified This analysis
results in an operational understanding in the way the innovation impact would
be expressed in a proposal text and creates an initial list of words and short
phrases for each one of the four dictionaries In this regard the Innovation
Radar methodology (De Prato et al 2015) plays a particularly important role in
complementing the list
In a second step experienced grant writers and evaluators in H2020 were asked
to assess the likelihood of the words on the initial word list for appearing in
proposal texts Twelve experts are involved in this step of the analysis including
two senior managers from private firms two senior researchers from research
institutes three university academics and five experts from the European
Commission The experts were also asked for additional words or short phrases
which they believe were missing The resulting dictionaries consist of a list of
words for which at least six experts agree that they have an above average
chance of appearing in a proposal text for each indicator To measure
technological novelty market scope ecosystem embeddedness and innovation
readiness we retain a list of 49 32 52 and 69 words respectively Sensitivity
checks with more stringent (eg agreement from a minimum of nine experts) or
more lenient dictionary inclusion restrictions lead to consistent classifications of
proposal texts with correlations ranging between 071 and 099 Hence the
dictionaries cover at least a core set of words and phrases that allows consistent
19
classifications of proposal texts Example words and phrases include
- Technological novelty advanced breakthrough first of its kind
- Market scope differentiate disrupt mainstream
- Ecosystem embeddedness cross-sectoral society supply chain
- Innovation readiness business plan prototype scaling up
The entire dictionaries can be found in the appendix Overall the overlap of the
dictionaries ie the number of words that appear in more than one dictionary is
low The items of the technological novelty dictionary could potentially overlap
with the 153 items of the other dictionaries but do so only in 33 of the cases
(eg ldquodisruptrdquo) market scope in 59 (eg ldquouserrdquo) ecosystem embeddedness
in 53 (eg ldquosupply chainrdquo) and innovation readiness in 98 (eg ldquopatentrdquo) of
the cases Hence the vast majority of words and phrases of each dictionary is
distinct and allows a meaningful differentiation between indicators Using the
software tool LIWC the resulting dictionaries are applied to all relevant sections
of proposal texts (with the headings ldquoExcellencerdquo ldquoImpactrdquo as well as
ldquoImplementationrdquo) ie excluding sections which contain standardised
administrative information The software calculates the percentage of words
from the dictionary in any relevant section of each proposal
As a last validation step 40 proposal texts were read and assessed with regard
to their likely innovation-related project impact This allows to calculate the
intercoder reliability (Krippendorff 2004) between the software generated and
manually generated assessment If the intercoder reliability is high the
dictionaries can be assumed to yield a valid and reliable measurement of the
innovation-related indicators of interest Krippendorffrsquos alpha is 075 for
technological novelty 064 for market scope 085 for ecosystem embeddedness
and 070 for innovation readiness Overall these coefficients indicate a
satisfactory level of intercoder reliability which confirms the validity of the
indicator scores generated through content analysis1
Reading the proposal texts also allows the identification of particularly insightful
passages of text that contain content and context for the planned innovation
impact These passages of text will be highlighted together with the results from
the content analysis and in that sense enable a qualitative validation of the
results
Throughout the analytical process quality management is applied through iterative
steps and recursive improvement The application of a content analysis requires that
indicators are chosen that can be reliably measured by this analytical technique The
choice of four cognitive indicators therefore also reflects the ambition to achieve
discriminant validity in the relevant dictionaries Some dictionaries may be too broad
to capture a single construct eg product markets versus markets for technology
Other dictionaries may have too much overlap with the dictionaries of other
constructs ie requiring a more precise differentiation between constructs Moreover
certain indicators such as the Technology Readiness Level (TRL) which is typically
measured on an ordinary scale from 1 to 9 (European Commission 2014b) are less
amenable to be measured through content analytical techniques because the score
1 Krippendorffrsquos alpha is a conservative measure of the observed and expected disagreement between raters (in this case between the software-generated rating and the one generated through manual reading of the proposals) and ranges between 0 and 1 When raters agree
perfectly alpha takes a value of 1 which indicates perfect reliability When they agree as if chance had produced the results alpha is 0 which indicates the absence of reliability In the social sciences values of alpha greater than 0667 are commonly accepted (Krippendorff 2004) The results show that the alpha for market scope is slightly below that threshold Yet lower values have been suggested acceptable in exploratory (rather than confirmatory) studies such as this one (Neuendorf 2002)
20
generated through content analysis cannot be readily converted into a particular TRL
Content analysis is also not an efficient way to measure the composition of the
consortium
In an exploratory part of the study the dictionaries derived from the content analysis
of grant proposals are applied to the call texts to which each of the proposals
responds Correlations between call and proposal texts are calculated and discussed
with regards to how much the foci expressed in the call texts can be re-traced in the
respective proposal texts
The four variables generated through content analysis therefore measure the
emphasis that grant writers have put on each of the four cognitive innovation
indicators A higher value in one variable indicates that a higher percentage of words
used in the proposal were found in one of the dictionaries ie applicants spent more
words describing one of the four facets of innovation impact
Cluster Analysis
The four variables generated through content analysis are subsequently combined
with the CORDIS data on the project level and used in a cluster analysis Specifically
the cognitive innovation indicators are used as cluster variables while the remainder of
variables are used to describe the resulting cluster solution in order to identify
patterns and derive implications The overall aim of a cluster analysis is to reduce
heterogeneity by defining groups of proposals that are similar within the group and as
dissimilar as possible between the groups (Milligan and Cooper 1987) The clusters
are then interpreted based on the average values of the cluster variables within each
cluster This grouping is similar to the method used in the Innovation Scoreboard
where indicators are combined and countries are ranked as ldquoinnovation leadersrdquo
ldquofollowersrdquo etc To account for the differences between Innovation Actions and public
procurement projects the cluster analysis is only performed on the 227 Innovation
Actions in the data while the six public procurement projects will be discussed
separately ie they represent their own cluster and will be discussed alongside the
others
Since this study pursues an exploratory approach the cluster analysis uses a
hierarchical clustering method Instead of partitioning the data in a single step
according to a particular number of clusters that is set ex-ante this type of method
runs a series of partition steps ranging from a single cluster including all cases to as
many clusters as cases exist (Everitt et al 2011) Specifically the study applies
Wardrsquos (1963) agglomerative hierarchical clustering procedure to the data which
merges two clusters on the basis of the sum of squared errors That is at each fusion
step the total within-cluster sum of squared errors is minimised (Everitt et al 2011)
Wardrsquos method is considered as one of the most reliable and robust clustering
methods and thus generally recommended in the literature The results of simulation
studies which compare different clustering algorithms have shown that Wardrsquos
algorithm in most cases yields very good partitions and tends to correctly assign
cases to clusters (Scheibler and Schneider 1985 Backhaus et al 2008)
To establish the appropriateness of Wardrsquos method for the present analysis the
preconditions for applying this method were checked (cf Backhaus et al 2008
Ketchen and Shook 1996) First variables are continuous and not too highly
correlated Second no outliers were found based on the single-linkage method which
tends to result in broad and unbalanced clusters Third the data is expected to
produce clusters of similar sizes with similar spread Fourth a distance measure
reflecting the dissimilarity between cases is used as a proximity metric rather than a
similarity measure reflecting the similarity between two cases In particular this study
applies the so-called Euclidean Distance measure which does not influence the
weighting of variances and thus is more suitable for the studyrsquos data structure than
21
the squared Euclidean Distance which weights small differences lower and large
differences higher (Backhaus et al 2008)
A crucial step in cluster analysis is the choice for the appropriate number of clusters
ie to find a meaningful number of clusters between the two extremes of only one
cluster containing all projects and one cluster for each of the projects Prior literature
has developed several approaches in order to identify an appropriate cluster solution
(cf Ketchen and Shook 1996) As a first approach a so-called dendogram a
mathematical and graphical representation of the clustering process also known as
tree diagram is drawn In a dendogram clusters are indicated by nodes and the
distance at which clusters are merged are represented by the length of the respective
stem thereby giving a first indication of possible cluster solutions (Everitt et al
2011) As a second approach the values at which cases are combined to build a
cluster the so-called agglomeration coefficients (also representing the sum of squared
errors) are plotted on a y-axis against the number of possible clusters on an x-axis
The point at which the resulting curve shows a clear flattening also referred to as the
ldquoelbow criterionrdquo corresponds to the appropriate number of clusters because from this
point the clusters being merged are very dissimilar (Ketchen and Shook 1996) To
substantiate these graphical approaches Mojenarsquos (1977) criterion is used according
to which a good cluster solution is indicated by the highest number of clusters for
which the standardised agglomeration coefficient exceeds a certain cut-off value for
the first time (Backhaus et al 2008) The literature suggests cut-off values between
275 and 350 to determine an appropriate number of clusters (Everitt et al 2011)
The clusters are subsequently characterised along relevant applicant and project
information eg the size of the consortium the project cost and its composition
(higher and secondary education private for profit public body research
organisations and other types of organisations)
4 RESULTS
Descriptive Results
Table 2 shows the descriptive statistics of the cognitive innovation impact indicators
for the Innovation Action projects under study The mean values indicate the
percentage of words in the respective proposal texts that appear in the respective
dictionaries Moreover the remaining columns show the standard deviation as well as
the minimum and maximum values of the variables in the data We find the highest
average value for the innovation readiness indicator (colour-coded in green) followed
by technological novelty ecosystem embeddedness (colour-coded in yellow) and
market scope (colour-coded in red) The values of the standard deviation are relatively
low indicating rather low variation of the variable value within the data However
particularly the maximum values show that there are some proposals in the data that
place very strong emphasis on the respective facet of innovation impact
Table 2 Cognitive innovation impact indicators for Innovation Actions (n=227)
Variable Mean Std Dev Min Max
Technological novelty 182 069 058 457
Market scope 126 051 039 431
Ecosystem embeddedness 136 052 054 387
Innovation readiness 243 061 119 494
The interpretation of the mean values of the four innovation indicators can only be
made relative to one another not in absolute terms This is because the frequency of
using certain words depends considerably on the specific type of text that is analysed
22
However evidence from prior research employing content analysis shows very similar
average values for constructs derived through this method (eg Olsen et al 2016)
In relative terms the results show that proposals place considerably higher emphasis
on outlining the readiness of the innovation to be developed compared to its market
scope This seems in accordance with the stipulated objectives of Innovation Actions
to facilitate innovation in contrast to funding research activities Nevertheless
proposals also stress technological novelty while remaining relatively quiet on
ecosystem embeddedness and market scope2
Table 3 further describe the projects under study The requested EC contribution and
total project costs are EUR 630 million and EUR 978 million respectively but there is
considerable variation among the projects as evidenced by the rather low minimum
and high maximum values Projects have on average 13 participants but the largest
project includes 50 participants Projects turn out to be dominated by private
companies There are on average seven companies involved in a project accompanied
by slightly more than two higher education institutions and two research
organisations Public entities and other types of participants only play a minor role Of
the private companies about half of them are SMEs Given the consortium
composition projects can be assumed to have a rather strong focus on applied
research and exploitation ndash a focus that would presumably be different had the
projects involved a higher share of higher education and research institutions
Consequently the average ldquobreadthrdquo of participants ie the number of different
participant types in a consortium equals three while the country breadth indicates that
participants from almost six different countries collaborate in a consortium The mean
evaluation score is 13
Table 3 Descriptive statistics for Innovation Actions (n=227)
Variable Mean Std Dev Min Max
Requested EC contribution (mEUR) 630 619 033 3933
Total project cost (mEUR) 978 1681 035 18108
Number of participants 1304 927 1 50
Number of higher education institutions 232 241 0 17
Number of private companies 730 638 0 43
Number of public bodies 058 149 0 12
Number of research organisations 216 175 0 9
Number of other participants 063 133 0 10
Number of SMEs 349 285 0 19
Participant breadth 314 106 1 5
Country breadth 588 263 1 16
Evaluation score 1302 102 10 15
evaluation score is missing for eleven projects
2 Since the length of the dictionaries originates from a validation exercise involving 12 experts there is no ex-ante optimal length All items of a given dictionary are supposed to reflect the same construct eg innovation readiness In principle the items are synonyms for one another (Duriau et al 2007) Dictionary length indicates that the experts could
think of many suitable synonyms not that proposals have to use many different words for expressing attention to a given construct The diversity of dictionary items in a given text is likely to indicate linguistic style but not necessarily more attention to a given construct All other things equal a proposal using marketing six times should not be treated differently than a proposal using marketing three times and advertising three times (both words are part of the innovation readiness dictionary)
23
Table 4 shows the scores of the cognitive innovation impact indicators of the six public
procurement projects Although the overall number of projects is low interesting
differences with the 227 Innovation Actions emerge The most pronounced cognitive
innovation impact indicator turns out to be ecosystem embeddedness closely followed
by innovation readiness and technological novelty Market scope only plays a minor
role similar to the Innovation Actions In general the mean and maximum values of
the four indicators appear to be much lower compared to the Innovation Actions
Table 4 Descriptive statistics public procurement projects (n=6)
Variable Mean Std Dev Min Max
Technological novelty 175 040 101 218
Market scope 108 015 089 128
Ecosystem embeddedness 192 033 148 233
Innovation readiness 184 043 119 250
Table 5 shows further descriptive statistics for the public procurement projects They
are considerably smaller on average than Innovation Actions The requested EC
contribution and total project cost are EUR 296 million and EUR 470 million
respectively Projects have on average nine participants and most of them are public
bodies followed by research organisations private companies and higher education
institutions This indicates a considerably different composition of the consortia
Moreover SME involvement is relatively rare Regarding the breadth measures we
find that almost four different types of participants and five different countries are
involved in the consortium The mean evaluation score is 1175
Table 5 Descriptive statistics for public procurement projects (n=6)
Variable Mean Std Dev Min Max
Requested EC contribution (mEUR) 296 145 078 472
Total project cost (mEUR) 470 146 270 677
Number of participants 883 382 6 15
Number of higher education institutions 117 147 0 4
Number of private companies 150 084 0 2
Number of public bodies 267 207 0 6
Number of research organisations 233 301 0 8
Number of other participants 100 063 0 2
Number of SMEs 067 052 0 1
Participant breadth 383 075 3 5
Country breadth 533 197 3 8
Evaluation score 1175 160 10 14
In sum the tables showing descriptive statistics for Innovation Actions and public
procurement projects indicate considerable differences between the two types of
projects These differences also warrant an exclusion of the only six public
procurement projects from the cluster analysis The public procurement projects will
however be discussed together with the results of the cluster analysis for the
Innovation Actions
Qualitative Results
The manual reading of 40 randomly selected proposal texts not only serves ndash as
indicated ndash to quantitatively validate the results of the content analysis by means of
interrater reliability statistics but also to provide a qualitative validation that rests on
24
the identification of particularly telling paragraphs of text In the following text boxes
will be presented by indicator containing selected quotes from the proposals with
above median scores of the respective indicators All quotes are anonymised
The quotes expressing technological novelty tend to stress the ground-breaking nature
of the technology to be developed its newness and potentially ldquoparadigm-shiftingrdquo
effect Moreover proposals often also highlight the novel combination and
recombination of already existing technologies which academic literature has
frequently characterised as the main source of innovation (eg Koumlhler et al 2012)
In several places descriptions of technological novelty are linked to the readiness of
the innovation for exploitation
Technological novelty
ldquo[Project acronym] brings knowledge and demonstration of two disruptive
technologies additive manufacturing and internet technologies to the industrial
partners including SMEs in the traditional toy and nursery furniture sectors
strengthening their competiveness and growthrdquo
ldquo[Project acronym] will provide innovative solutions to overcome existing bottlenecks
associated with Pulsed Electric Field preservation in the food industry for improving
food quality optimizing process efficiency reducing energetic cost and introducing
foods with new properties in the market with the final goal of providing a real‐scale
demonstration of the viability of the PEF technologyrdquo
ldquoThe technology has the potential to completely change the landscape of iron and
steelmaking in Europe over a 15 year periodrdquo
High attention to market scope is reflected in the following quotes They not only
describe possibilities to enter new markets develop niche markets or create entirely
new markets but they also often times suggest a change in the value proposition to
potential customers In some quotes attention to market scope is also very closely
linked to descriptions of technological novelty or innovation readiness for immediate
commercial exploitation
Market scope
ldquoCreation of new market opportunities both inside and outside Europe Market
potential outside Europe is identified in semi-arid environments (eg Morocco) or
monsoon environments (eg India) where there is a major need to optimize water
resource userdquo
ldquoTogether with [participant name] and [participant name] we want to disrupt the very
market where we compete and change the rules that run it reducing operation costs
by 80rdquo
ldquoThe [project acronym] technology will boost Europes industrial leadership in
advanced manufacturing and processing In addition it will foster employment and
open new market opportunities in this field This would relate both to the European
steel industry itself as well as the many European engineering companies supplying
the plant and equipmentrdquo
Attention to ecosystem embeddedness is explicitly expressed in the following quotes
Here proposals describe the communication diffusion and dissemination of their
project outcomes the integration into innovation networks as well as their
considerations for stakeholder acceptance and support These activities can be
25
expected to accelerate the uptake of innovations and to increase their societal impact
(eg Olsen et al 2016)
Ecosystem embeddedness
ldquoThe proposed project disseminates its results between medical technological and
managerial domains accordingly to a coherent plan of activities centered around an
active involvement of the various stakeholders on a multinational level Every
stakeholder will take part to one or more dissemination activities of the project [hellip]
The definition of communication needs for every stakeholder is an essential step
towards the institution of an effective network of collaborators partners and
stakeholders themselvesrdquo
ldquoWe see [project acronym] as an innovation system in the sense of Freeman as lsquoa
network of institutions in the public and private sectors whose activities and
interactions initiate import modify and diffuse new technologiesrsquo [Project acronym]
will be such an innovation system because it will gather the above mentioned
stakeholders in order to develop new applications methods and servicesrdquo
ldquoIn order to increase the intended impact beyond the implementation of the European
Railway Traffic Management System (ERTMS) European Train Control System (ETCS)
standard the [project acronym] consortium will disseminate information about the
projectrsquos objectives activities and results to a wide variety of stakeholders throughout
the Rail and Global Navigation Satellite System (GNSS) sector Beyond those partners
within the consortium and those involved in the research activities this includes
Railway Undertakings Infrastructure Managers GNSS equipment producers and
integrators GNSS services providers Research Centres and sub-system suppliersrdquo
Finally attention to the readiness of the innovation is typically expressed by focusing
on prototyping demonstration and validation The quotes indicate in some places a
close connection between innovation readiness and ecosystem embeddedness which
indicates that the consortium not only considers leaps in readiness but also the
exploitation of such leaps with different groups of customers or stakeholders
Innovation readiness
ldquoThree teams consisting of partner representatives will focus on (i) process prototyping
and demonstration (ii) product prototyping and validation towards safety and market
requirements and (iii) overall demonstration A unique ambition is to involve
particularly SME parties via a Sounding board Group consisting of potential users
(food suppliers food processors and dry product users) as well as food auctioneers
growers associations and retailrdquo
ldquoA Project Exploitation Plan will be developed describing joint and individual partnerrsquos
exploitation strategies The Exploitation Plan will cover potential products competitors
and the technology benchmarks It will describe the [project acronym] market position
and identify the potential market segments as well as specific academic and
commercial strategies to be implementedrdquo
ldquoThe main idea of the project is the finalisation of development industrialization and
commercialisation of the innovative in-wheel motor technology (patent pending)
developed by [participant name] The solution was already validated in real operating
conditions showing a competitive performance with a very positive market-feedbackrdquo
In sum the quotes from the proposal texts show that consortia deliberately use
certain words and short phrases in order to express attention to the four identified
dimensions of innovation impact This not only validates the automated content
26
analysis of the proposals but also holds insights on how these attention foci are
typically described in longer paragraphs of text This allows for a more systematic
identification and evaluation of the likely innovation impact in proposals
Comparison of Call and Proposal Texts
In a next step content analyses using the four cognitive innovation impact dictionaries
are applied to the 38 call texts to which the 233 proposals responded While content
analyses have been applied to call texts before (Olsen et al 2016) it is important to
note the difference in interpretation compared with proposal texts Call texts describe
an abstract research need or ambition not a concrete proposal for addressing it
Hence any content analysis reveals differences in attention paid to various facets of
innovation when expressing a research need or ambition
Table 6 provides an overview of the results from the content analysis using call texts
The 38 call texts contain on average 395 of words relating to technological novelty
271 for market scope 198 to ecosystem embeddedness and 340 to
innovation readiness The averages are consistently higher than for the proposal texts
and the extremes are more pronounced as evidenced by a larger range between
minimum and maximum values
Table 6 Descriptive statistics call texts (n=38)
Variable Mean Std Dev Min Max
Technological novelty 395 198 0 812
Market scope 271 180 0 769
Ecosystem embeddedness 198 133 0 646
Innovation readiness 340 157 074 705
When comparing the indicator averages for call texts with proposal texts call texts
devote comparatively more attention to technological novelty than to innovation
readiness The differential focus of call and proposal texts is further described in
Figure 1 In this figure the indicator scores are normalised to 100 for innovation
readiness Interestingly call texts pay about 16 more attention to technological
novelty than to innovation readiness Both for technological novelty and market scope
the differences between calls and proposals are particularly pronounced The focus on
ecosystem embeddedness is about the same in both calls and proposals These results
indicate that while calls stress technological novelty more than innovation readiness
proposals place much stronger focus on innovation readiness than on technological
novelty Given that Innovation Actions seek to increase the chances that technologies
are commercially exploited through innovation the comparatively higher focus on
novelty than on readiness in call texts seems counterintuitive Then again the
proposals of funded projects do focus on readiness to a much higher extent than on all
other dimensions of innovation impact
27
Figure 1 Comparison of call and proposal text attention foci
However such comparisons of averages may be driven by extreme values and
correlation analysis can provide additional insights In fact correlation analyses reveal
that cognitive innovation impact indicators between calls and proposals are
consistently positively correlated and highly significant (99 levels) The correlation
between attention expressed for technological novelty in call texts and in proposal
texts is 049 for market scope 041 for ecosystem embeddedness 048 and for
innovation readiness 024 While no reference figures for optimal levels of correlation
exist these correlation coefficients indicate quite some congruence between the
attention foci expressed in call and proposal texts It suggests that precisely worded
call texts are important tools for conveying emphasis and preferences of a research
need or ambition providing guidance for consortia and their proposals The call texts
under study achieve this to a lesser degree for innovation readiness
Finally all proposal texts under consideration are positively evaluated and eventually
contracted The positive correlations are also likely to indicate that evaluation
processes perform well in selecting proposals that have a close attention overlap with
the call Larger divergences between call and proposal attention foci are likely to be
found in proposals with lower evaluation scores
Cluster Analysis
The major challenge for cluster analytical techniques is the decision for an appropriate
number of clusters that provides a meaningful segmentation of the projects in the
data but at the same time does not conceal the heterogeneity among the projects
Using the four innovation indicators as cluster variables leads in a first step to two
graphical representations that facilitate the identification of clusters Figure 2 shows
the dendrogram of the clustering process after Wardrsquos method using the Euclidean
distance as distance measure The figure depicts the stepwise agglomeration of
projects to clusters To allow a meaningful interpretation of the clusters the resulting
solution should neither contain too few nor too many clusters (Everitt et al 2011)
Figure 2 turns out to be clearly suggestive of a three-cluster solution that combines
105 Innovation Action projects in the first cluster 64 projects in the second cluster
and 58 projects in the third cluster
0
20
40
60
80
100
120
140
Technological
novelty
Market scope Ecosystem
embeddedness
Innovation
readiness
Call
Proposal
28
Figure 2 Dendrogram of the cluster solution
The appropriateness of a three-cluster solution can be tested by applying the ldquoelbow
criterionrdquo For that purpose Figure 3 shows the sum of squared errors depending on
the number of clusters chosen The ldquoelbowrdquo indicates the point at which a rather large
reduction in the sum of squared errors per additional cluster compares favourably to a
relatively smaller reduction Literature suggests that this point indicates the number of
clusters to be chosen (Ketchen and Shook 1996 Backhaus et al 2008) Figure 3
shows that this is the case with a three-cluster solution
Figure 3 Sum of squared errors depending on the number of clusters
Finally the choice for the number of clusters should be substantiated by applying the
Mojena criterion which in our case also provides support for a three-cluster solution
(Mojena 1977 Everitt et al 2011)
In the next step the three clusters need to be further characterised in order to allow
for a meaningful interpretation Table 7 shows the mean values of the cluster variables
by cluster comparing them to the public procurement projects (PPP) A first glance on
the mean values shows important differences between the three clusters Cluster 1
which also is the cluster containing by far most of the projects scores comparatively
low for all four innovation impact indicators Clusters 2 and 3 each show a distinct
profile with Cluster 2 scoring highly on technological novelty market scope and
0
20
40
60
80
100
120
140
160
180
1 2 3 4 5 6 7 8 9 10 11 12 13 14 15 16 17 18 19 20 21 22 23 24 25 26 27 28 29 30 hellip
29
innovation readiness and Cluster 3 exhibiting high scores for ecosystem
embeddedness and innovation readiness In comparison to the cluster solution of the
Innovation Action projects the public procurement projects score relatively low but
they nevertheless show rather high ecosystem embeddedness It has to be noted
though that these average values are based only on six observations
Table 7 Mean of cluster variables by group
Clusters Obs Technological
novelty
Market scope Ecosystem
embeddedness
Innovation
readiness
Cluster 1 105 146 093 114 208
Cluster 2 64 266 160 119 269
Cluster 3 58 156 147 195 277
PPP 6 175 108 192 184
Total 233 182 125 138 241
To facilitate the interpretation of the cluster solution Figure 4 shows the T-values of
the cluster variables in the cluster solution ie standardised deviations of the
variables within the clusters relative to the overall sample mean The figure confirms
the first assessment of the descriptive statistics of the cluster variables Cluster 1 the
largest cluster with 105 projects shows low values for all four innovation indicators
relative to the sample means of the variables In other words projects in this cluster
exhibit relatively low focus on the four facets of innovation impact in their proposal
texts We label this cluster therefore as ldquoSustainingrdquo ie projects that in their
proposal dedicated modest attention to the four facets of innovation impact to be
achieved through the funding ldquoSustainingrdquo in that sense characterises projects with
an innovation impact likely to be limited and restrained
Cluster 2 shows a noticeably different profile Technological novelty market scope and
innovation readiness are highly pronounced suggesting that projects in this cluster
dedicate high attention to achieving breakthrough technological results which are
intended to help create markets These results should also be rather close to actual
exploitation while the embeddedness into the ecosystem is relatively low Thus we
refer to this cluster as ldquoPioneeringrdquo
Cluster 3 again differs quite substantially from the other two clusters in that it puts
high emphasis on ecosystem embeddedness followed by innovation readiness and
market scope Less attention is dedicated to the technological novelty of the project
Projects in this cluster hence aim at achieving diffusion and exploitation of the
innovative solution within the ecosystem which is why we refer to this cluster as
ldquoDiffusingrdquo
30
Figure 4 T-values of the cluster variables in the cluster solution
Overall and as expected the four cluster variables measuring the cognitive innovation
impact indicators are significantly different across the three clusters as an analysis of
variance (ANOVA) shows
As a next step the three-cluster solution and the group of public procurement projects
will be discussed with regard to the variables available to characterise the projects
Table 8 shows the results The columns contain the mean values of the respective
variables by cluster PPP and overall The final column presents the results of an
analysis of variance (ANOVA) and indicates whether the differences of the variable
means are statistically significant between the four groups (ie the three clusters and
the group of PPP)
Interesting differences emerge First the groups differ vastly in the average size of
the projects In absolute terms ldquoPioneeringrdquo projects turn out to have the highest
requested EC contribution closely followed by ldquoSustainingrdquo projects When it comes to
total project cost ldquoPioneeringrdquo projects show the highest value followed by
ldquoSustainingrdquo projects ldquoDiffusingrdquo projects and PPP are considerably smaller both in
terms of the requested EC contribution and the total project cost These differences
turn out to be statistically significant Comparing the requested contribution with the
total project cost leads to stark differences across the clusters The ratios of requested
contribution to total cost are 73 49 81 and 63 for the three clusters and
PPP respectively In that sense ldquoPioneeringrdquo projects require a rather low share of
budgetary contribution from the EU while dedicating high attention to technological
novelty market scope and innovation readiness In contrast ldquoSustainingrdquo and
ldquoDiffusingrdquo projects require a high share of budgetary contribution with ndash in the case
of ldquoSustainingrdquo projects ndash comparatively low focus all four dimensions of innovation
impact
Looking at the number of participants in the projects we do not find statistically
significant differences between the groups ldquoDiffusingrdquo projects and PPP have fewer
participants which coincides with the lower funding volume With regard to the
institutional composition of the projects we find stark differences between the groups
ldquoSustainingrdquo projects are relatively dominated by higher education institutions while
ldquoPioneeringrdquo projects typically involve relatively more private companies and research
organisations ldquoDiffusingrdquo projects have relatively fewer company participants PPP are
characterised by a strong presence of public bodies in the consortium The number of
SMEs is highest in ldquoPioneeringrdquo projects and lowest in PPP
-10 -05 00 05 10 15
Cluster 3
Cluster 2
Cluster 1
Technological novelty Market scope
Ecosystem embeddedness Innovation readiness
31
Moreover we find that the breadth of participants ie the number of different types
of participants present in the consortium is highest in the group of PPP indicating
high diversity within those projects while it is lowest for ldquoPioneeringrdquo projects
Apparently the planned activities in this group of projects require higher focus and
less institutional diversity Nevertheless projects in this group are characterised by
the highest number of different countries represented in the consortium while PPP
show the lowest diversity with respect to country origin of the participants Finally the
evaluation score does not vary much between the three clusters but turns out to be
considerably lower in the group of PPP
Table 8 Characterisation of the cluster solution
Variables Cluster 1
laquoSustainingraquo
Cluster 2
laquoPioneeringraquo
Cluster 3
laquoDiffusingraquo
PPP Total Sig
Requested EC
contribution (mEUR)
694 707 426 296 621
Total project cost
(mEUR)
946 1442 526 470 965
Number of
participants
1345 1409 1114 883 1293
Number of higher
education
institutions
242 216 231 117 229
Number of private
companies
761 884 503 150 715
Number of public
bodies
075 006 084 267 064
Number of research
organisations
198 256 205 233 217
Number of other
participants
064 044 081 100 064
Number of SMEs 337 431 279 067 342
Participant breadth 311 298 336 383 316
Country breadth 570 609 595 533 586
Evaluation score 1296 1295 1323 1175 1298
Obs 105 64 58 6 233
p lt 010 p lt 005 p lt 001
5 DISCUSSION AND IMPLICATIONS
This study makes two primary contributions to the assessment of likely innovation
impact within a certain subset of Horizon 2020 based on the exploratory analysis of
the proposals First it systematically establishes cognitive innovation impact indicators
which connect heterogeneity in innovation impact with differences in the attention that
consortia pay to particular innovation aspects Four central pillars for innovation
impact are related to cognitive processes and the allocation of attention Second this
study advances the measurement of cognitive innovation impact indicators by
applying content analyses and condensing the results through cluster analyses
Implications can be derived for both the funding instruments under study and for the
methodological development of innovation impact indicators
Implications for the Funding Instruments under Study
Horizon 2020 features the Innovation Action and innovation procurement instruments
in order to play a prominent role in bridging discovery with market application stages
and thus in helping to increase growth and employment in Europe (European
32
Commission 2014a) Yet a major challenge for the effective allocation of funding in
this respect is to verify whether these instruments actually deliver on innovation or
rather seek to primarily support research activities without the desired pronounced
focus on the commercial exploitation of innovation Since the projects under study
have only recently been started addressing this challenge within the scope of this
study necessarily remains incomplete However the results presented in this study
based on the analysis of the proposal texts allow to draw several conclusions
Within the conceptualisation of cognitive innovation impact any proposal text
represents the sum of the attention of the consortium (space considerations enforcing
priority setting) Consortia are heterogeneous in the degree to which they dedicate
attention to particular aspects ie divide the pie of overall attention Projects
focussing on research activities rather than on the commercial exploitation of
innovation can be expected to be dominated by considerations for technological
novelty Then again it would be unreasonable to assume little to no attention to
technological novelty in proposals directed at innovation Almost all innovation and
PPP call texts use technological novelty at least as a starting point and all proposals
contain indications of technological novelty That said the average proposal pays
roughly 33 more attention to innovation readiness than to technological novelty
Taking attention to readiness embeddedness and market scope together consortia
dedicate on average almost three times as much attention to the commercialisation of
technologies compared with describing technological novelty These results cannot rule
out that individual innovation proposals may be research projects in disguise
However this study finds little evidence in the large scale analysis that such concerns
can be generalised
Apart from these general considerations the following key insights can be derived
from the analyses
A cluster of proposals containing ldquoPioneeringrdquo project consortia can be identified
which pay comparatively more attention to achieving ambitious innovation
impact vis-agrave-vis the goals of Horizon 2020 Consortia are significantly more likely
to allocate their attention accordingly with increasing participation of private
firms including SMEs It is noteworthy that projects in this cluster combine
attention to technological novelty and market creation (market scope)
ldquoPioneeringrdquo consortia apparently require a combination of technological novelty
and market scope instead of an isolated pursuit of market scope in the absence
of technological novelty This suggests that the identification of innovation that is
potentially market creating requires careful assessment of the underlying
technology and its novelty
Another cluster of proposals containing ldquoDiffusingrdquo project consortia can be
identified with dedicated attention to diffusing innovation based on a broad
representation of the innovationrsquos ecosystem and its readiness Within the
ambition of Horizon 2020 for bridging discovery and market application these
consortia are clearly more specialised for the latter stages and can have an
important contribution for achieving market success
In the two clusters containing ldquoPioneeringrdquo and ldquoDiffusingrdquo projects attention to
market scope and innovation readiness are closely linked While projects in the
former cluster attach higher attention to technological novelty projects in the
latter cluster stress ecosystem embeddedness The joint occurrence of emphasis
on market scope and innovation readiness in an overall large number of projects
suggests that market creation requires a leap forward in the readiness of the
underlying innovation
33
A substantial share of Innovation Action projects can be characterised as
ldquoSustainingrdquo Project proposals in this cluster contain only modest focus on the
four innovation impact indicators That in turn indicates low ambition to increase
the chances that technologies will be successfully commercialised It is striking
that ldquoSustainingrdquo projects constitute the largest group of projects Nevertheless
the analysis only includes consortia that received funding It is therefore not
possible to compare ldquoSustainingrdquo projects with those proposals that did not
receive funding Within the context of this study ldquoSustainingrdquo projects should
therefore be considered as a baseline reference group for ldquoPioneeringrdquo and
ldquoDiffusingrdquo cluster proposals
With the caveat of the limited number of PPP proposals analysed in this study
they share many attention allocation similarities with Innovation Actions
However the attention devoted to innovation readiness is comparatively lower
There is a risk that PPP currently do not allocate enough attention to the broader
market application of innovation beyond public procurement
Overall the comparatively low scores for market scope across all projects under
study in comparison to the other cognitive innovation impact indicators suggest
that based on the content of the proposals the current schemes are not geared
towards supporting market creating innovation Then again the creation of new
markets is difficult to describe ex-ante as market creation largely depends on
product markets and demand conditions that are hard to predict in detail ex-ante
because market research techniques can only be applied to existing markets
Attention allocation expressed in call texts largely guides the attention allocation
of consortia in proposal texts andor evaluators However despite being
Innovation Actions call texts put comparatively higher emphasis on
technological novelty than on market scope ecosystem embeddedness and
innovation readiness although the latter three indicators are particularly
associated with the commercial exploitation of innovation
Implications for Innovation Indicators
No single innovation impact indicator is per se superior to others The cognitive
innovation impact indicators proposed in this study can alleviate some of the
weaknesses of more traditional approaches Ideally evaluations combine multiple
indicators such as cognitive innovation impact indicators based on content analysis
combined with a continuous monitoring through surveys as in the Innovation Radar
(De Prato et al 2015) Cross-validation of indicators for a selected set of proposals
has the largest potential for obtaining reliable sets of indicators Table 9 provides an
overview of the strengths and weaknesses of different innovation indicators
The cognitive innovation impact indicators proposed in this study allow an early
assessment of the likely innovation impact of the proposals even before they are
actually funded They build on the assumption that the participants in a consortium
have to devise a joint approach for solving an innovation problem in order to
successfully exploit the project outcome This joint approach requires the consortium
to allocate attention to areas related to innovation impact Due to limited attention
and resources consortia have to prioritise Cognitive innovation impact indicators are
based on the idea that the allocation of attention and the prioritisation of resources as
described in the proposal will be carried through during the term of the project
leading to higher or lower innovation impact along the four dimensions identified
The analysis presented in this study does not allow qualifying one of the four cognitive
innovation impact indicators as more important than the others in its overall
contribution towards innovation impact Rather the theoretical reasoning and
empirical analysis suggest that consortia need to reflect on all four indicators in their
34
proposals in order to increase the chances for successful innovation Each indicator
reflects a distinct dimension of innovation impact and a dedicated allocation of
attention to these four dimensions can be assumed to translate into focus on
innovation impact while actually carrying out the planned activities in the project
While it is still too early to conclude whether the articulated focus on innovation in the
projects will materialise the four indicators allow an eye on the extent Horizon 2020
will deliver on innovation
This study proposes four indicators to measure the extent to which Horizon 2020 will
deliver on innovation in the short medium and longer term These indicators focus on
innovation instead of research impact by connecting the attention for technological
novelty with attention to product market considerations for commercialisation ie
market scope ecosystem embeddedness as well as innovation readiness On average
the studied project proposals devote almost three times as much attention to the
latter issues compared with technological novelty Such systematic quantifications of
attention allocation across large numbers of project proposals are a unique advantage
of content analyses While this allocation of attention cannot be directly translated into
consortia budget provisions and market outcomes the large share of attention
devoted to commercialisation provides confidence that Horizon 2020 will have
important innovation outcomes in the short and medium term Especially the attention
that ldquoPioneeringrdquo and ldquoDiffusingrdquo project consortia devote to innovation readiness
suggests that impact is likely to occur rather sooner than later Projects in these
clusters comprise the majority of innovation projects under consideration Long term
consequences cannot be credibly predicted based on attention allocation at any given
point in time since attention is likely to be re-allocated based on experience and
feedback eg through customer responses or competitor behaviour Potential future
studies could draw on both cognitive and other types of innovation indicators (ie
survey-based qualitative and quantitative) to verify the findings of this report and
assess potential long-term consequences In relative terms public procurement
projects allocate less attention to innovation readiness With the caveat of small
sample size for these projects in mind it is comparatively less likely that they will
contribute to the innovation goals of Horizon 2020 in the short term
Finally a cross-check of the proposed indicators of this study with the evaluation
criteria of projects within the relevant schemes provides confidence in the selection of
projects First all projects fulfil at least a minimum level of attention to technological
novelty market scope ecosystem embeddedness as well as innovation readiness
Second the allocation of attention to these four indicators expressed in project
proposals correlates positively and significantly with the attention expressed in the
respective call Hence a cognitive transfer of attention priorities from call texts to
funded consortia has successfully occurred Finally there is no systematic evidence
that innovation project proposals are research proposals in disguise since
technological novelty does not dominate proposal attention Given that this study
analyses exclusively granted project proposals it is equally likely that such proposals
have not been submitted or that evaluators have performed their duties well and
ranked them low In both cases the purpose of the grant scheme would have been
accomplished
35
Table 9 Overview of strengths and weaknesses of different innovation indicators
Cognitive innovation impact
indicators
Survey-based innovation
impact indicators
Quantitative innovation
impact indicators (eg
publications patents)
Qualitative innovation impact
indicators (eg case studies)
Strengths Non-intrusive administration
Large scale application
Applicable and observable for
unsuccessful consortia
Systematic and replicable
Short processing time and
availability
Quantitative results
Benchmarking
Comparison over time
Cross-country comparisons
Quantitative results
Benchmarking
Comparison over time
Cross-country comparisons
Comparable quality
standards
Deep context-specific
insights
Tailored to innovation
Comprehensive set of
impacts eg societal
Weaknesses Expressed intention may not
be followed by action
Professional grant
consultants eliminate
heterogeneity
Vulnerable to confirmation
bias
Potential for ex-post
rationalisation
Administrative effort for
innovators
Costs for surveying
sampling
Survival bias
Limited to selected outcomes
Limited to selected sectors
and industries
Potentially long time delay
Time and cost intensive
Important selection biases
Significant efforts from
innovators
Potential for ex-post
rationalization
Potential for conformity
biases
36
REFERENCES
Abernathy WJ and KB Clark (1985) Innovation Mapping the Winds of Creative
Destruction Research Policy 14 (1) 3-22
Adner R (2006) Match Your Innovation Strategy to Your Innovation Ecosystem
Harvard Business Review 84 (4) 98-107
Adner R (2017) Ecosystem as Structure an Actionable Construct for Strategy
Journal of Management 43 (1) 39-58
Adner R and R Kapoor (2010) Value Creation in Innovation Ecosystems How the
Structure of Technological Interdependence Affects Firm Performance in New
Technology Generations Strategic Management Journal 31 (3) 306-333
Amit R and C Zott (2001) Value Creation in E-Business Strategic Management
Journal 22 (6-7) 493-520
Backhaus K B Erichson W Plinke and R Weiber (2008) Multivariate
Analysemethoden Eine Anwendungsbezogene Einfuumlhrung Berlin
Barr PS (1998) Adapting to Unfamiliar Environmental Events A Look at the
Evolution of Interpretation and Its Role in Strategic Change Organization Science 9
(6) 644-669
Brown SL and KM Eisenhardt (1995) Product Development Past Research
Present Findings and Future Directions Academy of Management Review 20 (2)
343-378
Chandy RK and GJ Tellis (2000) The Incumbentrsquos Curse Incumbency Size and
Radical Product Innovation Journal of Marketing 64 (3) 1-17
Charitou CD and CC Markides (2002) Responses to Disruptive Strategic
Innovation MIT Sloan Management Review 44 (2) 55-64
Chesbrough HW (2003) The Era of Open Innovation MIT Sloan Management
Review 44 (3) 35-41
Chiesa V and F Frattini (2011) Commercializing Technological Innovation Learning
from Failures in High-Tech Markets Journal of Product Innovation Management 28
(4) 437-454
Cho TS and DC Hambrick (2006) Attention as the Mediator between Top
Management Team Characteristics and Strategic Change The Case of Airline
Deregulation Organization Science 17 (4) 453-469
Christensen CM and JL Bower (1996) Customer Power Strategic Investment and
the Failure of Leading Firms Strategic Management Journal 17 (3) 197-218
Christensen CM M Raynor and R McDonald (2015) What Is Disruptive
Innovation Harvard Business Review 93 (12) 44-53
Clarkson ME (1995) A Stakeholder Framework for Analyzing and Evaluating
Corporate Social Performance Academy of Management Review 20 (1) 92-117
Darroch J and MP Miles (2011) A Research Note on Market Creation in the
Pharmaceutical Industry Journal of Business Research 64 (7) 723-727
Davis JP (2016) The Group Dynamics of Interorganizational Relationships
Collaborating with Multiple Partners in Innovation Ecosystems Administrative
Science Quarterly 61 (4) 621-661
De Coster R and C Butler (2005) Assessment of Proposals for New Technology
Ventures in the Uk Characteristics of University Spin-Off Companies Technovation
25 (5) 535-543
De Prato G D Nepelski and G Piroli (2015) Innovation Radar Identifying
Innovations and Innovators with High Potential in Ict Fp7 Cip amp H2020 Projects
JRC Scientific and Policy Reports ndash EUR 27314 EN Seville JRC-IPTS No
Dewar RD and JE Dutton (1986) The Adoption of Radical and Incremental
Innovations An Empirical Analysis Management Science 32 (11) 1422-1433
Duriau VJ RK Reger and MD Pfarrer (2007) A Content Analysis of the Content
Analysis Literature in Organization Studies Research Themes Data Sources and
Methodological Refinements Organizational Research Methods 10 (1) 5-34
37
Eggers JP and S Kaplan (2009) Cognition and Renewal Comparing Ceo and
Organizational Effects on Incumbent Adaptation to Technical Change Organization
Science 20 (2) 461-477
Ettlie JE (1983) Organizational Policy and Innovation among Suppliers to the Food
Processing Sector Academy of Management Journal 26 (1) 27-44
European Commission (2010) Europe 2020 A Strategy for Smart Sustainable and
Inclusive Growth No COM(2010) 2020 final
European Commission (2012) The Grand Challenge The Design and Societal Impact
of Horizon 2020 Brussels
European Commission (2014a) Horizon 2020 in Brief The Eu Framework Programme
for Research amp Innovation Brussels
European Commission (2014b) Technology Readiness Levels (Trl) HORIZON 2020 ndash
Work Programme 2014-2015 General Annexes Extract from Part 19 No
Commission Decision C(2014)4995 Brussels
European Commission (2015a) The Contribution of the Framework Programme to
Major Innovations Brussels
European Commission (2015b) Horizon 2020 Output Indicators Assessing the Results
and Impact of Horizon 2020 Brussels
European Commission (2016) Horizon 2020 Monitoring Report 2015 No
httpseceuropaeuresearchevaluationspdfarchiveh2020_monitoring_reportss
econd_h2020_annual_monitoring_reportpdfview=fitamppagemode=none Brussels
Everitt BS S Landau M Leese and D Stahl (2011) Cluster Analysis New York
Fisher ML (1997) What Is the Right Supply Chain for Your Product Harvard
Business Review 75 (2) 105-116
Gatignon H ML Tushman W Smith and P Anderson (2002) A Structural Approach
to Assessing Innovation Construct Development of Innovation Locus Type and
Characteristics Management Science 48 (9) 1103-1122
Gemuumlnden HG T Ritter and P Heydebreck (1996) Network Configuration and
Innovation Success An Empirical Analysis in German High-Tech Industries
International Journal of Research in Marketing 13 (5) 449-462
Gilbert C (2003) The Disruption Opportunity MIT Sloan Management Review 44 (4)
27-33
Govindarajan V and PK Kopalle (2006) Disruptiveness of Innovations
Measurement and an Assessment of Reliability and Validity Strategic Management
Journal 27 (2) 189-199
Grimpe C and W Sofka (2009) Search Patterns and Absorptive Capacity Low-and
High-Technology Sectors in European Countries Research Policy 38 (3) 495-506
Hamel G and CK Prahalad (1991) Corporate Imagination and Expeditionary
Marketing Harvard Business Review 69 (4) 81-92
Hart S E Jan Hultink N Tzokas and HR Commandeur (2003) Industrial
Companies Evaluation Criteria in New Product Development Gates Journal of
Product Innovation Management 20 (1) 22-36
Hultink EJ A Griffin S Hart and HSJ Robben (1997) Industrial New Product
Launch Strategies and Product Development Performance Journal of Product
Innovation Management 14 (4) 243-257
Kaplan S (2011) Research in Cognition and Strategy Reflections on Two Decades of
Progress and a Look to the Future Journal of Management Studies 48 (3) 665-
695
Kaplan S F Murray and R Henderson (2003) Discontinuities and Senior
Management Assessing the Role of Recognition in Pharmaceutical Firm Response
to Biotechnology Industrial and Corporate Change 12 (2) 203-233
Ketchen DJ and CL Shook (1996) The Application of Cluster Analysis in Strategic
Management Research An Analysis and Critique Strategic Management Journal 17
441-458
Kim WC and R Mauborgne (1999) Creating New Market Space Harvard Business
Review 77 (1) 83-93
Kim WC and R Mauborgne (2005) Blue Ocean Strategy From Theory to Practice
California Management Review 47 (3) 105-121
38
Kim WC and R Mauborgne (2015) Red Ocean Traps Harvard Business Review 93
(3) 68-73
Koumlhler C W Sofka and C Grimpe (2012) Selective Search Sectoral Patterns and
the Impact on Product Innovation Performance Research Policy 41 (8) 1344-1356
Krippendorff K (2004) Content Analysis An Introduction to Its Methodology
Thousand Oaks CA
Krishnan V and KT Ulrich (2001) Product Development Decisions A Review of the
Literature Management Science 47 (1) 1-21
Laursen K and A Salter (2006) Open for Innovation The Role of Openness in
Explaining Innovation Performance among Uk Manufacturing Firms Strategic
Management Journal 27 (2) 131-150
Leveacuten P J Holmstroumlm and L Mathiassen (2014) Managing Research and Innovation
Networks Evidence from a Government Sponsored Cross-Industry Program
Research Policy 43 (1) 156-168
Lindič J M Bavdaž and H Kovačič (2012) Higher Growth through the Blue Ocean
Strategy Implications for Economic Policy Research Policy 41 (5) 928-938
Milligan GW and MC Cooper (1987) Methodology Review Clustering Methods
Applied Psychological Measurement 11 (4) 329-354
Mojena R (1977) Hierarchical Grouping Methods and Stopping Rules An Evaluation
The Computer Journal 20 (4) 359-363
Montoya-Weiss MM and R Calantone (1994) Determinants of New Product
Performance A Review and Meta-Analysis Journal of Product Innovation
Management 11 (5) 397-417
Nadkarni S and PS Barr (2008) Environmental Context Managerial Cognition and
Strategic Action An Integrated View Strategic Management Journal 29 (13) 1395-
1427
Neuendorf KA (2002) The Content Analysis Guidebook Thousand Oaks CA
OConnor GC (2008) Major Innovation as a Dynamic Capability A Systems
Approach Journal of Product Innovation Management 25 (4) 313-330
OConnor GC and R DeMartino (2006) Organizing for Radical Innovation An
Exploratory Study of the Structural Aspects of Ri Management Systems in Large
Established Firms Journal of Product Innovation Management 23 (6) 475-497
Ocasio W (1997) Towards an Attention-Based View of the Firm Strategic
Management Journal 18 (S1) 187-206
Olsen A W Sofka and C Grimpe (2016) Coordinated Exploration for Grand
Challenges The Role of Advocacy Groups in Search Consortia Academy of
Management Journal
Pisano GP and DJ Teece (2007) How to Capture Value from Innovation Shaping
Intellectual Property and Industry Architecture California Management Review 50
(1) 278-296
Powell WW KW Koput and L Smith-Doerr (1996) Interorganizational
Collaboration and the Locus of Innovation Networks of Learning in Biotechnology
Administrative Science Quarterly 41 (1) 116-145
Scheibler D and W Schneider (1985) Monte Carlo Tests of the Accuracy of Cluster
Analysis Algorithms A Comparison of Hierarchical and Nonhierarchical Methods
Multivariate Behavioral Research 20 (3) 283-304
Schilling MA (2016) Strategic Management of Technological Innovation New York
Subramaniam M and MA Youndt (2005) The Influence of Intellectual Capital on the
Types of Innovative Capabilities Academy of Management Journal 48 (3) 450-463
Talke K and EJ Hultink (2010) Managing Diffusion Barriers When Launching New
Products Journal of Product Innovation Management 27 (4) 537-553
Teece DJ (1986) Profiting from Technological Innovation Implications for
Integration Collaboration Licensing and Public Policy Research Policy 15 (6) 285-
305
Teece DJ (2006) Reflections on ldquoProfiting from Innovationrdquo Research Policy 35 (8)
1131-1146
39
Teece DJ (2007) Explicating Dynamic Capabilities The Nature and Microfoundations
of (Sustainable) Enterprise Performance Strategic Management Journal 28 (13)
1319-1350
Terwiesch C and RE Bohn (2001) Learning and Process Improvement During
Production Ramp-Up International Journal of Production Economics 70 (1) 1-19
Thomke SH (1998) Managing Experimentation in the Design of New Products
Management Science 44 (6) 743-762
Vergne J-P (2012) Stigmatized Categories and Public Disapproval of Organizations
A Mixed-Methods Study of the Global Arms Industry 1996ndash2007 Academy of
Management Journal 55 (5) 1027-1052
Vorhies DW and NA Morgan (2003) A Configuration Theory Assessment of
Marketing Organization Fit with Business Strategy and Its Relationship with
Marketing Performance Journal of Marketing 67 (1) 100-115
Vorhies DW and NA Morgan (2005) Benchmarking Marketing Capabilities for
Sustainable Competitive Advantage Journal of Marketing 69 (1) 80-94
Vorhies DW RE Morgan and CW Autry (2009) Product‐Market Strategy and the
Marketing Capabilities of the Firm Impact on Market Effectiveness and Cash Flow
Performance Strategic Management Journal 30 (12) 1310-1334
Ward JH (1963) Hierarchical Grouping to Optimize an Objective Function Journal of
the American Statistical Association 58 (301) 236-244
Zott C R Amit and L Massa (2011) The Business Model Recent Developments and
Future Research Journal of Management 37 (4) 1019-1042
40
APPENDIX
DICTIONARY TECHNOLOGICAL NOVELTY
Word stems and phrases
advan highly efficient solution
breakthrough improv solv
chang innovati step
combin invent substantial
compared to state of the art leading superior
compared to state-of-the-art major sustainable
compared to the state of the art new technolog
compared to the state-of-the-art novel than state of the art
disrupt optimis than state-of-the-art
enhanc optimiz than the state of the art
first of a kind patent than the state-of-the-art
first of its kind process transformat
first-of-a-kind product ultra
first-of-its-kind progressiv world leading
fundamental radical world-leading
high yield revolution
high-yield significan Note indicates all possible word endings
DICTIONARY MARKET SCOPE
Word stems and phrases
addition disrupt product
applica end-user redefin
augment enduser replac
challeng entry revenue
client industry scop
competit internat segment
complement introduc substitut
consumer mainstream transform
customer market turnover
demand niche user
differentiat pioneer Note indicates all possible word endings
41
DICTIONARY ECOSYSTEM EMBEDDEDNESS
Word stems and phrases
accept ecosystem public
bridg engag relation
bring together environment resell
bringing together exchang shared
citizen feedback social
civil holistic societ
cluster inclus socio-economic
co-operat inter-sectoral socioeconomic
collabor interact spill-over
communit interdisciplinar spillover
complement intermediar stakeholder
consult involv supplier
consumer joined supply chain
cooperat joint transfer
cross-sectoral licens universit
customer networking user
distribut participat
eco-system partner Note indicates all possible word endings
DICTIONARY INNOVATION READINESS
Word stems and phrases
accelerat feasibilit readiness
adapt financ ready
advertis fund return on investment
appl incubat roi
approv intellectual propert roll out
assess invest sales
benchmark ip scale up
brand launch scale-up
business model loan scaling up
business plan manufactur scaling-up
certificat market research standard
commerciali market share start up
communication strategy marketing start-up
competitiveness matur startup
consumer patent supply chain
copyright pilot test
customer pric tool
demonstrat private equity trademark
deploy production update
disseminat promoti user
distribut proof validat
entrepreneur protecti value proposition
exploit prototyp viab Note indicates all possible word endings
HOW TO OBTAIN EU PUBLICATIONS
Free publications
bull one copy
via EU Bookshop (httpbookshopeuropaeu)
bull more than one copy or postersmaps
from the European Unionrsquos representations (httpeceuropaeurepresent_enhtm)
from the delegations in non-EU countries
(httpeeaseuropaeudelegationsindex_enhtm)
by contacting the Europe Direct service (httpeuropaeueuropedirectindex_enhtm)
or calling 00 800 6 7 8 9 10 11 (freephone number from anywhere in the EU) () () The information given is free as are most calls (though some operators phone boxes or hotels may charge you)
Priced publications
bull via EU Bookshop (httpbookshopeuropaeu)
Priced subscriptions
bull via one of the sales agents of the Publications Office of the European Union
(httppublicationseuropaeuothersagentsindex_enhtm)
doi 102777610808
KI-N
A-2
8-5
32-E
N-N
Innovation actions were introduced in Horizon 2020 to help bringing discoveries to the market Most of them demonstrate the application of new knowledge in real-life conditions The very first projects started in 2014 and it still is too early for them to produce final results but a short study was commissioned to look into the projects based on proposal texts (Grimpe C et al Study on Innovation in Horizon 2020 Projects EC) For this study 227 Innovation Actions and six innovation
procurement actions were selected that started in 2015 most of them in the PPPs such as Ecsel Clean Sky Factories of the Future Energy Efficient Buildings Clean Vehicle but also in other calls (FTI ICT NMP environmental technologies Galileo and others) The texts of the granted projects were analysed using content analysis methodology based on keywords that indicate four innovation aspects technological novelty market scope ecosystem embeddedness and innovation readiness
The projects were grouped in three categories 64 out of the 227 innovation actions score high on
technological novelty market scope and innovation readiness but low on ecosystem embeddedness These are called pioneering projects They seem to focus on breakthrough technological results that may create markets To the contrary another 58 innovation actions emphasise ecosystem embeddedness and score lower on the other three aspects These are called diffusing projects that aim at diffusion and exploitation of the innovative solution in the ecosystem The remaining 105 innovation actions pay only modest attention to each of the four
aspects These are called sustaining projects The composition of the consortia differs pioneering projects involve relatively more private companies esp SMEs and research institutions The diffusing projects have less companies and more public bodies The sustaining projects are
dominated by higher education institutions It is still too early to characterise these innovation actions and their impacts but these initial findings indicate that a quarter have a disruptive market-creating potential and that companies and research institutions play a leading role in these initiatives
The six innovation procurement projects share many attention allocation similarities with the innovation actions However the attention devoted to innovation readiness and market scope is comparatively lower There is a risk that these projects do not allocate enough attention to the broader market application of innovation beyond public procurement
These conclusions are based on the texts of the projects at their start The results of the projects are expected in 2018-2019
Studies and reports
[Ca
talo
gu
e n
um
be
r]

EUROPEAN COMMISSION
Directorate-General for Research and Innovation
2014 EUR 28532 EN
Study on Innovation in Horizon 2020 Projects
A content analysis of 233 innovation project proposals
awarded in 2015
Final report
LEGAL NOTICE
The information and views set out in this study are those of the authors and do not necessarily reflect the official opinion of the Commission The Commission does not guarantee the accuracy of the data included in this study Neither the Commission nor any person acting on the Commissionrsquos behalf may be held responsible for the use which may be made of the information contained therein
More information on the European Union is available on the Internet (httpwwweuropaeu)
Luxembourg Publications Office of the European Union 2014
ISBN 978-92-79-66946-0 doi 102777610808 ISSN 1831-9424 copy European Union 2014
Europe Direct is a service to help you find answers
to your questions about the European Union
Freephone number ()
00 800 6 7 8 9 10 11
() The information given is free as are most calls (though some operators phone boxes or hotels may charge you)
5
TABLE OF CONTENTS
EXECUTIVE SUMMARY 6
1 INTRODUCTION 9
2 COGNITIVE INDICATORS OF INNOVATION IMPACT 11
Technological Novelty 12
Market Scope 12
Ecosystem Embeddedness 13
Innovation Readiness 14
3 METHODOLOGY 18
Content Analysis 18
Cluster Analysis 20
4 RESULTS 21
Descriptive Results 21
Qualitative Results 23
Comparison of Call and Proposal Texts 26
Cluster Analysis 27
5 DISCUSSION AND IMPLICATIONS 31
Implications for the Funding Instruments Under Study 31
Implications for Innovation Indicators 33
REFERENCES 36
APPENDIX 40
6
EXECUTIVE SUMMARY
Horizon 2020 puts special emphasis on a number of cross-cutting issues that are
intended to develop new knowledge competences and technological breakthroughs
with the aim to translate knowledge into economic and societal value One of these
cross-cutting issues focuses on facilitating innovation by bridging discovery with
market application stages This study provides an exploratory analysis of the current
likelihood of innovation impact of a small subset of Horizon 2020 projects by studying
227 Innovation Action and six public procurement projects (PPP) for which contracts
were signed in 2015 These actions have only started recently and are ongoing It is
therefore not possible to assess project outcomes ex-post Rather this study applies a
forward-looking methodology by applying cognitive innovation impact indicators to the
project proposals It seeks to trace a projectrsquos likely innovation impact back to the
attention various consortia devote to specific innovation aspects in their project
proposals Following the attention-based theory of organisational behaviour dedicated
attention of a consortium might have an impact on how it will act in the future
Consortia neglecting particular issues are unlikely to consider these issues throughout
the project Thus it can be hypothesised that on the basis of differences in the
attention towards specific topics heterogeneity between the consortia regarding their
input decisions will occur which in turn will lead to differences in project outcomes
and likely innovation impact
The main analytical technique of this study is a content analysis of proposal texts
Content analysis builds on the insight that language is central in human cognition
Accordingly cognitive schemas can be inferred from the systematic replicable
analysis of text Given that grant proposals are carefully and purposefully written they
reveal a consortiumrsquos attention and priorities for certain issues vis-agrave-vis others given
that overall space is limited The content analysis of this study rests on a multi-stage
validation process and identifies the attention that proposals devote to four crucial
innovation impact indicators (derived from an in-depth literature review)
technological novelty (advancement in the technological performance frontier) market
scope (potential to create a new product market) ecosystem embeddedness
(connections with important organisations and stakeholders) and innovation readiness
(technological and commercial maturity)
The content analysis of the proposal texts has some limitations The study is based on
counting the identified key words that are to measure the four innovation impact
indicators These keywords do not measure the material content of the proposals nor
the actual outcome of the projects Therefore the analysis is measuring the initial
intention rather than the final results of the innovation project Moreover the writing
of the proposal and the development of the innovation are activities which are linked
but separate which is why the findings based on proposals might not fully hold for the
actual projects These limitations have to be taken into account when using this study
Following the content analysis differences in attention allocation can be identified
among proposals and clusters of proposals emerge with distinct patterns The
following results and implications can be identified for the funding instruments under
study
As intended by the Innovation Action and PPP funding schemes attention to the
commercialisation of innovation dominates the studied project proposals Almost
all Innovation Action and PPP call texts use technological novelty at least as a
starting point and all proposals contain indications of technological novelty
However the average proposal pays roughly 33 more attention to innovation
readiness than to technological novelty Taking attention to readiness
ecosystem embeddedness and market scope together consortia dedicate on
7
average almost three times as much attention to the commercialisation of
technologies compared with describing technological novelty
A cluster of proposals containing ldquoPioneeringrdquo project consortia (64 out of 227)
can be identified which pay comparatively more attention to achieving ambitious
innovation impact vis-agrave-vis the goals of Horizon 2020 Consortia are significantly
more likely to allocate their attention accordingly with increasing participation of
private firms including SMEs It is noteworthy that projects in this cluster
combine attention to technological novelty and market creation (market scope)
Another cluster of 58 proposals containing ldquoDiffusingrdquo project consortia can be
identified with dedicated attention to diffusing innovation based on a broad
representation of the innovationrsquos ecosystem and its readiness Within the
ambition of Horizon 2020 for bridging discovery and market application these
consortia are clearly more specialised for the latter stages and can make an
important contribution to achieving market success
A substantial share of Innovation Action projects can be characterised as
ldquoSustainingrdquo (105 out of 227) Project proposals in this cluster contain only
modest focus on the four innovation impact indicators which may suggest that
these projects do not correspond very well to the stipulated objectives of
Innovation Actions Nevertheless the analysis only includes consortia that
received funding It is therefore not possible to compare ldquoSustainingrdquo projects
with those proposals that did not receive funding Within the context of this
study ldquoSustainingrdquo projects should therefore be considered as a baseline
reference group for ldquoPioneeringrdquo and ldquoDiffusingrdquo cluster proposals
With the caveat of the limited number of six PPP proposals analysed in this
study they share many attention allocation similarities with Innovation Actions
However the attention devoted to innovation readiness is comparatively lower
Market scope only plays a minor role similar to the Innovation Actions There is
a risk that PPP currently do not allocate enough attention to the broader market
application of innovation beyond public procurement
Overall the comparatively low scores for market scope across all projects under
study in comparison to the other cognitive innovation impact indicators suggest
that based on the content of the proposals the current schemes are not geared
explicitly towards supporting market creating innovation
This study proposes and applies cognitive innovation impact indicators Hence
conclusions can be derived on how these indicators relate to more traditional impact
indicators such as surveys or patent counts No single innovation impact indicator is
per se superior to others The cognitive innovation impact indicators proposed in this
study can alleviate some of the weaknesses of more traditional approaches eg the
confirmation bias in surveys long time delays and selective applicability of patent or
publication counts or case-specific qualitative studies The cognitive innovation impact
indicators allow an early assessment of the likely innovation impact of the proposals
even before they are actually funded They can be applied systematically to large
numbers of proposals and allow a quantification of attention as well as subsequent
interpretation Hence the following implications can be derived in the context of this
study
The high levels of attention to innovation readiness in ldquoPioneeringrdquo and
ldquoDiffusingrdquo clusters of project proposals provides an indication that these
projects might achieve impact in the short to medium term The comparatively
lower attention to innovation readiness in PPP proposals suggests the opposite
(albeit based on only 6 proposals under consideration)
8
The allocation of attention to the four innovation impact indicators expressed in
project proposals correlates positively and significantly with the attention
expressed in the respective call texts Hence a cognitive transfer of attention
priorities from call texts to funded consortia has successfully occurred
There is no evidence that innovation project proposals are research proposals in
disguise since technological novelty does not dominate proposal attention
Given that this study analyses exclusively granted project proposals it is equally
likely that such proposals have not been submitted or that evaluators have
performed their duties well and ranked them low In both cases the purpose of
the grant scheme would have been accomplished
9
1 INTRODUCTION
One of the cornerstones of the Europe 2020 strategy for smart sustainable and
inclusive growth (European Commission 2010) has been a commitment to investing
into research and innovation With a budget of around EUR 77 billion Horizon 2020 is
the European Unionrsquos Framework Programme for Research and Innovation in the
period 2014 to 2020 that helps to implement these policy priorities and objectives
Overall Horizon 2020 strives to facilitate excellent science and technology
development in Europe in order to create economic prosperity and to increase the
quality of life
Horizon 2020 puts special emphasis on a number of cross-cutting issues that are
promoted across the three priorities ldquoexcellent sciencerdquo ldquoindustrial leadershiprdquo and
ldquosocietal challengesrdquo They are intended to develop new knowledge competences and
technological breakthroughs with the aim to translate knowledge into economic and
societal value (European Commission 2016) One of these cross-cutting issues
focuses on bridging discovery with market application stages and in that sense on
facilitating innovation Innovation is commonly understood as the commercial
exploitation of new or improved products services or processes (Schilling 2016) The
focus of Horizon 2020 on innovation is particularly pronounced in the priorities
ldquoindustrial leadershiprdquo and ldquosocietal challengesrdquo They feature the new instruments
available in Horizon 2020 ndash Innovation Actionsprojects innovation procurement and
inducement prizes ndash that are expected to play a prominent role in bridging discovery
with market application stages and thus in helping to increase growth and
employment in Europe Innovation Actions describe activities aimed at producing new
or improved products processes or services while innovation procurement refers to
pre-commercial public procurement (PCP) or public procurement for innovative
solutions (PPI) (European Commission 2014a) Inducement prizes are ldquochallengerdquo
prizes that offer cash rewards to those who can most effectively meet a defined
challenge According to the Horizon 2020 Monitoring Report 2015 (European
Commission 2016) a substantial share of the total EU funding (199 corresponding
to EUR 14 billion) has been allocated to Innovation Action projects while only 65 of
the signed grants were Innovation Actions In comparison EUR 185 million were
allocated to six PCP and PPI projects and inducement prizes played a minor role This
distribution of funding illustrates the economic importance of Innovation Actions within
Horizon 2020
The Horizon 2020 Monitoring Report 2015 presents for the first time preliminary data
on outputs of projects responding to calls in 2014 and 2015 (European Commission
2016) The figures are collected through the continuous project reporting made by the
beneficiaries and refer to publications in peer-reviewed journals patent applications
and granted patents They show a total of 1760 publications 109 patent applications
and 29 granted patents across the three Horizon 2020 priorities ldquoexcellent sciencerdquo
ldquoindustrial leadershiprdquo and ldquosocietal challengesrdquo While these numbers show very early
indications of outputs directly related to or produced through EU intervention they are
hardly sufficient to draw conclusions about the innovation impact of Horizon 2020
Within this context impact refers to the wider societal economic or environmental
cumulative changes over a longer period of time (European Commission 2015b)
Innovation impact in that sense focuses on bridging discovery and market application
in order to achieve those changes (European Commission 2012) Current counts of
publication or patent outcomes for assessing the innovation impact of Horizon 2020
have two primary weaknesses First most projects have only just begun and the
eventual innovation impact can only be assessed once the projects have been finalised
and project outcomes have been commercially exploited Second publications and
patents describe the results of scientific inquiry as well as invention and are as such
more distant to actual exploitation eg through innovative products or services They
10
can in other words be characterised as intermediate innovation outcomes that create
potentials for ultimate innovation impact
This study provides an exploratory analysis of the current likelihood of innovation
impact of a small subset of Horizon 2020 The focus of this study is on Innovation
Actions and public procurement projects (PPP) for which contracts were signed in
2015 Because these actions have only started recently and are therefore still running
it is not possible to assess project outcomes ex-post Rather this study applies a
forward-looking methodology based on the proposals that were submitted to the calls
and subsequently contracted The goal of the study is to identify the likely innovation
impact of a project
The main analytical tool used in the study is a content analysis of the proposal texts
Social science research has frequently relied on content analysis It builds on the
insight that language is central in human cognition Accordingly cognitive schemas
can be inferred from the systematic replicable analysis of text (Duriau et al 2007)
Examples for the application of content analysis methods can be found in the
systematic use of media reports for the identification of public disapproval (Vergne
2012) or letters to shareholders for managerial cognition (Nadkarni and Barr 2008)
Proposal texts are a particularly fitting text source for applying content analysis
because Horizon 2020 uses standardised procedures and guidelines for the
development and evaluation of proposal texts which ensure that texts are uniformly
structured and comparable
The application of a content analysis requires that indicators are chosen that can be
reliably measured by this analytical technique Indicators are commonly defined as the
measurement of an objective to be met a resource mobilised an effect obtained or a
context variable (European Commission 2015b) This study develops and analyses
four indicators that can be assumed to mirror facets of a projectrsquos likely innovation
impact technological novelty market scope ecosystem embeddedness and
innovation readiness These indicators are measured for each of the 233 Innovation
Action and public procurement projects under study Moreover they are combined
with data on the composition and other characteristics of the project consortia in order
to derive a comprehensive assessment of the likely innovation impact
The content analysis of the proposal texts has some limitations The study is based on
counting the identified keywords that are to measure the four innovation impact
indicators These keywords do not measure the material content of the proposals nor
the actual outcome of the projects Therefore the analysis is measuring the initial
intention rather than the final results of the innovation project Moreover the writing
of the proposal and the development of the innovation are activities which are linked
but separate which is why the findings based on proposals might not fully hold for the
actual projects These limitations have to be taken into account when using this study
The ultimate goal of this study is to derive conclusions for the Innovation Actions and
public procurement projects as new instruments in Horizon 2020 at the instrument
and the programme level At the instrument level typical characteristics of proposals
that score highly on the selected indicators are identified and can be implemented as
recommendations for the configuration of consortia in future calls for proposals At the
programme level the assessment of the likely innovation impact of funded projects
provides one building block in the overall assessment of the effectiveness of these
instruments as suitable tools to achieve the stipulated objectives
The report is organized as follows Section 2 presents and discusses the innovation
impact indicators chosen for the analysis vis-agrave-vis the academic literature on this
topic Section 3 presents the methodology and data sources used in the analysis while
the results are presented in Section 4 Section 5 closes with a discussion and
implications followed by concluding remarks
11
2 COGNITIVE INDICATORS OF INNOVATION IMPACT
Many projects funded in Horizon 2020 are expected to have an innovation impact
However the projectsrsquo innovation impact is not readily measurable because projects
under consideration in this study have just been started and their full impact will only
be observable in the more distant future Moreover innovation impact originates from
the interaction of multiple innovation outcomes (eg technological performance
customer adoption market success) which can hardly be captured by traditional
indicators such as counts of patents or new products
Therefore this study takes an alternative approach and traces projectsrsquo innovation
impact back to the attention various consortia devote to specific innovation aspects in
their project proposals Following the attention-based theory of organisational
behaviour (Ocasio 1997) attention is defined here as the ldquonoticing encoding
interpreting and focusing of time and effortrdquo by a consortium on innovation issues and
action alternatives and mirrors the developing focus of a consortiumrsquos cognitive
endeavour (Eggers and Kaplan 2009) Dedicated attention of a consortium might
have an impact on how it will act in the future (cf Ocasio 1997 Barr 1998 Cho and
Hambrick 2006 Nadkarni and Barr 2008) Put differently consortia neglecting
particular issues ie not dedicating attention to them are unlikely to consider these
issues throughout the project The relationship between attention and actual action is
well established in the literature on managerial cognition in the context of
organisational renewal Specifically prior studies have provided empirical evidence for
the impact of managerial attention (measured through text analysis) on subsequent
observable organisational actions such as strategy changes (Cho and Hambrick
2006) new product launches (Eggers and Kaplan 2009) and patenting and alliance
activities (Kaplan et al 2003) Studying the attention helps to unveil the planned
input decisions a consortium wants to make regarding its innovation activities As
suggested by prior cognition research (eg Eggers and Kaplan 2009 Kaplan et al
2003) the greater an organisationrsquos attention towards a specific innovation aspect
(eg towards a new technology) the more likely it will have developed necessary
skills and expertise to succeed in this dimension (eg entering into a new product
market faster than competitors) Thus it can be hypothesised that on the basis of
differences in the attention towards specific topics heterogeneity between the
consortia regarding their input decisions is likely to occur which in turn will lead to
differences in project outcomes and innovation impact between the consortia In this
one has to bear in mind that proposal writing is an activity often decoupled from the
innovation development ndash which is why a certain ldquonoiserdquo might be observed stemming
from the involvement of professional partners in proposal writing
A basic premise of this study is that a consortiumrsquos attention is represented in a
consortiumrsquos project proposal (cf Kaplan 2011 Eggers and Kaplan 2009) in which
distinct attention foci can be set and expressed A proposal reflects a plan that
includes the purpose and objectives of the innovation and indicates measures the
consortium seeks to take to develop and commercialise the innovation Due to set
rules for the ultimate length of any proposal a consortium is forced to concentrate its
attention to the aspects it considers being most important and thus may emphasise
different innovation facets to a varying degree
To explore relevant facets of innovation impact that might be differentially emphasised
in proposal texts a thorough review of the extant academic literature was conducted
The objective of this review was to synthesise a set of indicators providing a
meaningful systematisation of relevant innovation facets that can be reliably measured
in the content analysis of proposal texts As a starting point existing literature review
articles on innovation (Brown and Eisenhardt 1995 Krishnan and Ulrich 2001
Montoya-Weiss and Calantone 1994) were screened for an initial set of important
innovation aspects This set was then refined by a review of further literature with
12
reference to the following criteria First only articles published in high-quality
academic management and innovation journals (including some practitioner-focused
journals such as Harvard Business Review) as well as innovation-related publications
of the European Commission such as the Innovation Radar methodology (De Prato et
al 2015) were considered Second potential indicators and related sub-items should
exhibit a strong contribution to innovation impact in terms of bridging discovery and
market application (ie ensuring the commercial exploitation of an innovation) andor
making a difference to economy and society (ie having the potential to increase
growth and employment) Thereby they should be consistent with previous definitions
of Horizon 2020 indicators (European Commission 2015b) Third the respective
indicators should capture conceptually discriminable contributions to innovation
impact assumed to also be cognitively distinguishable by a consortium Although
some overlap might be inevitable indicators should be sufficiently different from one
another in order to uncover different attention foci within proposals
Based on this review procedure four so-called cognitive indicators of innovation
impact were identified technological novelty market scope ecosystem
embeddedness and innovation readiness These indicators are used to measure the
attention the consortia devote to crucial innovation facets and thus can also be
referred to as attention foci In the following these indicators are described and
discussed in more detail
Technological Novelty
Technological novelty refers to the extent to which an innovation advances the
technological performance frontier more significantly than the existing technological
path (Gatignon et al 2002 Govindarajan and Kopalle 2006) and constitutes a major
transformation of existing products and services (OConnor and DeMartino 2006)
While technological novelty can reflect a technological breakthrough it can also be
traced back to a completely new combination of already existing technologies
processes and knowledge (European Commission 2015a OConnor 2008) According
to the basic differentiation of innovations (Dewar and Dutton 1986) the varying
degrees of technological novelty intended by the consortia can be described on a
continuum ranging from radical to incremental Thus a high degree of novelty
corresponds to a radical advancement of the technological performance frontier
rendering the existing product or service designs as well as the prevailing technologies
obsolete (Subramaniam and Youndt 2005 Chandy and Tellis 2000)
A low degree of novelty relates to incremental refinements or gradual progressions of
existing technologies that strengthen the potential of existing solutions and extant
product or service designs (Subramaniam and Youndt 2005 Ettlie 1983) In this
regard the technological novelty indicator focuses on the technology-based magnitude
of change rather than on the market-based consequences of an innovation
(Govindarajan and Kopalle 2006) Hence it only captures the degree of radicalness of
the technological dimension of the innovation but does not mirror whether it also
induces dramatic changes in the market For instance a completely new technology
(or novel combination of existing technologies) may create a new market and attract
new customers ndash also referred to as ldquoarchitectural innovationrdquo (Abernathy and Clark
1985) However it may also be applied to existing markets only without any changes
of market linkages while providing existing customers with a significantly better
technological solution ndash also labelled as ldquorevolutionary innovationrdquo (Abernathy and
Clark 1985)
Market Scope
Market scope relates to the extent to which an innovation has the potential to create a
new market (Hamel and Prahalad 1991) and introduces a different set of features
compared to existing products and services that is attractive to a new class of
13
customers (Govindarajan and Kopalle 2006 Christensen et al 2015 Darroch and
Miles 2011) It refers to the degree to which a consortiumrsquos innovation can unlock
untapped demand (Kim and Mauborgne 2005) or address a new customer segment
(Gilbert 2003) thereby creating the potential to develop and expand an entirely new
market or market segment It relates to the magnitude of change in customer value
propositions achieved through differences in features and performance characteristics
relative to established products and services (Govindarajan and Kopalle 2006
Charitou and Markides 2002)
Based on the reviewed literature innovations with a high degree of market scope are
typically reflected in two related but distinct forms of new-market creation as new-
market disruption (cf Christensen et al 2015) or as ldquoBlue Oceanrdquo strategy (cf Kim
and Mauborgne 2005) In the former case the innovation disrupts existing market
linkages or an entire industry by displacing established products or services
(Christensen and Bower 1996 Abernathy and Clark 1985) Typically at the time of
its introduction such an innovation serves only customers in niche markets who value
the innovationrsquos new characteristics However over time due to further
improvements the innovation attracts more and more customers in mainstream
markets and replaces existing offerings while crowding out incumbent providers
(Govindarajan and Kopalle 2006 Christensen et al 2015)
Alternatively the innovations can create uncontested market space labelled as ldquoBlue
Oceanrdquo without disrupting an existing market (Kim and Mauborgne 2005 Lindič et
al 2012) This kind of innovation embraces new additional demand by redefining a
customer problem and adding a new type of offering that did not exist before (Kim
and Mauborgne 1999) It complements rather than replaces existing offerings as it
typically addresses former non-customers and is not aimed at displacing incumbent
providers (Kim and Mauborgne 2015) A low degree of market scope on the other
hand indicates that the innovation tends to maintain and reinforce existing market
linkages while serving a new offering (but within established categories) to the same
customers who already bought the previous offering (Abernathy and Clark 1985)
For the purpose of this study it is important to separate technological novelty from
market scope since both can be achieved independently For instance Starbucks or
Southwest Airlines have shown that the creation of new additional demand does not
need to be based on cutting-edge technologies (Kim and Mauborgne 1999 2015)
Accordingly market scope explicitly captures the extent to which a consortium pays
attention to its innovation creating new demand but not whether this is achieved by a
radically new technology or based on existing technological solutions
Ecosystem Embeddedness
Ecosystem embeddedness refers to the extent to which the development and
commercialisation of an innovation is embedded in a community of organisations and
individuals who can affect or are affected by the innovation such as suppliers
customers and other stakeholders (Teece 2007 Clarkson 1995) It corresponds to
the degree to which the consortium understands itself as part of a system of
multilateral actors that need to co-operate in order for the innovation to materialise
(Adner 2006 2017)
Borrowing insights from neighbouring research on innovation networks (Gemuumlnden et
al 1996) and external knowledge sources (Koumlhler et al 2012 Grimpe and Sofka
2009) four major groups of ecosystem members were identified that a consortium
may take into consideration when pursuing its innovation activities (a) market-related
members such as end-users and customers competitors distributors consultants
intermediaries as well as organisations from other related industries (b) supplier-
related members such as main suppliers co-suppliers and complementors (c)
science-related members such as universities and research institutes and (d)
14
members of the wider innovation environment such as public legal political and
governmental institutions advocacy groups or civil society organisations
The notion of an innovation ecosystem goes beyond the concept of an innovation
network (cf Adner 2017) while an innovation network reflects a pattern of
connectivity in which network ties enable information flows (eg Powell et al 1996)
an ecosystem is additionally coupled with a specific purpose (eg the development of
a specific drug) and may be regarded as a configuration of activities determined by a
focal value proposition (Adner 2017) As such members of an innovation ecosystem
do not necessarily have to be affiliated with one and the same industry (Teece 2007)
but may come from different industries because cross-sectoral fertilisation can
stimulate open innovation (Leveacuten et al 2014 Laursen and Salter 2006)
A high degree of ecosystem embeddedness indicates that the consortium clearly
identifies and understands its own innovation ecosystem (Adner 2006 Adner and
Kapoor 2010) and closely collaborates with other members of the system (Davis
2016) A strong embeddedness allows for positive spill-over effects between the
consortium and the other ecosystem members during the development and
commercialisation of the innovation (De Prato et al 2015) Moreover it ensures
sufficient supplies of critical components and access to complementary assets such as
manufacturing capabilities and distribution channels (Teece 1986 2006) as well as
increases an innovationrsquos social acceptance or support from relevant stakeholders
making it unlikely for the consortium to be confronted by resistance or protests (Olsen
et al 2016) In contrast a low degree of ecosystem embeddedness corresponds to a
low awareness of the ecosystem with little attention to and collaboration with other
members in this case a consortium will risk to oversee opportunities that occur
outside of its internal focus (Chesbrough 2003) and will more likely face diffusion
barriers for its innovation (Talke and Hultink 2010)
Innovation Readiness
Innovation readiness corresponds to the extent to which an innovation achieves a
satisfactory level of technological maturity (European Commission 2014b) and is
likely to be successfully commercialised (De Prato et al 2015) On the basis of the
reviewed literature three main types of activities can be identified that underlie
innovation readiness and that a consortium may pursue to prepare and ensure
commercialisation The first type of activities is associated with the late stages of the
development process (Krishnan and Ulrich 2001 Montoya-Weiss and Calantone
1994) and includes technical tasks such as proving the technical feasibility of the
innovation (Hart et al 2003) designing testing and validating prototypes (Thomke
1998) validating the production process for the best prototype (Krishnan and Ulrich
2001) configuring the physical supply chain (Fisher 1997) as well as slowly scaling
up production as necessary for product and market testing (Terwiesch and Bohn
2001)
The second type of activities covers different strategic and operational marketing tasks
a consortium has to take into account to ensure market launch and diffusion (cf
Hultink et al 1997) Strategic marketing activities include market positioning and
product introduction timing (Chiesa and Frattini 2011) as well as the specification of a
business plan and model to capture financial value from the innovation (Zott et al
2011 Amit and Zott 2001) Operational marketing tasks cover activities related to
the classical marketing mix (Vorhies and Morgan 2003 2005 Vorhies et al 2009)
including product management (eg product-market research product
demonstration branding) pricing (eg price-setting) promotion (eg
advertisement communication) and distribution (eg distribution channels
logistics) The third type of activities related to innovation readiness encompasses
measures helping a consortium to protect the competitiveness of its innovation
(Pisano and Teece 2007 De Coster and Butler 2005) including intellectual property
15
rights (eg patents copyrights trademarks trade secrets) product certification or
ldquonaturalrdquo barriers to imitation (eg unique product features difficulty in reverse
engineering)
A high level of innovation readiness indicates a high degree of technical maturity of
the evolving innovation and its closeness to market (De Prato et al 2015) A low level
of innovation readiness reflects that the innovation is in an earlier stage of the
development process and rather far from being commercialised (European
Commission 2014b) While ecosystem embeddedness emphasises how well the
development and commercialisation of the innovation is embedded in a supporting
infrastructure of different stakeholders and thus focuses more on structural aspects
(Adner 2017) innovation readiness embraces the activities and tasks that the
consortium has to undertake to realise the innovation in the market place (cf
Krishnan and Ulrich 2001)
Table 1 gives an overview of the cognitive indicators of innovation impact including
their definition principles and selected literature references
16
Table 1 Overview of cognitive innovation indicators
Cognitive Innovation
Indicator
Definition Principles Selected References
(1) Technological
Novelty
The extent to which an
innovation significantly
advances the technological
performance frontier and
constitutes a major
transformation of existing
products and services
Focusing on an innovationrsquos technology-based
magnitude of change rather than on market
consequences
Ranging on a continuum from radical to incremental
innovation
Technological breakthrough and completely new
combination of existing technologies as typical
manifestations of high technological novelty that
have the potential to make prevailing solutions
obsolete
Gatignon et al (2002)
Govindarajan and
Kopalle (2006)
OrsquoConnor and DeMartino
(2006) Subramaniam
and Youndt (2005)
European Commission
(2015a)
(2) Market Scope The extent to which an
innovation has the potential to
create a new market and
introduces a different set of
features compared to existing
products and services that is
attractive to a new customer
segment
Focusing on an innovationrsquos market-based magnitude
of change regardless of its technological novelty
Relating to the extent of shifts in customer value
propositions
New-market disruption as a typical manifestation of
high market scope that changes established market linkages and displaces existing offerings
Blue ocean strategy as an alternative manifestation
of high market scope that creates uncontested market space and complements existing offerings
Hamel and Prahalad
(1991) Govindarajan
and Kopalle (2006)
Christensen et al
(2015) Kim and
Mauborgne (2005
2015) Charitou and
Markides (2002)
17
Cognitive Innovation
Indicator
Definition Principles Selected References
(3) Ecosystem
Embeddedness
The extent to which the
development and
commercialisation of an
innovation is embedded in a
community of organisations
and individuals who can affect
or are affected by the
innovation (eg suppliers
customers and other
stakeholders)
bull Viewing an innovation ecosystem as a system of
multilateral actors whose interactions enable an innovation to materialise
Going beyond the mere conception of innovation
networks since an ecosystem is also determined by a
focal value proposition
Strong ecosystem embeddedness allows for spill-over
effects between partners ensuring access to
complementary assets and increasing an
innovationrsquos social acceptance and support among
relevant stakeholders
Teece (1986 2007)
Clarkson (1995) Adner
(2006 2017) Leveacuten et
al (2014) Olsen et al
(2016) Talke and
Hultink (2010)
(4) Innovation
Readiness
The extent to which an
innovation achieves a
satisfactory level of
technological maturity and is
likely to be successfully
commercialised
Focusing on the content of activities for rolling out an
innovation rather than on the structural configuration
of such activities (as captured by the ecosystem
indicator)
Technical development tasks strategic and
operational marketing efforts as well as measures
protecting an innovationrsquos competiveness as main
types of activities underlying an innovationrsquos
readiness
High levels of technological maturity and
commercialisation preparation efforts indicate a high
degree of innovation readiness
European Commission
(2014b) De Prato et al
(2015) Krishnan and
Ulrich (2001) Hultink et
al (2007) Vorhies and
Morgan (2005) Pisano
and Teece (2007)
18
3 METHODOLOGY
The empirical methodology adopted in this study involves a number of different
analyses which are based on data for all 227 Innovation Actions and six public
procurement project proposals whose contracts were signed in 2015 Data on those
projects were taken from the CORDIS database which includes information on the
participants ndash their names type and home country ndash as well as on the projects ndash the
requested EC contribution the total project cost and the evaluation score of the
consortium These data serve to provide a basic description of the projects under
study but they are also combined with data generated from the proposal texts of
these projects The proposals are confidential and were made available for the
purpose of this study by the European Commission
Content Analysis
The main analytical technique of this study is a content analysis of the proposal texts
Content analysis builds on the assumption that cognitive schemas can be inferred from
the systematic replicable analysis of text (Duriau et al 2007) Consequently this
study adopts the idea that the cognitive innovation indicators as defined above can be
measured through the language adopted by the participants in a consortiumrsquos
proposal In other words dedicating attention to different aspects related to the
planned and foreseen innovation impact of the project is assumed to be reflected in
the proposal text of the consortium which will guide the research and innovation
activities performed within the project In this regard proposal texts are a particularly
fitting source for applying content analysis because Horizon 2020 uses standardised
procedures and guidelines for the development and evaluation of proposal texts which
ensure that texts are uniformly structured and comparable
An important step of any content analysis is the creation of a dictionary of words or
short phrases which can capture each construct of interest (Duriau et al 2007) The
methodology follows recent research on content analysis by applying a three-step
protocol which iteratively improves reliability and validity of the dictionaries (Olsen et
al 2016 Vergne 2012)
Based on an analysis of the relevant literature and existing tools typical
formulations of innovation-related project impacts are identified This analysis
results in an operational understanding in the way the innovation impact would
be expressed in a proposal text and creates an initial list of words and short
phrases for each one of the four dictionaries In this regard the Innovation
Radar methodology (De Prato et al 2015) plays a particularly important role in
complementing the list
In a second step experienced grant writers and evaluators in H2020 were asked
to assess the likelihood of the words on the initial word list for appearing in
proposal texts Twelve experts are involved in this step of the analysis including
two senior managers from private firms two senior researchers from research
institutes three university academics and five experts from the European
Commission The experts were also asked for additional words or short phrases
which they believe were missing The resulting dictionaries consist of a list of
words for which at least six experts agree that they have an above average
chance of appearing in a proposal text for each indicator To measure
technological novelty market scope ecosystem embeddedness and innovation
readiness we retain a list of 49 32 52 and 69 words respectively Sensitivity
checks with more stringent (eg agreement from a minimum of nine experts) or
more lenient dictionary inclusion restrictions lead to consistent classifications of
proposal texts with correlations ranging between 071 and 099 Hence the
dictionaries cover at least a core set of words and phrases that allows consistent
19
classifications of proposal texts Example words and phrases include
- Technological novelty advanced breakthrough first of its kind
- Market scope differentiate disrupt mainstream
- Ecosystem embeddedness cross-sectoral society supply chain
- Innovation readiness business plan prototype scaling up
The entire dictionaries can be found in the appendix Overall the overlap of the
dictionaries ie the number of words that appear in more than one dictionary is
low The items of the technological novelty dictionary could potentially overlap
with the 153 items of the other dictionaries but do so only in 33 of the cases
(eg ldquodisruptrdquo) market scope in 59 (eg ldquouserrdquo) ecosystem embeddedness
in 53 (eg ldquosupply chainrdquo) and innovation readiness in 98 (eg ldquopatentrdquo) of
the cases Hence the vast majority of words and phrases of each dictionary is
distinct and allows a meaningful differentiation between indicators Using the
software tool LIWC the resulting dictionaries are applied to all relevant sections
of proposal texts (with the headings ldquoExcellencerdquo ldquoImpactrdquo as well as
ldquoImplementationrdquo) ie excluding sections which contain standardised
administrative information The software calculates the percentage of words
from the dictionary in any relevant section of each proposal
As a last validation step 40 proposal texts were read and assessed with regard
to their likely innovation-related project impact This allows to calculate the
intercoder reliability (Krippendorff 2004) between the software generated and
manually generated assessment If the intercoder reliability is high the
dictionaries can be assumed to yield a valid and reliable measurement of the
innovation-related indicators of interest Krippendorffrsquos alpha is 075 for
technological novelty 064 for market scope 085 for ecosystem embeddedness
and 070 for innovation readiness Overall these coefficients indicate a
satisfactory level of intercoder reliability which confirms the validity of the
indicator scores generated through content analysis1
Reading the proposal texts also allows the identification of particularly insightful
passages of text that contain content and context for the planned innovation
impact These passages of text will be highlighted together with the results from
the content analysis and in that sense enable a qualitative validation of the
results
Throughout the analytical process quality management is applied through iterative
steps and recursive improvement The application of a content analysis requires that
indicators are chosen that can be reliably measured by this analytical technique The
choice of four cognitive indicators therefore also reflects the ambition to achieve
discriminant validity in the relevant dictionaries Some dictionaries may be too broad
to capture a single construct eg product markets versus markets for technology
Other dictionaries may have too much overlap with the dictionaries of other
constructs ie requiring a more precise differentiation between constructs Moreover
certain indicators such as the Technology Readiness Level (TRL) which is typically
measured on an ordinary scale from 1 to 9 (European Commission 2014b) are less
amenable to be measured through content analytical techniques because the score
1 Krippendorffrsquos alpha is a conservative measure of the observed and expected disagreement between raters (in this case between the software-generated rating and the one generated through manual reading of the proposals) and ranges between 0 and 1 When raters agree
perfectly alpha takes a value of 1 which indicates perfect reliability When they agree as if chance had produced the results alpha is 0 which indicates the absence of reliability In the social sciences values of alpha greater than 0667 are commonly accepted (Krippendorff 2004) The results show that the alpha for market scope is slightly below that threshold Yet lower values have been suggested acceptable in exploratory (rather than confirmatory) studies such as this one (Neuendorf 2002)
20
generated through content analysis cannot be readily converted into a particular TRL
Content analysis is also not an efficient way to measure the composition of the
consortium
In an exploratory part of the study the dictionaries derived from the content analysis
of grant proposals are applied to the call texts to which each of the proposals
responds Correlations between call and proposal texts are calculated and discussed
with regards to how much the foci expressed in the call texts can be re-traced in the
respective proposal texts
The four variables generated through content analysis therefore measure the
emphasis that grant writers have put on each of the four cognitive innovation
indicators A higher value in one variable indicates that a higher percentage of words
used in the proposal were found in one of the dictionaries ie applicants spent more
words describing one of the four facets of innovation impact
Cluster Analysis
The four variables generated through content analysis are subsequently combined
with the CORDIS data on the project level and used in a cluster analysis Specifically
the cognitive innovation indicators are used as cluster variables while the remainder of
variables are used to describe the resulting cluster solution in order to identify
patterns and derive implications The overall aim of a cluster analysis is to reduce
heterogeneity by defining groups of proposals that are similar within the group and as
dissimilar as possible between the groups (Milligan and Cooper 1987) The clusters
are then interpreted based on the average values of the cluster variables within each
cluster This grouping is similar to the method used in the Innovation Scoreboard
where indicators are combined and countries are ranked as ldquoinnovation leadersrdquo
ldquofollowersrdquo etc To account for the differences between Innovation Actions and public
procurement projects the cluster analysis is only performed on the 227 Innovation
Actions in the data while the six public procurement projects will be discussed
separately ie they represent their own cluster and will be discussed alongside the
others
Since this study pursues an exploratory approach the cluster analysis uses a
hierarchical clustering method Instead of partitioning the data in a single step
according to a particular number of clusters that is set ex-ante this type of method
runs a series of partition steps ranging from a single cluster including all cases to as
many clusters as cases exist (Everitt et al 2011) Specifically the study applies
Wardrsquos (1963) agglomerative hierarchical clustering procedure to the data which
merges two clusters on the basis of the sum of squared errors That is at each fusion
step the total within-cluster sum of squared errors is minimised (Everitt et al 2011)
Wardrsquos method is considered as one of the most reliable and robust clustering
methods and thus generally recommended in the literature The results of simulation
studies which compare different clustering algorithms have shown that Wardrsquos
algorithm in most cases yields very good partitions and tends to correctly assign
cases to clusters (Scheibler and Schneider 1985 Backhaus et al 2008)
To establish the appropriateness of Wardrsquos method for the present analysis the
preconditions for applying this method were checked (cf Backhaus et al 2008
Ketchen and Shook 1996) First variables are continuous and not too highly
correlated Second no outliers were found based on the single-linkage method which
tends to result in broad and unbalanced clusters Third the data is expected to
produce clusters of similar sizes with similar spread Fourth a distance measure
reflecting the dissimilarity between cases is used as a proximity metric rather than a
similarity measure reflecting the similarity between two cases In particular this study
applies the so-called Euclidean Distance measure which does not influence the
weighting of variances and thus is more suitable for the studyrsquos data structure than
21
the squared Euclidean Distance which weights small differences lower and large
differences higher (Backhaus et al 2008)
A crucial step in cluster analysis is the choice for the appropriate number of clusters
ie to find a meaningful number of clusters between the two extremes of only one
cluster containing all projects and one cluster for each of the projects Prior literature
has developed several approaches in order to identify an appropriate cluster solution
(cf Ketchen and Shook 1996) As a first approach a so-called dendogram a
mathematical and graphical representation of the clustering process also known as
tree diagram is drawn In a dendogram clusters are indicated by nodes and the
distance at which clusters are merged are represented by the length of the respective
stem thereby giving a first indication of possible cluster solutions (Everitt et al
2011) As a second approach the values at which cases are combined to build a
cluster the so-called agglomeration coefficients (also representing the sum of squared
errors) are plotted on a y-axis against the number of possible clusters on an x-axis
The point at which the resulting curve shows a clear flattening also referred to as the
ldquoelbow criterionrdquo corresponds to the appropriate number of clusters because from this
point the clusters being merged are very dissimilar (Ketchen and Shook 1996) To
substantiate these graphical approaches Mojenarsquos (1977) criterion is used according
to which a good cluster solution is indicated by the highest number of clusters for
which the standardised agglomeration coefficient exceeds a certain cut-off value for
the first time (Backhaus et al 2008) The literature suggests cut-off values between
275 and 350 to determine an appropriate number of clusters (Everitt et al 2011)
The clusters are subsequently characterised along relevant applicant and project
information eg the size of the consortium the project cost and its composition
(higher and secondary education private for profit public body research
organisations and other types of organisations)
4 RESULTS
Descriptive Results
Table 2 shows the descriptive statistics of the cognitive innovation impact indicators
for the Innovation Action projects under study The mean values indicate the
percentage of words in the respective proposal texts that appear in the respective
dictionaries Moreover the remaining columns show the standard deviation as well as
the minimum and maximum values of the variables in the data We find the highest
average value for the innovation readiness indicator (colour-coded in green) followed
by technological novelty ecosystem embeddedness (colour-coded in yellow) and
market scope (colour-coded in red) The values of the standard deviation are relatively
low indicating rather low variation of the variable value within the data However
particularly the maximum values show that there are some proposals in the data that
place very strong emphasis on the respective facet of innovation impact
Table 2 Cognitive innovation impact indicators for Innovation Actions (n=227)
Variable Mean Std Dev Min Max
Technological novelty 182 069 058 457
Market scope 126 051 039 431
Ecosystem embeddedness 136 052 054 387
Innovation readiness 243 061 119 494
The interpretation of the mean values of the four innovation indicators can only be
made relative to one another not in absolute terms This is because the frequency of
using certain words depends considerably on the specific type of text that is analysed
22
However evidence from prior research employing content analysis shows very similar
average values for constructs derived through this method (eg Olsen et al 2016)
In relative terms the results show that proposals place considerably higher emphasis
on outlining the readiness of the innovation to be developed compared to its market
scope This seems in accordance with the stipulated objectives of Innovation Actions
to facilitate innovation in contrast to funding research activities Nevertheless
proposals also stress technological novelty while remaining relatively quiet on
ecosystem embeddedness and market scope2
Table 3 further describe the projects under study The requested EC contribution and
total project costs are EUR 630 million and EUR 978 million respectively but there is
considerable variation among the projects as evidenced by the rather low minimum
and high maximum values Projects have on average 13 participants but the largest
project includes 50 participants Projects turn out to be dominated by private
companies There are on average seven companies involved in a project accompanied
by slightly more than two higher education institutions and two research
organisations Public entities and other types of participants only play a minor role Of
the private companies about half of them are SMEs Given the consortium
composition projects can be assumed to have a rather strong focus on applied
research and exploitation ndash a focus that would presumably be different had the
projects involved a higher share of higher education and research institutions
Consequently the average ldquobreadthrdquo of participants ie the number of different
participant types in a consortium equals three while the country breadth indicates that
participants from almost six different countries collaborate in a consortium The mean
evaluation score is 13
Table 3 Descriptive statistics for Innovation Actions (n=227)
Variable Mean Std Dev Min Max
Requested EC contribution (mEUR) 630 619 033 3933
Total project cost (mEUR) 978 1681 035 18108
Number of participants 1304 927 1 50
Number of higher education institutions 232 241 0 17
Number of private companies 730 638 0 43
Number of public bodies 058 149 0 12
Number of research organisations 216 175 0 9
Number of other participants 063 133 0 10
Number of SMEs 349 285 0 19
Participant breadth 314 106 1 5
Country breadth 588 263 1 16
Evaluation score 1302 102 10 15
evaluation score is missing for eleven projects
2 Since the length of the dictionaries originates from a validation exercise involving 12 experts there is no ex-ante optimal length All items of a given dictionary are supposed to reflect the same construct eg innovation readiness In principle the items are synonyms for one another (Duriau et al 2007) Dictionary length indicates that the experts could
think of many suitable synonyms not that proposals have to use many different words for expressing attention to a given construct The diversity of dictionary items in a given text is likely to indicate linguistic style but not necessarily more attention to a given construct All other things equal a proposal using marketing six times should not be treated differently than a proposal using marketing three times and advertising three times (both words are part of the innovation readiness dictionary)
23
Table 4 shows the scores of the cognitive innovation impact indicators of the six public
procurement projects Although the overall number of projects is low interesting
differences with the 227 Innovation Actions emerge The most pronounced cognitive
innovation impact indicator turns out to be ecosystem embeddedness closely followed
by innovation readiness and technological novelty Market scope only plays a minor
role similar to the Innovation Actions In general the mean and maximum values of
the four indicators appear to be much lower compared to the Innovation Actions
Table 4 Descriptive statistics public procurement projects (n=6)
Variable Mean Std Dev Min Max
Technological novelty 175 040 101 218
Market scope 108 015 089 128
Ecosystem embeddedness 192 033 148 233
Innovation readiness 184 043 119 250
Table 5 shows further descriptive statistics for the public procurement projects They
are considerably smaller on average than Innovation Actions The requested EC
contribution and total project cost are EUR 296 million and EUR 470 million
respectively Projects have on average nine participants and most of them are public
bodies followed by research organisations private companies and higher education
institutions This indicates a considerably different composition of the consortia
Moreover SME involvement is relatively rare Regarding the breadth measures we
find that almost four different types of participants and five different countries are
involved in the consortium The mean evaluation score is 1175
Table 5 Descriptive statistics for public procurement projects (n=6)
Variable Mean Std Dev Min Max
Requested EC contribution (mEUR) 296 145 078 472
Total project cost (mEUR) 470 146 270 677
Number of participants 883 382 6 15
Number of higher education institutions 117 147 0 4
Number of private companies 150 084 0 2
Number of public bodies 267 207 0 6
Number of research organisations 233 301 0 8
Number of other participants 100 063 0 2
Number of SMEs 067 052 0 1
Participant breadth 383 075 3 5
Country breadth 533 197 3 8
Evaluation score 1175 160 10 14
In sum the tables showing descriptive statistics for Innovation Actions and public
procurement projects indicate considerable differences between the two types of
projects These differences also warrant an exclusion of the only six public
procurement projects from the cluster analysis The public procurement projects will
however be discussed together with the results of the cluster analysis for the
Innovation Actions
Qualitative Results
The manual reading of 40 randomly selected proposal texts not only serves ndash as
indicated ndash to quantitatively validate the results of the content analysis by means of
interrater reliability statistics but also to provide a qualitative validation that rests on
24
the identification of particularly telling paragraphs of text In the following text boxes
will be presented by indicator containing selected quotes from the proposals with
above median scores of the respective indicators All quotes are anonymised
The quotes expressing technological novelty tend to stress the ground-breaking nature
of the technology to be developed its newness and potentially ldquoparadigm-shiftingrdquo
effect Moreover proposals often also highlight the novel combination and
recombination of already existing technologies which academic literature has
frequently characterised as the main source of innovation (eg Koumlhler et al 2012)
In several places descriptions of technological novelty are linked to the readiness of
the innovation for exploitation
Technological novelty
ldquo[Project acronym] brings knowledge and demonstration of two disruptive
technologies additive manufacturing and internet technologies to the industrial
partners including SMEs in the traditional toy and nursery furniture sectors
strengthening their competiveness and growthrdquo
ldquo[Project acronym] will provide innovative solutions to overcome existing bottlenecks
associated with Pulsed Electric Field preservation in the food industry for improving
food quality optimizing process efficiency reducing energetic cost and introducing
foods with new properties in the market with the final goal of providing a real‐scale
demonstration of the viability of the PEF technologyrdquo
ldquoThe technology has the potential to completely change the landscape of iron and
steelmaking in Europe over a 15 year periodrdquo
High attention to market scope is reflected in the following quotes They not only
describe possibilities to enter new markets develop niche markets or create entirely
new markets but they also often times suggest a change in the value proposition to
potential customers In some quotes attention to market scope is also very closely
linked to descriptions of technological novelty or innovation readiness for immediate
commercial exploitation
Market scope
ldquoCreation of new market opportunities both inside and outside Europe Market
potential outside Europe is identified in semi-arid environments (eg Morocco) or
monsoon environments (eg India) where there is a major need to optimize water
resource userdquo
ldquoTogether with [participant name] and [participant name] we want to disrupt the very
market where we compete and change the rules that run it reducing operation costs
by 80rdquo
ldquoThe [project acronym] technology will boost Europes industrial leadership in
advanced manufacturing and processing In addition it will foster employment and
open new market opportunities in this field This would relate both to the European
steel industry itself as well as the many European engineering companies supplying
the plant and equipmentrdquo
Attention to ecosystem embeddedness is explicitly expressed in the following quotes
Here proposals describe the communication diffusion and dissemination of their
project outcomes the integration into innovation networks as well as their
considerations for stakeholder acceptance and support These activities can be
25
expected to accelerate the uptake of innovations and to increase their societal impact
(eg Olsen et al 2016)
Ecosystem embeddedness
ldquoThe proposed project disseminates its results between medical technological and
managerial domains accordingly to a coherent plan of activities centered around an
active involvement of the various stakeholders on a multinational level Every
stakeholder will take part to one or more dissemination activities of the project [hellip]
The definition of communication needs for every stakeholder is an essential step
towards the institution of an effective network of collaborators partners and
stakeholders themselvesrdquo
ldquoWe see [project acronym] as an innovation system in the sense of Freeman as lsquoa
network of institutions in the public and private sectors whose activities and
interactions initiate import modify and diffuse new technologiesrsquo [Project acronym]
will be such an innovation system because it will gather the above mentioned
stakeholders in order to develop new applications methods and servicesrdquo
ldquoIn order to increase the intended impact beyond the implementation of the European
Railway Traffic Management System (ERTMS) European Train Control System (ETCS)
standard the [project acronym] consortium will disseminate information about the
projectrsquos objectives activities and results to a wide variety of stakeholders throughout
the Rail and Global Navigation Satellite System (GNSS) sector Beyond those partners
within the consortium and those involved in the research activities this includes
Railway Undertakings Infrastructure Managers GNSS equipment producers and
integrators GNSS services providers Research Centres and sub-system suppliersrdquo
Finally attention to the readiness of the innovation is typically expressed by focusing
on prototyping demonstration and validation The quotes indicate in some places a
close connection between innovation readiness and ecosystem embeddedness which
indicates that the consortium not only considers leaps in readiness but also the
exploitation of such leaps with different groups of customers or stakeholders
Innovation readiness
ldquoThree teams consisting of partner representatives will focus on (i) process prototyping
and demonstration (ii) product prototyping and validation towards safety and market
requirements and (iii) overall demonstration A unique ambition is to involve
particularly SME parties via a Sounding board Group consisting of potential users
(food suppliers food processors and dry product users) as well as food auctioneers
growers associations and retailrdquo
ldquoA Project Exploitation Plan will be developed describing joint and individual partnerrsquos
exploitation strategies The Exploitation Plan will cover potential products competitors
and the technology benchmarks It will describe the [project acronym] market position
and identify the potential market segments as well as specific academic and
commercial strategies to be implementedrdquo
ldquoThe main idea of the project is the finalisation of development industrialization and
commercialisation of the innovative in-wheel motor technology (patent pending)
developed by [participant name] The solution was already validated in real operating
conditions showing a competitive performance with a very positive market-feedbackrdquo
In sum the quotes from the proposal texts show that consortia deliberately use
certain words and short phrases in order to express attention to the four identified
dimensions of innovation impact This not only validates the automated content
26
analysis of the proposals but also holds insights on how these attention foci are
typically described in longer paragraphs of text This allows for a more systematic
identification and evaluation of the likely innovation impact in proposals
Comparison of Call and Proposal Texts
In a next step content analyses using the four cognitive innovation impact dictionaries
are applied to the 38 call texts to which the 233 proposals responded While content
analyses have been applied to call texts before (Olsen et al 2016) it is important to
note the difference in interpretation compared with proposal texts Call texts describe
an abstract research need or ambition not a concrete proposal for addressing it
Hence any content analysis reveals differences in attention paid to various facets of
innovation when expressing a research need or ambition
Table 6 provides an overview of the results from the content analysis using call texts
The 38 call texts contain on average 395 of words relating to technological novelty
271 for market scope 198 to ecosystem embeddedness and 340 to
innovation readiness The averages are consistently higher than for the proposal texts
and the extremes are more pronounced as evidenced by a larger range between
minimum and maximum values
Table 6 Descriptive statistics call texts (n=38)
Variable Mean Std Dev Min Max
Technological novelty 395 198 0 812
Market scope 271 180 0 769
Ecosystem embeddedness 198 133 0 646
Innovation readiness 340 157 074 705
When comparing the indicator averages for call texts with proposal texts call texts
devote comparatively more attention to technological novelty than to innovation
readiness The differential focus of call and proposal texts is further described in
Figure 1 In this figure the indicator scores are normalised to 100 for innovation
readiness Interestingly call texts pay about 16 more attention to technological
novelty than to innovation readiness Both for technological novelty and market scope
the differences between calls and proposals are particularly pronounced The focus on
ecosystem embeddedness is about the same in both calls and proposals These results
indicate that while calls stress technological novelty more than innovation readiness
proposals place much stronger focus on innovation readiness than on technological
novelty Given that Innovation Actions seek to increase the chances that technologies
are commercially exploited through innovation the comparatively higher focus on
novelty than on readiness in call texts seems counterintuitive Then again the
proposals of funded projects do focus on readiness to a much higher extent than on all
other dimensions of innovation impact
27
Figure 1 Comparison of call and proposal text attention foci
However such comparisons of averages may be driven by extreme values and
correlation analysis can provide additional insights In fact correlation analyses reveal
that cognitive innovation impact indicators between calls and proposals are
consistently positively correlated and highly significant (99 levels) The correlation
between attention expressed for technological novelty in call texts and in proposal
texts is 049 for market scope 041 for ecosystem embeddedness 048 and for
innovation readiness 024 While no reference figures for optimal levels of correlation
exist these correlation coefficients indicate quite some congruence between the
attention foci expressed in call and proposal texts It suggests that precisely worded
call texts are important tools for conveying emphasis and preferences of a research
need or ambition providing guidance for consortia and their proposals The call texts
under study achieve this to a lesser degree for innovation readiness
Finally all proposal texts under consideration are positively evaluated and eventually
contracted The positive correlations are also likely to indicate that evaluation
processes perform well in selecting proposals that have a close attention overlap with
the call Larger divergences between call and proposal attention foci are likely to be
found in proposals with lower evaluation scores
Cluster Analysis
The major challenge for cluster analytical techniques is the decision for an appropriate
number of clusters that provides a meaningful segmentation of the projects in the
data but at the same time does not conceal the heterogeneity among the projects
Using the four innovation indicators as cluster variables leads in a first step to two
graphical representations that facilitate the identification of clusters Figure 2 shows
the dendrogram of the clustering process after Wardrsquos method using the Euclidean
distance as distance measure The figure depicts the stepwise agglomeration of
projects to clusters To allow a meaningful interpretation of the clusters the resulting
solution should neither contain too few nor too many clusters (Everitt et al 2011)
Figure 2 turns out to be clearly suggestive of a three-cluster solution that combines
105 Innovation Action projects in the first cluster 64 projects in the second cluster
and 58 projects in the third cluster
0
20
40
60
80
100
120
140
Technological
novelty
Market scope Ecosystem
embeddedness
Innovation
readiness
Call
Proposal
28
Figure 2 Dendrogram of the cluster solution
The appropriateness of a three-cluster solution can be tested by applying the ldquoelbow
criterionrdquo For that purpose Figure 3 shows the sum of squared errors depending on
the number of clusters chosen The ldquoelbowrdquo indicates the point at which a rather large
reduction in the sum of squared errors per additional cluster compares favourably to a
relatively smaller reduction Literature suggests that this point indicates the number of
clusters to be chosen (Ketchen and Shook 1996 Backhaus et al 2008) Figure 3
shows that this is the case with a three-cluster solution
Figure 3 Sum of squared errors depending on the number of clusters
Finally the choice for the number of clusters should be substantiated by applying the
Mojena criterion which in our case also provides support for a three-cluster solution
(Mojena 1977 Everitt et al 2011)
In the next step the three clusters need to be further characterised in order to allow
for a meaningful interpretation Table 7 shows the mean values of the cluster variables
by cluster comparing them to the public procurement projects (PPP) A first glance on
the mean values shows important differences between the three clusters Cluster 1
which also is the cluster containing by far most of the projects scores comparatively
low for all four innovation impact indicators Clusters 2 and 3 each show a distinct
profile with Cluster 2 scoring highly on technological novelty market scope and
0
20
40
60
80
100
120
140
160
180
1 2 3 4 5 6 7 8 9 10 11 12 13 14 15 16 17 18 19 20 21 22 23 24 25 26 27 28 29 30 hellip
29
innovation readiness and Cluster 3 exhibiting high scores for ecosystem
embeddedness and innovation readiness In comparison to the cluster solution of the
Innovation Action projects the public procurement projects score relatively low but
they nevertheless show rather high ecosystem embeddedness It has to be noted
though that these average values are based only on six observations
Table 7 Mean of cluster variables by group
Clusters Obs Technological
novelty
Market scope Ecosystem
embeddedness
Innovation
readiness
Cluster 1 105 146 093 114 208
Cluster 2 64 266 160 119 269
Cluster 3 58 156 147 195 277
PPP 6 175 108 192 184
Total 233 182 125 138 241
To facilitate the interpretation of the cluster solution Figure 4 shows the T-values of
the cluster variables in the cluster solution ie standardised deviations of the
variables within the clusters relative to the overall sample mean The figure confirms
the first assessment of the descriptive statistics of the cluster variables Cluster 1 the
largest cluster with 105 projects shows low values for all four innovation indicators
relative to the sample means of the variables In other words projects in this cluster
exhibit relatively low focus on the four facets of innovation impact in their proposal
texts We label this cluster therefore as ldquoSustainingrdquo ie projects that in their
proposal dedicated modest attention to the four facets of innovation impact to be
achieved through the funding ldquoSustainingrdquo in that sense characterises projects with
an innovation impact likely to be limited and restrained
Cluster 2 shows a noticeably different profile Technological novelty market scope and
innovation readiness are highly pronounced suggesting that projects in this cluster
dedicate high attention to achieving breakthrough technological results which are
intended to help create markets These results should also be rather close to actual
exploitation while the embeddedness into the ecosystem is relatively low Thus we
refer to this cluster as ldquoPioneeringrdquo
Cluster 3 again differs quite substantially from the other two clusters in that it puts
high emphasis on ecosystem embeddedness followed by innovation readiness and
market scope Less attention is dedicated to the technological novelty of the project
Projects in this cluster hence aim at achieving diffusion and exploitation of the
innovative solution within the ecosystem which is why we refer to this cluster as
ldquoDiffusingrdquo
30
Figure 4 T-values of the cluster variables in the cluster solution
Overall and as expected the four cluster variables measuring the cognitive innovation
impact indicators are significantly different across the three clusters as an analysis of
variance (ANOVA) shows
As a next step the three-cluster solution and the group of public procurement projects
will be discussed with regard to the variables available to characterise the projects
Table 8 shows the results The columns contain the mean values of the respective
variables by cluster PPP and overall The final column presents the results of an
analysis of variance (ANOVA) and indicates whether the differences of the variable
means are statistically significant between the four groups (ie the three clusters and
the group of PPP)
Interesting differences emerge First the groups differ vastly in the average size of
the projects In absolute terms ldquoPioneeringrdquo projects turn out to have the highest
requested EC contribution closely followed by ldquoSustainingrdquo projects When it comes to
total project cost ldquoPioneeringrdquo projects show the highest value followed by
ldquoSustainingrdquo projects ldquoDiffusingrdquo projects and PPP are considerably smaller both in
terms of the requested EC contribution and the total project cost These differences
turn out to be statistically significant Comparing the requested contribution with the
total project cost leads to stark differences across the clusters The ratios of requested
contribution to total cost are 73 49 81 and 63 for the three clusters and
PPP respectively In that sense ldquoPioneeringrdquo projects require a rather low share of
budgetary contribution from the EU while dedicating high attention to technological
novelty market scope and innovation readiness In contrast ldquoSustainingrdquo and
ldquoDiffusingrdquo projects require a high share of budgetary contribution with ndash in the case
of ldquoSustainingrdquo projects ndash comparatively low focus all four dimensions of innovation
impact
Looking at the number of participants in the projects we do not find statistically
significant differences between the groups ldquoDiffusingrdquo projects and PPP have fewer
participants which coincides with the lower funding volume With regard to the
institutional composition of the projects we find stark differences between the groups
ldquoSustainingrdquo projects are relatively dominated by higher education institutions while
ldquoPioneeringrdquo projects typically involve relatively more private companies and research
organisations ldquoDiffusingrdquo projects have relatively fewer company participants PPP are
characterised by a strong presence of public bodies in the consortium The number of
SMEs is highest in ldquoPioneeringrdquo projects and lowest in PPP
-10 -05 00 05 10 15
Cluster 3
Cluster 2
Cluster 1
Technological novelty Market scope
Ecosystem embeddedness Innovation readiness
31
Moreover we find that the breadth of participants ie the number of different types
of participants present in the consortium is highest in the group of PPP indicating
high diversity within those projects while it is lowest for ldquoPioneeringrdquo projects
Apparently the planned activities in this group of projects require higher focus and
less institutional diversity Nevertheless projects in this group are characterised by
the highest number of different countries represented in the consortium while PPP
show the lowest diversity with respect to country origin of the participants Finally the
evaluation score does not vary much between the three clusters but turns out to be
considerably lower in the group of PPP
Table 8 Characterisation of the cluster solution
Variables Cluster 1
laquoSustainingraquo
Cluster 2
laquoPioneeringraquo
Cluster 3
laquoDiffusingraquo
PPP Total Sig
Requested EC
contribution (mEUR)
694 707 426 296 621
Total project cost
(mEUR)
946 1442 526 470 965
Number of
participants
1345 1409 1114 883 1293
Number of higher
education
institutions
242 216 231 117 229
Number of private
companies
761 884 503 150 715
Number of public
bodies
075 006 084 267 064
Number of research
organisations
198 256 205 233 217
Number of other
participants
064 044 081 100 064
Number of SMEs 337 431 279 067 342
Participant breadth 311 298 336 383 316
Country breadth 570 609 595 533 586
Evaluation score 1296 1295 1323 1175 1298
Obs 105 64 58 6 233
p lt 010 p lt 005 p lt 001
5 DISCUSSION AND IMPLICATIONS
This study makes two primary contributions to the assessment of likely innovation
impact within a certain subset of Horizon 2020 based on the exploratory analysis of
the proposals First it systematically establishes cognitive innovation impact indicators
which connect heterogeneity in innovation impact with differences in the attention that
consortia pay to particular innovation aspects Four central pillars for innovation
impact are related to cognitive processes and the allocation of attention Second this
study advances the measurement of cognitive innovation impact indicators by
applying content analyses and condensing the results through cluster analyses
Implications can be derived for both the funding instruments under study and for the
methodological development of innovation impact indicators
Implications for the Funding Instruments under Study
Horizon 2020 features the Innovation Action and innovation procurement instruments
in order to play a prominent role in bridging discovery with market application stages
and thus in helping to increase growth and employment in Europe (European
32
Commission 2014a) Yet a major challenge for the effective allocation of funding in
this respect is to verify whether these instruments actually deliver on innovation or
rather seek to primarily support research activities without the desired pronounced
focus on the commercial exploitation of innovation Since the projects under study
have only recently been started addressing this challenge within the scope of this
study necessarily remains incomplete However the results presented in this study
based on the analysis of the proposal texts allow to draw several conclusions
Within the conceptualisation of cognitive innovation impact any proposal text
represents the sum of the attention of the consortium (space considerations enforcing
priority setting) Consortia are heterogeneous in the degree to which they dedicate
attention to particular aspects ie divide the pie of overall attention Projects
focussing on research activities rather than on the commercial exploitation of
innovation can be expected to be dominated by considerations for technological
novelty Then again it would be unreasonable to assume little to no attention to
technological novelty in proposals directed at innovation Almost all innovation and
PPP call texts use technological novelty at least as a starting point and all proposals
contain indications of technological novelty That said the average proposal pays
roughly 33 more attention to innovation readiness than to technological novelty
Taking attention to readiness embeddedness and market scope together consortia
dedicate on average almost three times as much attention to the commercialisation of
technologies compared with describing technological novelty These results cannot rule
out that individual innovation proposals may be research projects in disguise
However this study finds little evidence in the large scale analysis that such concerns
can be generalised
Apart from these general considerations the following key insights can be derived
from the analyses
A cluster of proposals containing ldquoPioneeringrdquo project consortia can be identified
which pay comparatively more attention to achieving ambitious innovation
impact vis-agrave-vis the goals of Horizon 2020 Consortia are significantly more likely
to allocate their attention accordingly with increasing participation of private
firms including SMEs It is noteworthy that projects in this cluster combine
attention to technological novelty and market creation (market scope)
ldquoPioneeringrdquo consortia apparently require a combination of technological novelty
and market scope instead of an isolated pursuit of market scope in the absence
of technological novelty This suggests that the identification of innovation that is
potentially market creating requires careful assessment of the underlying
technology and its novelty
Another cluster of proposals containing ldquoDiffusingrdquo project consortia can be
identified with dedicated attention to diffusing innovation based on a broad
representation of the innovationrsquos ecosystem and its readiness Within the
ambition of Horizon 2020 for bridging discovery and market application these
consortia are clearly more specialised for the latter stages and can have an
important contribution for achieving market success
In the two clusters containing ldquoPioneeringrdquo and ldquoDiffusingrdquo projects attention to
market scope and innovation readiness are closely linked While projects in the
former cluster attach higher attention to technological novelty projects in the
latter cluster stress ecosystem embeddedness The joint occurrence of emphasis
on market scope and innovation readiness in an overall large number of projects
suggests that market creation requires a leap forward in the readiness of the
underlying innovation
33
A substantial share of Innovation Action projects can be characterised as
ldquoSustainingrdquo Project proposals in this cluster contain only modest focus on the
four innovation impact indicators That in turn indicates low ambition to increase
the chances that technologies will be successfully commercialised It is striking
that ldquoSustainingrdquo projects constitute the largest group of projects Nevertheless
the analysis only includes consortia that received funding It is therefore not
possible to compare ldquoSustainingrdquo projects with those proposals that did not
receive funding Within the context of this study ldquoSustainingrdquo projects should
therefore be considered as a baseline reference group for ldquoPioneeringrdquo and
ldquoDiffusingrdquo cluster proposals
With the caveat of the limited number of PPP proposals analysed in this study
they share many attention allocation similarities with Innovation Actions
However the attention devoted to innovation readiness is comparatively lower
There is a risk that PPP currently do not allocate enough attention to the broader
market application of innovation beyond public procurement
Overall the comparatively low scores for market scope across all projects under
study in comparison to the other cognitive innovation impact indicators suggest
that based on the content of the proposals the current schemes are not geared
towards supporting market creating innovation Then again the creation of new
markets is difficult to describe ex-ante as market creation largely depends on
product markets and demand conditions that are hard to predict in detail ex-ante
because market research techniques can only be applied to existing markets
Attention allocation expressed in call texts largely guides the attention allocation
of consortia in proposal texts andor evaluators However despite being
Innovation Actions call texts put comparatively higher emphasis on
technological novelty than on market scope ecosystem embeddedness and
innovation readiness although the latter three indicators are particularly
associated with the commercial exploitation of innovation
Implications for Innovation Indicators
No single innovation impact indicator is per se superior to others The cognitive
innovation impact indicators proposed in this study can alleviate some of the
weaknesses of more traditional approaches Ideally evaluations combine multiple
indicators such as cognitive innovation impact indicators based on content analysis
combined with a continuous monitoring through surveys as in the Innovation Radar
(De Prato et al 2015) Cross-validation of indicators for a selected set of proposals
has the largest potential for obtaining reliable sets of indicators Table 9 provides an
overview of the strengths and weaknesses of different innovation indicators
The cognitive innovation impact indicators proposed in this study allow an early
assessment of the likely innovation impact of the proposals even before they are
actually funded They build on the assumption that the participants in a consortium
have to devise a joint approach for solving an innovation problem in order to
successfully exploit the project outcome This joint approach requires the consortium
to allocate attention to areas related to innovation impact Due to limited attention
and resources consortia have to prioritise Cognitive innovation impact indicators are
based on the idea that the allocation of attention and the prioritisation of resources as
described in the proposal will be carried through during the term of the project
leading to higher or lower innovation impact along the four dimensions identified
The analysis presented in this study does not allow qualifying one of the four cognitive
innovation impact indicators as more important than the others in its overall
contribution towards innovation impact Rather the theoretical reasoning and
empirical analysis suggest that consortia need to reflect on all four indicators in their
34
proposals in order to increase the chances for successful innovation Each indicator
reflects a distinct dimension of innovation impact and a dedicated allocation of
attention to these four dimensions can be assumed to translate into focus on
innovation impact while actually carrying out the planned activities in the project
While it is still too early to conclude whether the articulated focus on innovation in the
projects will materialise the four indicators allow an eye on the extent Horizon 2020
will deliver on innovation
This study proposes four indicators to measure the extent to which Horizon 2020 will
deliver on innovation in the short medium and longer term These indicators focus on
innovation instead of research impact by connecting the attention for technological
novelty with attention to product market considerations for commercialisation ie
market scope ecosystem embeddedness as well as innovation readiness On average
the studied project proposals devote almost three times as much attention to the
latter issues compared with technological novelty Such systematic quantifications of
attention allocation across large numbers of project proposals are a unique advantage
of content analyses While this allocation of attention cannot be directly translated into
consortia budget provisions and market outcomes the large share of attention
devoted to commercialisation provides confidence that Horizon 2020 will have
important innovation outcomes in the short and medium term Especially the attention
that ldquoPioneeringrdquo and ldquoDiffusingrdquo project consortia devote to innovation readiness
suggests that impact is likely to occur rather sooner than later Projects in these
clusters comprise the majority of innovation projects under consideration Long term
consequences cannot be credibly predicted based on attention allocation at any given
point in time since attention is likely to be re-allocated based on experience and
feedback eg through customer responses or competitor behaviour Potential future
studies could draw on both cognitive and other types of innovation indicators (ie
survey-based qualitative and quantitative) to verify the findings of this report and
assess potential long-term consequences In relative terms public procurement
projects allocate less attention to innovation readiness With the caveat of small
sample size for these projects in mind it is comparatively less likely that they will
contribute to the innovation goals of Horizon 2020 in the short term
Finally a cross-check of the proposed indicators of this study with the evaluation
criteria of projects within the relevant schemes provides confidence in the selection of
projects First all projects fulfil at least a minimum level of attention to technological
novelty market scope ecosystem embeddedness as well as innovation readiness
Second the allocation of attention to these four indicators expressed in project
proposals correlates positively and significantly with the attention expressed in the
respective call Hence a cognitive transfer of attention priorities from call texts to
funded consortia has successfully occurred Finally there is no systematic evidence
that innovation project proposals are research proposals in disguise since
technological novelty does not dominate proposal attention Given that this study
analyses exclusively granted project proposals it is equally likely that such proposals
have not been submitted or that evaluators have performed their duties well and
ranked them low In both cases the purpose of the grant scheme would have been
accomplished
35
Table 9 Overview of strengths and weaknesses of different innovation indicators
Cognitive innovation impact
indicators
Survey-based innovation
impact indicators
Quantitative innovation
impact indicators (eg
publications patents)
Qualitative innovation impact
indicators (eg case studies)
Strengths Non-intrusive administration
Large scale application
Applicable and observable for
unsuccessful consortia
Systematic and replicable
Short processing time and
availability
Quantitative results
Benchmarking
Comparison over time
Cross-country comparisons
Quantitative results
Benchmarking
Comparison over time
Cross-country comparisons
Comparable quality
standards
Deep context-specific
insights
Tailored to innovation
Comprehensive set of
impacts eg societal
Weaknesses Expressed intention may not
be followed by action
Professional grant
consultants eliminate
heterogeneity
Vulnerable to confirmation
bias
Potential for ex-post
rationalisation
Administrative effort for
innovators
Costs for surveying
sampling
Survival bias
Limited to selected outcomes
Limited to selected sectors
and industries
Potentially long time delay
Time and cost intensive
Important selection biases
Significant efforts from
innovators
Potential for ex-post
rationalization
Potential for conformity
biases
36
REFERENCES
Abernathy WJ and KB Clark (1985) Innovation Mapping the Winds of Creative
Destruction Research Policy 14 (1) 3-22
Adner R (2006) Match Your Innovation Strategy to Your Innovation Ecosystem
Harvard Business Review 84 (4) 98-107
Adner R (2017) Ecosystem as Structure an Actionable Construct for Strategy
Journal of Management 43 (1) 39-58
Adner R and R Kapoor (2010) Value Creation in Innovation Ecosystems How the
Structure of Technological Interdependence Affects Firm Performance in New
Technology Generations Strategic Management Journal 31 (3) 306-333
Amit R and C Zott (2001) Value Creation in E-Business Strategic Management
Journal 22 (6-7) 493-520
Backhaus K B Erichson W Plinke and R Weiber (2008) Multivariate
Analysemethoden Eine Anwendungsbezogene Einfuumlhrung Berlin
Barr PS (1998) Adapting to Unfamiliar Environmental Events A Look at the
Evolution of Interpretation and Its Role in Strategic Change Organization Science 9
(6) 644-669
Brown SL and KM Eisenhardt (1995) Product Development Past Research
Present Findings and Future Directions Academy of Management Review 20 (2)
343-378
Chandy RK and GJ Tellis (2000) The Incumbentrsquos Curse Incumbency Size and
Radical Product Innovation Journal of Marketing 64 (3) 1-17
Charitou CD and CC Markides (2002) Responses to Disruptive Strategic
Innovation MIT Sloan Management Review 44 (2) 55-64
Chesbrough HW (2003) The Era of Open Innovation MIT Sloan Management
Review 44 (3) 35-41
Chiesa V and F Frattini (2011) Commercializing Technological Innovation Learning
from Failures in High-Tech Markets Journal of Product Innovation Management 28
(4) 437-454
Cho TS and DC Hambrick (2006) Attention as the Mediator between Top
Management Team Characteristics and Strategic Change The Case of Airline
Deregulation Organization Science 17 (4) 453-469
Christensen CM and JL Bower (1996) Customer Power Strategic Investment and
the Failure of Leading Firms Strategic Management Journal 17 (3) 197-218
Christensen CM M Raynor and R McDonald (2015) What Is Disruptive
Innovation Harvard Business Review 93 (12) 44-53
Clarkson ME (1995) A Stakeholder Framework for Analyzing and Evaluating
Corporate Social Performance Academy of Management Review 20 (1) 92-117
Darroch J and MP Miles (2011) A Research Note on Market Creation in the
Pharmaceutical Industry Journal of Business Research 64 (7) 723-727
Davis JP (2016) The Group Dynamics of Interorganizational Relationships
Collaborating with Multiple Partners in Innovation Ecosystems Administrative
Science Quarterly 61 (4) 621-661
De Coster R and C Butler (2005) Assessment of Proposals for New Technology
Ventures in the Uk Characteristics of University Spin-Off Companies Technovation
25 (5) 535-543
De Prato G D Nepelski and G Piroli (2015) Innovation Radar Identifying
Innovations and Innovators with High Potential in Ict Fp7 Cip amp H2020 Projects
JRC Scientific and Policy Reports ndash EUR 27314 EN Seville JRC-IPTS No
Dewar RD and JE Dutton (1986) The Adoption of Radical and Incremental
Innovations An Empirical Analysis Management Science 32 (11) 1422-1433
Duriau VJ RK Reger and MD Pfarrer (2007) A Content Analysis of the Content
Analysis Literature in Organization Studies Research Themes Data Sources and
Methodological Refinements Organizational Research Methods 10 (1) 5-34
37
Eggers JP and S Kaplan (2009) Cognition and Renewal Comparing Ceo and
Organizational Effects on Incumbent Adaptation to Technical Change Organization
Science 20 (2) 461-477
Ettlie JE (1983) Organizational Policy and Innovation among Suppliers to the Food
Processing Sector Academy of Management Journal 26 (1) 27-44
European Commission (2010) Europe 2020 A Strategy for Smart Sustainable and
Inclusive Growth No COM(2010) 2020 final
European Commission (2012) The Grand Challenge The Design and Societal Impact
of Horizon 2020 Brussels
European Commission (2014a) Horizon 2020 in Brief The Eu Framework Programme
for Research amp Innovation Brussels
European Commission (2014b) Technology Readiness Levels (Trl) HORIZON 2020 ndash
Work Programme 2014-2015 General Annexes Extract from Part 19 No
Commission Decision C(2014)4995 Brussels
European Commission (2015a) The Contribution of the Framework Programme to
Major Innovations Brussels
European Commission (2015b) Horizon 2020 Output Indicators Assessing the Results
and Impact of Horizon 2020 Brussels
European Commission (2016) Horizon 2020 Monitoring Report 2015 No
httpseceuropaeuresearchevaluationspdfarchiveh2020_monitoring_reportss
econd_h2020_annual_monitoring_reportpdfview=fitamppagemode=none Brussels
Everitt BS S Landau M Leese and D Stahl (2011) Cluster Analysis New York
Fisher ML (1997) What Is the Right Supply Chain for Your Product Harvard
Business Review 75 (2) 105-116
Gatignon H ML Tushman W Smith and P Anderson (2002) A Structural Approach
to Assessing Innovation Construct Development of Innovation Locus Type and
Characteristics Management Science 48 (9) 1103-1122
Gemuumlnden HG T Ritter and P Heydebreck (1996) Network Configuration and
Innovation Success An Empirical Analysis in German High-Tech Industries
International Journal of Research in Marketing 13 (5) 449-462
Gilbert C (2003) The Disruption Opportunity MIT Sloan Management Review 44 (4)
27-33
Govindarajan V and PK Kopalle (2006) Disruptiveness of Innovations
Measurement and an Assessment of Reliability and Validity Strategic Management
Journal 27 (2) 189-199
Grimpe C and W Sofka (2009) Search Patterns and Absorptive Capacity Low-and
High-Technology Sectors in European Countries Research Policy 38 (3) 495-506
Hamel G and CK Prahalad (1991) Corporate Imagination and Expeditionary
Marketing Harvard Business Review 69 (4) 81-92
Hart S E Jan Hultink N Tzokas and HR Commandeur (2003) Industrial
Companies Evaluation Criteria in New Product Development Gates Journal of
Product Innovation Management 20 (1) 22-36
Hultink EJ A Griffin S Hart and HSJ Robben (1997) Industrial New Product
Launch Strategies and Product Development Performance Journal of Product
Innovation Management 14 (4) 243-257
Kaplan S (2011) Research in Cognition and Strategy Reflections on Two Decades of
Progress and a Look to the Future Journal of Management Studies 48 (3) 665-
695
Kaplan S F Murray and R Henderson (2003) Discontinuities and Senior
Management Assessing the Role of Recognition in Pharmaceutical Firm Response
to Biotechnology Industrial and Corporate Change 12 (2) 203-233
Ketchen DJ and CL Shook (1996) The Application of Cluster Analysis in Strategic
Management Research An Analysis and Critique Strategic Management Journal 17
441-458
Kim WC and R Mauborgne (1999) Creating New Market Space Harvard Business
Review 77 (1) 83-93
Kim WC and R Mauborgne (2005) Blue Ocean Strategy From Theory to Practice
California Management Review 47 (3) 105-121
38
Kim WC and R Mauborgne (2015) Red Ocean Traps Harvard Business Review 93
(3) 68-73
Koumlhler C W Sofka and C Grimpe (2012) Selective Search Sectoral Patterns and
the Impact on Product Innovation Performance Research Policy 41 (8) 1344-1356
Krippendorff K (2004) Content Analysis An Introduction to Its Methodology
Thousand Oaks CA
Krishnan V and KT Ulrich (2001) Product Development Decisions A Review of the
Literature Management Science 47 (1) 1-21
Laursen K and A Salter (2006) Open for Innovation The Role of Openness in
Explaining Innovation Performance among Uk Manufacturing Firms Strategic
Management Journal 27 (2) 131-150
Leveacuten P J Holmstroumlm and L Mathiassen (2014) Managing Research and Innovation
Networks Evidence from a Government Sponsored Cross-Industry Program
Research Policy 43 (1) 156-168
Lindič J M Bavdaž and H Kovačič (2012) Higher Growth through the Blue Ocean
Strategy Implications for Economic Policy Research Policy 41 (5) 928-938
Milligan GW and MC Cooper (1987) Methodology Review Clustering Methods
Applied Psychological Measurement 11 (4) 329-354
Mojena R (1977) Hierarchical Grouping Methods and Stopping Rules An Evaluation
The Computer Journal 20 (4) 359-363
Montoya-Weiss MM and R Calantone (1994) Determinants of New Product
Performance A Review and Meta-Analysis Journal of Product Innovation
Management 11 (5) 397-417
Nadkarni S and PS Barr (2008) Environmental Context Managerial Cognition and
Strategic Action An Integrated View Strategic Management Journal 29 (13) 1395-
1427
Neuendorf KA (2002) The Content Analysis Guidebook Thousand Oaks CA
OConnor GC (2008) Major Innovation as a Dynamic Capability A Systems
Approach Journal of Product Innovation Management 25 (4) 313-330
OConnor GC and R DeMartino (2006) Organizing for Radical Innovation An
Exploratory Study of the Structural Aspects of Ri Management Systems in Large
Established Firms Journal of Product Innovation Management 23 (6) 475-497
Ocasio W (1997) Towards an Attention-Based View of the Firm Strategic
Management Journal 18 (S1) 187-206
Olsen A W Sofka and C Grimpe (2016) Coordinated Exploration for Grand
Challenges The Role of Advocacy Groups in Search Consortia Academy of
Management Journal
Pisano GP and DJ Teece (2007) How to Capture Value from Innovation Shaping
Intellectual Property and Industry Architecture California Management Review 50
(1) 278-296
Powell WW KW Koput and L Smith-Doerr (1996) Interorganizational
Collaboration and the Locus of Innovation Networks of Learning in Biotechnology
Administrative Science Quarterly 41 (1) 116-145
Scheibler D and W Schneider (1985) Monte Carlo Tests of the Accuracy of Cluster
Analysis Algorithms A Comparison of Hierarchical and Nonhierarchical Methods
Multivariate Behavioral Research 20 (3) 283-304
Schilling MA (2016) Strategic Management of Technological Innovation New York
Subramaniam M and MA Youndt (2005) The Influence of Intellectual Capital on the
Types of Innovative Capabilities Academy of Management Journal 48 (3) 450-463
Talke K and EJ Hultink (2010) Managing Diffusion Barriers When Launching New
Products Journal of Product Innovation Management 27 (4) 537-553
Teece DJ (1986) Profiting from Technological Innovation Implications for
Integration Collaboration Licensing and Public Policy Research Policy 15 (6) 285-
305
Teece DJ (2006) Reflections on ldquoProfiting from Innovationrdquo Research Policy 35 (8)
1131-1146
39
Teece DJ (2007) Explicating Dynamic Capabilities The Nature and Microfoundations
of (Sustainable) Enterprise Performance Strategic Management Journal 28 (13)
1319-1350
Terwiesch C and RE Bohn (2001) Learning and Process Improvement During
Production Ramp-Up International Journal of Production Economics 70 (1) 1-19
Thomke SH (1998) Managing Experimentation in the Design of New Products
Management Science 44 (6) 743-762
Vergne J-P (2012) Stigmatized Categories and Public Disapproval of Organizations
A Mixed-Methods Study of the Global Arms Industry 1996ndash2007 Academy of
Management Journal 55 (5) 1027-1052
Vorhies DW and NA Morgan (2003) A Configuration Theory Assessment of
Marketing Organization Fit with Business Strategy and Its Relationship with
Marketing Performance Journal of Marketing 67 (1) 100-115
Vorhies DW and NA Morgan (2005) Benchmarking Marketing Capabilities for
Sustainable Competitive Advantage Journal of Marketing 69 (1) 80-94
Vorhies DW RE Morgan and CW Autry (2009) Product‐Market Strategy and the
Marketing Capabilities of the Firm Impact on Market Effectiveness and Cash Flow
Performance Strategic Management Journal 30 (12) 1310-1334
Ward JH (1963) Hierarchical Grouping to Optimize an Objective Function Journal of
the American Statistical Association 58 (301) 236-244
Zott C R Amit and L Massa (2011) The Business Model Recent Developments and
Future Research Journal of Management 37 (4) 1019-1042
40
APPENDIX
DICTIONARY TECHNOLOGICAL NOVELTY
Word stems and phrases
advan highly efficient solution
breakthrough improv solv
chang innovati step
combin invent substantial
compared to state of the art leading superior
compared to state-of-the-art major sustainable
compared to the state of the art new technolog
compared to the state-of-the-art novel than state of the art
disrupt optimis than state-of-the-art
enhanc optimiz than the state of the art
first of a kind patent than the state-of-the-art
first of its kind process transformat
first-of-a-kind product ultra
first-of-its-kind progressiv world leading
fundamental radical world-leading
high yield revolution
high-yield significan Note indicates all possible word endings
DICTIONARY MARKET SCOPE
Word stems and phrases
addition disrupt product
applica end-user redefin
augment enduser replac
challeng entry revenue
client industry scop
competit internat segment
complement introduc substitut
consumer mainstream transform
customer market turnover
demand niche user
differentiat pioneer Note indicates all possible word endings
41
DICTIONARY ECOSYSTEM EMBEDDEDNESS
Word stems and phrases
accept ecosystem public
bridg engag relation
bring together environment resell
bringing together exchang shared
citizen feedback social
civil holistic societ
cluster inclus socio-economic
co-operat inter-sectoral socioeconomic
collabor interact spill-over
communit interdisciplinar spillover
complement intermediar stakeholder
consult involv supplier
consumer joined supply chain
cooperat joint transfer
cross-sectoral licens universit
customer networking user
distribut participat
eco-system partner Note indicates all possible word endings
DICTIONARY INNOVATION READINESS
Word stems and phrases
accelerat feasibilit readiness
adapt financ ready
advertis fund return on investment
appl incubat roi
approv intellectual propert roll out
assess invest sales
benchmark ip scale up
brand launch scale-up
business model loan scaling up
business plan manufactur scaling-up
certificat market research standard
commerciali market share start up
communication strategy marketing start-up
competitiveness matur startup
consumer patent supply chain
copyright pilot test
customer pric tool
demonstrat private equity trademark
deploy production update
disseminat promoti user
distribut proof validat
entrepreneur protecti value proposition
exploit prototyp viab Note indicates all possible word endings
HOW TO OBTAIN EU PUBLICATIONS
Free publications
bull one copy
via EU Bookshop (httpbookshopeuropaeu)
bull more than one copy or postersmaps
from the European Unionrsquos representations (httpeceuropaeurepresent_enhtm)
from the delegations in non-EU countries
(httpeeaseuropaeudelegationsindex_enhtm)
by contacting the Europe Direct service (httpeuropaeueuropedirectindex_enhtm)
or calling 00 800 6 7 8 9 10 11 (freephone number from anywhere in the EU) () () The information given is free as are most calls (though some operators phone boxes or hotels may charge you)
Priced publications
bull via EU Bookshop (httpbookshopeuropaeu)
Priced subscriptions
bull via one of the sales agents of the Publications Office of the European Union
(httppublicationseuropaeuothersagentsindex_enhtm)
doi 102777610808
KI-N
A-2
8-5
32-E
N-N
Innovation actions were introduced in Horizon 2020 to help bringing discoveries to the market Most of them demonstrate the application of new knowledge in real-life conditions The very first projects started in 2014 and it still is too early for them to produce final results but a short study was commissioned to look into the projects based on proposal texts (Grimpe C et al Study on Innovation in Horizon 2020 Projects EC) For this study 227 Innovation Actions and six innovation
procurement actions were selected that started in 2015 most of them in the PPPs such as Ecsel Clean Sky Factories of the Future Energy Efficient Buildings Clean Vehicle but also in other calls (FTI ICT NMP environmental technologies Galileo and others) The texts of the granted projects were analysed using content analysis methodology based on keywords that indicate four innovation aspects technological novelty market scope ecosystem embeddedness and innovation readiness
The projects were grouped in three categories 64 out of the 227 innovation actions score high on
technological novelty market scope and innovation readiness but low on ecosystem embeddedness These are called pioneering projects They seem to focus on breakthrough technological results that may create markets To the contrary another 58 innovation actions emphasise ecosystem embeddedness and score lower on the other three aspects These are called diffusing projects that aim at diffusion and exploitation of the innovative solution in the ecosystem The remaining 105 innovation actions pay only modest attention to each of the four
aspects These are called sustaining projects The composition of the consortia differs pioneering projects involve relatively more private companies esp SMEs and research institutions The diffusing projects have less companies and more public bodies The sustaining projects are
dominated by higher education institutions It is still too early to characterise these innovation actions and their impacts but these initial findings indicate that a quarter have a disruptive market-creating potential and that companies and research institutions play a leading role in these initiatives
The six innovation procurement projects share many attention allocation similarities with the innovation actions However the attention devoted to innovation readiness and market scope is comparatively lower There is a risk that these projects do not allocate enough attention to the broader market application of innovation beyond public procurement
These conclusions are based on the texts of the projects at their start The results of the projects are expected in 2018-2019
Studies and reports
[Ca
talo
gu
e n
um
be
r]
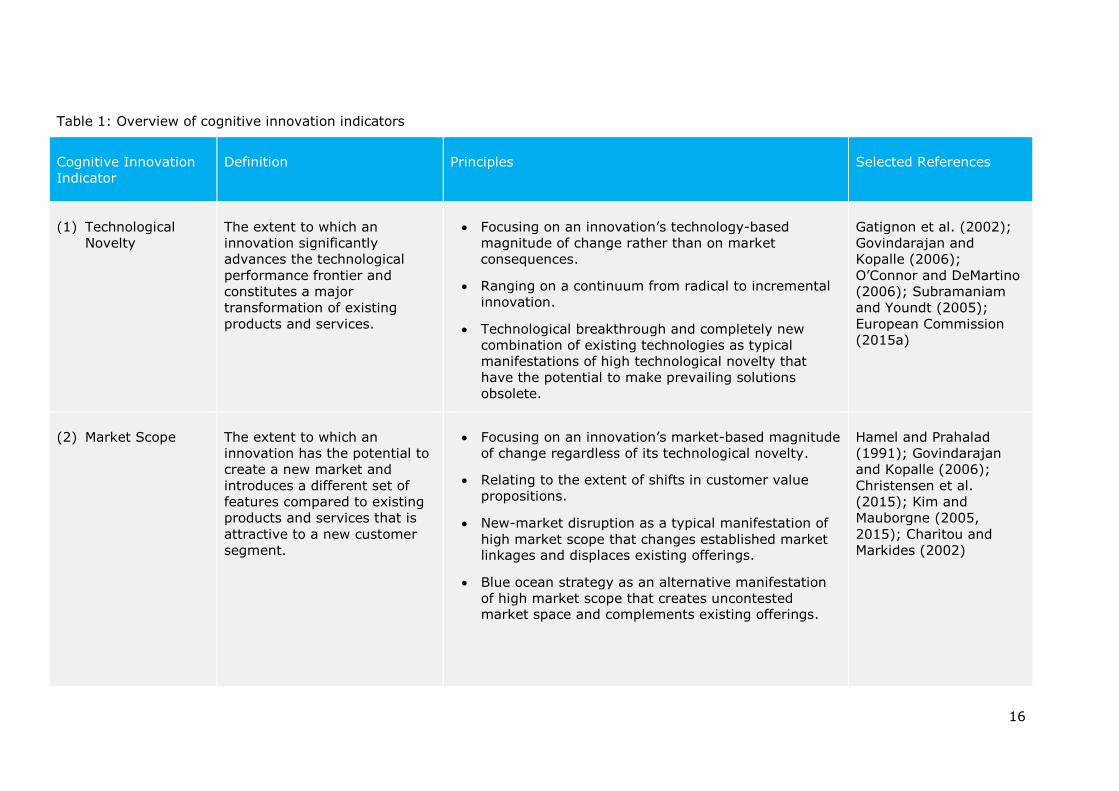
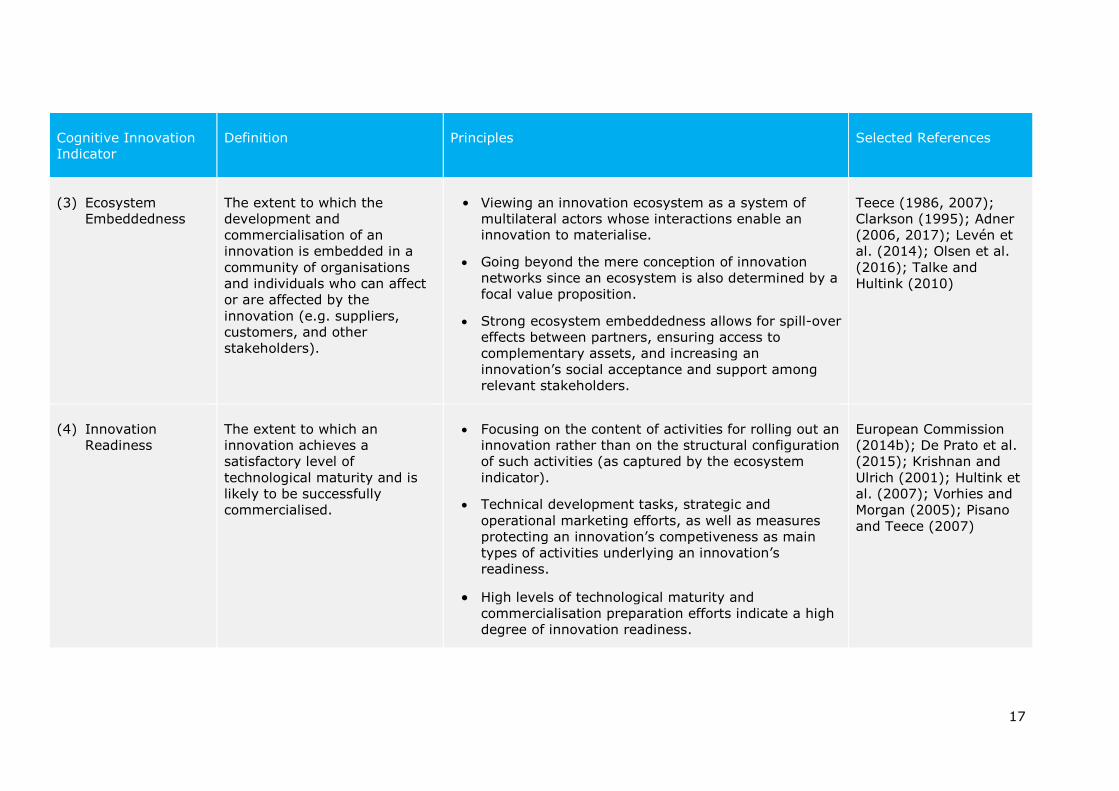
20
generated through content analysis cannot be readily converted into a particular TRL
Content analysis is also not an efficient way to measure the composition of the
consortium
In an exploratory part of the study the dictionaries derived from the content analysis
of grant proposals are applied to the call texts to which each of the proposals
responds Correlations between call and proposal texts are calculated and discussed
with regards to how much the foci expressed in the call texts can be re-traced in the
respective proposal texts
The four variables generated through content analysis therefore measure the
emphasis that grant writers have put on each of the four cognitive innovation
indicators A higher value in one variable indicates that a higher percentage of words
used in the proposal were found in one of the dictionaries ie applicants spent more
words describing one of the four facets of innovation impact
Cluster Analysis
The four variables generated through content analysis are subsequently combined
with the CORDIS data on the project level and used in a cluster analysis Specifically
the cognitive innovation indicators are used as cluster variables while the remainder of
variables are used to describe the resulting cluster solution in order to identify
patterns and derive implications The overall aim of a cluster analysis is to reduce
heterogeneity by defining groups of proposals that are similar within the group and as
dissimilar as possible between the groups (Milligan and Cooper 1987) The clusters
are then interpreted based on the average values of the cluster variables within each
cluster This grouping is similar to the method used in the Innovation Scoreboard
where indicators are combined and countries are ranked as ldquoinnovation leadersrdquo
ldquofollowersrdquo etc To account for the differences between Innovation Actions and public
procurement projects the cluster analysis is only performed on the 227 Innovation
Actions in the data while the six public procurement projects will be discussed
separately ie they represent their own cluster and will be discussed alongside the
others
Since this study pursues an exploratory approach the cluster analysis uses a
hierarchical clustering method Instead of partitioning the data in a single step
according to a particular number of clusters that is set ex-ante this type of method
runs a series of partition steps ranging from a single cluster including all cases to as
many clusters as cases exist (Everitt et al 2011) Specifically the study applies
Wardrsquos (1963) agglomerative hierarchical clustering procedure to the data which
merges two clusters on the basis of the sum of squared errors That is at each fusion
step the total within-cluster sum of squared errors is minimised (Everitt et al 2011)
Wardrsquos method is considered as one of the most reliable and robust clustering
methods and thus generally recommended in the literature The results of simulation
studies which compare different clustering algorithms have shown that Wardrsquos
algorithm in most cases yields very good partitions and tends to correctly assign
cases to clusters (Scheibler and Schneider 1985 Backhaus et al 2008)
To establish the appropriateness of Wardrsquos method for the present analysis the
preconditions for applying this method were checked (cf Backhaus et al 2008
Ketchen and Shook 1996) First variables are continuous and not too highly
correlated Second no outliers were found based on the single-linkage method which
tends to result in broad and unbalanced clusters Third the data is expected to
produce clusters of similar sizes with similar spread Fourth a distance measure
reflecting the dissimilarity between cases is used as a proximity metric rather than a
similarity measure reflecting the similarity between two cases In particular this study
applies the so-called Euclidean Distance measure which does not influence the
weighting of variances and thus is more suitable for the studyrsquos data structure than
21
the squared Euclidean Distance which weights small differences lower and large
differences higher (Backhaus et al 2008)
A crucial step in cluster analysis is the choice for the appropriate number of clusters
ie to find a meaningful number of clusters between the two extremes of only one
cluster containing all projects and one cluster for each of the projects Prior literature
has developed several approaches in order to identify an appropriate cluster solution
(cf Ketchen and Shook 1996) As a first approach a so-called dendogram a
mathematical and graphical representation of the clustering process also known as
tree diagram is drawn In a dendogram clusters are indicated by nodes and the
distance at which clusters are merged are represented by the length of the respective
stem thereby giving a first indication of possible cluster solutions (Everitt et al
2011) As a second approach the values at which cases are combined to build a
cluster the so-called agglomeration coefficients (also representing the sum of squared
errors) are plotted on a y-axis against the number of possible clusters on an x-axis
The point at which the resulting curve shows a clear flattening also referred to as the
ldquoelbow criterionrdquo corresponds to the appropriate number of clusters because from this
point the clusters being merged are very dissimilar (Ketchen and Shook 1996) To
substantiate these graphical approaches Mojenarsquos (1977) criterion is used according
to which a good cluster solution is indicated by the highest number of clusters for
which the standardised agglomeration coefficient exceeds a certain cut-off value for
the first time (Backhaus et al 2008) The literature suggests cut-off values between
275 and 350 to determine an appropriate number of clusters (Everitt et al 2011)
The clusters are subsequently characterised along relevant applicant and project
information eg the size of the consortium the project cost and its composition
(higher and secondary education private for profit public body research
organisations and other types of organisations)
4 RESULTS
Descriptive Results
Table 2 shows the descriptive statistics of the cognitive innovation impact indicators
for the Innovation Action projects under study The mean values indicate the
percentage of words in the respective proposal texts that appear in the respective
dictionaries Moreover the remaining columns show the standard deviation as well as
the minimum and maximum values of the variables in the data We find the highest
average value for the innovation readiness indicator (colour-coded in green) followed
by technological novelty ecosystem embeddedness (colour-coded in yellow) and
market scope (colour-coded in red) The values of the standard deviation are relatively
low indicating rather low variation of the variable value within the data However
particularly the maximum values show that there are some proposals in the data that
place very strong emphasis on the respective facet of innovation impact
Table 2 Cognitive innovation impact indicators for Innovation Actions (n=227)
Variable Mean Std Dev Min Max
Technological novelty 182 069 058 457
Market scope 126 051 039 431
Ecosystem embeddedness 136 052 054 387
Innovation readiness 243 061 119 494
The interpretation of the mean values of the four innovation indicators can only be
made relative to one another not in absolute terms This is because the frequency of
using certain words depends considerably on the specific type of text that is analysed
22
However evidence from prior research employing content analysis shows very similar
average values for constructs derived through this method (eg Olsen et al 2016)
In relative terms the results show that proposals place considerably higher emphasis
on outlining the readiness of the innovation to be developed compared to its market
scope This seems in accordance with the stipulated objectives of Innovation Actions
to facilitate innovation in contrast to funding research activities Nevertheless
proposals also stress technological novelty while remaining relatively quiet on
ecosystem embeddedness and market scope2
Table 3 further describe the projects under study The requested EC contribution and
total project costs are EUR 630 million and EUR 978 million respectively but there is
considerable variation among the projects as evidenced by the rather low minimum
and high maximum values Projects have on average 13 participants but the largest
project includes 50 participants Projects turn out to be dominated by private
companies There are on average seven companies involved in a project accompanied
by slightly more than two higher education institutions and two research
organisations Public entities and other types of participants only play a minor role Of
the private companies about half of them are SMEs Given the consortium
composition projects can be assumed to have a rather strong focus on applied
research and exploitation ndash a focus that would presumably be different had the
projects involved a higher share of higher education and research institutions
Consequently the average ldquobreadthrdquo of participants ie the number of different
participant types in a consortium equals three while the country breadth indicates that
participants from almost six different countries collaborate in a consortium The mean
evaluation score is 13
Table 3 Descriptive statistics for Innovation Actions (n=227)
Variable Mean Std Dev Min Max
Requested EC contribution (mEUR) 630 619 033 3933
Total project cost (mEUR) 978 1681 035 18108
Number of participants 1304 927 1 50
Number of higher education institutions 232 241 0 17
Number of private companies 730 638 0 43
Number of public bodies 058 149 0 12
Number of research organisations 216 175 0 9
Number of other participants 063 133 0 10
Number of SMEs 349 285 0 19
Participant breadth 314 106 1 5
Country breadth 588 263 1 16
Evaluation score 1302 102 10 15
evaluation score is missing for eleven projects
2 Since the length of the dictionaries originates from a validation exercise involving 12 experts there is no ex-ante optimal length All items of a given dictionary are supposed to reflect the same construct eg innovation readiness In principle the items are synonyms for one another (Duriau et al 2007) Dictionary length indicates that the experts could
think of many suitable synonyms not that proposals have to use many different words for expressing attention to a given construct The diversity of dictionary items in a given text is likely to indicate linguistic style but not necessarily more attention to a given construct All other things equal a proposal using marketing six times should not be treated differently than a proposal using marketing three times and advertising three times (both words are part of the innovation readiness dictionary)
23
Table 4 shows the scores of the cognitive innovation impact indicators of the six public
procurement projects Although the overall number of projects is low interesting
differences with the 227 Innovation Actions emerge The most pronounced cognitive
innovation impact indicator turns out to be ecosystem embeddedness closely followed
by innovation readiness and technological novelty Market scope only plays a minor
role similar to the Innovation Actions In general the mean and maximum values of
the four indicators appear to be much lower compared to the Innovation Actions
Table 4 Descriptive statistics public procurement projects (n=6)
Variable Mean Std Dev Min Max
Technological novelty 175 040 101 218
Market scope 108 015 089 128
Ecosystem embeddedness 192 033 148 233
Innovation readiness 184 043 119 250
Table 5 shows further descriptive statistics for the public procurement projects They
are considerably smaller on average than Innovation Actions The requested EC
contribution and total project cost are EUR 296 million and EUR 470 million
respectively Projects have on average nine participants and most of them are public
bodies followed by research organisations private companies and higher education
institutions This indicates a considerably different composition of the consortia
Moreover SME involvement is relatively rare Regarding the breadth measures we
find that almost four different types of participants and five different countries are
involved in the consortium The mean evaluation score is 1175
Table 5 Descriptive statistics for public procurement projects (n=6)
Variable Mean Std Dev Min Max
Requested EC contribution (mEUR) 296 145 078 472
Total project cost (mEUR) 470 146 270 677
Number of participants 883 382 6 15
Number of higher education institutions 117 147 0 4
Number of private companies 150 084 0 2
Number of public bodies 267 207 0 6
Number of research organisations 233 301 0 8
Number of other participants 100 063 0 2
Number of SMEs 067 052 0 1
Participant breadth 383 075 3 5
Country breadth 533 197 3 8
Evaluation score 1175 160 10 14
In sum the tables showing descriptive statistics for Innovation Actions and public
procurement projects indicate considerable differences between the two types of
projects These differences also warrant an exclusion of the only six public
procurement projects from the cluster analysis The public procurement projects will
however be discussed together with the results of the cluster analysis for the
Innovation Actions
Qualitative Results
The manual reading of 40 randomly selected proposal texts not only serves ndash as
indicated ndash to quantitatively validate the results of the content analysis by means of
interrater reliability statistics but also to provide a qualitative validation that rests on
24
the identification of particularly telling paragraphs of text In the following text boxes
will be presented by indicator containing selected quotes from the proposals with
above median scores of the respective indicators All quotes are anonymised
The quotes expressing technological novelty tend to stress the ground-breaking nature
of the technology to be developed its newness and potentially ldquoparadigm-shiftingrdquo
effect Moreover proposals often also highlight the novel combination and
recombination of already existing technologies which academic literature has
frequently characterised as the main source of innovation (eg Koumlhler et al 2012)
In several places descriptions of technological novelty are linked to the readiness of
the innovation for exploitation
Technological novelty
ldquo[Project acronym] brings knowledge and demonstration of two disruptive
technologies additive manufacturing and internet technologies to the industrial
partners including SMEs in the traditional toy and nursery furniture sectors
strengthening their competiveness and growthrdquo
ldquo[Project acronym] will provide innovative solutions to overcome existing bottlenecks
associated with Pulsed Electric Field preservation in the food industry for improving
food quality optimizing process efficiency reducing energetic cost and introducing
foods with new properties in the market with the final goal of providing a real‐scale
demonstration of the viability of the PEF technologyrdquo
ldquoThe technology has the potential to completely change the landscape of iron and
steelmaking in Europe over a 15 year periodrdquo
High attention to market scope is reflected in the following quotes They not only
describe possibilities to enter new markets develop niche markets or create entirely
new markets but they also often times suggest a change in the value proposition to
potential customers In some quotes attention to market scope is also very closely
linked to descriptions of technological novelty or innovation readiness for immediate
commercial exploitation
Market scope
ldquoCreation of new market opportunities both inside and outside Europe Market
potential outside Europe is identified in semi-arid environments (eg Morocco) or
monsoon environments (eg India) where there is a major need to optimize water
resource userdquo
ldquoTogether with [participant name] and [participant name] we want to disrupt the very
market where we compete and change the rules that run it reducing operation costs
by 80rdquo
ldquoThe [project acronym] technology will boost Europes industrial leadership in
advanced manufacturing and processing In addition it will foster employment and
open new market opportunities in this field This would relate both to the European
steel industry itself as well as the many European engineering companies supplying
the plant and equipmentrdquo
Attention to ecosystem embeddedness is explicitly expressed in the following quotes
Here proposals describe the communication diffusion and dissemination of their
project outcomes the integration into innovation networks as well as their
considerations for stakeholder acceptance and support These activities can be
25
expected to accelerate the uptake of innovations and to increase their societal impact
(eg Olsen et al 2016)
Ecosystem embeddedness
ldquoThe proposed project disseminates its results between medical technological and
managerial domains accordingly to a coherent plan of activities centered around an
active involvement of the various stakeholders on a multinational level Every
stakeholder will take part to one or more dissemination activities of the project [hellip]
The definition of communication needs for every stakeholder is an essential step
towards the institution of an effective network of collaborators partners and
stakeholders themselvesrdquo
ldquoWe see [project acronym] as an innovation system in the sense of Freeman as lsquoa
network of institutions in the public and private sectors whose activities and
interactions initiate import modify and diffuse new technologiesrsquo [Project acronym]
will be such an innovation system because it will gather the above mentioned
stakeholders in order to develop new applications methods and servicesrdquo
ldquoIn order to increase the intended impact beyond the implementation of the European
Railway Traffic Management System (ERTMS) European Train Control System (ETCS)
standard the [project acronym] consortium will disseminate information about the
projectrsquos objectives activities and results to a wide variety of stakeholders throughout
the Rail and Global Navigation Satellite System (GNSS) sector Beyond those partners
within the consortium and those involved in the research activities this includes
Railway Undertakings Infrastructure Managers GNSS equipment producers and
integrators GNSS services providers Research Centres and sub-system suppliersrdquo
Finally attention to the readiness of the innovation is typically expressed by focusing
on prototyping demonstration and validation The quotes indicate in some places a
close connection between innovation readiness and ecosystem embeddedness which
indicates that the consortium not only considers leaps in readiness but also the
exploitation of such leaps with different groups of customers or stakeholders
Innovation readiness
ldquoThree teams consisting of partner representatives will focus on (i) process prototyping
and demonstration (ii) product prototyping and validation towards safety and market
requirements and (iii) overall demonstration A unique ambition is to involve
particularly SME parties via a Sounding board Group consisting of potential users
(food suppliers food processors and dry product users) as well as food auctioneers
growers associations and retailrdquo
ldquoA Project Exploitation Plan will be developed describing joint and individual partnerrsquos
exploitation strategies The Exploitation Plan will cover potential products competitors
and the technology benchmarks It will describe the [project acronym] market position
and identify the potential market segments as well as specific academic and
commercial strategies to be implementedrdquo
ldquoThe main idea of the project is the finalisation of development industrialization and
commercialisation of the innovative in-wheel motor technology (patent pending)
developed by [participant name] The solution was already validated in real operating
conditions showing a competitive performance with a very positive market-feedbackrdquo
In sum the quotes from the proposal texts show that consortia deliberately use
certain words and short phrases in order to express attention to the four identified
dimensions of innovation impact This not only validates the automated content
26
analysis of the proposals but also holds insights on how these attention foci are
typically described in longer paragraphs of text This allows for a more systematic
identification and evaluation of the likely innovation impact in proposals
Comparison of Call and Proposal Texts
In a next step content analyses using the four cognitive innovation impact dictionaries
are applied to the 38 call texts to which the 233 proposals responded While content
analyses have been applied to call texts before (Olsen et al 2016) it is important to
note the difference in interpretation compared with proposal texts Call texts describe
an abstract research need or ambition not a concrete proposal for addressing it
Hence any content analysis reveals differences in attention paid to various facets of
innovation when expressing a research need or ambition
Table 6 provides an overview of the results from the content analysis using call texts
The 38 call texts contain on average 395 of words relating to technological novelty
271 for market scope 198 to ecosystem embeddedness and 340 to
innovation readiness The averages are consistently higher than for the proposal texts
and the extremes are more pronounced as evidenced by a larger range between
minimum and maximum values
Table 6 Descriptive statistics call texts (n=38)
Variable Mean Std Dev Min Max
Technological novelty 395 198 0 812
Market scope 271 180 0 769
Ecosystem embeddedness 198 133 0 646
Innovation readiness 340 157 074 705
When comparing the indicator averages for call texts with proposal texts call texts
devote comparatively more attention to technological novelty than to innovation
readiness The differential focus of call and proposal texts is further described in
Figure 1 In this figure the indicator scores are normalised to 100 for innovation
readiness Interestingly call texts pay about 16 more attention to technological
novelty than to innovation readiness Both for technological novelty and market scope
the differences between calls and proposals are particularly pronounced The focus on
ecosystem embeddedness is about the same in both calls and proposals These results
indicate that while calls stress technological novelty more than innovation readiness
proposals place much stronger focus on innovation readiness than on technological
novelty Given that Innovation Actions seek to increase the chances that technologies
are commercially exploited through innovation the comparatively higher focus on
novelty than on readiness in call texts seems counterintuitive Then again the
proposals of funded projects do focus on readiness to a much higher extent than on all
other dimensions of innovation impact
27
Figure 1 Comparison of call and proposal text attention foci
However such comparisons of averages may be driven by extreme values and
correlation analysis can provide additional insights In fact correlation analyses reveal
that cognitive innovation impact indicators between calls and proposals are
consistently positively correlated and highly significant (99 levels) The correlation
between attention expressed for technological novelty in call texts and in proposal
texts is 049 for market scope 041 for ecosystem embeddedness 048 and for
innovation readiness 024 While no reference figures for optimal levels of correlation
exist these correlation coefficients indicate quite some congruence between the
attention foci expressed in call and proposal texts It suggests that precisely worded
call texts are important tools for conveying emphasis and preferences of a research
need or ambition providing guidance for consortia and their proposals The call texts
under study achieve this to a lesser degree for innovation readiness
Finally all proposal texts under consideration are positively evaluated and eventually
contracted The positive correlations are also likely to indicate that evaluation
processes perform well in selecting proposals that have a close attention overlap with
the call Larger divergences between call and proposal attention foci are likely to be
found in proposals with lower evaluation scores
Cluster Analysis
The major challenge for cluster analytical techniques is the decision for an appropriate
number of clusters that provides a meaningful segmentation of the projects in the
data but at the same time does not conceal the heterogeneity among the projects
Using the four innovation indicators as cluster variables leads in a first step to two
graphical representations that facilitate the identification of clusters Figure 2 shows
the dendrogram of the clustering process after Wardrsquos method using the Euclidean
distance as distance measure The figure depicts the stepwise agglomeration of
projects to clusters To allow a meaningful interpretation of the clusters the resulting
solution should neither contain too few nor too many clusters (Everitt et al 2011)
Figure 2 turns out to be clearly suggestive of a three-cluster solution that combines
105 Innovation Action projects in the first cluster 64 projects in the second cluster
and 58 projects in the third cluster
0
20
40
60
80
100
120
140
Technological
novelty
Market scope Ecosystem
embeddedness
Innovation
readiness
Call
Proposal
28
Figure 2 Dendrogram of the cluster solution
The appropriateness of a three-cluster solution can be tested by applying the ldquoelbow
criterionrdquo For that purpose Figure 3 shows the sum of squared errors depending on
the number of clusters chosen The ldquoelbowrdquo indicates the point at which a rather large
reduction in the sum of squared errors per additional cluster compares favourably to a
relatively smaller reduction Literature suggests that this point indicates the number of
clusters to be chosen (Ketchen and Shook 1996 Backhaus et al 2008) Figure 3
shows that this is the case with a three-cluster solution
Figure 3 Sum of squared errors depending on the number of clusters
Finally the choice for the number of clusters should be substantiated by applying the
Mojena criterion which in our case also provides support for a three-cluster solution
(Mojena 1977 Everitt et al 2011)
In the next step the three clusters need to be further characterised in order to allow
for a meaningful interpretation Table 7 shows the mean values of the cluster variables
by cluster comparing them to the public procurement projects (PPP) A first glance on
the mean values shows important differences between the three clusters Cluster 1
which also is the cluster containing by far most of the projects scores comparatively
low for all four innovation impact indicators Clusters 2 and 3 each show a distinct
profile with Cluster 2 scoring highly on technological novelty market scope and
0
20
40
60
80
100
120
140
160
180
1 2 3 4 5 6 7 8 9 10 11 12 13 14 15 16 17 18 19 20 21 22 23 24 25 26 27 28 29 30 hellip
29
innovation readiness and Cluster 3 exhibiting high scores for ecosystem
embeddedness and innovation readiness In comparison to the cluster solution of the
Innovation Action projects the public procurement projects score relatively low but
they nevertheless show rather high ecosystem embeddedness It has to be noted
though that these average values are based only on six observations
Table 7 Mean of cluster variables by group
Clusters Obs Technological
novelty
Market scope Ecosystem
embeddedness
Innovation
readiness
Cluster 1 105 146 093 114 208
Cluster 2 64 266 160 119 269
Cluster 3 58 156 147 195 277
PPP 6 175 108 192 184
Total 233 182 125 138 241
To facilitate the interpretation of the cluster solution Figure 4 shows the T-values of
the cluster variables in the cluster solution ie standardised deviations of the
variables within the clusters relative to the overall sample mean The figure confirms
the first assessment of the descriptive statistics of the cluster variables Cluster 1 the
largest cluster with 105 projects shows low values for all four innovation indicators
relative to the sample means of the variables In other words projects in this cluster
exhibit relatively low focus on the four facets of innovation impact in their proposal
texts We label this cluster therefore as ldquoSustainingrdquo ie projects that in their
proposal dedicated modest attention to the four facets of innovation impact to be
achieved through the funding ldquoSustainingrdquo in that sense characterises projects with
an innovation impact likely to be limited and restrained
Cluster 2 shows a noticeably different profile Technological novelty market scope and
innovation readiness are highly pronounced suggesting that projects in this cluster
dedicate high attention to achieving breakthrough technological results which are
intended to help create markets These results should also be rather close to actual
exploitation while the embeddedness into the ecosystem is relatively low Thus we
refer to this cluster as ldquoPioneeringrdquo
Cluster 3 again differs quite substantially from the other two clusters in that it puts
high emphasis on ecosystem embeddedness followed by innovation readiness and
market scope Less attention is dedicated to the technological novelty of the project
Projects in this cluster hence aim at achieving diffusion and exploitation of the
innovative solution within the ecosystem which is why we refer to this cluster as
ldquoDiffusingrdquo
30
Figure 4 T-values of the cluster variables in the cluster solution
Overall and as expected the four cluster variables measuring the cognitive innovation
impact indicators are significantly different across the three clusters as an analysis of
variance (ANOVA) shows
As a next step the three-cluster solution and the group of public procurement projects
will be discussed with regard to the variables available to characterise the projects
Table 8 shows the results The columns contain the mean values of the respective
variables by cluster PPP and overall The final column presents the results of an
analysis of variance (ANOVA) and indicates whether the differences of the variable
means are statistically significant between the four groups (ie the three clusters and
the group of PPP)
Interesting differences emerge First the groups differ vastly in the average size of
the projects In absolute terms ldquoPioneeringrdquo projects turn out to have the highest
requested EC contribution closely followed by ldquoSustainingrdquo projects When it comes to
total project cost ldquoPioneeringrdquo projects show the highest value followed by
ldquoSustainingrdquo projects ldquoDiffusingrdquo projects and PPP are considerably smaller both in
terms of the requested EC contribution and the total project cost These differences
turn out to be statistically significant Comparing the requested contribution with the
total project cost leads to stark differences across the clusters The ratios of requested
contribution to total cost are 73 49 81 and 63 for the three clusters and
PPP respectively In that sense ldquoPioneeringrdquo projects require a rather low share of
budgetary contribution from the EU while dedicating high attention to technological
novelty market scope and innovation readiness In contrast ldquoSustainingrdquo and
ldquoDiffusingrdquo projects require a high share of budgetary contribution with ndash in the case
of ldquoSustainingrdquo projects ndash comparatively low focus all four dimensions of innovation
impact
Looking at the number of participants in the projects we do not find statistically
significant differences between the groups ldquoDiffusingrdquo projects and PPP have fewer
participants which coincides with the lower funding volume With regard to the
institutional composition of the projects we find stark differences between the groups
ldquoSustainingrdquo projects are relatively dominated by higher education institutions while
ldquoPioneeringrdquo projects typically involve relatively more private companies and research
organisations ldquoDiffusingrdquo projects have relatively fewer company participants PPP are
characterised by a strong presence of public bodies in the consortium The number of
SMEs is highest in ldquoPioneeringrdquo projects and lowest in PPP
-10 -05 00 05 10 15
Cluster 3
Cluster 2
Cluster 1
Technological novelty Market scope
Ecosystem embeddedness Innovation readiness
31
Moreover we find that the breadth of participants ie the number of different types
of participants present in the consortium is highest in the group of PPP indicating
high diversity within those projects while it is lowest for ldquoPioneeringrdquo projects
Apparently the planned activities in this group of projects require higher focus and
less institutional diversity Nevertheless projects in this group are characterised by
the highest number of different countries represented in the consortium while PPP
show the lowest diversity with respect to country origin of the participants Finally the
evaluation score does not vary much between the three clusters but turns out to be
considerably lower in the group of PPP
Table 8 Characterisation of the cluster solution
Variables Cluster 1
laquoSustainingraquo
Cluster 2
laquoPioneeringraquo
Cluster 3
laquoDiffusingraquo
PPP Total Sig
Requested EC
contribution (mEUR)
694 707 426 296 621
Total project cost
(mEUR)
946 1442 526 470 965
Number of
participants
1345 1409 1114 883 1293
Number of higher
education
institutions
242 216 231 117 229
Number of private
companies
761 884 503 150 715
Number of public
bodies
075 006 084 267 064
Number of research
organisations
198 256 205 233 217
Number of other
participants
064 044 081 100 064
Number of SMEs 337 431 279 067 342
Participant breadth 311 298 336 383 316
Country breadth 570 609 595 533 586
Evaluation score 1296 1295 1323 1175 1298
Obs 105 64 58 6 233
p lt 010 p lt 005 p lt 001
5 DISCUSSION AND IMPLICATIONS
This study makes two primary contributions to the assessment of likely innovation
impact within a certain subset of Horizon 2020 based on the exploratory analysis of
the proposals First it systematically establishes cognitive innovation impact indicators
which connect heterogeneity in innovation impact with differences in the attention that
consortia pay to particular innovation aspects Four central pillars for innovation
impact are related to cognitive processes and the allocation of attention Second this
study advances the measurement of cognitive innovation impact indicators by
applying content analyses and condensing the results through cluster analyses
Implications can be derived for both the funding instruments under study and for the
methodological development of innovation impact indicators
Implications for the Funding Instruments under Study
Horizon 2020 features the Innovation Action and innovation procurement instruments
in order to play a prominent role in bridging discovery with market application stages
and thus in helping to increase growth and employment in Europe (European
32
Commission 2014a) Yet a major challenge for the effective allocation of funding in
this respect is to verify whether these instruments actually deliver on innovation or
rather seek to primarily support research activities without the desired pronounced
focus on the commercial exploitation of innovation Since the projects under study
have only recently been started addressing this challenge within the scope of this
study necessarily remains incomplete However the results presented in this study
based on the analysis of the proposal texts allow to draw several conclusions
Within the conceptualisation of cognitive innovation impact any proposal text
represents the sum of the attention of the consortium (space considerations enforcing
priority setting) Consortia are heterogeneous in the degree to which they dedicate
attention to particular aspects ie divide the pie of overall attention Projects
focussing on research activities rather than on the commercial exploitation of
innovation can be expected to be dominated by considerations for technological
novelty Then again it would be unreasonable to assume little to no attention to
technological novelty in proposals directed at innovation Almost all innovation and
PPP call texts use technological novelty at least as a starting point and all proposals
contain indications of technological novelty That said the average proposal pays
roughly 33 more attention to innovation readiness than to technological novelty
Taking attention to readiness embeddedness and market scope together consortia
dedicate on average almost three times as much attention to the commercialisation of
technologies compared with describing technological novelty These results cannot rule
out that individual innovation proposals may be research projects in disguise
However this study finds little evidence in the large scale analysis that such concerns
can be generalised
Apart from these general considerations the following key insights can be derived
from the analyses
A cluster of proposals containing ldquoPioneeringrdquo project consortia can be identified
which pay comparatively more attention to achieving ambitious innovation
impact vis-agrave-vis the goals of Horizon 2020 Consortia are significantly more likely
to allocate their attention accordingly with increasing participation of private
firms including SMEs It is noteworthy that projects in this cluster combine
attention to technological novelty and market creation (market scope)
ldquoPioneeringrdquo consortia apparently require a combination of technological novelty
and market scope instead of an isolated pursuit of market scope in the absence
of technological novelty This suggests that the identification of innovation that is
potentially market creating requires careful assessment of the underlying
technology and its novelty
Another cluster of proposals containing ldquoDiffusingrdquo project consortia can be
identified with dedicated attention to diffusing innovation based on a broad
representation of the innovationrsquos ecosystem and its readiness Within the
ambition of Horizon 2020 for bridging discovery and market application these
consortia are clearly more specialised for the latter stages and can have an
important contribution for achieving market success
In the two clusters containing ldquoPioneeringrdquo and ldquoDiffusingrdquo projects attention to
market scope and innovation readiness are closely linked While projects in the
former cluster attach higher attention to technological novelty projects in the
latter cluster stress ecosystem embeddedness The joint occurrence of emphasis
on market scope and innovation readiness in an overall large number of projects
suggests that market creation requires a leap forward in the readiness of the
underlying innovation
33
A substantial share of Innovation Action projects can be characterised as
ldquoSustainingrdquo Project proposals in this cluster contain only modest focus on the
four innovation impact indicators That in turn indicates low ambition to increase
the chances that technologies will be successfully commercialised It is striking
that ldquoSustainingrdquo projects constitute the largest group of projects Nevertheless
the analysis only includes consortia that received funding It is therefore not
possible to compare ldquoSustainingrdquo projects with those proposals that did not
receive funding Within the context of this study ldquoSustainingrdquo projects should
therefore be considered as a baseline reference group for ldquoPioneeringrdquo and
ldquoDiffusingrdquo cluster proposals
With the caveat of the limited number of PPP proposals analysed in this study
they share many attention allocation similarities with Innovation Actions
However the attention devoted to innovation readiness is comparatively lower
There is a risk that PPP currently do not allocate enough attention to the broader
market application of innovation beyond public procurement
Overall the comparatively low scores for market scope across all projects under
study in comparison to the other cognitive innovation impact indicators suggest
that based on the content of the proposals the current schemes are not geared
towards supporting market creating innovation Then again the creation of new
markets is difficult to describe ex-ante as market creation largely depends on
product markets and demand conditions that are hard to predict in detail ex-ante
because market research techniques can only be applied to existing markets
Attention allocation expressed in call texts largely guides the attention allocation
of consortia in proposal texts andor evaluators However despite being
Innovation Actions call texts put comparatively higher emphasis on
technological novelty than on market scope ecosystem embeddedness and
innovation readiness although the latter three indicators are particularly
associated with the commercial exploitation of innovation
Implications for Innovation Indicators
No single innovation impact indicator is per se superior to others The cognitive
innovation impact indicators proposed in this study can alleviate some of the
weaknesses of more traditional approaches Ideally evaluations combine multiple
indicators such as cognitive innovation impact indicators based on content analysis
combined with a continuous monitoring through surveys as in the Innovation Radar
(De Prato et al 2015) Cross-validation of indicators for a selected set of proposals
has the largest potential for obtaining reliable sets of indicators Table 9 provides an
overview of the strengths and weaknesses of different innovation indicators
The cognitive innovation impact indicators proposed in this study allow an early
assessment of the likely innovation impact of the proposals even before they are
actually funded They build on the assumption that the participants in a consortium
have to devise a joint approach for solving an innovation problem in order to
successfully exploit the project outcome This joint approach requires the consortium
to allocate attention to areas related to innovation impact Due to limited attention
and resources consortia have to prioritise Cognitive innovation impact indicators are
based on the idea that the allocation of attention and the prioritisation of resources as
described in the proposal will be carried through during the term of the project
leading to higher or lower innovation impact along the four dimensions identified
The analysis presented in this study does not allow qualifying one of the four cognitive
innovation impact indicators as more important than the others in its overall
contribution towards innovation impact Rather the theoretical reasoning and
empirical analysis suggest that consortia need to reflect on all four indicators in their
34
proposals in order to increase the chances for successful innovation Each indicator
reflects a distinct dimension of innovation impact and a dedicated allocation of
attention to these four dimensions can be assumed to translate into focus on
innovation impact while actually carrying out the planned activities in the project
While it is still too early to conclude whether the articulated focus on innovation in the
projects will materialise the four indicators allow an eye on the extent Horizon 2020
will deliver on innovation
This study proposes four indicators to measure the extent to which Horizon 2020 will
deliver on innovation in the short medium and longer term These indicators focus on
innovation instead of research impact by connecting the attention for technological
novelty with attention to product market considerations for commercialisation ie
market scope ecosystem embeddedness as well as innovation readiness On average
the studied project proposals devote almost three times as much attention to the
latter issues compared with technological novelty Such systematic quantifications of
attention allocation across large numbers of project proposals are a unique advantage
of content analyses While this allocation of attention cannot be directly translated into
consortia budget provisions and market outcomes the large share of attention
devoted to commercialisation provides confidence that Horizon 2020 will have
important innovation outcomes in the short and medium term Especially the attention
that ldquoPioneeringrdquo and ldquoDiffusingrdquo project consortia devote to innovation readiness
suggests that impact is likely to occur rather sooner than later Projects in these
clusters comprise the majority of innovation projects under consideration Long term
consequences cannot be credibly predicted based on attention allocation at any given
point in time since attention is likely to be re-allocated based on experience and
feedback eg through customer responses or competitor behaviour Potential future
studies could draw on both cognitive and other types of innovation indicators (ie
survey-based qualitative and quantitative) to verify the findings of this report and
assess potential long-term consequences In relative terms public procurement
projects allocate less attention to innovation readiness With the caveat of small
sample size for these projects in mind it is comparatively less likely that they will
contribute to the innovation goals of Horizon 2020 in the short term
Finally a cross-check of the proposed indicators of this study with the evaluation
criteria of projects within the relevant schemes provides confidence in the selection of
projects First all projects fulfil at least a minimum level of attention to technological
novelty market scope ecosystem embeddedness as well as innovation readiness
Second the allocation of attention to these four indicators expressed in project
proposals correlates positively and significantly with the attention expressed in the
respective call Hence a cognitive transfer of attention priorities from call texts to
funded consortia has successfully occurred Finally there is no systematic evidence
that innovation project proposals are research proposals in disguise since
technological novelty does not dominate proposal attention Given that this study
analyses exclusively granted project proposals it is equally likely that such proposals
have not been submitted or that evaluators have performed their duties well and
ranked them low In both cases the purpose of the grant scheme would have been
accomplished
35
Table 9 Overview of strengths and weaknesses of different innovation indicators
Cognitive innovation impact
indicators
Survey-based innovation
impact indicators
Quantitative innovation
impact indicators (eg
publications patents)
Qualitative innovation impact
indicators (eg case studies)
Strengths Non-intrusive administration
Large scale application
Applicable and observable for
unsuccessful consortia
Systematic and replicable
Short processing time and
availability
Quantitative results
Benchmarking
Comparison over time
Cross-country comparisons
Quantitative results
Benchmarking
Comparison over time
Cross-country comparisons
Comparable quality
standards
Deep context-specific
insights
Tailored to innovation
Comprehensive set of
impacts eg societal
Weaknesses Expressed intention may not
be followed by action
Professional grant
consultants eliminate
heterogeneity
Vulnerable to confirmation
bias
Potential for ex-post
rationalisation
Administrative effort for
innovators
Costs for surveying
sampling
Survival bias
Limited to selected outcomes
Limited to selected sectors
and industries
Potentially long time delay
Time and cost intensive
Important selection biases
Significant efforts from
innovators
Potential for ex-post
rationalization
Potential for conformity
biases
36
REFERENCES
Abernathy WJ and KB Clark (1985) Innovation Mapping the Winds of Creative
Destruction Research Policy 14 (1) 3-22
Adner R (2006) Match Your Innovation Strategy to Your Innovation Ecosystem
Harvard Business Review 84 (4) 98-107
Adner R (2017) Ecosystem as Structure an Actionable Construct for Strategy
Journal of Management 43 (1) 39-58
Adner R and R Kapoor (2010) Value Creation in Innovation Ecosystems How the
Structure of Technological Interdependence Affects Firm Performance in New
Technology Generations Strategic Management Journal 31 (3) 306-333
Amit R and C Zott (2001) Value Creation in E-Business Strategic Management
Journal 22 (6-7) 493-520
Backhaus K B Erichson W Plinke and R Weiber (2008) Multivariate
Analysemethoden Eine Anwendungsbezogene Einfuumlhrung Berlin
Barr PS (1998) Adapting to Unfamiliar Environmental Events A Look at the
Evolution of Interpretation and Its Role in Strategic Change Organization Science 9
(6) 644-669
Brown SL and KM Eisenhardt (1995) Product Development Past Research
Present Findings and Future Directions Academy of Management Review 20 (2)
343-378
Chandy RK and GJ Tellis (2000) The Incumbentrsquos Curse Incumbency Size and
Radical Product Innovation Journal of Marketing 64 (3) 1-17
Charitou CD and CC Markides (2002) Responses to Disruptive Strategic
Innovation MIT Sloan Management Review 44 (2) 55-64
Chesbrough HW (2003) The Era of Open Innovation MIT Sloan Management
Review 44 (3) 35-41
Chiesa V and F Frattini (2011) Commercializing Technological Innovation Learning
from Failures in High-Tech Markets Journal of Product Innovation Management 28
(4) 437-454
Cho TS and DC Hambrick (2006) Attention as the Mediator between Top
Management Team Characteristics and Strategic Change The Case of Airline
Deregulation Organization Science 17 (4) 453-469
Christensen CM and JL Bower (1996) Customer Power Strategic Investment and
the Failure of Leading Firms Strategic Management Journal 17 (3) 197-218
Christensen CM M Raynor and R McDonald (2015) What Is Disruptive
Innovation Harvard Business Review 93 (12) 44-53
Clarkson ME (1995) A Stakeholder Framework for Analyzing and Evaluating
Corporate Social Performance Academy of Management Review 20 (1) 92-117
Darroch J and MP Miles (2011) A Research Note on Market Creation in the
Pharmaceutical Industry Journal of Business Research 64 (7) 723-727
Davis JP (2016) The Group Dynamics of Interorganizational Relationships
Collaborating with Multiple Partners in Innovation Ecosystems Administrative
Science Quarterly 61 (4) 621-661
De Coster R and C Butler (2005) Assessment of Proposals for New Technology
Ventures in the Uk Characteristics of University Spin-Off Companies Technovation
25 (5) 535-543
De Prato G D Nepelski and G Piroli (2015) Innovation Radar Identifying
Innovations and Innovators with High Potential in Ict Fp7 Cip amp H2020 Projects
JRC Scientific and Policy Reports ndash EUR 27314 EN Seville JRC-IPTS No
Dewar RD and JE Dutton (1986) The Adoption of Radical and Incremental
Innovations An Empirical Analysis Management Science 32 (11) 1422-1433
Duriau VJ RK Reger and MD Pfarrer (2007) A Content Analysis of the Content
Analysis Literature in Organization Studies Research Themes Data Sources and
Methodological Refinements Organizational Research Methods 10 (1) 5-34
37
Eggers JP and S Kaplan (2009) Cognition and Renewal Comparing Ceo and
Organizational Effects on Incumbent Adaptation to Technical Change Organization
Science 20 (2) 461-477
Ettlie JE (1983) Organizational Policy and Innovation among Suppliers to the Food
Processing Sector Academy of Management Journal 26 (1) 27-44
European Commission (2010) Europe 2020 A Strategy for Smart Sustainable and
Inclusive Growth No COM(2010) 2020 final
European Commission (2012) The Grand Challenge The Design and Societal Impact
of Horizon 2020 Brussels
European Commission (2014a) Horizon 2020 in Brief The Eu Framework Programme
for Research amp Innovation Brussels
European Commission (2014b) Technology Readiness Levels (Trl) HORIZON 2020 ndash
Work Programme 2014-2015 General Annexes Extract from Part 19 No
Commission Decision C(2014)4995 Brussels
European Commission (2015a) The Contribution of the Framework Programme to
Major Innovations Brussels
European Commission (2015b) Horizon 2020 Output Indicators Assessing the Results
and Impact of Horizon 2020 Brussels
European Commission (2016) Horizon 2020 Monitoring Report 2015 No
httpseceuropaeuresearchevaluationspdfarchiveh2020_monitoring_reportss
econd_h2020_annual_monitoring_reportpdfview=fitamppagemode=none Brussels
Everitt BS S Landau M Leese and D Stahl (2011) Cluster Analysis New York
Fisher ML (1997) What Is the Right Supply Chain for Your Product Harvard
Business Review 75 (2) 105-116
Gatignon H ML Tushman W Smith and P Anderson (2002) A Structural Approach
to Assessing Innovation Construct Development of Innovation Locus Type and
Characteristics Management Science 48 (9) 1103-1122
Gemuumlnden HG T Ritter and P Heydebreck (1996) Network Configuration and
Innovation Success An Empirical Analysis in German High-Tech Industries
International Journal of Research in Marketing 13 (5) 449-462
Gilbert C (2003) The Disruption Opportunity MIT Sloan Management Review 44 (4)
27-33
Govindarajan V and PK Kopalle (2006) Disruptiveness of Innovations
Measurement and an Assessment of Reliability and Validity Strategic Management
Journal 27 (2) 189-199
Grimpe C and W Sofka (2009) Search Patterns and Absorptive Capacity Low-and
High-Technology Sectors in European Countries Research Policy 38 (3) 495-506
Hamel G and CK Prahalad (1991) Corporate Imagination and Expeditionary
Marketing Harvard Business Review 69 (4) 81-92
Hart S E Jan Hultink N Tzokas and HR Commandeur (2003) Industrial
Companies Evaluation Criteria in New Product Development Gates Journal of
Product Innovation Management 20 (1) 22-36
Hultink EJ A Griffin S Hart and HSJ Robben (1997) Industrial New Product
Launch Strategies and Product Development Performance Journal of Product
Innovation Management 14 (4) 243-257
Kaplan S (2011) Research in Cognition and Strategy Reflections on Two Decades of
Progress and a Look to the Future Journal of Management Studies 48 (3) 665-
695
Kaplan S F Murray and R Henderson (2003) Discontinuities and Senior
Management Assessing the Role of Recognition in Pharmaceutical Firm Response
to Biotechnology Industrial and Corporate Change 12 (2) 203-233
Ketchen DJ and CL Shook (1996) The Application of Cluster Analysis in Strategic
Management Research An Analysis and Critique Strategic Management Journal 17
441-458
Kim WC and R Mauborgne (1999) Creating New Market Space Harvard Business
Review 77 (1) 83-93
Kim WC and R Mauborgne (2005) Blue Ocean Strategy From Theory to Practice
California Management Review 47 (3) 105-121
38
Kim WC and R Mauborgne (2015) Red Ocean Traps Harvard Business Review 93
(3) 68-73
Koumlhler C W Sofka and C Grimpe (2012) Selective Search Sectoral Patterns and
the Impact on Product Innovation Performance Research Policy 41 (8) 1344-1356
Krippendorff K (2004) Content Analysis An Introduction to Its Methodology
Thousand Oaks CA
Krishnan V and KT Ulrich (2001) Product Development Decisions A Review of the
Literature Management Science 47 (1) 1-21
Laursen K and A Salter (2006) Open for Innovation The Role of Openness in
Explaining Innovation Performance among Uk Manufacturing Firms Strategic
Management Journal 27 (2) 131-150
Leveacuten P J Holmstroumlm and L Mathiassen (2014) Managing Research and Innovation
Networks Evidence from a Government Sponsored Cross-Industry Program
Research Policy 43 (1) 156-168
Lindič J M Bavdaž and H Kovačič (2012) Higher Growth through the Blue Ocean
Strategy Implications for Economic Policy Research Policy 41 (5) 928-938
Milligan GW and MC Cooper (1987) Methodology Review Clustering Methods
Applied Psychological Measurement 11 (4) 329-354
Mojena R (1977) Hierarchical Grouping Methods and Stopping Rules An Evaluation
The Computer Journal 20 (4) 359-363
Montoya-Weiss MM and R Calantone (1994) Determinants of New Product
Performance A Review and Meta-Analysis Journal of Product Innovation
Management 11 (5) 397-417
Nadkarni S and PS Barr (2008) Environmental Context Managerial Cognition and
Strategic Action An Integrated View Strategic Management Journal 29 (13) 1395-
1427
Neuendorf KA (2002) The Content Analysis Guidebook Thousand Oaks CA
OConnor GC (2008) Major Innovation as a Dynamic Capability A Systems
Approach Journal of Product Innovation Management 25 (4) 313-330
OConnor GC and R DeMartino (2006) Organizing for Radical Innovation An
Exploratory Study of the Structural Aspects of Ri Management Systems in Large
Established Firms Journal of Product Innovation Management 23 (6) 475-497
Ocasio W (1997) Towards an Attention-Based View of the Firm Strategic
Management Journal 18 (S1) 187-206
Olsen A W Sofka and C Grimpe (2016) Coordinated Exploration for Grand
Challenges The Role of Advocacy Groups in Search Consortia Academy of
Management Journal
Pisano GP and DJ Teece (2007) How to Capture Value from Innovation Shaping
Intellectual Property and Industry Architecture California Management Review 50
(1) 278-296
Powell WW KW Koput and L Smith-Doerr (1996) Interorganizational
Collaboration and the Locus of Innovation Networks of Learning in Biotechnology
Administrative Science Quarterly 41 (1) 116-145
Scheibler D and W Schneider (1985) Monte Carlo Tests of the Accuracy of Cluster
Analysis Algorithms A Comparison of Hierarchical and Nonhierarchical Methods
Multivariate Behavioral Research 20 (3) 283-304
Schilling MA (2016) Strategic Management of Technological Innovation New York
Subramaniam M and MA Youndt (2005) The Influence of Intellectual Capital on the
Types of Innovative Capabilities Academy of Management Journal 48 (3) 450-463
Talke K and EJ Hultink (2010) Managing Diffusion Barriers When Launching New
Products Journal of Product Innovation Management 27 (4) 537-553
Teece DJ (1986) Profiting from Technological Innovation Implications for
Integration Collaboration Licensing and Public Policy Research Policy 15 (6) 285-
305
Teece DJ (2006) Reflections on ldquoProfiting from Innovationrdquo Research Policy 35 (8)
1131-1146
39
Teece DJ (2007) Explicating Dynamic Capabilities The Nature and Microfoundations
of (Sustainable) Enterprise Performance Strategic Management Journal 28 (13)
1319-1350
Terwiesch C and RE Bohn (2001) Learning and Process Improvement During
Production Ramp-Up International Journal of Production Economics 70 (1) 1-19
Thomke SH (1998) Managing Experimentation in the Design of New Products
Management Science 44 (6) 743-762
Vergne J-P (2012) Stigmatized Categories and Public Disapproval of Organizations
A Mixed-Methods Study of the Global Arms Industry 1996ndash2007 Academy of
Management Journal 55 (5) 1027-1052
Vorhies DW and NA Morgan (2003) A Configuration Theory Assessment of
Marketing Organization Fit with Business Strategy and Its Relationship with
Marketing Performance Journal of Marketing 67 (1) 100-115
Vorhies DW and NA Morgan (2005) Benchmarking Marketing Capabilities for
Sustainable Competitive Advantage Journal of Marketing 69 (1) 80-94
Vorhies DW RE Morgan and CW Autry (2009) Product‐Market Strategy and the
Marketing Capabilities of the Firm Impact on Market Effectiveness and Cash Flow
Performance Strategic Management Journal 30 (12) 1310-1334
Ward JH (1963) Hierarchical Grouping to Optimize an Objective Function Journal of
the American Statistical Association 58 (301) 236-244
Zott C R Amit and L Massa (2011) The Business Model Recent Developments and
Future Research Journal of Management 37 (4) 1019-1042
40
APPENDIX
DICTIONARY TECHNOLOGICAL NOVELTY
Word stems and phrases
advan highly efficient solution
breakthrough improv solv
chang innovati step
combin invent substantial
compared to state of the art leading superior
compared to state-of-the-art major sustainable
compared to the state of the art new technolog
compared to the state-of-the-art novel than state of the art
disrupt optimis than state-of-the-art
enhanc optimiz than the state of the art
first of a kind patent than the state-of-the-art
first of its kind process transformat
first-of-a-kind product ultra
first-of-its-kind progressiv world leading
fundamental radical world-leading
high yield revolution
high-yield significan Note indicates all possible word endings
DICTIONARY MARKET SCOPE
Word stems and phrases
addition disrupt product
applica end-user redefin
augment enduser replac
challeng entry revenue
client industry scop
competit internat segment
complement introduc substitut
consumer mainstream transform
customer market turnover
demand niche user
differentiat pioneer Note indicates all possible word endings
41
DICTIONARY ECOSYSTEM EMBEDDEDNESS
Word stems and phrases
accept ecosystem public
bridg engag relation
bring together environment resell
bringing together exchang shared
citizen feedback social
civil holistic societ
cluster inclus socio-economic
co-operat inter-sectoral socioeconomic
collabor interact spill-over
communit interdisciplinar spillover
complement intermediar stakeholder
consult involv supplier
consumer joined supply chain
cooperat joint transfer
cross-sectoral licens universit
customer networking user
distribut participat
eco-system partner Note indicates all possible word endings
DICTIONARY INNOVATION READINESS
Word stems and phrases
accelerat feasibilit readiness
adapt financ ready
advertis fund return on investment
appl incubat roi
approv intellectual propert roll out
assess invest sales
benchmark ip scale up
brand launch scale-up
business model loan scaling up
business plan manufactur scaling-up
certificat market research standard
commerciali market share start up
communication strategy marketing start-up
competitiveness matur startup
consumer patent supply chain
copyright pilot test
customer pric tool
demonstrat private equity trademark
deploy production update
disseminat promoti user
distribut proof validat
entrepreneur protecti value proposition
exploit prototyp viab Note indicates all possible word endings
HOW TO OBTAIN EU PUBLICATIONS
Free publications
bull one copy
via EU Bookshop (httpbookshopeuropaeu)
bull more than one copy or postersmaps
from the European Unionrsquos representations (httpeceuropaeurepresent_enhtm)
from the delegations in non-EU countries
(httpeeaseuropaeudelegationsindex_enhtm)
by contacting the Europe Direct service (httpeuropaeueuropedirectindex_enhtm)
or calling 00 800 6 7 8 9 10 11 (freephone number from anywhere in the EU) () () The information given is free as are most calls (though some operators phone boxes or hotels may charge you)
Priced publications
bull via EU Bookshop (httpbookshopeuropaeu)
Priced subscriptions
bull via one of the sales agents of the Publications Office of the European Union
(httppublicationseuropaeuothersagentsindex_enhtm)
doi 102777610808
KI-N
A-2
8-5
32-E
N-N
Innovation actions were introduced in Horizon 2020 to help bringing discoveries to the market Most of them demonstrate the application of new knowledge in real-life conditions The very first projects started in 2014 and it still is too early for them to produce final results but a short study was commissioned to look into the projects based on proposal texts (Grimpe C et al Study on Innovation in Horizon 2020 Projects EC) For this study 227 Innovation Actions and six innovation
procurement actions were selected that started in 2015 most of them in the PPPs such as Ecsel Clean Sky Factories of the Future Energy Efficient Buildings Clean Vehicle but also in other calls (FTI ICT NMP environmental technologies Galileo and others) The texts of the granted projects were analysed using content analysis methodology based on keywords that indicate four innovation aspects technological novelty market scope ecosystem embeddedness and innovation readiness
The projects were grouped in three categories 64 out of the 227 innovation actions score high on
technological novelty market scope and innovation readiness but low on ecosystem embeddedness These are called pioneering projects They seem to focus on breakthrough technological results that may create markets To the contrary another 58 innovation actions emphasise ecosystem embeddedness and score lower on the other three aspects These are called diffusing projects that aim at diffusion and exploitation of the innovative solution in the ecosystem The remaining 105 innovation actions pay only modest attention to each of the four
aspects These are called sustaining projects The composition of the consortia differs pioneering projects involve relatively more private companies esp SMEs and research institutions The diffusing projects have less companies and more public bodies The sustaining projects are
dominated by higher education institutions It is still too early to characterise these innovation actions and their impacts but these initial findings indicate that a quarter have a disruptive market-creating potential and that companies and research institutions play a leading role in these initiatives
The six innovation procurement projects share many attention allocation similarities with the innovation actions However the attention devoted to innovation readiness and market scope is comparatively lower There is a risk that these projects do not allocate enough attention to the broader market application of innovation beyond public procurement
These conclusions are based on the texts of the projects at their start The results of the projects are expected in 2018-2019
Studies and reports
[Ca
talo
gu
e n
um
be
r]
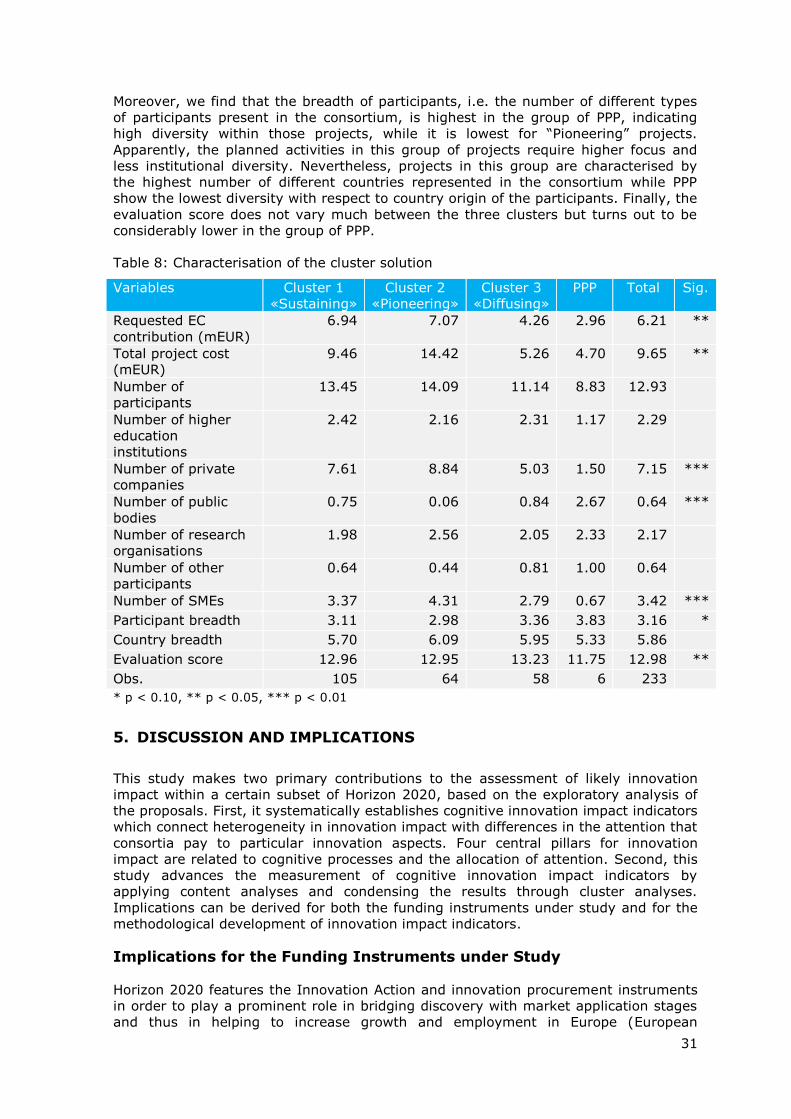
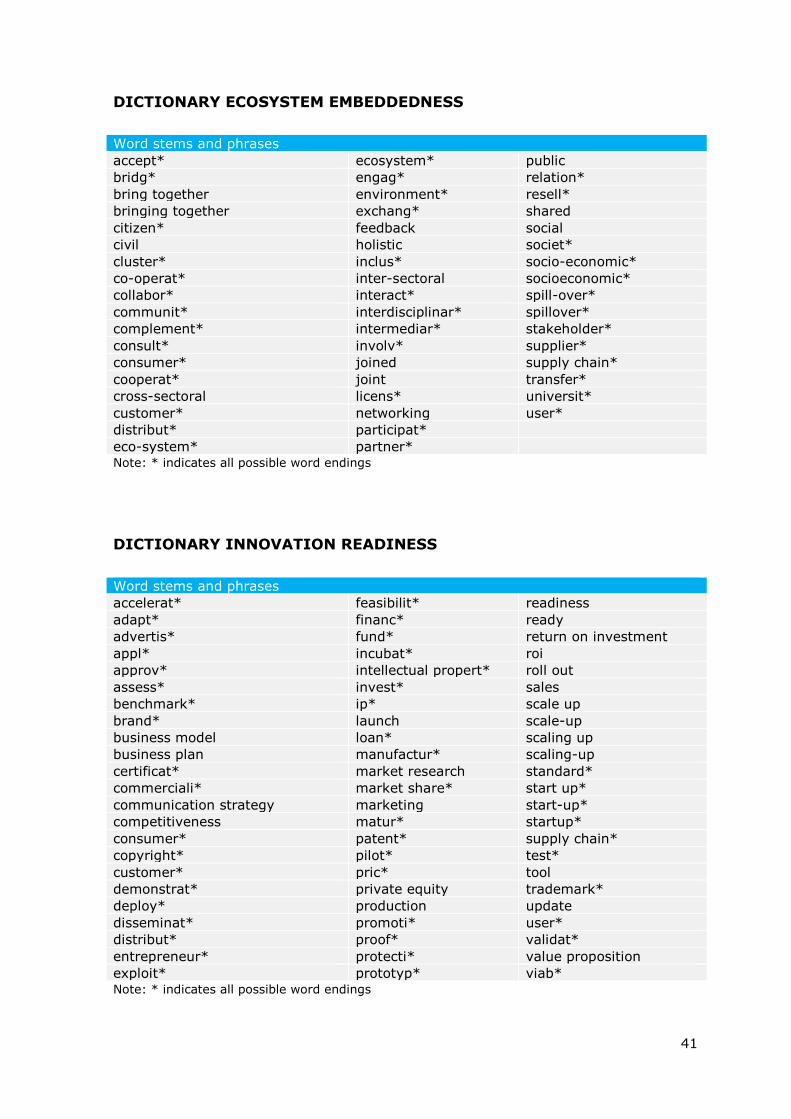