Embed Size (px)
Citation preview

i
THESIS – MN142532
STUDY ON CAPACITY IMPROVEMENT OF A
SHIPYARD IN MYANMAR: A CASE STUDY OF
“DALLA” SHIPYARD
AUNG YE KYAW
4114203701
SUPERVISORS
Prof. Ir. Djauhar Manfaat, M.Sc., Ph.D.
NIP. 19601202 198701 1 001
Prof. Dr. Ir. Buana Ma’ruf, M.Sc., MM
NIP. 19611015 198703 1 003
MASTER PROGRAM
DEPARTMENT OF MARINE RODUCTION AND MATERIAL ENGINEERING
FACULTY OF MARINE TECHNOLOGY
SEPULUH NOPEMBER INSTITUTE OF TECHNOLOGY
SURABAYA
2016

ii
THESIS – MN142532
STUDY ON CAPACITY IMPROVEMENT OF A
SHIPYARD IN MYANMAR: A CASE STUDY OF
“DALLA” SHIPYARD
AUNG YE KYAW
4114203701
SUPERVISORS
Prof. Ir. Djauhar Manfaat, M.Sc., Ph.D.
NIP. 19601202 198701 1 001
Prof. Dr. Ir. Buana Ma’ruf, M.Sc., MM
NIP. 19611015 198703 1 003
MASTER PROGRAM
DEPARTMENT OF MARINE PRODUCTION AND MATERIAL ENGINEERING
FACULTY OF MARINE TECHNOLOGY
SEPULUH NOPEMBER INSTITUTE OF TECHNOLOGY
SURABAYA
2016

iii
THESIS – MN142532
STUDY ON CAPACITY IMPROVEMENT OF A
SHIPYARD IN MYANMAR: A CASE STUDY OF
“DALLA” SHIPYARD
AUNG YE KYAW
4114203701
SUPERVISORS
Prof. Ir. Djauhar Manfaat, M.Sc., Ph.D.
NIP. 19601202 198701 1 001
Prof. Dr. Ir. Buana Ma’ruf, M.Sc., MM
NIP. 19611015 198703 1 003
MASTER PROGRAM
DEPARTMENT OF MARINE PRODUCTION AND MATERIAL ENGINEERING
FACULTY OF MARINE TECHNOLOGY
SEPULUH NOPEMBER INSTITUTE OF TECHNOLOGY
SURABAYA
2016

iv
“This page intentionally left blank”

vi
“This page intentionally left blank”

vii
ACKNOWLEDGEMENTS
First of all, I would like to thank Kemitraan Negara Berkembang (KNB)
scholarship and Ministry of Transport and Communication of Myanmar for their
support to study at Institut Teknologi Sepuluh Nopember.
I wish to express my sincere gratitude to my supervisor, Prof. Ir. Djauhar
Manfaat, M.Sc., Ph.D., Department of Naval Architecture, who suggested the field for
the present study and has been main sources of guidance. His helpfulness and
guidance were critical for developing this thesis from beginning to the end.
I am deeply indebted to my co-supervisor, Prof. Dr. Ir. Buana Ma’ruf, M.Sc.,
MM, Researcher in Marine Technology at BPPT, for his valuable help, guidance and
encouragement for this study.
I would like to express my gratitude to my examiners Dr. Ir. I Ketut Suastika,
M.Sc.and Aries Sulisetyono, ST, M.Sc., Ph.D., for their contributions and suggestions
to succeed this thesis. I am also thankful to all professors, lecturers, staffs and my
friends from Naval Architecture department for their valuable teaching and
cooperation during tenure of my study at ITS.
Finally, my deepest gratitude is extended to my parents, my brothers, my sister,
my friends and officers from Dalla shipyard for their encouragement and support to
complete this study.
Surabaya, 2 August 2016
Aung Ye Kyaw

viii
“This page intentionally left blank”
ix
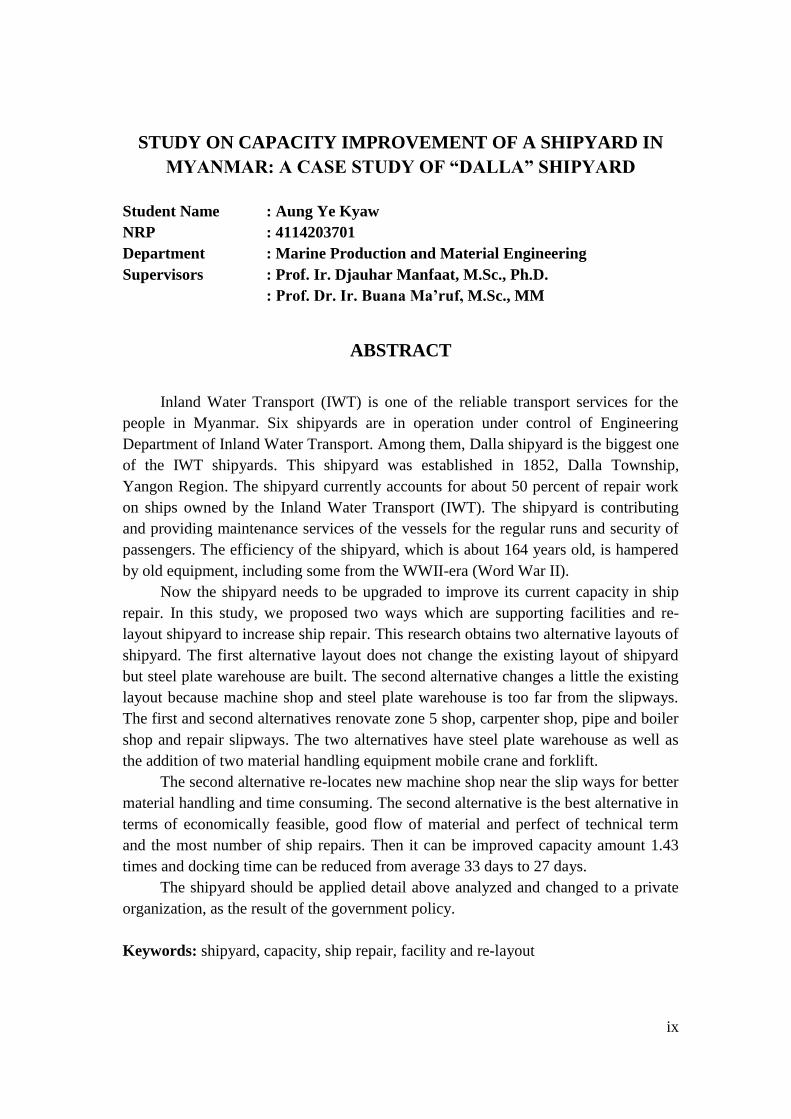
STUDY ON CAPACITY IMPROVEMENT OF A SHIPYARD IN
MYANMAR: A CASE STUDY OF “DALLA” SHIPYARD
Student Name : Aung Ye Kyaw
NRP : 4114203701
Department : Marine Production and Material Engineering
Supervisors : Prof. Ir. Djauhar Manfaat, M.Sc., Ph.D.
: Prof. Dr. Ir. Buana Ma’ruf, M.Sc., MM
ABSTRACT
Inland Water Transport (IWT) is one of the reliable transport services for the
people in Myanmar. Six shipyards are in operation under control of Engineering
Department of Inland Water Transport. Among them, Dalla shipyard is the biggest one
of the IWT shipyards. This shipyard was established in 1852, Dalla Township,
Yangon Region. The shipyard currently accounts for about 50 percent of repair work
on ships owned by the Inland Water Transport (IWT). The shipyard is contributing
and providing maintenance services of the vessels for the regular runs and security of
passengers. The efficiency of the shipyard, which is about 164 years old, is hampered
by old equipment, including some from the WWII-era (Word War II).
Now the shipyard needs to be upgraded to improve its current capacity in ship
repair. In this study, we proposed two ways which are supporting facilities and re-
layout shipyard to increase ship repair. This research obtains two alternative layouts of
shipyard. The first alternative layout does not change the existing layout of shipyard
but steel plate warehouse are built. The second alternative changes a little the existing
layout because machine shop and steel plate warehouse is too far from the slipways.
The first and second alternatives renovate zone 5 shop, carpenter shop, pipe and boiler
shop and repair slipways. The two alternatives have steel plate warehouse as well as
the addition of two material handling equipment mobile crane and forklift.
The second alternative re-locates new machine shop near the slip ways for better
material handling and time consuming. The second alternative is the best alternative in
terms of economically feasible, good flow of material and perfect of technical term
and the most number of ship repairs. Then it can be improved capacity amount 1.43
times and docking time can be reduced from average 33 days to 27 days.
The shipyard should be applied detail above analyzed and changed to a private
organization, as the result of the government policy.
Keywords: shipyard, capacity, ship repair, facility and re-layout

x
“This page intentionally left blank”

xi
TABLE OF CONTENTS
THESIS CONFIRMATION SHEET .................................................................... v
ACKNOWLEDGEMENTS ................................................................................ vii
ABSTRACT ......................................................................................................... ix
TABLE OF CONTENTS ..................................................................................... xi
LIST OF FIGURES ............................................................................................. xv
LIST OF TABLES ............................................................................................ xvii
CHAPTER 1 .......................................................................................................... 1
INTRODUCTION ................................................................................................. 1
1.1. Background ............................................................................................. 1
1.2. Statement of the Problem ........................................................................ 3
1.3. Research Question .................................................................................. 4
1.4. Research Objectives ................................................................................ 4
1.5. The Scope of Work ................................................................................. 4
1.6. Benefits ................................................................................................... 5
CHAPTER 2 .......................................................................................................... 7
LITERATURE REVIEW ...................................................................................... 7
2.1 Dalla Shipyard ............................................................................................ 7
2.2 Functions of Shipyard................................................................................. 8
2.3 Market Opportunity .................................................................................... 9
2.3.1 Target Order ...................................................................................... 10
2.4 Layout ....................................................................................................... 11
2.4.1 Layout of Dalla Shipyard .................................................................. 11
2.4.2 Facilities of Dalla Shipyard .............................................................. 14
2.5 Organization Structure of Shipyard .......................................................... 16
2.7 Cooperation .............................................................................................. 17
2.9 Shipyard .................................................................................................... 19

xii
2.9.1. Types of shipyard ............................................................................. 19
2.9.2. Shipbuilding Process ........................................................................ 20
2.10 Types of Dry Dock ................................................................................. 21
2.10.1. Basin or Graving docks .................................................................. 21
2.10.2 Floating Dry Dock .......................................................................... 22
2.10.3. Marine Railways ............................................................................ 23
2.10.4. Vertical Lifts .................................................................................. 24
2.10.5 Marine Travel Lifts ......................................................................... 25
2.11 Shipyard Facility ..................................................................................... 25
2.12. Organization. .......................................................................................... 26
2.12.1 Management Approach ................................................................... 27
2.13 Productivity ............................................................................................. 27
2.14. Type of Layout ....................................................................................... 29
2.14.1 L-typed and U-typed Layout ........................................................... 30
2.15 Material Handling Equipment ................................................................ 31
2.16 SWOT Analysis ...................................................................................... 32
2.16.1 Internal Factor Evaluation (IFE) Matrix ......................................... 33
2.16.2 External Factor Evaluation (EFE) Matrix ....................................... 34
2.17 Forecasting Method ................................................................................ 35
2.17.1 Time Series Method ........................................................................ 35
2.18 Net Present Value (NPV) ........................................................................ 37
2.19 Benefit- Cost Ratio (B/C ratio) ............................................................... 37
CHAPTER 3 ........................................................................................................ 39
RESEARCH METHODOLOGY ........................................................................ 39
3.1 Flow Chart ................................................................................................ 39
3.1.1. Identification and Formulation of the Problem ................................ 40
xiii
3.1.2. Literature Review ............................................................................ 40
3.1.3 Data Collection ................................................................................. 40
3.1.4 Evaluation of Productivity Factor and Shipyard Capacity ............... 40
3.1.5 Re-layout and Renovation for Shipyard ........................................... 40
3.1.6 Improved of Material Handling System, Shipyard Function and
Increase Shipyard Facilities ............................................................. 41
3.1.7 Evaluation of Technical and Economic Terms ................................. 41
3.1.8 Selected Alternative .......................................................................... 41
3.1.9 Conclusion ........................................................................................ 41
CHAPTER 4 ........................................................................................................ 43
COMPETITIVENESS POSITION OF DALLA SHIPYAD .............................. 43
4.1 SWOT Analysis Method .......................................................................... 43
4.1.1 Internal Factors ................................................................................. 44
4.1.2 External Factors ................................................................................ 45
4.2 Internal Factor Evaluation Matrix ....................................................... 47
4.3 External Factor Evaluation Matrix ...................................................... 48
4.4 Forecast..................................................................................................... 51
4.5 Estimation of Shipyard Capacity .............................................................. 53
CHAPTER 5 ........................................................................................................ 57
CAPACITY IMPROVEMENT OF SHIPYARD ............................................... 57
5.1 Re-layout Shipyard and Shipyard Facility ............................................... 57
5.2.1 Flow of Material for Existing Layout ............................................... 63
5.2.2 Flow of Material for the First Alternative layout ............................. 67
5.2.3 Flow of Material for the Second Alternative layout ......................... 85
5.3 Improved Material Handling System ..................................................... 103
5.4 Capacity Improvement ........................................................................... 104

xiv
5.5 Investment Calculations for Shipyard Layout ........................................ 111
5.6 Evaluation for Layout and Facilities of Shipyard from Economic Aspect112
5.7 Evaluation for Layout and Facilities of Shipyard from Technical Terms116
5.8 Layout Selection from Alternatives ........................................................ 117
CHAPTER 6 ...................................................................................................... 123
CONCLUSION AND SUGGESTION .............................................................. 123
6.1 CONCLUSION ....................................................................................... 123
6.2 SUGGESTION ....................................................................................... 124
REFERENCES .................................................................................................. 125
APPENDIX

xv
LIST OF FIGURES
Figure 2.1 Four Rivers for Inland Waterways....................................................8
Figure 2.2 Locations of Shipyards in Yang......................................................10
Figure 2.3 Total Ship Repair (2011-2016)........................................................11
Figure 2.4 Organization Chart of Dalla Shipyard.............................................16
Figure 2.5 Graph of Ship Repair DWT (2011-2015)........................................18
Figure 2.6 Cross Section of Basin Dock Body.................................................22
Figure 2.7 Graving docks..................................................................................22
Figure 2.8 Floating Dry Docks Component......................................................22
Figure 2.9 Longitudinal Marine Railways........................................................23
Figure 2.10 Transverse Slipways......................................................................24
Figure 2.11 Vertical Lifts..................................................................................24
Figure 2.12 Marine Travel Lifts........................................................................25
Figure 2.13 L-typed and U-typed Layout.........................................................30
Figure 3.1 Flow Chart of Research Methodology.............................................39
Figure 4.1 Total Ship Repair Forecast Trend....................................................53
Figure 4.2 Dalla Shipyard Layout.....................................................................56
Figure 5.1 First Alternative Layout of Shipyard...............................................58
Figure 5.2 Steel Plate Warehouse.....................................................................59
Figure 5.3 Second Alternative Layout of Shipyard..........................................62
Figure 5.4 Flow of Material for the existing....................................................65
Figure 5.5 Flow of Material for First Alternative.............................................68
Figure 5.6 Flow of Material for Second Alternative.........................................88

xvi
“This page intentionally left blank”

xvii
LIST OF TABLES
Table 2.1 Lists of IWT Vessels..............................................................................7
Table 2.2 Area of Each Facility............................................................................11
Table 2.3 Machine Equipments............................................................................14
Table 2.4 Total Ship Repair..................................................................................17
Table 2.5 Total Ships (DWT)...............................................................................18
Table 4.1 Strategic Factors in Ship Repair...........................................................43
Table 4.2 Internal Factor Evaluations..................................................................48
Table 4.3 External Factor Evaluations.................................................................49
Table 4.4 SWOT Matrixes...................................................................................50
Table 4.5 Forecasts for Future 5 Years................................................................52
Table 4.6 Numbers of Slipway and Its Capacity..................................................53
Table 4.7 Ship Repair List Detail for Previous Five Years..................................54
Table 5.1 Additional Area of Facility for the First Alternative
Layout......................................................................................................59
Table 5.2 Additional Area of Each Facility for the Second Alternative
Layout.........................................................................................................60
Table 5.3 Additional Facilities for the First Alternative and the Second
Alternative layouts.....................................................................................61
Table 5.4 List of Plate for 2015 Ship Repair......................................................104
Table 5.5 Capacities of Machine, Crane and Forklift........................................104
Table 5.6 Comparison for the Existing, the First and the Second alternative....105
Table 5.7 Minimum Required Time for the Existing, First and Second
Layout.......................................................................................................106
Table 5.8 Ship Repair for the existing, the First and the Second Layouts.........110
Table 5.9 Lists of Facilities and Equipment for First Alternative Layout..........111
Table 5.10 Lists of Facilities and Equipment for Second Alternative Layout...111
Table 5.11 Calculation of Discounted Cash Flow (DCF) for First Alternative.113
Table 5.12 First Alternative Results for Payback Period, Present Value...........114
Table 5.13 Calculation of Discounted Cash Flow for Second Alternative........115

xviii
Table 5.14 Second Alternative Results for Payback Period, Present Value......116
Table 5.15 Comparison of Required Time at Rate of Speed 60% to 80%.........119
Table 5.16 Comparison of Required Time at Rate of Speed 110% to 120%.....120

1
CHAPTER 1
INTRODUCTION
1.1. Background
Myanmar is a geographical entity in that all its physical features-the mountain
and hill ranges, the valleys, plains, the deltas, the rivers, streams creeks and lakes all
rise within her boundaries and run through within her boundaries. A long line of sea
coast of over 1200 miles starting from the Myanmar- Bangladesh bordering the
northwest right down to the south and terminating at the
most south-easterly tip of the Myanmar-Thailand border is its seafront, with seaports
through which Myanmar has had oversea contact since the ancient times.
The region’s inland waterways play a vital role in the economic development
of remote rural areas and in the welfare of their inhabitants, who are usually among
the lowest of low-income groups in the region. In the absence of river and other
forms of inland waterway transport, many remote under privileged communities
would be inaccessible or too costly to service by other means.
Myanmar is well endowed with natural river resources. The Ayeyarwaddy, the
Chindwin, the Thanlwin and the Sittaung rivers are flowing from north to south. The
inland waterways transportation in Myanmar has better advantage than other modes
of transport in the long term with the reason of least transport cost for heavy and
bulky cargos , capability of transporting large amount of cargos in one time from one
destination to another, a fuel efficient and environment friendly mode of
transportation, no need of huge investment for the infrastructure like other modes of
transport and less annual cost for maintenance of river channels, cheapest means of
transporting raw materials and finished goods of various industries along the river
banks. Inland waterways transportation has been improved rapidly; it is playing an
important and essential role of transport due to its natural navigable waterways of
rivers.

2
Government is embarking on a plan to facilitate speedier transport of
commodities and people along the Ayeyarwady and Chindwin rivers by building six
new inland water ports. Four ports are planned along the Ayeyarwady River at Sin
Khan and Mandalay in Mandalay Region, as well as at Pakokku and Magway in
Magway Region. Two ports are planned along the Chindwin River in Sagaing
Region, at Monywa and Kalewa. The Sin Khan site is intended to facilitate faster
transport between China’s Yunnan Province and Myanmar via the Ayeyarwady
River. The new port at Mandalay is intended to handle containers trucked in via the
Mandalay-Monywa-Tamu and Mandalay-Lashio-Shweli highways, while the
Pakokku port is intended to accept goods from upper Myanmar and help to distribute
them to the west of the Chindwin River. Monywa and Kalewa ports are intended to
facilitate trade with India through Tamu and Kalay. The port planned at Magway is
intended to aid the faster flow of goods from Myanmar’s southwest to upper
Myanmar and China. Therefore, inland waterways is not only more developed but
also more increase inland waterways ships.
Domestic waterborne transport network centering on Yangon Port consists of
coastal and delta transport. The inland waterway transport covers the area along the
rivers around Yangon and Ayeyarwady Delta. Shipbuilding industry in Myanmar has
been developed by three sectors.
The first sector is the semi-government organization represented by Myanma
Shipyard, which is engaged in shipbuilding and ship repair, together with other
mechanical works on commercial basis.
The second sector is composed of shipyards owned by the government
organizations such as IWT (Inland Water Transport), MPA (Myanma Port Authority,
DMA (Department of Marine Administration) and so on, where their own ships and
fleets are maintained.
The last sector is private shipyards. There are large numbers of shipyards
along the Yangon River and the Bago River as well as Seikgyi village near the
Twante Canal. There are 31 shipyards in Yangon region. State owned shipyard is 9
and private owned shipyard is 22. The most of state owned shipyard functions are to
repair and maintain state owned ships.

3
Inland Water Transport (IWT) is one of enterprise under Ministry of Transport
(MOT). IWT is operating passenger cum cargo transport along the navigable
waterways of Delta areas, the Ayeyarwady River, the Chindwin River and rivers in
Mon, Kayin and Rakhine states in Myanmar (IWT, 2015). IWT use many vessels to
give transport services for the people and cargo.
Engineering department of Inland Water Transport are six shipyards. They are
Dalla shipyard, Dagon Seikkan shipyard, Yatanabon shipyard, Chindwin shipyard,
Sittwe shipyard, Thanlwin shipyard. These shipyards are giving maintenance
services to the vessels regularly.
Dalla Shipyard (state-owned shipyard), the establishment since 1852, locates
beside the Yangon River in Dalla Township, Yangon Region. This shipyard is
carrying out concerning major ship construction, ship repair and maintenance for
Inland water vessels. The functions of shipyard are emergency docking for repair,
major overhaul for engines, re-engineering, performing to support full utilization of
fleet as planned and annual docking for repair and new constructions for privates and
governmental departments. Most constructed ships are barges, tugs, self-propulsion
barges and shallow draft vessels (Than, 2009).
1.2. Statement of the Problem
Nowadays, Government’s policy changed that the state owned enterprises
have to stand with their own budgets and have to get revenue for government. Dalla
shipyard docking capacity per year (2015) is 57 vessels. The efficiency of the
shipyard, which is about 164 years old, is hampered by old equipment, including
some from the WWII-era (Word War II). According to the Inland Water Transport
Board Law in 2014, Inland Water Transport (IWT) may have to stand with own
budgets and have to seek markets and customers themselves. Therefore, the shipyard
needs to be upgraded to improve its current capacity in ship repair.

4
1.3. Research Question
Based on the background and statement of the problem, the research will solve
the following questions.
1. How to identify competitiveness position of Dalla shipyard in ship repair
business?
2. How to re-arrange the layout of Dalla shipyard in accordance with the
current layout of the shipyard?
3. How to improve facilities and material handling system?
1.4. Research Objectives
In doing this research, there are several goals, as follows:
1. To conduct a survey on the existing situation of the shipyard.
2. To evaluate the factors of production for ship repair in Dalla shipyard
today.
3. To get a good productivity after re-arranging the layout.
4. To get a new shipyard layout in accordance with the situation of Dalla
shipyard.
1.5. The Scope of Work
The scope of work in this research is as follow:
1. The condition of Dalla shipyard should be known low capacity of ship
repair.
2. The shipyard layout is re-arranged based on the current situations of
facilities and the material handling system.
3. The new facilities are supported by a mobile crane, a forklift, improved
buildings and slipway repair.
4. The feasibility should be known for alternative layout of shipyard.

5
1.6. Benefits
Based on the background of writing, the research question and the purpose of
writing, in this paper the benefit is a material to aid in the selection model of
renovation shipyard. With an achievement target is the productivity level to increase
circumstances of shipbuilding industry that exists at the moment. After finished the
shipyard repair, the capacity improvement is 58 vessels per year (2016). Rationalize
of the shipbuilding industry increase the productivity in shipyard and revenue of
Inland Water Transport (IWT).

6
“This page intentionally left blank”

7
CHAPTER 2
LITERATURE REVIEW
2.1 Dalla Shipyard
The Irrawaddy Flotilla Company Limited was formed in 1865 to operate
transportation services on Irrawaddy River in Myanmar. The larger vessels of the
Irrawaddy Flotilla Company are assembled in Dalla shipyard after having been
constructed and set up engine in Scotland. Many of the smaller steamers and
launches are built entirely in the company’s modern shipyard (Dalla shipyard). At
that time the shipyard is private owned shipyard and it has complete equipment and
facilities.
The Irrawaddy Flotilla Company Limited was nationalized on 1st June 1948
after gaining Independence from the British Colonial Rule. Under the plan to provide
new administrative order, ―Inland Water Transport Board" was renamed as ―Inland
Water Transport Corporation" in 1972. It has been changed to the present name of
"Inland Water Transport" with effect from 1st April 1989. Now Dalla shipyard is
under Inland Water Transport (IWT), Ministry of Transport and communications.
Dalla shipyard is located on the southern bank of Yangon River across from
downtown Yangon. Dalla shipyard currently accounts for about 50 percent of repair
work on ships owned by the Inland Water Transport. The following table 2.1 shows
the list of IWT vessels.
Table 2.1 List of IWT Vessels
Fleet
Powered Crafts 189
Dumb Barges 134
Station Pontoons 30
Total 353
Source: IWT, 2015

8
Figure 2.1 Four Rivers for Inland Waterways
2.2 Functions of Shipyard
Dalla shipyard repairs IWT’s vessels and build new vessels for private and
governmental departments. The functions of shipyard are as following:
1. Annual docking for repair
2. Emergency docking for repair
3. Major overhaul for engines
4. New constructions
Thanlwin R.

9
1. Annual docking for repair is that the vessels are in dock to repair annually
because the lifetime of vessel license is two years permission from Department of
Marine Administration (DMA). Annual docking services include carrying out
essential steel work repairs, maintaining and servicing engines, overhauling steering
gear on vessels, stern tube and propeller, carpenter work and painting the vessel
externally and internally.
2. Emergency docking for repair is that problems such as narrow and shallow
water channel, grounding and damaging in underwater parts of ships appear to be
common, whereas in high season, difficulty in ship handling because of rapid
currents, collisions with piers of bridges and consequently, sinking of vessels and
barges have to be encountered. Emergency docking services include hull repair,
painting the vessel externally and internally, engine maintenance and outside and
inside filter work.
3. Major overhaul for engines include engine repair and maintenance, checking
propeller and shift alignment.
4. New Constructions is that the shipyard construct new vessel according to the
IWT’s order. Most constructed ships are barges, tugs, self-propulsion barges and
shallow draft vessels.
2.3 Market Opportunity
Dalla shipyard only repairs and maintains Inland Water Transport’ vessels.
The most common vessel age is more than 30 years old. Therefore, the shipyard
gives a big repair service for vessel. Now the government changes its policy for
enterprise to make a private company. Yangon International Port handles most of the
imports and exports seaborne trade of the country. There are three inland water
depots and eighteen international wharves in Yangon port area. The many shipping
lines operate from Yangon port to delta region and upper Myanmar from Irrawaddy
River. If the shipyard increases incrementally of ship repair for the IWT’s vessels

10
and private vessels, its market share will be improved. The number of vessels in
Yangon region is 2865 vessels (DMA, 2014). From 2011 to 2015, no of ship repair
in Dalla shipyard is varied from 51 to 58 (in average 55 vessels) or 1.9 percent of the
total market in Yangon region. The market share with the expected number of ship
repair (83 vessels) is 2.9 percent of the total market in Yangon region.
Figure 2.2 Locations of Shipyards in Yangon
2.3.1 Target Order
The target is about the annual capacities of ship repair that ensure the survival
of the shipyard is needed to use time series analysis method. Time series analysis
method is a pattern of development of ship repair services in the previous time series
to obtain the size of the development level of annual repair. From the historical data,
we can provide movement patterns or market growth demand, and then the pattern
will be predictable market demand in the future. However, we need to consider the
forecasting because the future situations face with risks and uncertainties. The
following description is about the frequency of ship repair for 6 years in the future.

11
Figure 2.3 Total Ship Repairs 2011-2016
2.4 Layout
2.4.1 Layout of Dalla Shipyard
The total area of Dalla shipyard is 30 acres or 12.146 hectare. The following
table 2.2 shows the area of each facility.
Table 2.2 Area of Each Facility
No Item Size
(m)
Area
(m2)
Established
Year
Remark
1 Gate House 17 x 9 153 Good
2 Office 46 x 14 644 Good
3 Medical Center 25 x 10 250 2009 Good
4 Machine Shop 76 x 43 3268 Good
5 Electrical Shop 27 x 14 378 Good
6 Planning Office 16 x 8 128 2010 Good
7 No1 Winch House 15 x 9 135 Good
8 No 2 and 3 Winch House 20 x 13 260 Good
9 Main Store 62 x 39 2418 Good
10 Store 1 74 x 13 962 Good
11 Diesel shop 66 x 15 990 Good
12 Pipe and Boiler shop 50 x 30 1500 Not Good
13 Power Station 40 x 10 400 Good
50
52
54
56
58
60
2010 2012 2014 2016 2018
Nu
mb
er
of
ship
Year
Total Ship Repair Sales
Total Ship RepairSales

12
14 Foundry Shop 45 x 13 585 Not Good
15 Carpenter shop and store 53 x 27 1431 Not Good
16 CNC shop 20 x 10 200 2004 Good
17 Zone 5 76 x 53 4028 Good
18 Zone 3 28 x 15 420 Good
19 No 7 and 12 Winch House 50 x 5 250 Not Good
20 Zone 4 20 x 13 260 Good
21 Outside Filter House 15 x 10 150 Good
22 Water Tank 15 x 10 150 Good
23 Drawing Office 25 x 11 275 Good
24 Bangalow House 20 x 15
x 5
1500 Good
25 Labor House 1 37 x 10 370 Good
26 Labor House 2 50 x 11 550 Good
27 Labor House 3 37 x 10 370 Good
28 Labor House 4 44 x 17 748 Good
29 Oxygen Cylinder Store 7.5 x 6 45 Good
30 Lake 103 x
40
4120 Good
31 Slipway 1 140 x
6.5
910 Good
32 Slipway 2 and 3 100 x
6.5 x 2
1300 Good
33 Slipway 4 (dry dock) 91 x 22 2002 Good
34 Slipway 5 and 6 77 x 14 1078 Not Good
35 Slipway 7 to 12 41 x 58 2378 Good
36 Slipway 13 46 x 81 3726 Good
37 Slipway 14 152 x
6.5
988 Good
38 Labor Canteen 10 x 5 50 Good

13
39 Transformer House 3 x 3 9 Good
Total 39379
Source: Dalla Shipyard
Total used area of shipyard = 39379 m2
Total area of shipyard = 121406 m2
Percentage of total used area of shipyard = (39379/121406) x 100%
= 32.4%
Therefore, Percentage of free area of shipyard is 67.6%.
There are several different functions that occur at ship repair and
manufacturing facilities. Some facilities employ a few people, while others employ
many people, including various subcontractors, electricians, labors, machinists,
welders, painters, sandblasters, pipe fitters and a number of administrative and
managerial staff. Dock facilities and transportation equipment support the smooth
operation of the ship repair. But Dalla shipyard’s facilities and transportation
equipment does not support fully the ship repair because most facilities and
equipment of Dalla shipyard are long life.
There are two forklifts (10T) in shipyard. One forklift is broken and other get
low capacity. Some building needs to repair and maintain. Dalla shipyard store
rainwater in the lake because the ground water is salt and water supply from city
municipal is not sufficient.
The shipyard has many buildings but some building need to renovate some
parts of building. The machine shop is too big because it has many facility and
equipment. But the workable machines in machine shop are a little now. Therefore,
the second alternative layout builds new machine shop between the pipe and boiler
and power station shop for better material handling and time consuming. The size of
machine shop in the second alternative is small because workable machine are re-
installed in the new machine shop. The pipe and boiler shop in the second alternative
layout is re-located for better material handling and time consuming. The size of pipe
and boiler shop in the existing layout is too big because it gives piping and boiler
repair service. But now the pipe and boiler shop give piping service only. Therefore,
the size of the pipe and boiler shop in the second alternative layout is small.

14
2.4.2 Facilities of Dalla Shipyard
The following table 2.3 shows the production and material handling
equipment of Dalla shipyard.
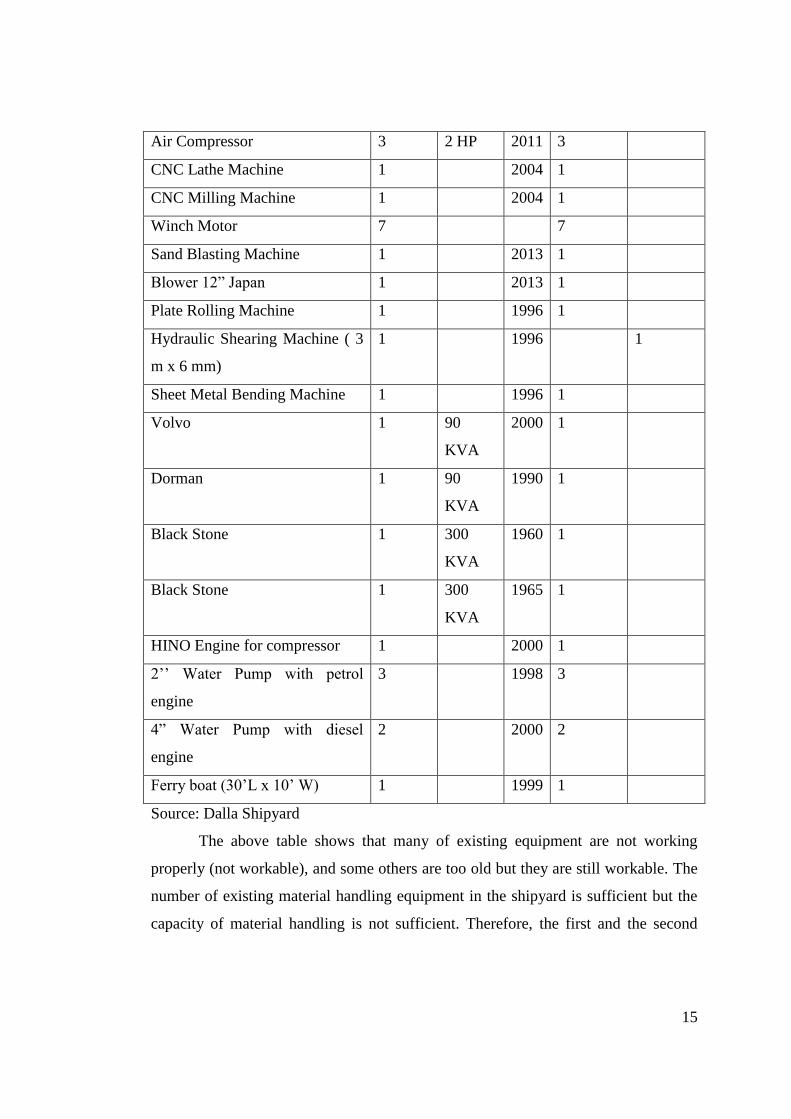
Table 2.3 Machine Equipment
Name of Item Number Capacity Year Workable Not
Workable
Forklift 2 10 Ton 1995 1 1
Mobile Crane 1 25 Ton 1995 1
Mobile Crane 2 12 Ton 1995 1 1
Truck Car 1 3 Ton 1995 1
Jetty Crane 1 15 Ton 1
Jetty Crane 1 10 Ton 1
Jetty 2 2
Transformer 1 600 KW 1
Generator 2 395 HP 2
Lathe Machine L- 10 m 1 1956 1
Lathe Center Type 23’ x 7‖ 3 1950 1 2
Lathe Center Type (Cone Pulley
Drive)
1 1950 1
Vertical Drilling Machine
(Bench Type)
1 1950 1
Slotting Machine 1 1950 1
Boring Machine 1 1950 1
Milling Machine 1 1950 1
Hydraulic Jack Ton 2 100 Ton 1995 2
Hydraulic Jack Ton 2 50 Ton 1995 2
Welding Machine ESAB 30 1998 25 5
Welding Machine TOE 20 2004 19 1
Wood Shaper Machine 1 2009 1
Hand Grinder Machine 3" 8 2010 6
15
Air Compressor 3 2 HP 2011 3
CNC Lathe Machine 1 2004 1
CNC Milling Machine 1 2004 1
Winch Motor 7 7
Sand Blasting Machine 1 2013 1
Blower 12‖ Japan 1 2013 1
Plate Rolling Machine 1 1996 1
Hydraulic Shearing Machine ( 3
m x 6 mm)
1 1996 1
Sheet Metal Bending Machine 1 1996 1
Volvo 1 90
KVA
2000 1
Dorman 1 90
KVA
1990 1
Black Stone 1 300
KVA
1960 1
Black Stone 1 300
KVA
1965 1
HINO Engine for compressor 1 2000 1
2’’ Water Pump with petrol
engine
3 1998 3
4‖ Water Pump with diesel
engine
2 2000 2
Ferry boat (30’L x 10’ W) 1 1999 1
Source: Dalla Shipyard
The above table shows that many of existing equipment are not working
properly (not workable), and some others are too old but they are still workable. The
number of existing material handling equipment in the shipyard is sufficient but the
capacity of material handling is not sufficient. Therefore, the first and the second

16
alternative layouts are additional of a new mobile crane (30 Ton) and a new forklift
(10 Ton).
2.5 Organization Structure of Shipyard
Shipbuilding industry is known as a very complex business-production
system. Therefore, the organizational structures of shipyards are very wide and deep,
and it is very hard to manage such complex systems. Dalla shipyard is one of
shipyard under engineering department of Inland Water Transport (IWT). The
following figure shows the organization structure.
Figure 2.4 Organization Chart of Dalla Shipyard
Dalla shipyard organization allows setting 1320 persons but actually
appointed is 312. Therefore, vacancy is 1008 persons. The shipyard cannot appoint
new employees for vacancy because of government policy.
2.6 Aspects of Social Relationship and Partnership
Social aspects of Dalla shipyard were judged by including natural
environment, employee and education. Shipyard plants trees around the river bank
Command Engineer (CE)
Deputy Command Engineer (Dyce)
Assistant Command Engineer (ACE)
Assistant Manager (Finance) Assistant Engineer (A.E)
Project Office Store Drawing Office Account Ledger Costing Pay Office Staff
Ship Repair and Construction Zone

17
for the process of green environment. Shipyard provides the welfare and convenience
for employees.
They are healthcare and medicine supply, facilities supply for employee,
financial loans for employees who need suddenly and give holiday allowance. The
government assists shipyard to pay loan with small rate of interest. Shipyard provides
the opportunity and the chance for students to conduct field work, research or study
for educational institutions that have programs shipbuilding techniques.
2.7 Cooperation
Dalla shipyard cooperates with JICA in Japan to increase human resources,
technology, standardization and quality control. The shipyard cooperates with India
Inland Transport to build new vessels for Kelantan Project. The shipyard cooperates
with other shipyard in region and government department.
2.8 Productivity of Ship Repair of Dalla Shipyard
The following table 2.4 shows the number of vessels that are repaired by
Dalla Shipyard. This data is from 2011 to 2015.
Table 2.4 Total Ship Repair
No Month Year
Total 2011 2012 2013 2014 2015
1 January 4 3 5 8 4 24
2 February 4 4 7 3 3 21
3 March 0 2 3 4 6 15
4 April 3 3 1 4 6 17
5 May 6 6 6 4 3 25
6 June 3 6 8 4 7 28
7 July 7 2 2 3 4 18
8 August 7 8 7 4 5 31
9 September 3 3 5 6 3 20
10 October 3 3 5 4 5 20

18
11 November 7 9 7 6 5 34
12 December 6 2 2 5 6 21
Total 53 51 58 55 57 274
Source: Dalla Shipyard
The following table 2.5 shows the size of vessels that are repaired by Dalla
shipyard.
Table 2.5 Total Ships (DWT)
DWT Year
Total 2011 2012 2013 2014 2015
< 100 9 14 11 7 7 48
100-200 15 12 14 16 16 73
200-300 17 17 19 19 18 90
300-400 8 3 8 8 8 35
400-500 4 5 6 5 8 28
Total 53 51 58 55 57 274
The following figure 2.5 shows more details the size of vessels and number
of vessels.
Figure 2.5 Graph of Ship Repair DWT (2011-2015)
According to the previous data of ship repair from the shipyard (2011 – 2015)
can be presented base on the total number of vessels in the repair.
< 100 DWT total is 17.5%
100-200 DWT total is 26.5%
0
5
10
15
20
2011 2012 2013 2014 2015
Nu
mb
er
of
Ship
Year
< 100 DWT
100-200
200-300
300-400
400-500
19
200-300 DWT total is 33%
300-400 DWT total is 13%
400-500 DWT total is 10%
From the market of Dalla shipyard data, ship with DWT tonnage < 300 is 77
percentage of overall. Therefore, Dalla shipyard repairs less than 300 DWT every
year.
2.9 Shipyard
Shipbuilding is an industry that produces products (ships, offshore structures,
floating plants, etc. Ships and floating structures are important engineering structures
that serve a wide variety of objectives, e.g. transporting cargo and passengers,
exploration/production/storage of oil/gas/minerals, coastal protection and
surveillance, and military defense, etc. the product is built to order and customized to
the specific requirements of the purchaser (Storch,1995).
Shipbuilding is the construction of ships, and a shipyard is the place where
ships are built .Shipbuilding is a construction industry which uses a wide variety of
manufactured components in addition to basic construction materials. The process
therefore has many of the characteristics of both construction and manufacturing.
Shipbuilding requires many workers having various skills (or trades), working within
an established organizational structure at a specific location in which necessary
facilities are available. The goal of a privately owned shipbuilding company is to
earn a profit by building ships (Storch, 1995).
2.9.1. Types of shipyard
According to activities, shipyard can be classified (Soeharto and Soejitno,
1996):
1. Shipyard specialize new buildings; this shipyard specially build ships – new
vessel, the new ship construction period is relatively long.
2. Shipyard specialize ship repair, this shipyard specially do ship repair - either
annual or special repair.

20
3. Shipyard for new ship and ship repair, this shipyard has dual activity. They
are new buildings and reparations.
2.9.2. Shipbuilding Process
The entire shipbuilding process is likely to vary somewhat, depending on the
customer involved, but it generally involves a number of specific stages. These may
be summarized as (Storch, 1995):
1. Development of owner's requirements
An owner has identified the need for a new ship and defined operational
requirements.
2. Preliminary/concept design
This stage can be done internally by the owner's staff, by a design agent hired
by the owner, or by the staffs of one or more shipyards. The aim is to develop a
design that will meet the requirements while taking advantage of the building
experience and capability of particular shipyard to minimize construction time and
cost.
3. Contract design
Based on the general description of the ship to be built, as determined by the
end product of the preliminary design stage, more detailed information is required to
permit bids and/or contracts to be prepared. This information, called the contract
design.
4. Bidding/contracting
Following completion of the contract design stage, a specific shipyard is
chosen to build the vessel. Unless an owner has involved a shipyard in the
preliminary and/or contract design stage and thus is negotiating a contract based on a
mutually agreeable design, competitive bidding based on the contract design and
specifications is common practice.

21
5. Detail design and planning
This stage must answer the questions of "what, where, how, when, and by
whom." Determining what parts, assemblies, and systems are to be built and what
components are to be purchased is primarily detail design.
6. Construction
This stage can be considered to occur in four manufacturing levels. The first is
parts manufacturing, using raw materials (such as steel plate and sections, pipe, sheet
metal, and cable) to manufacture individual parts. The next manufacturing level
involves the joining of parts and/or components to form subassemblies or units.
These small collections of joined parts are then combined in the third manufacturing
level to form hull blocks. Erection, the final manufacturing level, involves the
landing and joining of blocks at the building site.
2.10 Types of Dry Dock
A basic understanding of how a dock is designed and built provides insight into
how and why the dock’s operational limitations have been derived (Heger, 2005).
There are several basic types of dry docks:
1. Basin or Graving docks
2. Floating Dry Docks
3. Marine Railways
4. Vertical Lifts
5. Marine Travel Lifts
2.10.1. Basin or Graving docks
Basin or graving docks are large, fixed basins built into the ground at water’s
edge, separated from the water by a dock gate. Basin docks are capable of docking
all sizes of vessels, with capacities of over 200,000 tons. Its basic structure consists
of a floor, sidewalls, head (front) wall and a dock gate. Alters (steps) may be
incorporated into the side walls for structural stability.

22
Figure 2.6 Cross Section of Basin Dock Body (Heger, 2005)
Figure 2.7 Graving Dock (Heger, 2005)
2.10.2 Floating Dry Dock
Floating dry docks are structures with sufficient dimensions, strength,
displacement and stability to lift a vessel from the water using buoyancy . Float-
ing docks range in lift capacities from a few hundred tons to over 100,000 tons. In
general the most economical range for floating docks is about 1,000 to 100,000 tons.
Figure 2.8 Floating Dry Dock Components (Heger, 2005)

23
2.10.3. Marine Railways
A marine railway is a mechanical means of hoisting a ship out of the water
along an inclined plane. Lift capacities range from 100 to 6,000 tons. The cradle,
which rolls on rollers or wheels, is lowered into the water along an inclined track
until sufficient water over the cradle is achieved. The ship is floated over the cradle
and tied to the uprights. The cradle is hauled up the track and the vessel grounds onto
the blocks. After complete grounding on the keel blocks, the side blocks are brought
to bear and the hauling continues until the cradle is full up. The formulas of slipways
length are as following:
( ) …..………………………… (2.1)
Where,
L = length of slipways in meter
l = length of vessel between perpendicular in meter
S = horizontal distance for unit rise of slipways inclination
d = draft of vessel at forecastle bulk head in meter
h = high from rail level to top of block in meter
Figure 2.9 Longitudinal Marine Railways (Heger, 2005)

24
Figure 2.10 Transverse Slipways (IWT, 2015)
2.10.4. Vertical Lifts
A vertical lift is a mechanical means of hoisting a ship out of the water
vertically. The dock consists of platform, hoisting mechanism and hoist support pier.
The platform is lowered into the water until sufficient water over the blocks is
achieved. The ship is floated over the platform and centered. The platform is raised,
grounding the vessel on the blocks. As the vessel is raised, all motors are
synchronized to insure they each haul at the same rate no matter what the load on
each of them is. This insures that no unit gets overloaded.
Figure 2.11 Vertical Lifts (Heger, 2005)

25
2.10.5 Marine Travel Lifts
A marine travel lift is a vertical lift on wheels. Instead of a structurally rigid
platform to support the vessel, nylon straps are usually used. The slings are lowered
into the water until sufficient water over the slings is achieved. The ship is floated
over the slings and centered. The slings are raised to lift the vessel. Once the ship is
at yard’s elevation, the travel lift can be moved under its own power to place the ship
on fixed blocks in a storage berth.
Figure 2.12 Marine Travel Lifts (Heger, 2005)
2.11 Shipyard Facility
In general, shipyards have specialized workshops and spaces such as
mechanical, electrical, steel sandblasting, docking, painting, and others. Electrical
works, mechanical works, steel renewal, pipe work, and routine docking works such
as washing, grit blasting, coating, sea chest cleaning, propeller dismantling,
polishing, controlling on tail shaft and stern tube seals can be listed as the main
facilities during a docking period (Celik, 2009). A shipyard generally contains
several specific facilities laid out to facilitate the flow of material and assemblies.

26
There is no typical shipyard layout, partly because many shipyards were initially
constructed in the nineteenth or early twentieth century. These yards have grown
according to the availability of land and waterfront as well as in response to
production requirements (Storch, 1995).Typical important features are listed below:
a. a location on land for erecting a ship, along with an associated means
for getting the ship to the water, such as a graving dock, launching
ways, or a floating dry dock piers for storing ships afloat to permit work
to continue following launching
b. shops for performing various kinds of work, such as
steel marking, cutting, and forming shop
steel assembly shop
surface preparation and coating shop
pipe shop
sheet metal shop
machine shop
electrical shop
c. storage, marshaling, and outdoor (blue sky) work areas
d. offices and personnel support buildings (cafeteria, sick bay, etc.)
2.12. Organization.
Shipyard workers are organized within departments or sections that are
responsible for some aspect of the operation of the company. Although each
company is likely to have some variation in its organization, the usual subdivision is
into six functions. They are
1. Administration
2. Production
3. Engineering
4. Purchasing
5. Quality Assurance
6. Project management

27
Besides, the complexity of the activity organization in a shipyard which
implements Group Technology requires a reliable and efficient Quality Control
System in order to reduce rework. Assembling various blocks often produced in
separate locations with different production processes is tributary of a high level of
accuracy and coordination.
2.12.1 Management Approach
Management Approach is only one system management to ship repair and
maintenance has been by function (Storch, 1995). This was because the work
definition, design, estimating, purchasing, planning, and testing were all done by
systems, the same system that were the exclusive responsibility of specific trade skill
function. The pipefitter did pipe system, the shipbuilder built hull structure,
electricians ran wire and hooked up electrical equipment, machinists worked on
machinery, and the sheet metal workers did ventilation.
This approach can be effective for smaller shipyard, simple jobs involving
only a few systems. It can be any collection of tasks, grouped logically tor efficient
performance. As with product-oriented new construction, sequencing is done in
terms of problem areas and stages within a problem area. One component might even
be part of different zones at various stages of the work. The zone concept allows task
grouping, source allocation, and interdependency decisions to be made earlier and
from a project perspective of the single waterfront foreman (Ilela, 2010).
2.13 Productivity
Productivity implies a mental attitude that always has a view of the quality of
life today should be better than yesterday and tomorrow better than today (Rafiy,
2015). Quantitatively productivity is the ratio between the output and the input that is
used per unit time (hour, day, month, and year).
This formulation applies to the company, industry, economic, fishermen and
others. Generally productivity formulated as the concept that describes the
relationship between the results of the form of goods or services with the production
resources (material, labor, machine and equipment, money, method) (Arif, 2014).
28
Productivity is commonly defined as a ratio between the output volume and the
volume of inputs. Specifically means the ability to produce something that includes
increased efficiency and speed to produce a product that is the result of a
combination of effectiveness, efficiency and economies. Productivity variable is the
ratio between the output to the input or resource productivity has two (2) dimensions;
1. Effectiveness is the achievement of such targets; quality, quantity and time, 2.
Efficiency comparing inputs are actually used or how the work is done or executed
(Rafiy, 2015). In the shipbuilding industry, productivity refers to the volume of
workers, cranes, building docks or berths, shipbuilding techniques, etc. There are a
number of methods to calculate both input and output.
………………………… (2.2)
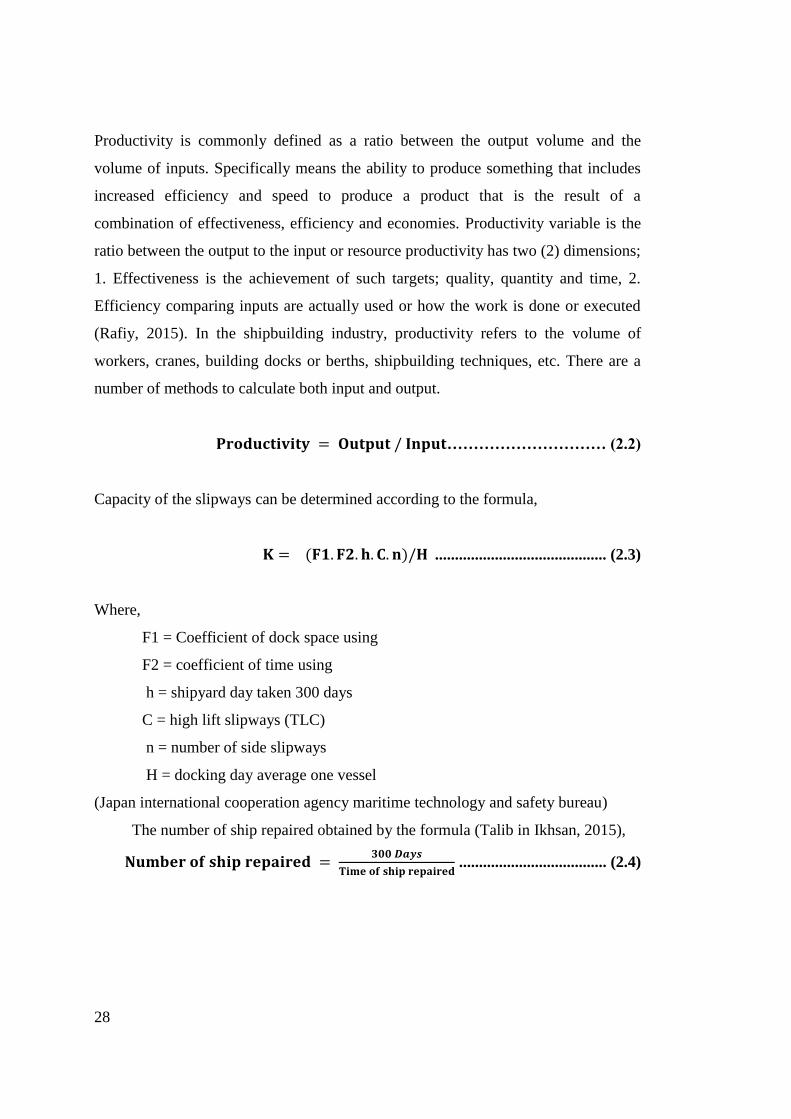
Capacity of the slipways can be determined according to the formula,
( ) ........................................... (2.3)
Where,
F1 = Coefficient of dock space using
F2 = coefficient of time using
h = shipyard day taken 300 days
C = high lift slipways (TLC)
n = number of side slipways
H = docking day average one vessel
(Japan international cooperation agency maritime technology and safety bureau)
The number of ship repaired obtained by the formula (Talib in Ikhsan, 2015),
..................................... (2.4)

29
2.14. Type of Layout
Most shipyards are well established and were originally sited in a suitable
location for building small ships with methods which have now been superseded.
With the growth in ship sizes and the introduction of new building methods it has
been recognized that a revised shipyard layout will be advantageous. Advantages to
be gained, apart from the ability to construct larger vessels, are primarily, a uniform
work load, a shorter ship build cycle, and economies in construction practices
(Storch, 1995).
Layout is defined as the arrangement of facilities aimed to achieve the
operational objectives of an enterprise at minimum costs and with maximum
efficiency. A poor layout can reveal highly detrimental to productivity and
consequently to profitability (Chabane, 2004). Symptoms that are peculiar to a poor
plant arrangement can be summarized into:
1. great travel distances in the flow of materials
2. bottlenecks in the shipment of resources
3. excessive handling of materials
4. poor information circulation
5. inefficient communication system
6. low rate of machine and labor utilization
The causes that may lie behind such deficiencies may reside in:
1. insufficient infrastructures
2. inefficient location arrangement of the various departments
3. poor handling equipment
4. inadequate fabrication processes and technology
5. inefficient planning system
An ideal layout for a modern shipyard is based on a production flow basis,
with the yard extending back from the river or shore at which the berths or building
dock are located. There are three type of layout as following;
1. Process layouts, also known as functional layouts, group similar activities
together in departments or work centers according to the process or function they
perform.

30
2. Product layouts, better known as assembly lines, arrange activities in a line
according to the sequence of operations that need to be performed to assemble a
particular product. Each product or has its own "line" specifically designed to meet
its requirements.
3. Group Layout, Layout is based on the same work processes and material
flows prepared in accordance with the material flow with automated machine support
and material handling as well as more oversight.
2.14.1 L-typed and U-typed Layout
The hull of a ship is constructed such that production is continuous. Many
different layouts are possible, but the best layout is that in which the materials travel
the shortest possible distance with minimum handling. L-typed or U-typed Layout
flow dependent on the physical environment and areas available and could be
visualized as shown in Figure 2.8.
Figure (2.13) L-typed and U-typed Layout (Shenoi, 2007)

31
2.15 Material Handling Equipment
Material handling cannot be avoided in logistics, but can certainly be reduced
to minimum levels. The productivity potential of logistics can be exploited by
selecting the right type of handling equipment. The selection of material handling
equipment cannot be done in isolation, without considering the storage system.
Investment in the material handling system will be sheer waste if it is not compatible
to the warehouse layout plan. The layout will create obstacles for free movement of
equipment and goods, resulting in poor equipment productivity. Recent trends
indicate preference for automated system with higher logistics productivity to
enhance the effectiveness of human energy in material movement (Sople, 2007).
Materials handling is loading, moving and unloading of materials. To do it
safely and economically, different types of tackles, gadgets and equipment are used,
when the materials handling is referred to as mechanical handling of materials.
Materials handling is used with reference to industrial activity. In any industry, be it
big or small, involving manufacturing or construction type work, materials have to
be handled as raw materials, intermediate goods or finished products from the point
of receipt and storage of raw materials, through production processes and up to
finished goods storage and dispatch points (Ray, 2008). Some of the other definitions
are:
• Materials handling is the movement and storage of materials at the
lowest possible cost through the use of proper methods and
equipment.
• Materials handling is the moving of materials or product by any
means, including storage, and all movements except processing
operations and inspection.
• Materials handling is the art and science of conveying, elevating,
positioning, transporting, packaging and storing of materials.
All the functions of materials handling have been referred to which are
conveying, elevating, positioning, transporting, packaging and storing. Storage or
warehouse is very much a part of materials handling. Materials handling uses
different equipment and mechanisms called Materials Handling Equipment.

32
The essential requirements of a good materials handling system may be
summarized as:
i. Efficient and safe movement of materials to the desired place.
ii. Timely movement of the materials when needed.
iii. Supply of materials at the desired rate.
iv. Storing of materials utilizing minimum space.
v. Lowest cost solution to the materials handling activities
These long distance movements of materials are generally termed as
transportation of materials through various modes of transport like, road, rail, ship or
air. Transportation is generally excluded from the scope of materials handling.
However, at each of the sources and destinations, loading and unloading of materials
is necessary and these are referred to as materials handling of these locations.
2.16 SWOT Analysis
According to (David, 2015), internal strengths and internal weaknesses are an
organization’s controllable activities that are performed especially well or poorly.
They arise in the management, marketing, finance/ accounting,
production/operations, research and development (R&D), and management
information systems (MIS) activities of a business. Identifying and evaluating
organizational strengths and weaknesses in the functional areas of a business is an
essential strategic- management activity. Strengths and weaknesses can be
determined by elements of being rather than performance.
External opportunities and external threats refer to economic, social, cultural,
demographic, environmental, political, legal, governmental, technological, and
competitive trends and events that could significantly benefit or harm an organization
in the future. Opportunities and threats are largely beyond the control of a single
organization.
Many companies in many industries face the severe external threat of online
sales capturing increasing market share in their industry. A basic tenet of strategic
management is that firms need to formulate strategies to take advantage of external
opportunities and avoid or reduce the impact of external threats. Novozhilova (2010)

33
present the SWOT-analysis is performed with the purpose to study the business
environment, legal terms, weak and strong sides of own enterprise and enterprises-
competitors, as well as of complex inter-influencing of the studied factors. Dana
(2012) present for organizations to develop, they often must undergo significant
change at various points in their development, unfortunately, there still are not
enough elements about how to analyze organization, identify critically important
priorities. Ma’ruf (2006) describes The SWOT analysis that mostly used in strategy
formulation is considered very general.
2.16.1 Internal Factor Evaluation (IFE) Matrix
This strategy-formulation tool summarizes and evaluates the major strengths
and weaknesses in the functional areas of a business, and it also provides a basis for
identifying and evaluating relationships among those areas. Intuitive judgments are
required in developing an IFE Matrix, so the appearance of a scientific approach
should not be interpreted to mean this is an all-powerful technique. A thorough
understanding of the factors included is more important than the actual numbers
(David, 2015). An IEF Matrix can be developed in five steps:
1. Use a total of 20 internal factors, including both strengths and weaknesses.
List strengths first and then weaknesses. Be as specific as possible, using
percentages, ratios, and comparative numbers.
2. Assign a weight that ranges from 0.0 (not important) to 1.0 (all-important) to
each factor. The weight assigned to a given factor indicates the relative
importance of the factor to being successful in the firm’s industry. Regardless
of whether a key factor is an internal strength or weakness, factors considered
to have the greatest effect on organizational performance should be assigned
the highest weights. the sum of all weights must equal 1.0
3. Assign a 1-to-4 rating to each factor to indicate whether that factor represents
a major weakness (rating = 1), a minor weakness (rating = 2) a minor strength
(rating = 3), or a major strength (rating = 4). Note that strengths must receive
a 3 or 4 rating and weaknesses must receive a 1 or 2 rating. Ratings are thus
company-based, whereas the weights in step 2 are industry-based.

34
4. Multiply each factor’s weight by its rating to determine a weighted score for
each variable.
5. Sum the weighted scores for each variable to determine the total weighted
score for the organization.
Regardless of how many factors are included in an IFE Matrix, the total
weighted score can range from a low of 1.0 to a high of 4.0, with the average score
being 2.5. Total weighted scores well below 2.5 characterize organizations that are
weak internally, whereas scores significantly above 2.5 indicate a strong internal
position. Like the EFE Matrix, an IFE Matrix should include 20 key factors. The
number of factors has no effect on the range of total weighted scores because the
weights always sum to 1.0.
2.16.2 External Factor Evaluation (EFE) Matrix
David ( 2015) describe an external factor evaluation (EFE) matrix allows
strategists to summarize and evaluate economic, social, cultural, demographic,
environmental, political, governmental, legal, technological, and competitive
information. The EFE Matrix can be developed in five steps:
1. Include a total of 20 factors, including both opportunities and threats that
affect the firm and its industry. List the opportunities first and then the
threats. Be as specific as possible, using percentages, ratios, and comparative
numbers whenever possible.
2. Assign to each factor a weight that ranges from 0.0 (not important) to 1.0
(very important). The weight indicates the relative importance of that factor
to being successful in the firm’s industry. Opportunities often receive higher
weights than threats, but threats can receive high weights if they are
especially severe or threatening. The sum of all weights assigned to the
factors must equal 1.0.
3. Assign a rating between 1 and 4 to each key external factor to indicate how
effectively the firm’s current strategies respond to the factor, where 4 = the
response is superior, 3 = the Response is above average, 2 = the response is
average and 1 = the response is poor. Ratings are based on effectiveness of

35
the firm’s strategies. Ratings are thus company-based, whereas the weights in
Step 2 are industry-based. It is important to note that both threats and
opportunities can receive a 1, 2, 3, or 4.
4. Multiply each factor’s weight by its rating to determine a weighted score.
5. Sum the weighted scores for each variable to determine the total weighted
score for the organization.
Regardless of the number of key opportunities and threats included in an EFE
Matrix, the highest possible total weighted score for an organization is 4.0 and the
lowest possible total weighted score is 1.0. The average total weighted score is 2.5. A
total weighted score of 4.0 indicates that an organization is responding in an
outstanding way to existing opportunities and threats in its industry.
2.17 Forecasting Method
Chiang (2016) present that firms had less-than-expected forecast performance
because they relied on using simple forecasting methods, such as moving average,
simple exponential smoothing, and straight-line projection, though more advanced
methods, like regression-based forecasting, times series forecasting, and simulation,
are known and accessible. Forecasts can be obtained in different ways. They are
qualitative, time series method, causal relationship and simulation.
2.17.1 Time Series Method
A time series is a collection of data recorded over a period of time—weekly,
monthly, quarterly, or yearly. A time series can be used by management to make
current decisions and plans based on long-term forecasting. There are four
components to a time series: the trend, the cyclical variation, the seasonal variation,
and the irregular variation.
a. Secular Trend
The long-term trends of sales, employment, stock prices, and other business
and economic series follow various patterns. Some move steadily upward,
others decline, and still others stay the same over time.
b. Cyclical Variation

36
The second component of a time series is cyclical variation. A typical
business cycle consists of a period of prosperity followed by periods of
recession, depression, and then recovery with no fixed duration of the cycle.
There are sizable fluctuations unfolding over more than one year in time
above and below the secular trend.
c. Seasonal Variation
The third component of a time series is the seasonal component. Many sales,
production, and other series fluctuate with the seasons. The unit of time
reported is either quarterly or monthly.
d. Irregular Variation
Many analysts prefer to subdivide the irregular variation into episodic and
residual variations. Episodic fluctuations are unpredictable, but they can be
identified. The initial impact on the economy of a major strike or a war can
be identified, but a strike or war cannot be predicted. After the episodic
fluctuations have been removed, the remaining variation is called the residual
variation. The residual fluctuations, often called chance fluctuations, are
unpredictable, and they cannot be identified. Of course, neither episodic nor
residual variation can be projected into the future.
For the formula of times series method is as follows:
................................................................................................. (2.5)
Where, Y= value of the variable for a selected value of x
a= estimated value when x is zero
b= slope of the line, the average change in Y for each change of
one unit in x.
x= any value of time that is selected

37
2.18 Net Present Value (NPV)
According to (Chaiwat, 2012) Net Present Value is a central tool in
discounted cash flow analysis, and is a standard method for using the time value of
money to appraise long-term projects. Used for capital budgeting, and widely
throughout economics, finance, and accounting, it measures the excess or shortfall of
cash flows, in present value terms, once financing charges are met.
The NPV is calculated using the following formula:
( ) ∑
( )
Or
( ) ∑ ( ⁄ ).................................. (2.6)
Where,
P (i) = the present value of all cash flows at an interest rate i%
At = cash flow at the end of the period
i = interest rate (Minimum Attractive Rate of Return, MARR) or discount
rate
t = the time of the cash flow
N = number of period
If the project is economically feasible, its NPV is greater than zero (NPV >
0).When the NPV is positive; it means that the benefits of the project are greater than
its costs. The NPV criterion is limited in that it cannot be used to rank a number of
alternative investment projects because the NPV of a project is likely to be positively
related to the project’s investment cost or scale (Chaiwat, 2012).
2.19 Benefit- Cost Ratio (B/C ratio)
The B/C ratio is designed to avoid the limitation of the NPV method. Thus, a
project is evaluated in terms of benefits per one monetary unit of cost. A project
would be worth investing in only if it meets the criterion where the B/C ratio is
greater than 1(Chaiwat, 2012). The B/C ratio is calculated using the following
formula:

38
Benefit-cost ratio = (benefit)/ (cost)
∑
( )
∑
( )
.................................................... (2.7)
Where, Ct = present value of cost or cost at time t

39
CHAPTER 3
RESEARCH METHODOLOGY
3.1 Flow Chart
Methods of research can be seen in the flow chart (outside diagram) in figure
3.1 below:
Figure 3.1 Flow Chart of Research Methodology
Literature Review
Re-layout And Renovation for Shipyard
Evaluation of Productivity Factor & Shipyard Capacity
Data Collection
Start
Evaluation of Technical and Economic Terms:
-First Alternative Layout
-Second Alternative layout
Identification and Formulation of the Problem
Conclusion
Selected Alternative
Review of Dalla shipyard
Research Methodology
Improvement of Material
Handling System Increase Shipyard Facilities Improvement of Shipyard
Function

40
3.1.1. Identification and Formulation of the Problem
The identification of problem is a discussion that focuses on the development
of Dalla shipyard. After the identification, the next choose the method or solve the
problem. In this research the shipyard improve facilities, material handling
equipment and re-layout. The alternative layout is determined by using DCF and
NPV method.
3.1.2. Literature Review
Literature review is intended to obtain research results in accordance with the
problems. Theories and references support to understand and determine the method
for this research. More details literature reviews explain in chapter 2.
3.1.3 Data Collection
Most of the data usages obtain from observation and interviews with officer
of Dalla shipyard and some missing data are from papers and books. Data collections
have to support on improving and developing this research. Therefore, all data about
collected directly from the shipyard.
3.1.4 Evaluation of Productivity Factor and Shipyard Capacity
This stage calculates the existing situation of productivity and efficiency of
shipyard capacity. Calculations show how many ships that perform repairs at the
shipyard and how to use the shipyard dock facilities as effectively as possible. After
collecting dock facilities at current situation, it shows how much land is being used
and how many facilities needed for the shipyard.
3.1.5 Re-layout and Renovation for Shipyard
This stage supports re-layout shipyard based on existing shipyard layout. The
re-layout shipyard is good material transportation form warehouse and shop to
slipways. The second alternative layout of transportation time is shorter than exiting
layout. The shipyard need to renovate for machine shop, zone 5, carpenter shop and
pipe and boiler shop.

41
3.1.6 Improved of Material Handling System, Shipyard Function and Increase
Shipyard Facilities
In this stage supports facility for shipyard because the equipment and some
machine are very old. After that Shipyard productivity compares than existing
condition. A crane and a forklift of material handling systems support for better flow
of material. For increasing shipyard facilities, the shipyard supports a new hydraulic
shearing machine for cutting. Therefore, the shipyard function is more quickly and
effective than existing situation.
3.1.7 Evaluation of Technical and Economic Terms
Technical and economic terms evaluate for fist alternative and second
alternative. Technical aspect also involves evaluation of the hardware and the
software requirement of the proposed layout. Economic aspect involves cost and
benefit associated with project layout.
3.1.8 Selected Alternative
According to technical and economic feasibility calculations, the first
alternative and the second alternative are feasible. But productivity of the first
alternative is different as the second alternative. After comparing productivity of
alternative, better productivity of alternative that is selected alternative.
3.1.9 Conclusion
There are an increase or addition of dock facilities such material handling
equipment, warehouse for plate, pipe and boiler shop, machine shops and slipways
repair. Based on a feasibility study, the method Discount Cash Flow, Net Present
Value and Payback period show that Dalla shipyard project is viable or feasible.

42
“This page intentionally left blank”

43
CHAPTER 4
COMPETITIVENESS POSITION OF DALLA SHIPYAD
4.1 SWOT Analysis Method
SWOT analysis is an effective management technique to evaluate the
business environment of an organization both internal and external to analyze the
present status and future prospectus of the firm. All organizations have strengths and
weaknesses in the functional areas of business. No enterprise is equally strong or
weak and opportunity or threat in all areas. The strategy-formulation tool
summarizes and evaluates the major strengths or weaknesses and opportunities or
threats in the functional areas of a business. Based on Ma’ruf (2006) explains the
environment’s characteristics of the middle-sized shipyards are the same, the
proposed models may be considered as generic models not only for the Indonesian
middle-sized shipyards but also for similar shipyards in other countries. Therefore,
all Strategic factors obtained from his research are used in this particular variable.
The factors and the weight include as the table.
Table 4.1 Strategic Factors in Ship Repair (Ma’ruf, 2006)
Internal Strategic Factors External Strategic Factors
Factors and Variables Weight Factors and Variables Weight
Factor 1: Price Quotation (0.46) Factor 1: Interim Supply (0.63)
1.Price Level 0.24 1.Price of material 0.22
2.Employee how-know 0.22 2.Quality of material 0.21
3.Quality of sub-contractor 0.20
Factor 2: Shipyard management (0.21) Factor 2: Maritime Policies (0.21)
3.Company culture 0.11 4.Bank support 0.07
4.Business network 0.10 5.Government support to shipyard 0.07
6.Government support to shipping 0.07
Factor 3: Product performance (0.18) Factor 3: Repair Order (0.16)
5.Delivery time 0.09 7.Domestic market 0.16
6.Quality of product 0.09
Factor 4: Yard Location (0.15)

44
7.Shipyard location 0.15
Total 1.00 1.00
According to table 4.1, the following descriptions are internal factor and
external factor of Dalla shipyard.
4.1.1 Internal Factors
1. Price level (Strength)
Ship repair price is cheaper than other shipyard in this region. The
shipyard has machine shop, carpenter shop, pipe and boiler shop,
bending machine, etc. Private shipyards and other stat-owned
shipyard in this region do not have facilities and machines. Therefore,
the shipyard reduces ship repair cost than other.
2. Employee know-how (Weakness)
Employee know-how price is low. Despite the low labor costs, the
shipbuilding sector is not able to compete internationally due to skills,
shipbuilding rules and regulations, lacking technology.
3. Company Culture (Weakness)
The shipyard management culture is not effective because it has many
management levels. If private ship wants to be repaired, it needs to get
permission from managing director. The shipyard should reduce the
management level become effective level for better productivity and
command engineer make all decision for ship repair work.
4. Business network (Strength)
The shipyard is working together to accomplish certain goals with
some international organization. Dalla shipyard cooperates with JICA
in Japan to increase human resources, technology, standardization and

45
quality control. The shipyard cooperates with India Inland Transport
to build new vessels for Kelantan Project.
5. Delivery time (Weakness)
The shipyard does not finish ship repair in time because facilities and
material handling equipment is not full support for ship repair. The
IWT’ ships are very old and are about 20 years. Therefore, the
shipyard gives more repair service for ships.
6. Quality of product (Strength)
Ship repair quality is good because the shipyard is good reputation.
The shipyard is about 164 years and ship repair experience is good.
The shipyard currently accounts for about 50 percent of repair work
on ships owned by IWT.
7. Shipyard location (Strength)
The shipyard is located in Dalla Township near Yangon City which is
economic city and has import and export harbor from the whole
country. In addition, local inland shipping lines transport cargo and
goods based on Yangon region. Therefore, Dalla shipyard is located
in the most important region and biggest market share region in
Myanmar.
4.1.2 External Factors
1. Price of material (Threat)
Price of material is expansive because all materials are imported from the
neighboring countries. Absence of an organized material and spare parts
supply and basic materials such as steel plates and machineries are imported
from the neighboring countries

46
2. Quality of material (Opportunity)
Quality of material is good because basic materials such plates and
machineries are imported from the neighboring countries.
3. Quality of sub-contractor (Threat)
Quality of sub-contractor is low because the shipbuilding sector is not able to
compete internationally due to skills, shipbuilding rules and regulations,
lacking technology.
4. Bank support (Opportunity)
Myanma Economic bank supports to the shipyard for loan. If the shipyard
needs a loan for buying machine and equipment, Myanma Economic bank
supports it. Asian Development Bank (ADB) identifies possible technical
assistance and investment initiatives for the transport sector for support.
5. Government support to shipyard (Threat)
Government support a little to the shipyard. The potential of the market lies
in the political reforms, with government trying to attract foreign
investments.
6. Government support to shipping (Threat)
Government support a little to the shipping. Foreign investments in shipping
lines for domestic and international will be triggered.
7. Domestic market
Repair orders get from domestic market because the shipyard serve the IWT’
vessels. The shipbuilding industry of Myanmar is still a small scale industry,
which focuses on the construction and maintenance of the domestic inland
cargo and cruise vessels market. Therefore, there are big domestic markets.

47
4.2 Internal Factor Evaluation Matrix
Internal Factor Evaluation matrix is a strategic management tool for auditing
or evaluating major strengths and weaknesses in functional areas of a business.
Internal factor evaluation matrix can be utilized to evaluate how a shipyard is
performing in regards to identified internal strengths and weaknesses of a shipyard.
Internal factor evaluation matrix can be created using the following five steps:
1. Internal factor
Conduct internal audit and identify both strengths and weaknesses in
shipyard. The number of factors has no effect on the range of total
weighted scores because the weights always sum to 1.0.First, list
strengths and then weaknesses. It is wise to be as specific and
objective as possible.
2. Weight
Assign a weight that ranges from 0.00 to 1.00 to each factor. The
weight assigned to a given factor indicates the relative importance of
the factor. Zero means not important. One indicates very important.
Regardless of whether a key factor is an internal strength or weakness,
factors with the greatest importance in shipyard performance should
be assigned the highest weights. After assigning weight to individual
factors, make sure the sum of all weights equals 1.00.
3. Rating
Assign a 1-to-4 rating to each factor to indicate whether that factor
represents a major weakness (rating = 1), a minor weakness (rating =
2), a minor strength (rating = 3), or a major strength (rating = 4). Note
that strengths must receive a 3 or 4 rating and weaknesses must
receive a 1 or 2 rating. Ratings are thus company-based, whereas the
weights in step 2 are industry-based.

48
4. Multiply
Multiply each factor's weight by its rating. This will give a weighted
score for each factor.
5. Sum
Sum the weighted scores for each variable to determine the total
weighted score for the organization.
Table (4.2) Internal Factor Evaluation (Ma’ruf, 2006)
Factor and Variables S / W Weight Rating Weighted
Score
1.Price level S 0.24 3 0.72
2.Employee know-how W 0.22 2 0.44
3.Company culture W 0.11 2 0.22
4.Business network S 0.10 3 0.30
5.Delivery time W 0.09 2 0.18
6.Quality of product S 0.09 3 0.27
7.Shipyard location S 0.15 4 0.60
Total 1.00 2.73
Total weighted score of 2.73 indicates that the business has above 2.5
indicated a strong internal position. (David, 2015)
4.3 External Factor Evaluation Matrix
External factor evaluation matrix method is a strategic-management tool
often used for assessment of current shipyard conditions. The external factor
evaluation matrix is a good tool to visualize and prioritize the opportunities and
threats that a business is facing.
Developing an external factor evaluation matrix is an intuitive process which
works conceptually very much the same way like creating the internal factor
evaluation matrix. The external factor evaluation matrix process uses the same five
steps as the internal factor evaluation matrix.

49
1. External factor
The first step is to gather a list of external factors. Divide factors into two
groups: opportunities and threats.
2. Weight
Assign a weight to each factor. The value of each weight should be between 0
and 1. Zero means the factor is not important. One means that the factor is the
most influential and critical one. The total value of all weights together should
equal 1.
3. Rating
Assign a rating between 1 and 4 to each key external factor to indicate how
effectively the firm’s current strategies respond to the factor, where 4 = the
response is superior, 3 = the response is above average, 2 = the response is
average and 1 = the response is poor.
4. Weight
Multiply each factor weight with its rating. This will calculate the weighted
score for each factor.
5. Sum
Sum the weighted scores for each variable to determine the total weighted score
for the organization.
Table (4.3) External Factor Evaluation (Ma’ruf, 2006)
Factor and Variables O/ T Weight Rating Weighted
Score
1.Price of material T 0.22 2 0.66
2.Quality of material O 0.21 2 0.42
3.Quality of sub-contractor T 0.20 3 0.60
4.Bank support O 0.07 3 0.21

50
5.Government support to shipyard T 0.07 2 0.14
6.Government support to shipping T 0.07 2 0.14
7.Domestic market O 0.16 4 0.64
Total 1.00 2.59
Total weighted score of 2.59 indicates that the business has above 2.5
indicated a high response to its external business environment.
The Strengths-Weaknesses-Opportunities-Threats (SWOT) Matrix is an
important matching tool that helps managers develops four types of strategies: SO
(strengths-opportunities) strategies, WO (weaknesses-opportunities) strategies, ST
(strengths-threats) strategies, and WT (weaknesses-threats) strategies.
Table 4.4 SWOT Matrix (David, 2015)
IFE Factor
EFE Factor
Strengths Weakness
1. Location 1. Company culture
2. Business network 2. Delivery time
3. Price level 3. Employee know-how
4. Quality of product
Opportunities SO strategies WO strategies
1. Domestic market 1. Add facilities (S1,O1,O4) 1. Add material handling
equipment and re-layout
shipyard (W2, O1)
3. Quality of material
4. Bank support
Threats
1. Quality of sub-contractor
2. Government support to
shipyard
3. Government support to
shipping
4. Price of material
As shown in table 4.3, SWOT matrix shows problem of Dalla shipyard,
including: add facilities, add material handling equipment and re-layout.

51
4.4 Forecast
Time series analysis method uses to analyze the future of shipyard increment.
Previous data of ship repair for 5 years use to predict the future of ship repair for 5
years. According to data of ship repair from shipyard, the base year is 2011 year. To
simplify the calculations, the years are replaced by coded values. That is, we let 2011
be 0, 2012 be 1, and so forth. We use the following equations to find the slope, b,
and the intercept, a, to substitute into the linear trend equation (Y=a+bx).
(∑ )(∑ ) (∑ )(∑ )
(∑ ) (∑ )
(∑ ) (∑ )(∑ )
(∑ ) (∑ )
Where, n = Total years from previous data from shipyard
x = number of year (code)
y = actual ship repair
Y = ship repair from shipyard in year(x)
a = the permanent component and demand every year
b = the quantity of demand in the first year
Year Year of code (x) y x2
xy
2011 0 53 0 0
2012 1 51 1 51
2013 2 58 4 116
2014 3 55 9 165
2015 4 57 16 228
Total 10 274 30 560

52
( )( ) ( )( )
( )( ) ( )
( )( ) ( )( )
( )( ) ( )
( )
According to the calculation, shipyard can be repaired 58 vessels for 2016.
Base on those five years ship repair data, we estimated ship repair of shipyard for
2020. The calculations and data are same. The year 2017 is coded 6, 2018 is coded 7,
2019 is coded 8 and 2020 is coded 9. Therefore, the following table shows the
forecast for future 5 years.
Table 4.5 Forecast for Future 5 Years
Year Total vessels
2016 58
2017 59
2018 61
2019 62
2020 63

53
The ship repair in the year becomes to be improved by the current status of
data. The results of predictable pattern show market demand or market growth in the
future.
Figure 4.1 Total Ship Repair Forecast Trend
From the results of analysis using time series method, we can compare the
number of ship repair in Dalla shipyard before and after analysis. The number of ship
repair was increased to get the target market. But it is necessary to know the
possibilities causes or problems experienced in the shipyard.
4.5 Estimation of Shipyard Capacity
There are (14) slipways in Dalla shipyard. The following table shows the
number of slipways and its capacity.
Table 4.6 Number of Slipway and Its Capacity
No Slipway Number Capacity (Ton) Establish Year Remark
1 1 274 1908 Good
2 2 205 1898 Broken
3 3 205 1898 Good
4 Dry Dock 1400 2001 Good
5 5 and 6 125 1892 Broken
6 7 to 12 468 1900 Good
7 13 125 1963 Good
8 14 274 1920 Good
Source: Dalla Shipyard
56
58
60
62
64
2014 2016 2018 2020 2022
NU
MB
ER O
F SH
IPS
YEAR
Forecast Trend Doking 2014-2020
Total shiprepair
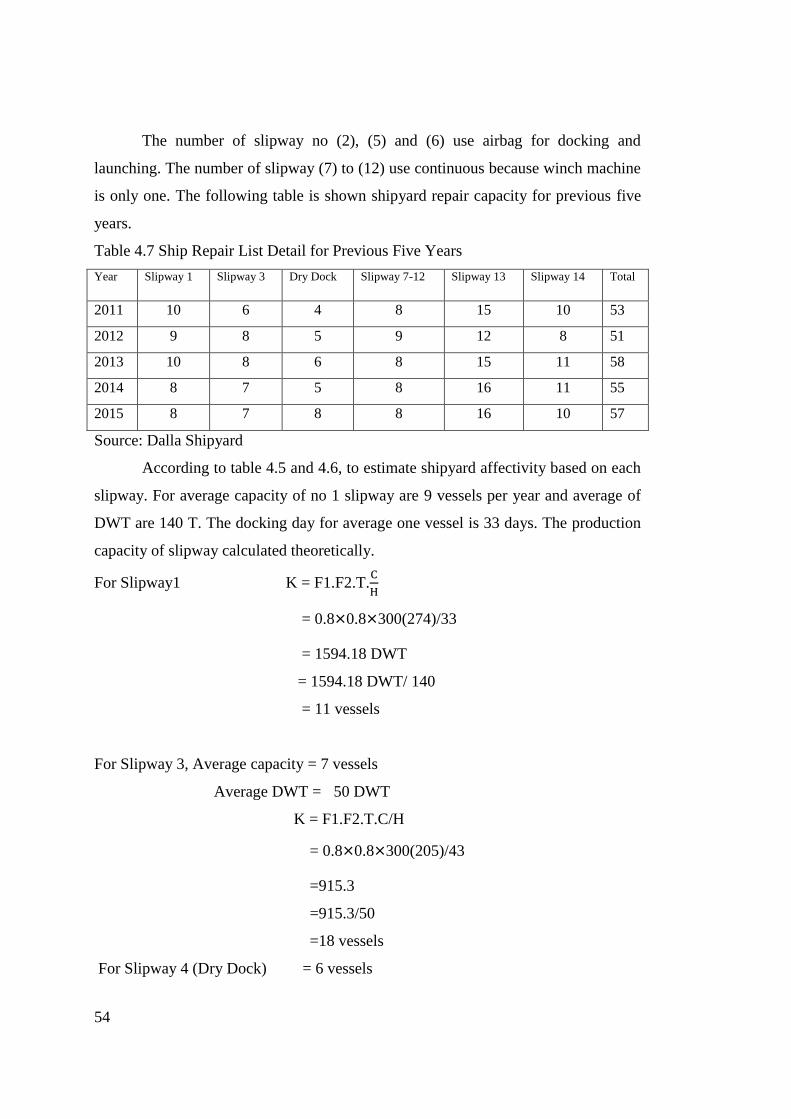
54
The number of slipway no (2), (5) and (6) use airbag for docking and
launching. The number of slipway (7) to (12) use continuous because winch machine
is only one. The following table is shown shipyard repair capacity for previous five
years.
Table 4.7 Ship Repair List Detail for Previous Five Years
Year Slipway 1 Slipway 3 Dry Dock Slipway 7-12 Slipway 13 Slipway 14 Total
2011 10 6 4 8 15 10 53
2012 9 8 5 9 12 8 51
2013 10 8 6 8 15 11 58
2014 8 7 5 8 16 11 55
2015 8 7 8 8 16 10 57
Source: Dalla Shipyard
According to table 4.5 and 4.6, to estimate shipyard affectivity based on each
slipway. For average capacity of no 1 slipway are 9 vessels per year and average of
DWT are 140 T. The docking day for average one vessel is 33 days. The production
capacity of slipway calculated theoretically.
For Slipway1 K = F1.F2.T.
= 0.8×0.8×300(274)/33
= 1594.18 DWT
= 1594.18 DWT/ 140
= 11 vessels
For Slipway 3, Average capacity = 7 vessels
Average DWT = 50 DWT
K = F1.F2.T.C/H
= 0.8×0.8×300(205)/43
=915.3
=915.3/50
=18 vessels
For Slipway 4 (Dry Dock) = 6 vessels
55
For Slipway 7 to 12, Average capacity = 8 vessels
Average DWT = 200 DWT
K = F1.F2.T.C/H
=0.8×0.8×300(462)/38
=2334.3157
=2334.3157/200
=12 vessels
For Slipway 13, Average capacity = 15 vessels
Average DWT = 120 DWT
K = F1.F2.T.C/H
=0.8×0.8×300(125)/20
=1200
=1200/120
=10 vessels
For slipway no 14, Average capacity = 10 vessels
Average DWT = 140 DWT
K = F1.F2.T.C/H
=0.8×0.8×300(274)/30
=1754/140
=13 vessels
Therefore according to theoretically, total capacity for existing layout is 70
vessels. The numbers of existing vessels are sufficient to repair for forecasting
number of vessels. The layout of Dalla shipyard shows in Figure 4.2.

56
Fig
ure 4
.2 D
alla Ship
yard
Lay
out

57
CHAPTER 5
CAPACITY IMPROVEMENT OF SHIPYARD
5.1 Re-layout Shipyard and Shipyard Facility
The conditions of Dalla shipyard that making some changes in order to
rationalize the shipyard as follows: warehouse plate, re-layout shipyard and adding
dock facilities.
Re-layout is changing the existing layout according to the current
requirements. The layout may be re-designed to improve the existing layout or
eliminate the inconvenience of the existing layout. Purpose of the re-layout is to
improve the productivity and efficiency of the shipyard. The existing shipyard layout
has a lot of old facilities and lack of warehouses for storage of plates. The re-layout
is also due to the preparation of the layout of the shipyard. The flow of materials
fulfills reliably and can accelerate the process of repair work on this shipyard. Firstly,
we try to change the existing layout of shipyard to improve capacity of shipyard.
Dalla shipyard does not have steel plate warehouse until now. The shipyard cannot
use foundry shop for a long time. Therefore, the first step proposes to use the foundry
shop location for warehouse plate. The following figure 5.1 shows the first
alternative layout of shipyard.
In the first alternative layout of shipyard, No (14) is steel plate warehouse
because the shipyard keep steel plate in ground. The size of steel plate warehouse is
45 x 13= 585 m2. This warehouse can be stored 600 plates. Zone (5) no (17) is big
building because it is machinery shop and plate and frame assembly shop. The
shipyard has many facilities but some are broken and old. Some buildings can be
repaired and maintained. The table 5.1 shows additional area of facility for the first
alternative layout.

58
Fig
ure 5
.1 F
irst Altern
ative L
ayout o
f Ship
yard
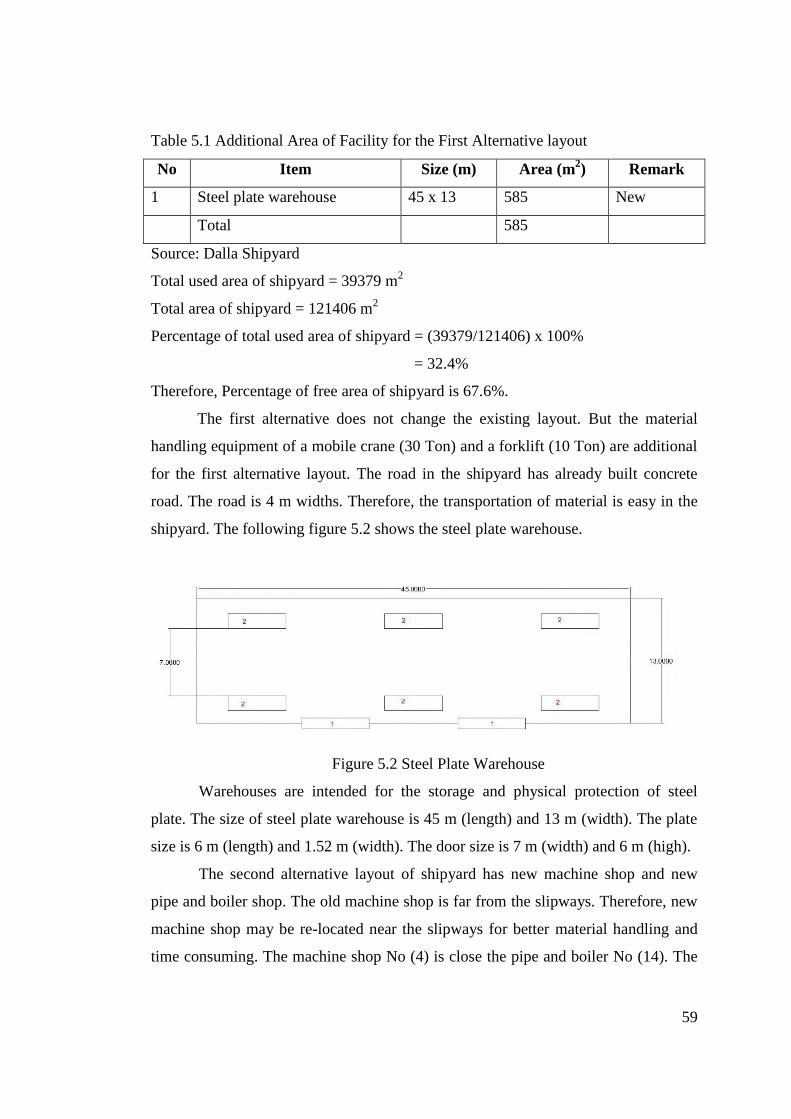
59
Table 5.1 Additional Area of Facility for the First Alternative layout
No Item Size (m) Area (m2) Remark
1 Steel plate warehouse 45 x 13 585 New
Total 585
Source: Dalla Shipyard
Total used area of shipyard = 39379 m2
Total area of shipyard = 121406 m2
Percentage of total used area of shipyard = (39379/121406) x 100%
= 32.4%
Therefore, Percentage of free area of shipyard is 67.6%.
The first alternative does not change the existing layout. But the material
handling equipment of a mobile crane (30 Ton) and a forklift (10 Ton) are additional
for the first alternative layout. The road in the shipyard has already built concrete
road. The road is 4 m widths. Therefore, the transportation of material is easy in the
shipyard. The following figure 5.2 shows the steel plate warehouse.
Figure 5.2 Steel Plate Warehouse
Warehouses are intended for the storage and physical protection of steel
plate. The size of steel plate warehouse is 45 m (length) and 13 m (width). The plate
size is 6 m (length) and 1.52 m (width). The door size is 7 m (width) and 6 m (high).
The second alternative layout of shipyard has new machine shop and new
pipe and boiler shop. The old machine shop is far from the slipways. Therefore, new
machine shop may be re-located near the slipways for better material handling and
time consuming. The machine shop No (4) is close the pipe and boiler No (14). The
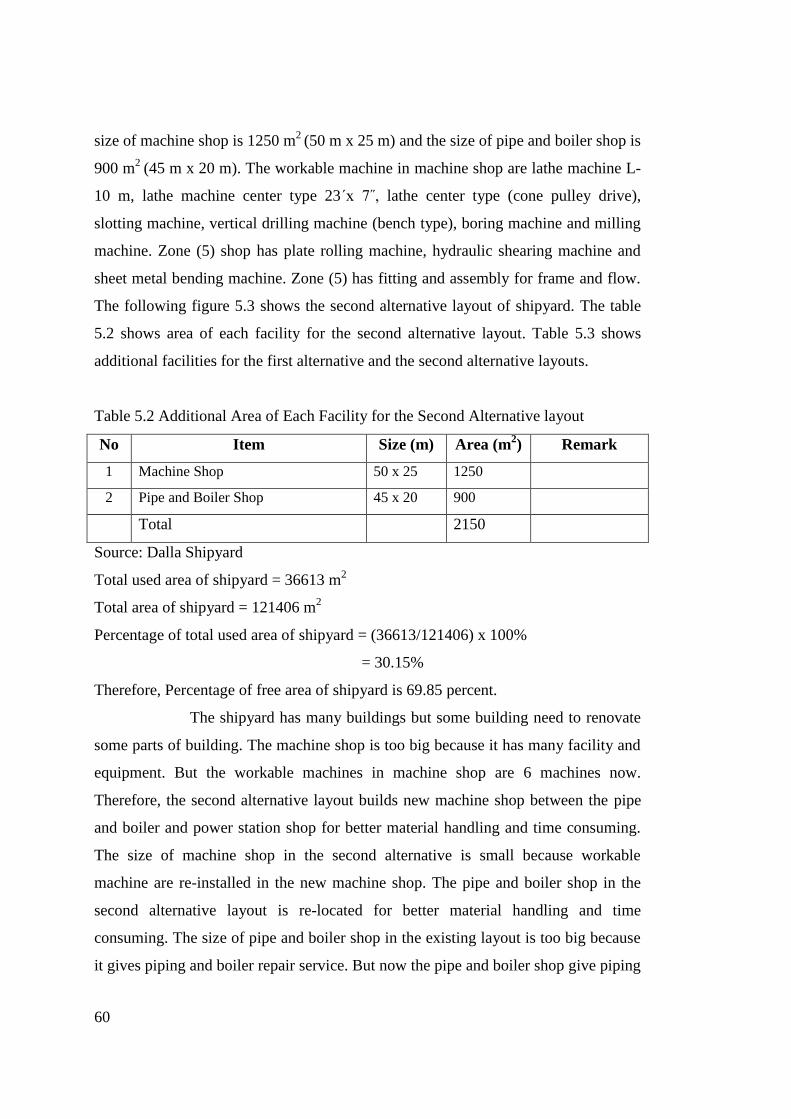
60
size of machine shop is 1250 m2
(50 m x 25 m) and the size of pipe and boiler shop is
900 m2
(45 m x 20 m). The workable machine in machine shop are lathe machine L-
10 m, lathe machine center type 23ˊx 7˝, lathe center type (cone pulley drive),
slotting machine, vertical drilling machine (bench type), boring machine and milling
machine. Zone (5) shop has plate rolling machine, hydraulic shearing machine and
sheet metal bending machine. Zone (5) has fitting and assembly for frame and flow.
The following figure 5.3 shows the second alternative layout of shipyard. The table
5.2 shows area of each facility for the second alternative layout. Table 5.3 shows
additional facilities for the first alternative and the second alternative layouts.
Table 5.2 Additional Area of Each Facility for the Second Alternative layout
No Item Size (m) Area (m2) Remark
1 Machine Shop 50 x 25 1250
2 Pipe and Boiler Shop 45 x 20 900
Total 2150
Source: Dalla Shipyard
Total used area of shipyard = 36613 m2
Total area of shipyard = 121406 m2
Percentage of total used area of shipyard = (36613/121406) x 100%
= 30.15%
Therefore, Percentage of free area of shipyard is 69.85 percent.
The shipyard has many buildings but some building need to renovate
some parts of building. The machine shop is too big because it has many facility and
equipment. But the workable machines in machine shop are 6 machines now.
Therefore, the second alternative layout builds new machine shop between the pipe
and boiler and power station shop for better material handling and time consuming.
The size of machine shop in the second alternative is small because workable
machine are re-installed in the new machine shop. The pipe and boiler shop in the
second alternative layout is re-located for better material handling and time
consuming. The size of pipe and boiler shop in the existing layout is too big because
it gives piping and boiler repair service. But now the pipe and boiler shop give piping

61
service only. Therefore, the size of the pipe and boiler shop in the second alternative
layout is small. The second alternative layout renovates the store 1for warehouse
plate. The warehouse plate in the second alternative layout is the store 1.
Table 5.3 Additional Facilities for the First Alternative and the Second Alternative
Layouts
Name of Item Capacity Number Remark
Forklift 10 Ton 1 New (replaced one of the
old ones)
Mobile Crane 30 Ton 1 New
Hydraulic Shearing Machine ( 3 m
x 8 mm)
≥8 / min 1 New
The number of existing material handling equipment in the shipyard is
sufficient but the capacity of material handling is not sufficient. Therefore, the first
and the second alternative layouts are additional of a new mobile crane (30 Ton) and
a new forklift (10 Ton). The new hydraulic shearing machine is additional facilities
because the existing hydraulic shearing machine is broken two years ago. The first
and the second alternative layout is the same material handling equipment and
facilities. But the second alternative re-locates machine shop and pipe and boiler
shop near the slipways for better material handling and time consuming. Therefore,
the first and the second alternative layout is the different layout.
For two ways, they are mobile truck and ship. The warehouse plate location is
good for truck and ship. And then, warehouse plate supply the plate each slipways.
The shipyard own 30 acres or 12.146 hectare. Percentage of total used area of
shipyard is 32.4 percent. Therefore, the shipyard fills and builds facilities and new
buildings. But the shipyard has a lot of building near the slipways. The first
alternative layout builds at location of foundry shop for warehouse plate. The first
and second alternative layout use 32.4percent of land. Therefore, 67.6 percent of land
can be used for further development if the shipyard received the new shipbuilding.

62
Fig
ure 5
.3 S
econd altern
ative lay
out o
f ship
yard
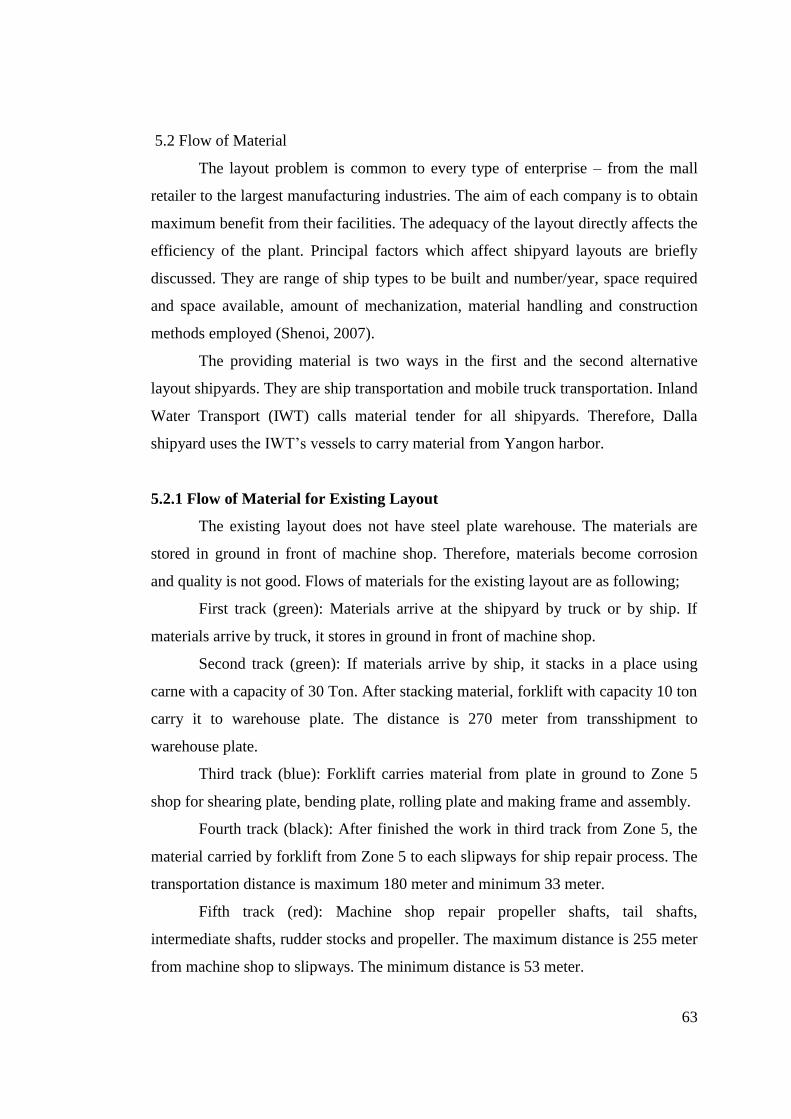
63
5.2 Flow of Material
The layout problem is common to every type of enterprise – from the mall
retailer to the largest manufacturing industries. The aim of each company is to obtain
maximum benefit from their facilities. The adequacy of the layout directly affects the
efficiency of the plant. Principal factors which affect shipyard layouts are briefly
discussed. They are range of ship types to be built and number/year, space required
and space available, amount of mechanization, material handling and construction
methods employed (Shenoi, 2007).
The providing material is two ways in the first and the second alternative
layout shipyards. They are ship transportation and mobile truck transportation. Inland
Water Transport (IWT) calls material tender for all shipyards. Therefore, Dalla
shipyard uses the IWT’s vessels to carry material from Yangon harbor.
5.2.1 Flow of Material for Existing Layout
The existing layout does not have steel plate warehouse. The materials are
stored in ground in front of machine shop. Therefore, materials become corrosion
and quality is not good. Flows of materials for the existing layout are as following;
First track (green): Materials arrive at the shipyard by truck or by ship. If
materials arrive by truck, it stores in ground in front of machine shop.
Second track (green): If materials arrive by ship, it stacks in a place using
carne with a capacity of 30 Ton. After stacking material, forklift with capacity 10 ton
carry it to warehouse plate. The distance is 270 meter from transshipment to
warehouse plate.
Third track (blue): Forklift carries material from plate in ground to Zone 5
shop for shearing plate, bending plate, rolling plate and making frame and assembly.
Fourth track (black): After finished the work in third track from Zone 5, the
material carried by forklift from Zone 5 to each slipways for ship repair process. The
transportation distance is maximum 180 meter and minimum 33 meter.
Fifth track (red): Machine shop repair propeller shafts, tail shafts,
intermediate shafts, rudder stocks and propeller. The maximum distance is 255 meter
from machine shop to slipways. The minimum distance is 53 meter.

64
Sixth track (yellow): Pipe and boiler shop repair ballast pipe line system, fire
pipe line system, cooling pipe line, fuel pipe line, fresh water pipe line, auxiliary pipe
line and fuel tank. Pipe and boiler shop is close the slipways. Figure 5.4 shows flows
of materials for existing layout. To improve the effectiveness of the use of
equipment, facilities and manpower in the flow of material handling, it is necessary
to determine a standard job and standard time. Standard time is derived by adding to
normal time allowances. The following formula shows standard time.
( )
Based on flow of material for existing layout, transportation of plate
performance rating used is as follows:
The highest rating for the use of this type of equipment and manpower
good level of proficiency: 60% to 80%.
The lowest rating for the use of this type of equipment and manpower
sufficient proficiency: 110% to 120%.
Allowance based on research and experience 10 percent of normal time
(Sukanto, 1986).

65
Fig
ure
5.4
F
low
s of
mat
eria
ls
for
exis
ting
layout

66
The distance is 230 meter from plate in ground (44) to zone 5 shop no
(17).The figure 5.4 shows flow of material for existing layout. Standard time for
transportation time 47 minutes are as following:
The highest rating for the use of this type of equipment and manpower good
level of proficiency: 60% to 80%.
= 47 x 60%
= 47 x 0.6
= 28.2 minutes
( )
= 28.2 + 10% (28.2)
= 28.2 + 2.82
= 31.02 minutes
For go and back = 2 x 31.02 minutes
= 62.04 minutes
The lowest rating for the use of this type of equipment and manpower sufficient
proficiency: 110% to 120%.
= 47 x 110%
= 47 x 1.1
= 51.7 minutes
( )
= 51.7 + 10% (51.7)
= 51.7 + 5.17
= 56.87 minutes
For go and back = 2 x 56.87
= 113.74 minutes
The difference between existing layout and first alternative layout is steel
plate warehouse. The other facilities are same.
67
5.2.2 Flow of Material for the First Alternative layout
Flows of materials of the first alternative layout are as following;
First track (green): Materials arrive at the shipyard by truck or by ship. If
materials arrive by truck, it stores in warehouse plate.
Second track (green): If materials arrive by ship, it stacks in a place using
carne with a capacity of 30 Ton. After stacking material, forklift with capacity 10 ton
carry it to warehouse plate. The distance is 250 meter from transshipment to
warehouse plate.
Third track (blue): Forklift carries material from the warehouse to Zone 5
shop for shearing plate, bending plate, rolling plate and making frame and assembly.
Fourth track (black): After finished the work in third track from Zone 5, the
material carried by forklift from Zone 5 to each slipways for ship repair process. The
transportation distance is maximum 180 meter and minimum 33 meter. The figure
5.5 shows flow of material for the first alternative layout.
Fifth track (red): Machine shop repair propeller shafts, tail shafts,
intermediate shafts, rudder stocks and propeller. The maximum distance is 255 meter
from machine shop to slipways. The minimum distance is 53 meter.
Sixth track (yellow): Pipe and boiler shop repair ballast pipe line system, fire
pipe line system, cooling pipe line, fuel pipe line, fresh water pipe line, auxiliary pipe
line and fuel tank. Pipe and boiler shop is close the slipways. Small shop is
close each slipway to store welding machine, electrode, electric grinders and others.
CNC shop sometimes use for new shipbuilding. Carpenter shop repair such as tables,
chairs, window, door and furniture. Electrical shop repair electric motor, steering
control system, electric bulbs, searchlight, pilot light and lighting system. To
improve the effectiveness of the use of equipment, facilities and manpower in the
flow of material handling, it is necessary to determine a standard job and standard
time. Minimum required time is derived by adding to normal time allowances. The
following formula shows standard time.
( )

68
Fig
ure 5
.5 F
low
of m
aterial for first altern
ative

69
Based on flow of material for fist alternative layout, transportation of plate
performance rating used is as follows:
The highest rating for the use of this type of equipment and manpower
good level of proficiency: 60% to 80%.
The lowest rating for the use of this type of equipment and manpower
sufficient proficiency: 110% to 120%.
Allowance based on research and experience 10 percent of normal time
(Sukanto, 1986). The distance is 90 meter from steel plate warehouse (14) to zone
5 shop no (17). Standard time for transportation time 18 minutes are as following:
The highest rating for the use of this type of equipment and manpower good
level of proficiency: 60% to 80%.
= 18 x 60%
= 18 x 0.6
= 10.8 minutes
( )
= 10.8 + 10% (10.8)
= 10.8 + 1.08
= 11.88 minutes
For go and back = 2 x 11.88 minutes
= 23.76 minutes
The lowest rating for the use of this type of equipment and manpower sufficient
proficiency: 110% to 120%.
= 18 x 110%
= 18 x 1.1
= 19.8 minutes
( )
= 19.8 + 10% (19.8)

70
= 19.8 + 1.98
= 21.78 minutes
For go and back = 2 x21.78
= 43.56 minutes
The difference between existing layout and first alternative layout is steel
plate warehouse. The other facilities are same.
The distance is 33 meter from Zone 5 (17) to slipways No 14. Standard time
for transportation time 8 minutes are as following:
The highest rating for the use of this type of equipment and manpower good
level of proficiency: 60% to 80%.
= 8 x 60%
= 8 x 0.6
= 4.8 minutes
( )
= 4.8 + 10% (4.8)
= 4.8 + 0.48
= 5.28 minutes
For go and back = 2 x 5.28 minutes
= 10.56 minutes
The lowest rating for the use of this type of equipment and manpower sufficient
proficiency: 110% to 120%.
= 8 x 110%
= 8 x 1.1
= 8.8 minutes
( )
= 8.8 + 10% (8.8)
= 8.8 + 0.88

71
= 9.68 minutes
For go and back = 2 x 9.68
= 19.36 minutes
For 22 meter distance from Zone 5 (17) to slipways No 13, Standard time for
transportation time 5 minutes are as following:
The highest rating for the use of this type of equipment and manpower good
level of proficiency: 60% to 80%.
= 5 x 60%
= 5 x 0.6
= 3 minutes
( )
= 3 + 10% (3)
= 3 + 0.3
= 3.3 minutes
For go and back = 2 x 3.3
= 6.6 minutes
The lowest rating for the use of this type of equipment and manpower sufficient
proficiency: 110% to 120%.
= 5 x 110%
= 5 x 1.1
= 5.5 minutes
( )
= 5.5 + 10% (5.5)
= 5.5 + 0.55
= 6.05 minutes
For go and back = 2 x 6.05

72
= 12.1
For 70 meter distance from Zone 5 (17) to slipways No 7-12, Standard time
for transportation time 15 minutes are as following:
The highest rating for the use of this type of equipment and manpower good
level of proficiency: 60% to 80%.
= 15 x 60%
= 15 x 0.6
= 9 minutes
( )
= 9 + 10% (9)
= 9 + 0.9
= 9.9 minutes
For go and back = 2 x 9.9
= 19.8 minutes
The lowest rating for the use of this type of equipment and manpower sufficient
proficiency: 110% to 120%.
= 15 x 110%
= 15 x 1.1
= 16.5 minutes
( )
= 16.5 + 10% (16.5)
= 16.5 + 1.65
= 18.15 minutes
For go and back = 2 x 18.15
= 36.3 minutes

73
For 150 meter distance from Zone 5 (17) to dry dock, Standard time for
transportation time 30 minutes are as following:
The highest rating for the use of this type of equipment and manpower good
level of proficiency: 60% to 80%.
= 30 x 60%
= 30 x 0.6
= 18 minutes
( )
= 18 + 10% (18)
= 18 + 1.8
= 19.8 minutes
For go and back = 2 x 19.8
= 39.6 minutes
The lowest rating for the use of this type of equipment and manpower sufficient
proficiency: 110% to 120%.
= 30 x 110%
= 30 x 1.1
= 33 minutes
( )
= 33 + 10% (33)
= 33 + 3.3
= 36.5 minutes
For go and back = 2 x 36.5
= 72.6 minutes
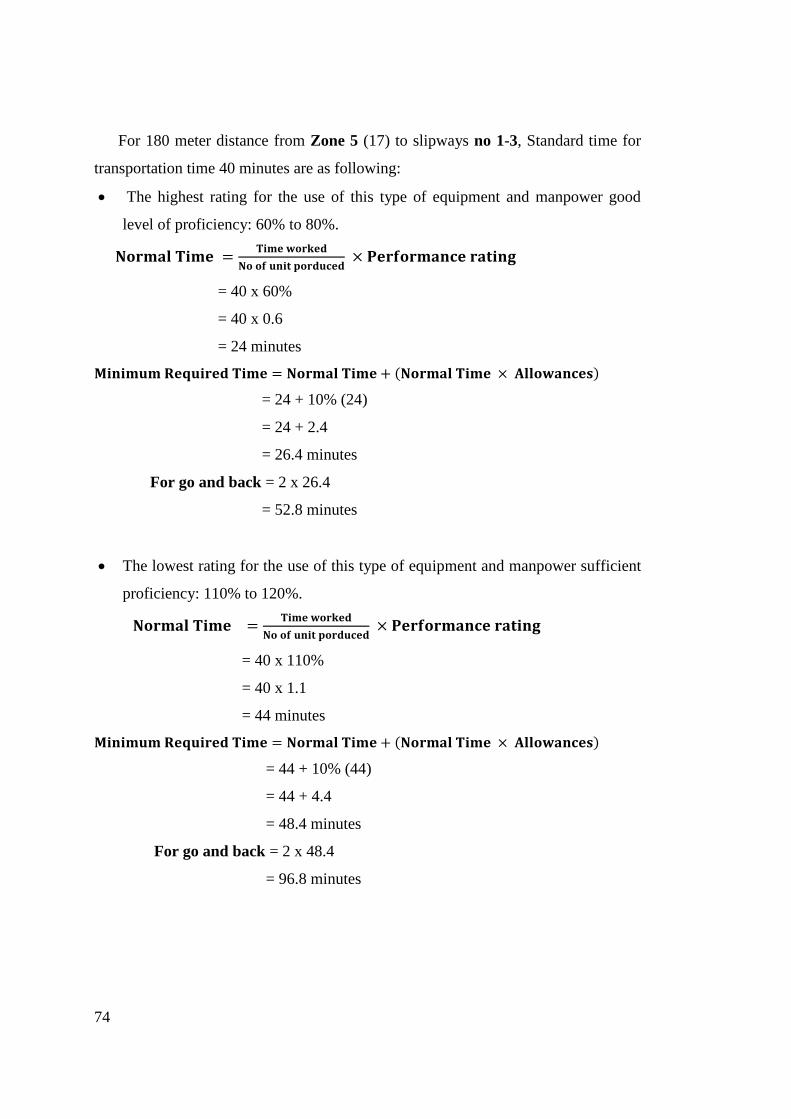
74
For 180 meter distance from Zone 5 (17) to slipways no 1-3, Standard time for
transportation time 40 minutes are as following:
The highest rating for the use of this type of equipment and manpower good
level of proficiency: 60% to 80%.
= 40 x 60%
= 40 x 0.6
= 24 minutes
( )
= 24 + 10% (24)
= 24 + 2.4
= 26.4 minutes
For go and back = 2 x 26.4
= 52.8 minutes
The lowest rating for the use of this type of equipment and manpower sufficient
proficiency: 110% to 120%.
= 40 x 110%
= 40 x 1.1
= 44 minutes
( )
= 44 + 10% (44)
= 44 + 4.4
= 48.4 minutes
For go and back = 2 x 48.4
= 96.8 minutes

75
For 255 meter distance from Machine shop (4) to slipways no 14, Standard time
for transportation time 55 minutes are as following:
The highest rating for the use of this type of equipment and manpower good
level of proficiency: 60% to 80%.
= 55 x 60%
= 55 x 0.6
= 33 minutes
( )
= 33 + 10% (33)
= 33 + 3.3
= 36.3 minutes
For go and back = 2 x 36.3
= 72.6 minutes
The lowest rating for the use of this type of equipment and manpower sufficient
proficiency: 110% to 120%.
= 55 x 110%
= 55 x 1.1
= 60.5 minutes
( )
= 60.5 + 10% (60.5)
= 60.5 + 6.05
= 66.55 minutes
For go and back = 2 x 66.55
= 133.1 minutes

76
For 270 meter distance from Machine shop (4) to slipways no 13, Standard
time for transportation time 60 minutes are as following:
The highest rating for the use of this type of equipment and manpower good
level of proficiency: 60% to 80%.
= 60 x 60%
= 60 x 0.6
= 36 minutes
( )
= 36 + 10% (36)
= 36 + 3.6
= 39.6 minutes
For go and back = 2 x 39.6
= 79.2 minutes
The lowest rating for the use of this type of equipment and manpower sufficient
proficiency: 110% to 120%.
= 60 x 110%
= 60 x 1.1
= 66 minutes
( )
= 66 + 10% (66)
= 66 + 6.6
= 72.6 minutes
For go and back = 2 x 72.6
= 145.2 minutes

77
For 220 meter distance from Machine shop (4) to slipways no 7-12, Standard
time for transportation time 45 minutes are as following:
The highest rating for the use of this type of equipment and manpower good
level of proficiency: 60% to 80%.
= 45 x 60%
= 45 x 0.6
= 27 minutes
( )
= 27 + 10% (27)
= 27 + 2.7
= 29.7 minutes
For go and back = 2 x 29.7
= 59.4 minutes
The lowest rating for the use of this type of equipment and manpower sufficient
proficiency: 110% to 120%.
= 45 x 110%
= 45 x 1.1
= 49.5 minutes
( )
= 49.5 + 10% (49.5)
= 49.5 + 4.95
= 54.45 minutes
For go and back = 2 x 54.45
= 108.9 minutes

78
For 110 meter distance from Machine shop (4) to dry dock, Standard time
for transportation time 23 minutes are as following:
The highest rating for the use of this type of equipment and manpower good
level of proficiency: 60% to 80%.
= 23 x 60%
= 23 x 0.6
= 13.8 minutes
( )
= 13.8 + 10% (13.8)
= 13.8 + 1.38
= 15.18 minutes
For go and back = 2 x 15.18
= 30.36 minutes
The lowest rating for the use of this type of equipment and manpower sufficient
proficiency: 110% to 120%.
= 23 x 110%
= 23 x 1.1
= 25.3 minutes
( )
= 25.3 + 10% (25.3)
= 25.3 + 2.53
= 27.83 minutes
For go and back = 2 x 27.83
= 55.66 minutes

79
For 53 meter distance Machine shop (4) to slipways no 1 - 3, Standard time
for transportation time 10 minutes are as following:
The highest rating for the use of this type of equipment and manpower good
level of proficiency: 60% to 80%.
= 10 x 60%
= 10 x 0.6
= 6 minutes
( )
= 6 + 10% (6)
= 6 + 0.6
= 6.6 minutes
For go and back = 2 x 6.6
= 13.2 minutes
The lowest rating for the use of this type of equipment and manpower sufficient
proficiency: 110% to 120%.
= 10 x 110%
= 10 x 1.1
= 11 minutes
( )
= 11 + 10% (11)
= 11 + 1.1
= 12.1 minutes
For go and back = 2 x 12.1
= 24.2 minutes

80
For 140 meter distance from Pipe and boiler shop (12) to slipways no 14,
Standard time for transportation time 27 minutes are as following:
The highest rating for the use of this type of equipment and manpower good
level of proficiency: 60% to 80%.
= 27 x 60%
= 27 x 0.6
= 16.2 minutes
( )
= 16.2 + 10% (16.2)
= 16.2 + 1.62
= 17.82 minutes
For go and back = 2 x 17.82
= 35.64 minutes
The lowest rating for the use of this type of equipment and manpower sufficient
proficiency: 110% to 120%.
= 27 x 110%
= 27 x 1.1
= 29.7 minutes
( )
= 29.7 + 10% (29.7)
= 29.7 + 2.97
= 32.67 minutes
For go and back = 2 x 32.67
= 65.34 minutes

81
For 90 meter distance from Pipe and boiler shop (12) to slipways no 13,
Standard time for transportation time 18 minutes are as following:
The highest rating for the use of this type of equipment and manpower good
level of proficiency: 60% to 80%.
= 18 x 60%
= 18 x 0.6
= 10.8 minutes
( )
= 10.8 + 10% (10.8)
= 10.8 + 1.08
= 11.88 minutes
For go and back = 2 x 11.88
= 23.76 minutes
The lowest rating for the use of this type of equipment and manpower sufficient
proficiency: 110% to 120%.
= 18 x 110%
= 18 x 1.1
= 19.8 minutes
( )
= 19.8 + 10% (19.8)
= 19.8 + 1.98
= 21.78 minutes
For go and back = 2 x 21.78
= 43.56 minutes

82
For 60 meter distance from Pipe and boiler shop (12) to slipways no 7-12,
Standard time for transportation time 15 minutes are as following:
The highest rating for the use of this type of equipment and manpower good
level of proficiency: 60% to 80%.
= 15 x 60%
= 15 x 0.6
= 9 minutes
( )
= 9 + 10% (9)
= 9 + 0.9
= 9.9 minutes
For go and back = 2 x 9.9
= 19.8 minutes
The lowest rating for the use of this type of equipment and manpower sufficient
proficiency: 110% to 120%.
= 15 x 110%
= 15 x 1.1
= 16.5 minutes
( )
= 16.5 + 10% (16.5)
= 16.5 + 1.65
= 18.15 minutes
For go and back = 2 x 18.15
= 36.3 minutes

83
For 85 meter distance from Pipe and boiler shop (12) to dry dock, Standard
time for transportation time 18 minutes are as following:
The highest rating for the use of this type of equipment and manpower good
level of proficiency: 60% to 80%.
= 18 x 60%
= 18 x 0.6
= 10.8 minutes
( )
= 10.8 + 10% (10.8)
= 10.8 + 1.08
= 11.88 minutes
For go and back = 2 x 11.88
= 23.76 minutes
The lowest rating for the use of this type of equipment and manpower sufficient
proficiency: 110% to 120%.
= 18 x 110%
= 18 x 1.1
= 19.8 minutes
( )
= 19.8 + 10% (19.8)
= 19.8 + 1.98
= 21.78 minutes
For go and back = 2 x 21.78
= 43.56 minutes

84
For 120 meter distance from Pipe and boiler shop (12) to slipways no 1-3,
Standard time for transportation time 25 minutes are as following:
The highest rating for the use of this type of equipment and manpower good
level of proficiency: 60% to 80%.
= 25 x 60%
= 25 x 0.6
= 15 minutes
( )
= 15 + 10% (15)
= 15 + 1.5
= 16.5 minutes
For go and back = 2 x 16.5
= 33 minutes
The lowest rating for the use of this type of equipment and manpower sufficient
proficiency: 110% to 120%.
= 25 x 110%
= 25 x 1.1
= 27.5 minutes
( )
= 27.5 + 10% (27.5)
= 27.5 + 2.75
= 30.25 minutes
For go and back = 2 x 30.25
= 60.5 minutes

85
5.2.3 Flow of Material for the Second Alternative layout
Flow of material for second alternative layout is shown in figure 5.6. Flows
of material for the second alternative layout are as following;
First track (green): Materials arrive at the shipyard by truck or by ship. If
materials arrive by truck, it stores in warehouse plate.
Second track (green): If materials arrive by ship, it stacks in a place using
carne with a capacity of 30 Ton. After stacking material, forklift with capacity 10 ton
carry it to warehouse plate. The distance is 100 meter from transshipment to
warehouse plate.
Third track (green): Forklift carries material from the warehouse to Zone 5
shop for shearing plate, bending plate, rolling plate and making frame and assembly.
Fourth track (black): After finished the work in third track from Zone 5, the
material carried by forklift from Zone 5 to each slipways for ship repair process. The
transportation distance is maximum 180 meter and minimum 33 meter.
Fifth track (red): Machine shop repair propeller shafts, tail shafts,
intermediate shafts, rudder stocks and propeller. The maximum distance is 150 meter
from machine shop to slipways. The minimum distance is 53 meter.
Sixth track (yellow): Pipe and boiler shop repair ballast pipe line system, fire
pipe line system, cooling pipe line, fuel pipe line, fresh water pipe line, auxiliary pipe
line and fuel tank. Pipe and boiler shop is close the slipways.
To improve the effectiveness of the use of equipment, facilities and
manpower in the flow of material handling, it is necessary to determine a standard
job and standard time. Standard time is derived by adding to normal time allowances.
The following formula shows standard time.
( )
Based on flow of material for fist alternative layout, transportation of plate
performance rating used is as follows:
The highest rating for the use of this type of equipment and manpower
good level of proficiency: 60% to 80%.
The lowest rating for the use of this type of equipment and manpower
sufficient proficiency: 110% to 120%.

86
Allowance based on research and experience 10% of normal time (Sukanto,
1986). The distance is 95 meter from steel plate warehouse (14) to zone 5 shop no
(17). Standard time for transportation time 18 minutes are as following:
The highest rating for the use of this type of equipment and manpower good
level of proficiency: 60% to 80%.
= 18 x 60%
= 18 x 0.6
= 10.8 minutes
( )
= 10.8 + 10% (10.8)
= 10.8 + 1.08
= 11.88 minutes
For go and back = 2 x 11.88 minutes
= 23.76 minutes
The lowest rating for the use of this type of equipment and manpower sufficient
proficiency: 110% to 120%.
= 18 x 110%
= 18 x 1.1
= 19.8 minutes
( )
= 19.8 + 10% (19.8)
= 19.8 + 1.98
= 21.78 minutes
For go and back = 2 x21.78
= 43.56 minutes

87
The distance is 33 meter from Zone 5 (17) to slipways No 14. Standard time
for transportation time 8 minutes are as following:
The highest rating for the use of this type of equipment and manpower good
level of proficiency: 60% to 80%.
= 8 x 60%
= 8 x 0.6
= 4.8 minutes
( )
= 4.8 + 10% (4.8)
= 4.8 + 0.48
= 5.28 minutes
For go and back = 2 x 5.28 minutes
= 10.56 minutes
The lowest rating for the use of this type of equipment and manpower sufficient
proficiency: 110% to 120%.
= 8 x 110%
= 8 x 1.1
= 8.8 minutes
( )
= 8.8 + 10% (8.8)
= 8.8 + 0.88
= 9.68 minutes
For go and back = 2 x 9.68
= 19.36 minutes

88
Fig
ure 5
.6 F
low
of M
aterial for S
econd A
lternativ
e

89
For 22 meter distance from Zone 5 (17) to slipways No 13, Standard time for
transportation time 5 minutes are as following:
The highest rating for the use of this type of equipment and manpower good
level of proficiency: 60% to 80%.
= 5 x 60%
= 5 x 0.6
= 3 minutes
( )
= 3 + 10% (3)
= 3 + 0.3
= 3.3 minutes
For go and back = 2 x 3.3
= 6.6 minutes
The lowest rating for the use of this type of equipment and manpower sufficient
proficiency: 110% to 120%.
= 5 x 110%
= 5 x 1.1
= 5.5 minutes
( )
= 5.5 + 10% (5.5)
= 5.5 + 0.55
= 6.05 minutes
For go and back = 2 x 6.05
= 12.1

90
For 70 meter distance from Zone 5 (17) to slipways No 7-12, Standard time
for transportation time 15 minutes are as following:
The highest rating for the use of this type of equipment and manpower good
level of proficiency: 60% to 80%.
= 15 x 60%
= 15 x 0.6
= 9 minutes
( )
= 9 + 10% (9)
= 9 + 0.9
= 9.9 minutes
For go and back = 2 x 9.9
= 19.8 minutes
The lowest rating for the use of this type of equipment and manpower sufficient
proficiency: 110% to 120%.
= 15 x 110%
= 15 x 1.1
= 16.5 minutes
( )
= 16.5 + 10% (16.5)
= 16.5 + 1.65
= 18.15 minutes
For go and back = 2 x 18.15
= 36.3 minutes

91
For 150 meter distance from Zone 5 (17) to dry dock, Standard time for
transportation time 30 minutes are as following:
The highest rating for the use of this type of equipment and manpower good
level of proficiency: 60% to 80%.
= 30 x 60%
= 30 x 0.6
= 18 minutes
( )
= 18 + 10% (18)
= 18 + 1.8
= 19.8 minutes
For go and back = 2 x 19.8
= 39.6 minutes
The lowest rating for the use of this type of equipment and manpower sufficient
proficiency: 110% to 120%.
= 30 x 110%
= 30 x 1.1
= 33 minutes
( )
= 33 + 10% (33)
= 33 + 3.3
= 36.5 minutes
For go and back = 2 x 36.5
= 72.6 minutes
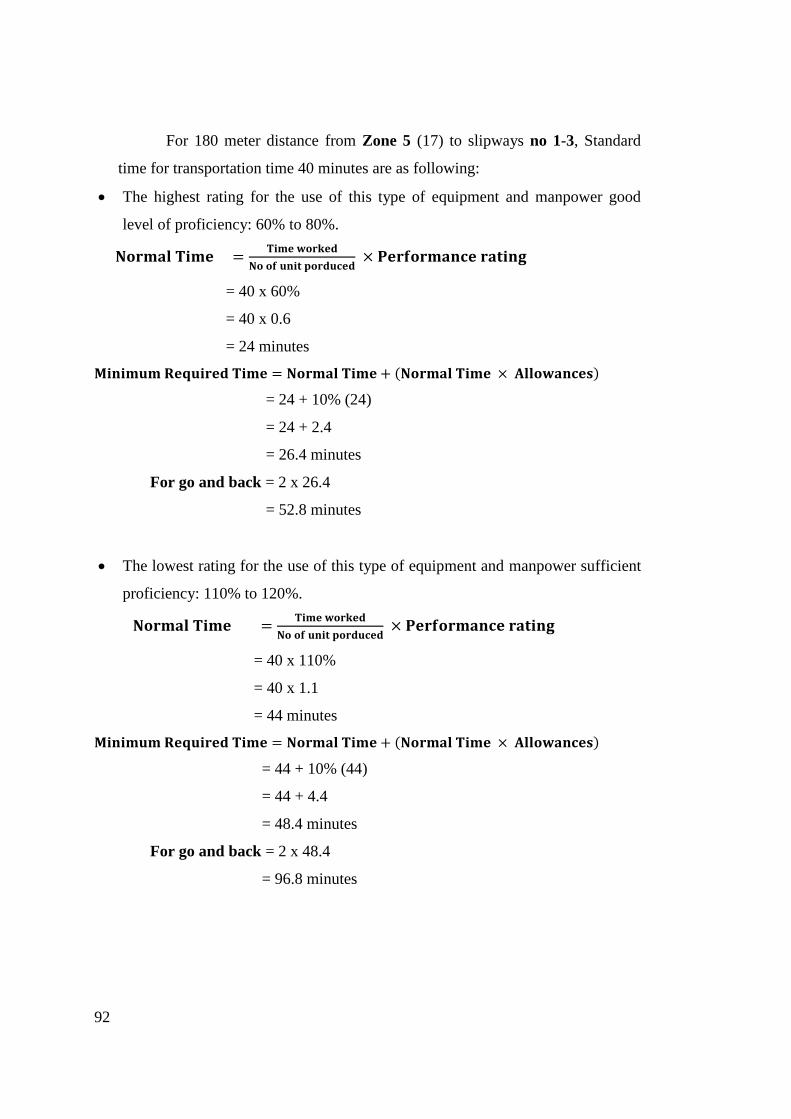
92
For 180 meter distance from Zone 5 (17) to slipways no 1-3, Standard
time for transportation time 40 minutes are as following:
The highest rating for the use of this type of equipment and manpower good
level of proficiency: 60% to 80%.
= 40 x 60%
= 40 x 0.6
= 24 minutes
( )
= 24 + 10% (24)
= 24 + 2.4
= 26.4 minutes
For go and back = 2 x 26.4
= 52.8 minutes
The lowest rating for the use of this type of equipment and manpower sufficient
proficiency: 110% to 120%.
= 40 x 110%
= 40 x 1.1
= 44 minutes
( )
= 44 + 10% (44)
= 44 + 4.4
= 48.4 minutes
For go and back = 2 x 48.4
= 96.8 minutes

93
For 150 meter distance from Machine shop (4) to slipways no 14, Standard
time for transportation time 30 minutes are as following:
The highest rating for the use of this type of equipment and manpower good
level of proficiency: 60% to 80%.
= 30 x 60%
= 30 x 0.6
= 18 minutes
( )
= 18 + 10% (18)
= 18 + 1.8
= 19.8 minutes
For go and back = 2 x 19.8
= 39.6 minutes
The lowest rating for the use of this type of equipment and manpower sufficient
proficiency: 110% to 120%.
= 30 x 110%
= 30 x 1.1
= 33 minutes
( )
= 33 + 10% (33)
= 33 + 3.3
= 36.3 minutes
For go and back = 2 x 36.8
= 72.6 minutes

94
For 100 meter distance from Machine shop (4) to slipways no 13, Standard
time for transportation time 20 minutes are as following:
The highest rating for the use of this type of equipment and manpower good
level of proficiency: 60% to 80%.
= 20 x 60%
= 20 x 0.6
= 12 minutes
( )
= 12 + 10% (12)
= 12 + 1.2
= 13.2 minutes
For go and back = 2 x 13.2
= 26.4 minutes
The lowest rating for the use of this type of equipment and manpower sufficient
proficiency: 110% to 120%.
= 20 x 110%
= 20 x 1.1
= 22 minutes
( )
= 22 + 10% (22)
= 22 + 2.2
= 24.2 minutes
For go and back = 2 x 24.2
= 48.4 minutes

95
For 70 meter distance from Machine shop (4) to slipways no 7-12, Standard
time for transportation time 15 minutes are as following:
The highest rating for the use of this type of equipment and manpower good
level of proficiency: 60% to 80%.
= 15 x 60%
= 15 x 0.6
= 9 minutes
( )
= 9 + 10% (9)
= 9 + 0.9
= 9.9 minutes
For go and back = 2 x 9.9
= 19.8 minutes
The lowest rating for the use of this type of equipment and manpower sufficient
proficiency: 110% to 120%.
= 15 x 110%
= 15 x 1.1
= 16.5 minutes
( )
= 16.5 + 10% (16.5)
= 16.5 + 1.65
= 18.15 minutes
For go and back = 2 x 18.15
= 36.3 minutes

96
For 95 meter distance from Machine shop (4) to dry dock, Standard time for
transportation time 18 minutes are as following:
The highest rating for the use of this type of equipment and manpower good
level of proficiency: 60% to 80%.
= 18 x 60%
= 18 x 0.6
= 10.8 minutes
( )
= 10.8 + 10% (10.8)
= 10.8 + 1.08
= 11.88 minutes
For go and back = 2 x 11.88
= 23.76 minutes
The lowest rating for the use of this type of equipment and manpower sufficient
proficiency: 110% to 120%.
= 18 x 110%
= 18 x 1.1
= 19.8 minutes
( )
= 19.8 + 10% (19.8)
= 19.8 + 1.98
= 21.78 minutes
For go and back = 2 x 21.78
= 43.56 minutes

97
For 130 meter distance Machine shop (4) to slipways no 1 - 3, Standard time
for transportation time 25 minutes are as following:
The highest rating for the use of this type of equipment and manpower good
level of proficiency: 60% to 80%.
= 25 x 60%
= 25 x 0.6
= 15 minutes
( )
= 15 + 10% (15)
= 15 + 1.5
= 16.5 minutes
For go and back = 2 x 16.5
= 33 minutes
The lowest rating for the use of this type of equipment and manpower sufficient
proficiency: 110% to 120%.
= 25 x 110%
= 25 x 1.1
= 27.5 minutes
( )
= 27.5 + 10% (27.5)
= 27.5 + 2.75
= 30.25 minutes
For go and back = 2 x 30.25
= 60.5 minutes

98
For 130 meter distance from Pipe and boiler shop (12) to slipways no 14,
Standard time for transportation time 25 minutes are as following:
The highest rating for the use of this type of equipment and manpower good
level of proficiency: 60% to 80%.
= 25 x 60%
= 25 x 0.6
= 15 minutes
( )
= 15 + 10% (15)
= 15 + 1.5
= 16.5 minutes
For go and back = 2 x 16.5
= 33 minutes
The lowest rating for the use of this type of equipment and manpower sufficient
proficiency: 110% to 120%.
= 25 x 110%
= 25 x 1.1
= 27.5 minutes
( )
= 27.5 + 10% (27.5)
= 27.5 + 2.75
= 30.25 minutes
For go and back = 2 x 30.25
= 60.5 minutes

99
For 80 meter distance from Pipe and boiler shop (12) to slipways no 13,
Standard time for transportation time 16 minutes are as following:
The highest rating for the use of this type of equipment and manpower good
level of proficiency: 60% to 80%.
= 16 x 60%
= 16 x 0.6
= 9.6 minutes
( )
= 9.6 + 10% (9.6)
= 9.6 + 0.96
= 10.56 minutes
For go and back = 2 x 10.56
= 21.12 minutes
The lowest rating for the use of this type of equipment and manpower sufficient
proficiency: 110% to 120%.
= 16 x 110%
= 16 x 1.1
= 17.6 minutes
( )
= 17.6 + 10% (17.6)
= 17.6 + 1.76
= 19.36 minutes
For go and back = 2 x 19.36
= 38.72 minutes
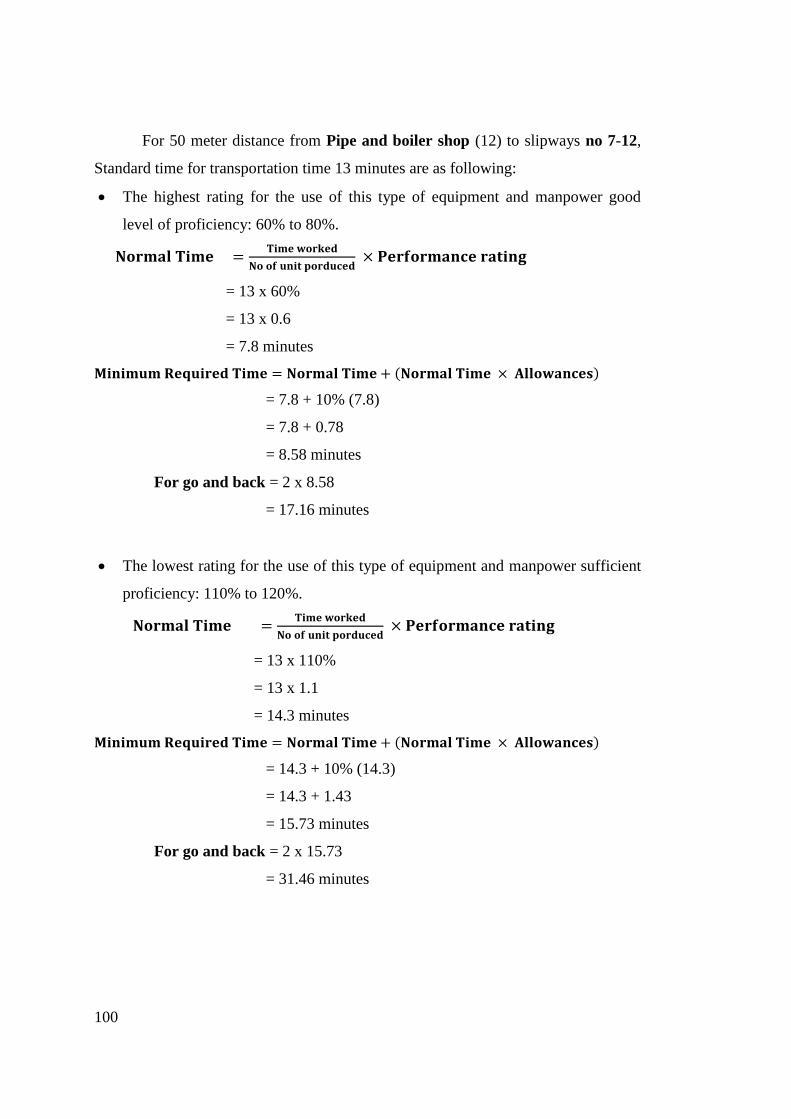
100
For 50 meter distance from Pipe and boiler shop (12) to slipways no 7-12,
Standard time for transportation time 13 minutes are as following:
The highest rating for the use of this type of equipment and manpower good
level of proficiency: 60% to 80%.
= 13 x 60%
= 13 x 0.6
= 7.8 minutes
( )
= 7.8 + 10% (7.8)
= 7.8 + 0.78
= 8.58 minutes
For go and back = 2 x 8.58
= 17.16 minutes
The lowest rating for the use of this type of equipment and manpower sufficient
proficiency: 110% to 120%.
= 13 x 110%
= 13 x 1.1
= 14.3 minutes
( )
= 14.3 + 10% (14.3)
= 14.3 + 1.43
= 15.73 minutes
For go and back = 2 x 15.73
= 31.46 minutes

101
For 75 meter distance from Pipe and boiler shop (12) to dry dock, Standard
time for transportation time 15 minutes are as following:
The highest rating for the use of this type of equipment and manpower good
level of proficiency: 60% to 80%.
= 15 x 60%
= 15 x 0.6
= 9 minutes
( )
= 9 + 10% (9)
= 9 + 0.9
= 9.9 minutes
For go and back = 2 x 9.9
= 19.8 minutes
The lowest rating for the use of this type of equipment and manpower sufficient
proficiency: 110% to 120%.
= 15 x 110%
= 15 x 1.1
= 16.5 minutes
( )
= 16.5 + 10% (16.5)
= 16.5 + 1.65
= 18.15 minutes
For go and back = 2 x 18.15
= 36.3 minutes

102
For 110 meter distance from Pipe and boiler shop (12) to slipways no 1-3,
Standard time for transportation time 23 minutes are as following:
The highest rating for the use of this type of equipment and manpower good
level of proficiency: 60% to 80%.
= 23 x 60%
= 23 x 0.6
= 13.8 minutes
( )
= 13.8 + 10% (13.8)
= 13.8 + 1.38
= 15.18 minutes
For go and back = 2 x 15.18
= 30.36 minutes
The lowest rating for the use of this type of equipment and manpower sufficient
proficiency: 110% to 120%.
= 23 x 110%
= 23 x 1.1
= 25.3 minutes
( )
= 25.3 + 10% (25.3)
= 25.3 + 2.53
= 27.83 minutes
For go and back = 2 x 27.83
= 55.66 minutes
103
5.3 Improved Material Handling System
One of the definitions adopted way back by the American Materials Handling
Society is: Materials handling is the art and science involving the moving, packaging
and storing of substances in any form. Material handling as such is not a production
process and hence does not add to the value of the product. It also costs money;
therefore it should be eliminated or at least reduced as much as possible. However,
the important point in favors of materials handling is that it helps production.
Depending on the weight, volume and throughput of materials, mechanical handling
of materials may become unavoidable. In many cases, mechanical handling reduces
the cost of manual handling of materials, where such material handling is highly
desirable. All these facts indicate that the type and extent of use of materials handling
should be carefully designed to suit the application and which becomes cost effective
(Ray, 2008).
Material handling equipment has a very important role in the shipyard. There
are four categories of material handling equipment, namely, conveyor, cranes and
hoists, industrial vehicle and container. There are all or almost them in modern
shipyard. But there are only a few parts of the equipment used in small shipyards to
perform various production processes (Manfaat, 1990).
The material handling equipment help the ship repair process good well. If
the alternative layout does not have a good material transfer, this layout is not good
for production. This shipyard has a plan with good material transfer. Advantages of
good material transfer are fall the rate of material damage by carrying material. It has
to increase the efficiency of material received and delivery. This shipyard can be
considered to get more support for material handling equipment. This shipyard has
three mobile cranes but one mobile crane is damaged and two mobile cranes cannot
use full efficiency. Therefore, this shipyard needs some material handling equipment.
They are one mobile crane with capacity 30 Ton and one forklift with capacity 10
Ton.

104
5.4 Capacity Improvement
The first and the second alternative layout have steel plate warehouse.
Therefore, material supply is enough stores for a year. The steel plate warehouse can
be stored 600 (6 m x 1.52 m x 16 mm) sheets. The materials for expected no of ship
repair are stored in warehouse plate for a year. Therefore, the docking time can be
reduced because there is no waste time for waiting material supply. The following
table 5.4 shows the list of plate for 2015.
Table 5.4 List of Plate for 2015 ship repair
No Plate Sheets Ton
1 5 mm x 6 m x 1.52 m 215 78.41
2 6 mm x 6 m x 1.52 m 624 272
3 8 mm x 6 m x 1.52 m 341 194.83
Total 1180 545.24
Source: Dalla shipyard
In addition, the first and second layouts have hydraulic shearing machine, a
forklift and a mobile crane. Therefore, the shipyard must be reduced the propane and
oxygen for cutting material because of shearing machine. The material transportation
and lifting can be done quickly because of a forklift and a mobile crane. The existing
forklift and crane is very old and capacity is very low. The requirements of material
handling equipment in Dalla shipyard become increase because the shipyard has a
plan to improve ship repair service. The following table 5.5 shows the capacity of
machine.
Table 5.5 Capacity of Machine, Crane and Forklift
No Name No of Item Capacity
1 Hydraulic Shearing Machine (8 mm x 3200 mm) 1 ≥ 8 / min
2 Mobile Crane 1 30 Ton
3 Forklift 1 10 Ton
The comparison of the existing, the first and the second alternative layout are
shown in the following table.

105
Table 5.6 Comparison for the Existing, the First alternative and the Second
alternative
No Item/ Facility Existing Layout First Alternative
Layout
Second Alternative
Layout
No Capacity No Capacity No Capacity
1 Warehouse - - 1 600 Plates 1 600 Plates
2 Mobile Crane 2 < 10 Ton 1 30 Ton 1 30 Ton
3 Forklift 2 < 4 Ton 1 10 Ton 1 10 Ton
4 Hydraulic Shearing
Machine
1 Not
Workable
1 ≥ 8 / min 1 ≥ 8 / min
5 Machine Shop 1 127.38
minutes
1 127.38
minutes
1 71.28
minutes
6 Pipe Shop 1 67.98
minutes
1 67.98
minutes
1 60.72
minutes
The shipyard has to improve material handling equipment because existing
equipment of capacity is very low. The existing layout and the first layout does not
change required time because machine shop and pipe shop does don’t change the
location. The second alternative layout changed the location of machine shop and
pipe shop to close the slipways for good flow of material. According to above the
table, the shipyard has to choose the second alternative layout because the second is
better productivity. According to calculation of the total required time compare with
the existing layout, the first alternative layout and the second alternative layout.
Transportation times of the first alternative layout for machine shop and pipe shop is
same as transportation times of the existing layout for which because the machine
shop and pipe shop in the first alternative layout is not re-located. Transportation
times of the second alternative for the machine shop and pipe shop is different as the
others layout because the machine shop and pipe shop is re-located. The
transportation time of the second alternative is the shortest of all. The following table
5.7 shows the difference of required time for the existing, the first alternative and the
second alternative.

106
Table 5.7 Minimum Required Time for the Existing, First and Second Layout
No Layout Total Distance Total Required Time
1 Existing Layout 2098 m 293.04 minutes
2 First Alternative Layout 1948 m 271.92 minutes
3 Second Alternative Layout 1540 m 208.56 minutes
The second alternative is the shortest others. The required time difference of
the first alternative is 21.12 minutes from the existing. After all additions and
renovations shipyard above, expected productivity to be achieved. The average
docking time is 33 days. Therefore, average docking time can be reduced 0.352
hours per day for each slipway.
For slipway 1 the average docking time = 33 day
Working hours per day = 8 hrs/day
For 33 day = 264 hrs
Therefore, it can be reduced 0.352 hours per day of transportation times
because to reduced docking time.
264 hrs -11.616 hrs = 252/8 days=31.5 days
Then, the number of ship repair K = F1.F2.TC/H
K = 0.8 x 0.8 x 300 (274)/31.5
K = 1670 DWT
K = 1670/ 140
K= 12 vessels
For slipway 3, the average docking time = 43
Working hours per day = 8 hrs/day
For 43 day = 344 hrs
Therefore, it can be reduced 0.352 hours per day of transportation times
because to reduced docking time.
344 hrs – 15.136 hrs = 328.864/8=41 days
Then, the number of ship repair K = F1.F2.TC/H
K = 0.8 x 0.8 x 300 (205)/41

107
K = 960 DWT
K = 960/ 57
K= 17 vessels
For slipways 4 (Dry dock) = 7 vessels
For Slipways 7, 12, the average docking time = 38
Working hours per day = 8 hrs/day
For 38 day = 304 hrs
Therefore, it can be reduced 0.352 hours per day of transportation times
because to reduced docking time.
304 hrs – 13.376 hrs =290.6/8= 36 days
Then, the number of ship repair K = F1.F2.TC/H
K = 0.8 x 0.8 x 300 (462)/36
K = 2464 DWT
K = 2464/ 200
K= 12 vessels
For slipway 13, the average docking time = 20
Working hours per day = 8 hrs/day
For 20 day = 160 hrs
Therefore, it can be reduced 0.352 hours per day of transportation times
because to reduced docking time.
160 hrs - 7 hrs = 153/8=19 days
Then, the number of ship repair K = F1.F2.TC/H
K = 0.8 x 0.8 x 300 (125)/19
K = 1263 DWT
K = 1263 / 120
K = 11 vessels
For slipway 14, the average docking time = 30
Working hours per day = 8 hrs/day

108
For 30 day = 240 hrs
Therefore, it can be reduced 0.352 hours per day of transportation times
because to reduced docking time.
240 hrs – 10.56 hrs =229/8= 29 days
Then, the number of ship repair K = F1.F2.TC/H
K = 0.8 x 0.8 x 300 (274)/29
K = 1814 DWT
K = 1814 / 140
K= 13 vessels
The total vessels of first alternative from average docking time (31 days) are
72 vessels. The required time difference is 84.48 minutes or 1.408 hrs for second
layout. Therefore, the second alternative supports to reduce docking time. After all
additions and renovations shipyard above, expected productivity to be achieved. The
average docking time is 33 days. Therefore, average docking time can be reduced for
each slipway.
For slipway 1 the average docking time = 33 day
Working hours per day = 8 hrs/day
For 33 day = 264 hrs
Therefore, it can be reduced 1.408 hours per day day of transportation times
because to reduced docking time.
264 hrs – 46.464 hrs =217.536/8= 27 days
Then, the number of ship repair K = F1.F2.TC/H
K = 0.8 x 0.8 x 300 (274)/27
K = 1948.4444 DWT
K = 1948.4444/ 140
K= 14 vessels
For slipway 3, the average docking time = 43
Working hours per day = 8 hrs/day
For 43 day = 344 hrs

109
Therefore, it can be reduced 1.408 hours per day because to reduced docking
time.
344 hrs – 44.72 hrs = 299.28/8 = 37 days
Then, the number of ship repair K = F1.F2.TC/H
K = 0.8 x 0.8 x 300 (205)/37
K = 1063.7837 DWT
K = 1063.7837/ 57
K= 19 vessels
For slipways 4 (Dry dock) = 8 vessels
For Slipways 7, 12, the average docking time = 38
Working hours per day = 8 hrs/day
For 38 day = 304 hrs
Therefore, it can be reduced 1.408 hours per day because to reduced docking
time.
304 hrs – 53.504 hrs = 250.496/8=31 days
Then, the number of ship repair K = F1.F2.TC/H
K = 0.8 x 0.8 x 300 (462)/31
K = 2861.4194DWT
K = 2861.4194/ 200
K= 14 vessels
For slipway 13, the average docking time = 20
Working hours per day = 8 hrs/day
For 20 day = 160 hrs
Therefore, it can be reduced 1.408 hours per day because to reduced docking
time.
160 hrs – 28.16 hrs = 131.84/8=16 days
Then, the number of ship repair K = F1.F2.TC/H
K = 0.8 x 0.8 x 300 (125)/16
K = 1500 DWT

110
K = 1500 / 120
K = 13 vessels
For slipway 14, the average docking time = 30
Working hours per day = 8 hrs/day
For 30 day = 240 hrs
Therefore, it can be reduced 1.408 hours per day because to reduced docking
time.
240 hrs – 42.24 hrs = 197.76/8=25 days
Then, the number of ship repair K = F1.F2.TC/H
K = 0.8 x 0.8 x 300 (274)/25
K = 2104.32 DWT
K = 2104.32 / 140
K= 15 vessels
The total vessels of the existing from average docking time (33 days) are 70
vessels. The total vessels of the second layout from average docking time (27 days)
are 83 vessels. The forecast vessel is 58 vessels based on forecast calculation. To
improve productivity the ship repair must work overtime above calculation. The rate
of growth docking ship repair and maintenance is 70 /58 = 1.2 times. When
compared with the result of docking (27 days), the rate of growth docking ship repair
and maintenance is 83/58= 1.43 times. The forecast vessel 58 is the next year target
vessel number. After reducing the docking times from 33 to 27, the rate of growth
docking ship repair and maintenance is from 1.2 times to 1.43 times. The following
table shows the ship repair number for the existing, the first and the second layout.
Table 5.8 Ship Repair for the existing, the First and the Second layouts
No Layout Number of vessels Rate of Docking
1 Existing layout 70 vessels 1.2 times
2 First Alternative layout 72 vessels 1.24 times
3 Second Alternative layout 83 vessels 1.43 times

111
5.5 Investment Calculations for Shipyard Layout
For fist alternative layout, this layout adds renovation of buildings
procurement of equipment and supporting facilities. Therefore, the expense budget
recapitulation lists are as follows:
Table 5.9 List of Facilities and Equipment for First Alternative Layout
No Shipyard Facilities Cost (Kyats)
1 Renovation cost for Machine shop 30 million
2 Renovation cost for Zone 5 30 million
3 Building cost for Warehouse plate 90 million
4 Renovation cost for Carpenter shop 20 million
5 Renovation cost for Pipe and boiler shop 20 million
6 Renovation cost for slipway no 1 and 14 30 million
No Material Handling Equipment
1 Forklift Truck (10 Ton) 66 million
2 Mobile Crane (30 Ton) 121 million
No Machine
1 Hydraulic Shearing Machine 21.411 million
Total 440.311 million
For second alternative layout, this layout adds renovation of buildings
procurement of equipment and supporting facilities. Therefore, the expense budget
recapitulation lists are as follows:
Table 5.10 List of Facilities and Equipment for Second Alternative Layout
No Shipyard Facilities Cost (Kyats)
1 Building cost for Machine shop 90 million
2 Building cost for Pipe and boiler shop 90 million
3 Renovation cost for Warehouse plate 30 million
4 Renovation cost for Carpenter shop 20 million
5 Renovation cost for Zone 5 30 million
6 Renovation cost for slipways no 1 and 14 30 million
No Material Handling Equipment
1 Forklift Truck (10 Ton) 66 million

112
2 Mobile Crane (30 Ton) 121 million
No Machine
1 Hydraulic Shearing Machine 21.411 million
Total 548.9 million
The cost is calculated based on Myanmar Kyat Unit and current market price.
Money changer price is based on Central Bank of Myanmar for changing US dollar
to Myanmar Kyat Unit. One US dollar is equal 1170 kyats. Shipyard need above
facilities, equipment and machine for increasing ship repair process.
5.6 Evaluation for Layout and Facilities of Shipyard from Economic Aspect
Economic feasibility helps shipyard assess the viability, cost, and benefits
associated with projects before financial resources are allocated. It helps decision to
determine the positive economic benefits to the organization that the proposed layout
will provide, and helps quantify the problem. For fist alternative layout, the initial
investment of shipyard is Myanmar Kyat K 440.311 million. Shipyard applies 50%
(discount rate 12%) of investment for loan from bank and 50% (discount rate 14%)
of investment is its capital money. The table 5.11 shows calculation of discounted
Cash Flow (DCF) and Net Present Value (NPF) for first alternative layout. The
average cost for ship repair is K 5 million per ship. First year forecast ship is 58.
Therefore, first year revenue is 290 million.
After calculation of Discounted Cash Flow (DCF), the results show the
payback period and benefit cost ratio. The payback period is 2018 and benefit/cost
ratio is 1.19. The benefit/cost ratio is greater than 1. Therefore, the layout is
advantageous for shipyard. The following table 5.12 show Payback period, Net
Present Value and Cumulative Present Value. Positive cumulative present value is K.
83,516,000. The feasibility of the proposed layout generated economic benefits.

113
Tab
le 5
.11 C
alcu
lati
on o
f D
isco
unte
d C
ash F
low
(D
CF
) fo
r F
irst
Alt
ernat
ive
Lay
out

114
Table 5.12 First Alternative Results for Payback Period, Present Value and
Cumulative Present Value
Year Cash Flow Present Value Cumulative Present Value
440,311,000
2016 198,686,250 177,398,438 -227,432,875
2017 202,111,875 161,689,500 -101,223,063
2018 208,963,125 149,259,375 48,036,313
2019 212,388,750 135,279,459 183,315,771
2020 215,814,375 122,621,804 305,937,575
For second alternative layout, the initial investment of shipyard is Myanmar
Kyat K. 548.99 million. Shipyard applies 50% (discount rate 12%) of investment for
loan from bank and 50% (discount rate 14%) of investment is its capital money. The
table 5.13 shows calculation of discounted Cash Flow (DCF) and Net Present Value
(NPF) for first alternative layout. The average cost for ship repair is K 5 million per
ship. First year forecast ship is 58. Therefore, first year revenue is 290 million.
After calculation of Discounted Cash Flow (DCF), the results show the
payback period and benefit cost ratio. The payback period is 2019 and benefit/cost
ratio is 1.13. The benefit/cost ratio is greater than 1. Therefore, the layout is
advantageous for shipyard. The following table 5.14 show Payback period, Net
Present Value and Cumulative Present Value. Positive cumulative present value is K.
74,726,771. The feasibility of the proposed layout generated economic benefits.

115
Tab
le 5
.13
Cal
cula
tion o
f D
isco
unte
d C
ash F
low
(D
CF
) fo
r S
econd A
lter
nat
ive
Lay
out

116
Table 5.14 Second Alternative Results for Payback Period, Present Value and
Cumulative Present Value
Year Cash Flow Present Value Cumulative Present Value
548,900,000
2016 198,686,250 177,398,438 -371,501,563
2017 202,111,875 161,689,500 -209,812,063
2018 208,963,125 149,259,375 -60,552,688
2019 212,388,750 135,279,459 74,726,771
2020 215,814,375 122,621,804 197,348,575
5.7 Evaluation for Layout and Facilities of Shipyard from Technical Terms
The technical feasibility assessment is centered on the technical resources
available to the organization. It helps organizations assess if the technical resources
meet capacity and whether the technical team is capable of converting the ideas into
working systems. Technical feasibility also involves evaluation of the hardware and
the software requirements of the proposed system
For fist alternative layout, a simple technical aspect include workmanship
factor. Ship repair processes include technical aspect that is labor, raw materials,
equipment, road and environmental factors. The technical aspect is very influential in
the smooth process of ship repair, for labor amounted to 51 people are still feasible
because they meet the standards of small shipyard (50-150 workers) (Schlott, 1985),
and raw material get from local. Propane, oxygen and wood get from local market.
Steel plate and angle iron rock can be purchased in local market. Yangon region is
economic area and development area of Myanmar. Therefore, shipyard gets all
material from local market. For material handling equipment can be ordered through
the sales agents of engineering tools in Yangon. Environmental factor can see due to
the land of shipyard is 32.3 %. Therefore, the remaining 67.7% is to the preservation
and further development environments. The shipyard increase ship repair process due
to fill facilities and equipment for forecast ship repair.

117
The first alternative layout does not change layout of building and equipment
but it fill additional features such as warehouse plate and renovation building. This
layout refers to current layout but all of the criteria or factors above are seen.
For second alternative layout, a simple technical aspect include workmanship
factor. Ship repair processes include technical aspect that is labor, raw materials,
equipment, road and environmental factors. The technical aspect is very influential in
the smooth process of ship repair, for labor amounted to 51 people are still feasible
because they meet the standards of small shipyard (50-150 workers) (Schlott, 1985),
and raw material get from local. Propane, oxygen and wood get from local market.
Steel plate and angle iron rock can be purchased in local market. Yangon region is
economic area and development area of Myanmar. Therefore, shipyard gets all
material from local market. For material handling equipment can be ordered through
the sales agents of engineering tools in Yangon. Environmental factor can see due to
the land of shipyard is 32.4 %. Therefore, the remaining 67.6% is to the preservation
and further development environments. The shipyard increase ship repair process due
to fill facilities and equipment for forecast ship repair.
The second alternative layout change layout of building and equipment but it
fills additional features such as warehouse plate and renovation building. Machine
shop move to close the slipways and to reduce transportation time. Machine shop is
close Zone 5 and Pipe and boiler shop. Therefore, second alternative layout is
different from fist alternative layout. All of the criteria or factors above are seen.
Company operates with the expectations set goals and objectives will be achieved.
5.8 Layout Selection from Alternatives
Before selecting the chosen alternative we need to know in advance
Understanding the layout and the benefits of a good layout, is the layout according to
Taylor (1995) is the layout of the entire facility owned by the company, where this
arrangement includes the determination of the location of any existing department,
layout engines (workstation), the location of the warehouse, hallway (corridor) and
the whole a good working environment which shells are used or will be proposed.
The layout of all elements of this facility needs to be done to ensure that the flow of

118
work, raw material, or information worker walking / running smoothly in production
systems.
There are several benefits to be obtained by the company, if the facility is
owned already arranged with well, among others:
1. Material handling raw materials are minimal
2. Efficient use of space
3. Efficient use of labor
4. Eliminating congestion for the flow of materials.
5. Facilitate communication and interaction between workers and
supervisors and workforce and customers.
6. Reducing the time required in the manufacturing process or to serve
consumers.
7. Eliminate damage or excessive movements.
8. Facilitating the entry, exit and replacement of raw materials, product
or person.
9. Ensuring the safety and security.
10. Giving priority to quality products and services.
11. Make it easy to carry out proper maintenance activities.
12. Will enable to control the operations or activities visually.
13. Providing the flexibility to adapt to environmental changes.
Policy formulation company-owned facilities are basically depends on the
process to be used and depending on the characteristics of products to be produced.
It is usually tailored to the demand and the level of competition going on.
Thus the choice of a layout will affect the election process, the volume and diversity
of products, the level of interaction and components, the amount and type of
equipment and the level of automation. The rules apply to employees, the vast space
available, the stability of the existing system, and the purpose of the system.
Before choosing between two alternatives above need to know the power
ratings between the two are as follows:
For fist alternative layout, strength of the first alternative must be considered
is that does not many changes to the layout of the existing shipyard when compared

119
to the second alternative. The layout of the first alternative is based on the layout of
the shipyard original, only a few additional facilities, and the investment cost is not
too high.
Weakness of this first alternative layout is not arranged properly. Warehouses
plate and machine shop placed at the entrance of the shipyard and the distance
between the workshops is still far apart.
For second alternative layout, strength of second alternative layout is
prepared properly. Machine shop is located close to the zone 5 and pipe and boiler
shop.
Weakness of second alternative is high investment cost than fist alternative
layout.
Furthermore, we will take the decision to choose the best solution or selected
based on the layout of the shipyard and evaluation based with technical and
economic aspects. These two alternatives will have one of the best. According to the
best results of the two alternatives above, we choose the second alternative. The
second alternative layout is good organized. The flow of material is good than the
first alternative. Therefore, second alternative layout is eliminating damage or
excessive movements. According to calculations by the method of Discount Cash
Flow (DCF) and Net Present Value (NPV) with system payback period, the second
alternative is also feasible for Dalla shipyard project.
Criteria for the selection layout also refer to the Flow of Materials, using a
new material handling equipment, material handling existing at this time. By
determining the standard work time and standard time, the rating time taken by the
level of skill that is used 60% to 80% (the highest rating for the use of this type of
equipment and manpower good skill level). The following tables show required time
difference and total track difference.
Table 5.15 Comparison of Required Time at Rate of Speed 60% to 80%
No Layout Total Distance Total Required Time
1 Existing Layout 2098 m 293.04 minutes
2 First Alternative Layout 1948 m 271.92 minutes
3 Second Alternative Layout 1540 m 208.56 minutes

120
Table 5.16 Comparison of Required Time at Rate of Speed 110% to 120%
No Layout Total Distance Total Required Time
1 Existing Layout 2098 m 537.24 minutes
2 First Alternative Layout 1948 m 498.52 minutes
3 Second Alternative Layout 1540 m 382.36 minutes
The revenue is the same amount for the first and the second alternative
layouts. The revenue is based on ship repair forecasting for (2016-2020). But the cost
is different for the first and the second alternative layouts. The first alternative layout
is lower than the second alternative because second alternative layout has new
building for machine shop and piping shop. But the first and the second alternatives
are economically feasible because the shipyard got payback period in the project
time (2016-2020). According to economic and technical considerations, both layouts
are economically feasible, better flow of material and higher capacity of ship repair,
compared to those in the existing one. The first alternative is economically feasible
but the number of ship repair is lower than the number of ship repair of the second
alternative. The total number of vessels repair for the first layout is 77 vessels, while
the total number of vessels repair for the second layout is 89 vessels. Therefore, the
second alternative is the best alternative in terms of economically feasible, good flow
of material and perfect of technical term and the most number of ship repairs.
Therefore, we choose the second alternative layout.
According to the above results, the shipyard needs to apply the second
alternative layout for of shipyard capacity improvement. Therefore, the shipyard
should allocate some financial investment to re-locate the machine shop and pipe
shop, as well as a new buy the material handling equipment. For initial investment,
the shipyard should be loaned 50 percent of initial investment from the government’s
bank. The 50 percent of initial investment is its capital money. The material handling
equipment should be imported directly from foreign because tax is free for state
owned enterprise.
121
This research focuses on ship repair and maintenance of Dalla shipyard in
Yangon region. This research developed Dalla shipyard to improve total number of
ship repair, the material handling equipment and facilities. The situations of the
shipyard were calculated based on actual data from Dalla shipyard. However, we
don’t know future market volume and all of machine equipment actual capacity. This
research use simple calculation. Further research can consider details about the
planning layout and equipment at the workshops, it is necessary to further study.

122
“This page intentionally left blank”
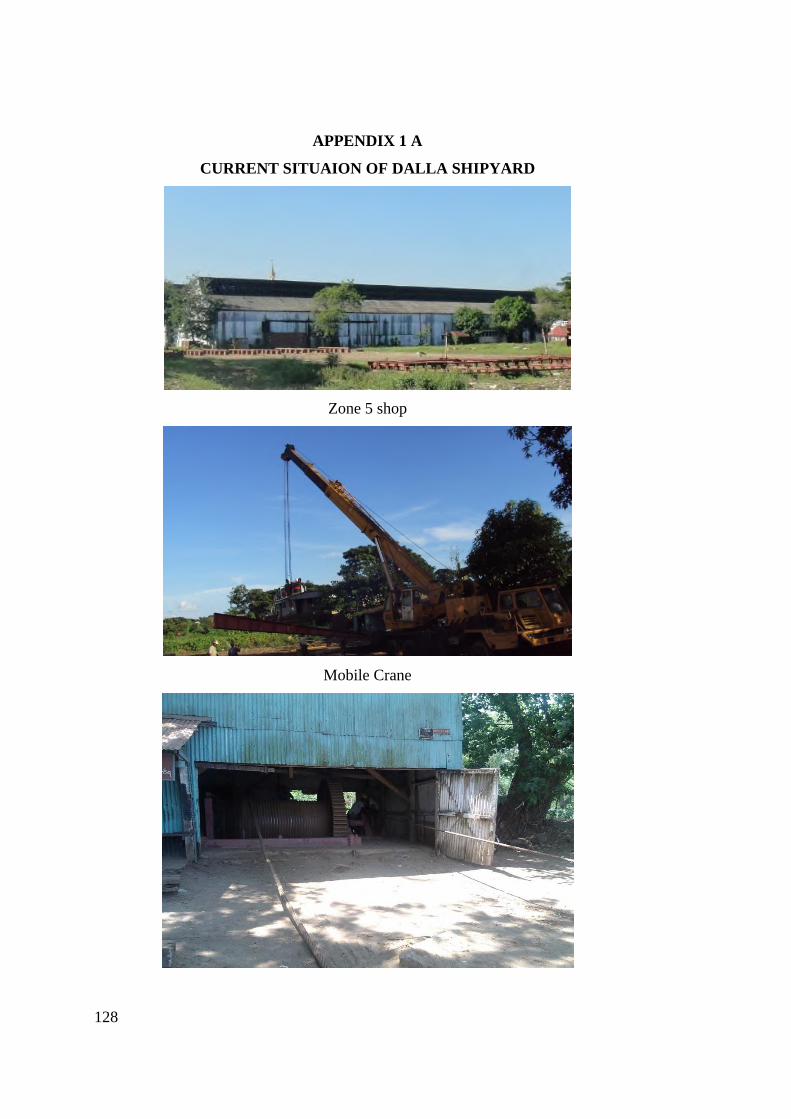
128
APPENDIX 1 A
CURRENT SITUAION OF DALLA SHIPYARD
Zone 5 shop
Mobile Crane

129
Winch
Steel Plate
No.1 Slipway
Dry Dock

130
No 14 Slipway
15 Ton Jetty
CNC Shop

131
APPENDIX 1 B

132

123
CHAPTER 6
CONCLUSION AND SUGGESTION
6.1 CONCLUSION
Based on the problems, objectives and discussion of the problem will be able
to be concluded as follows:
1. Total weight score of IFE is 2.73 above 2.5 indicated that the company has a
strong internal position. Total weight score of EFE is 2.59 above 2.5
indicated that the company has a high response to its external business
environment. According to IFE and EFE, the shipyard faces strong business
position in the market.
2. The first alternative layout have new steel plate warehouse, renovation for
machine shop, carpenter shop, Zone 5 shop, pipe and boiler shop and
slipways repair. The second alternative layout have new steel plate
warehouse, new machine shop, new pipe and boiler shop, renovation for
carpenter shop, zone 5 shop and slipways repair.
3. The first and the second alternative layout have the same material handling
equipment and facilities. The additional facilities and equipment for the first
and the second alternative are a mobile crane, a forklift and hydraulic
shearing machine. But the layout of the first alternative is the different layout
of the second alternative. Therefore, the first alternative for (31 days) is 72
vessels and the second alternative for (27 days) is 83 vessels. The rate of
growth docking ship repair and maintenance is 1.43 times. After reducing the
docking times from 33 days to 27 days, the rate of growth docking ship repair
and maintenance is from 1.2 times to 1.43 times.
4. Ship repair forecasting based on actual data is the future ship repair capacity.
5. Re-layout is one of the best methods in the shipbuilding industry through re-
alignment shipbuilding, renovations, additions material handling equipment.
6. Based on the feasibility study using the Discount Cash Flow, NPV (Net
present Value) with system payback period where the proportion of loans
with 50% (interest rate of 12%) and its own capital of 50% (interest rate of

124
14%), and an investment of K 440.311 million for the layout of alternative
first, from results of calculations using the investment costs shows project
viable and feasible, due to the return of capital contained in 3rd
year.
7. Based on the feasibility study using Discount Cash Flow NPV (Net Present
Value) with System Payback Period in which the proportion of loans with
50% (interest rate of 12%), and its own capital of 50% (14% interest), and an
investment of K 548.9 million for the layout alternative second, then the
result of the calculation using the cost of these investments project viable and
feasible, due to the return of capital are in 4th
year.
6.2 SUGGESTION
To achieve maximum results of improvement capacity of Dalla shipyard, the
some following consider:
1. Re-layout shipyard need to be applied detail above analyzed.
2. Dalla shipyard need to change private organization.
3. To view details about the planning layout and equipment at the workshops, it
is necessary to further study.

125
REFERENCES
Andjar Soeharto and Soejitno, (1996). ―Shipyard‖, Publisher Faculty of Marine
Technology ITS, Surabaya.
Arif, Mohammad Sholikan, (2014). Productivity Analysis of State and Non State
Owned Shipbuilding with Multifactor Productivity Measurement, Faculty of
Marine Technology ITS, Surabaya.
Celik, Metin, (2009). Fuzzy Axiomatic Design-based Performance Evaluation
Model for Docking Facilities in Shipbuilding Industry: The Case of Turkish
Shipyards, Applications 36:599–615.
Chabane, Hamid (2004). Design Of Small Shipyard Facility Layout Optimized For
Production and Repair, Symposium International, Qualima01-Tlemcen.
Chaiwat, P (2012). Economic Feasibility Evaluation of Government Investment
Project by Using Cost Benefit Analysis: A Case Study of Domestic Port Port
A), Laem-Chabang Port, Chonburi Province. Available online at
www.sciencedirect.com
Chiang, C Y (2014). An empirically-simulated investigation of the impact of demand
forecasting on the bullwhip effect: Evidence from U.S. auto industry,
www.sciencedirect.com.
Dana, B, G. (2012) SWOT analysis to improve quality management production,
www.sciencedirect.com. Social and Behavioral Sciences 62 ( 2012 ) 319 – 324.
David, F (2015). Strategic Management Concepts and Cases, Fifteenth edition,
http://www.pearsonmylabandmastering.com
DMA (Department of Marine Administration) 2014, Current Status on Safe
Regulation of River Transport and Challenges in Myanmar, Seminar for
Promoting River Water Transport in Myanmar.
Heger, Robert (2005). Dock master Training Manual, Preparation of a Pumping Plan
, Heger Dry Dock, Inc.@ June.

126
Ikhsan, Muhammad (2015). A Study Rationalization of Shipyard in Riau Province,
Thesis,Faculty of Marine Technology ITS, Surabaya.
Ilela, Daud (2010). Rationalization of Small Fish Shipyard in Maluku Province,
Faculty of Marine Technology ITS, Surabaya.
IWT (Inland Water Transport), 2015.
Available Source: http://www.iwt.gov.mm/en/services-inland-water-
Transport-iwt
Manfaat, Djauhar (1990). Material Handling Equipment Study in Small Shipyard,
MSc Thesis Department of Ship and Marine Technology University of
Strathclyde, Glasgow.
Ma’ruf, Buana (2006). Environmental-Based Strategic Management Model for
Indonesia’s Medium-Sized Shipyards, Published in The Journal of Ship
Production, Vol. 22, No. 4, November.
Novizhilova, N. (2010) Use of SWOT Analysis for Insurer Risk Manger‖, the 10th
International Conference ―Reliability and Statistics in Transportation and
Communication.
Rafiy, Muhammad (2015). Study of Improvement Fishermen Welfare Through
Improved Productivity And Model Development In The Costal North Konawa,
The International Journal of Engineering And Science (IJES), Vol 4, Issue 12:
62-67.
Ray, Siddhartha (2008). Introduction to Material Handling, National institute of
Technical Teachers’ Training and Research.
Schlott, H.W (1984). Plant Layout Equipment for Shipyard, Faculty of Marine
Technology ITS, Surabaya.
Sople, V.V (2007). Material Handling Equipment: Exploiting Productivity Potential
in Supply Chain, Article published in SEARCH, Vol 10, No.10, and October.
Sukanto, 1986, Production Management, Publisher BPFE, Yogyakarta.
Sundaravadivelu,R (2000). Design of Slipways Facility for Repair and Maintenance
of Port Crafts, 4th
international conference on coasts, ports & marine structure.
Storch, R.L (1995). Ship Production. The Society Naval Architects and Marine
Engineers.

127
Shenoi, R. A (2007), Ship Production Technology, School of Engineering Sciences,
University of Southampton, UK.
Taylor, F.W (1995). Production and Operation Management. Sri Joko,
Muhammadiyah University, Malang.
Than, C (2009). Myanmar Shipbuilding, Naval Architects and Marine Engineers.
https://spruz.academia.edu/CharlieThan.

133
AUTHOR BIOGRAPHY
Aung Ye Kyaw was born on April 21, 1985 in Mandalay
City, Mandalay Region, Myanmar. He got Bachelor of
Engineering Degree Mechanical from Kyaukse
Technological University; Myanmar in 2006. He was an
assistant engineer in Dalla shipyard, Inland Water
Transport, Ministry of Transport and Communications,
from 2008 to 2015. And then he worked in Department of
Marine Administration, Ministry of Transport and Communications. Currently, He
is concluding his master program in Marine Engineering, majoring in Marine
Production and Material Engineering at Sepuluh Nopember Institute of Technology,
Surabaya, Indonesia.